Embed Size (px)
Citation preview

3380
J. Dairy Sci. 99:3380–3395http://dx.doi.org/10.3168/jds.2015-10449© 2016, THE AUTHORS. Published by FASS and Elsevier Inc. on behalf of the American Dairy Science Association®. This is an open access article under the CC BY-NC-ND license (http://creativecommons.org/licenses/by-nc-nd/3.0/).
ABSTRACT
The modeling of dairy processing using a generic process simulator suffers from shortcomings, given that many simulators do not contain milk components in their component libraries. Recently, pseudo-milk components for a commercial process simulator were proposed for simulation and the current work extends this pseudo-milk concept by studying the effect of both total milk solids and temperature on key physical prop-erties such as thermal conductivity, density, viscosity, and heat capacity. This paper also uses expanded fluid and power law models to predict milk viscosity over the temperature range from 4 to 75°C and develops a succinct regressed model for heat capacity as a func-tion of temperature and fat composition. The pseudo-milk was validated by comparing the simulated and actual values of the physical properties of milk. The milk thermal conductivity, density, viscosity, and heat capacity showed differences of less than 2, 4, 3, and 1.5%, respectively, between the simulated results and actual values. This work extends the capabilities of the previously proposed pseudo-milk and of a process simulator to model dairy processes, processing different types of milk (e.g., whole milk, skim milk, and con-centrated milk) with different intrinsic compositions, and to predict correct material and energy balances for dairy processes.Key words: process simulation, milk processing, thermal conductivity, viscosity, heat capacity
INTRODUCTION
Modeling and simulation of industrial processes are useful to predict process behavior and critical for deci-sion making and optimization without putting the real
process at risk. Process simulation significantly contrib-utes to analyzing process operation, performance, and process or product variable trends with reasonably ac-ceptable accuracies (Munir et al., 2012b). Commercial process simulators (such as VMGSim; Virtual Materials Group Inc., Calgary, AB, Canada) are usually preferred over self-developed numerical modeling tools because commercial simulators typically include substantial component libraries, advanced computational methods, comprehensive thermodynamic packages, user-friendly graphical user interfaces (GUI), process flow sheet vi-sualization, and pre-made major unit operations. The simulators have also been validated over many years with large critical user bases (Munir et al., 2013).
Although common in many processing industries, the simulation of dairy processing using commercial pro-cess simulators has lagged behind largely because the historical market for most process simulators is chemi-cal or petrochemical applications (Arthur et al., 2014). Other reasons for the slow uptake of process simulation in the dairy industry include the fact that milk is a com-plex food structure with complex irreversible property changes, multiple phases, and, most importantly, the nonavailability of dairy components in the component libraries of process simulator (Wang and Hirai, 2011; Trystram, 2012; Tajammal Munir et al., 2015). This paper aims to rectify this omission by showing how milk can be considered a mixture of known compounds such that the thermodynamic package of the process simulator can estimate the key physical properties of milk under a variety of processing conditions.
Dairy processing modeling case studies are rare. To-masula et al. (2013) used SuperPro Designer (Intelligen Inc., Scotch Plains, NJ) to develop a simulation tool for the fluid milk industry, whereas Abakarov and Nuñez (2012) discussed the available food engineering software without actually considering modern process simulator capabilities. Bon et al. (2010) presented the use and capabilities of ProSimPlus (Philadelphia, PA) for milk pasteurization process modeling, and Madoumier et al. (2015) proposed a new modeling approach for liquid foods in a process simulator.
Virtual milk for modelling and simulation of dairy processesM. T. Munir,1 Y. Zhang, W. Yu, D. I. Wilson, and B. R. YoungChemical and Materials Engineering Department, Industrial Information and Control Centre (I2C2), The University of Auckland, New Zealand 1023
Received September 26, 2015.Accepted January 21, 2016.1 Corresponding author: [email protected]

Journal of Dairy Science Vol. 99 No. 5, 2016
VIRTUAL MILK FOR MODELING AND SIMULATION 3381
The key differences between Bon et al. (2010), Madoumier et al. (2015), and the present study are outlined in Table 1. In the present study, milk was con-sidered a “mixture” of water and pseudo-components. Madoumier et al. (2015) followed a similar approach. In contrast, Bon et al. (2010) considered milk as a single pseudo-component but this approach has some drawbacks. For example, such an approach has limited applications when the different components of milk are separated, such as in ultrafiltration, and it is not pos-sible to vary the total solids (TS) such as in powder processes. Finally, we cannot model the influence of different operating conditions on milk mixture com-ponents; for example, behavior of milk fat is different from that of milk proteins under the same operating conditions.
There are 2 major differences between Madoumier et al. (2015) and the present study, which are shown in Table 1. The first difference is that milk proteins were modeled differently in the current study and in Madoumier et al. (2015). Madoumier et al. (2015) ig-nored 20% (by weight) of the proteins; namely, whey proteins, and considered only casein proteins. How-ever, whey proteins are essential (e.g., for whey milk or “muscle milk”). The influence of heat treatment on both types of milk protein is also different because ca-sein proteins are stable to heat treatment whereas whey proteins are not. Consequently, milk heat treatment processes cannot be modeled without modeling both whey and casein proteins. Furthermore, the denatur-ation of both proteins is different. The second major difference is that the viscosity of milk with higher TS seems to be an unsolved issue due to non-Newtonian flow behavior in Madoumier et al. (2015). This flow behavior was modeled in the present study.
Process simulation of dairy processing using commer-cial process simulators involves several specific steps. Regardless of the type of problem and the objective of the simulation, the first basic step is selecting compo-nents or mixtures that will be involved in the simulation from the simulator’s component library (Luyben, 2002; Seborg et al., 2004; Munir et al., 2012a). Although milk is technically a colloidal suspension, process simulators use the term “mixture” or “pseudo-mixture” in this in-stance. The main components of milk are water, fats, proteins, lactose, and minerals, all compounds that are uncommon or unavailable in most commercial compo-nent libraries.
Primarily, 2 different modeling approaches for milk modeling have been attempted. Ribeiro and Andrade (2003) and Ribeiro and Caño Andrade (2002) used a unique component approach for milk modeling, whereas Zhang et al. (2015) and Tomasula et al. (2014) opted for a pseudo-milk component approach. The unique T
able
1. K
ey d
iffer
ence
s be
twee
n B
on e
t al
. (2
010)
, M
adou
mie
r et
al.
(201
5), an
d th
e pr
esen
t w
ork
Key
diff
eren
ce
Bon
et
al. (2
010)
M
adou
mie
r et
al.
(201
5)
Pre
sent
stu
dy
Milk
as
a ra
w m
ater
ial
Milk
was
con
side
red
as a
sin
gle
pseu
do-
com
pone
nt.
Milk
was
con
side
red
as a
milk
“m
ixtu
re”
follo
win
g m
etho
dolo
gy p
ropo
sed
in a
utho
rs’
prev
ious
wor
k (Z
hang
et
al.,
2015
).
Milk
was
con
side
red
as a
milk
“m
ixtu
re.”
App
licat
ions
Lim
ited
to
milk
pas
teur
izat
ion
proc
esse
s on
ly.
Seem
s ap
plic
able
to
mos
t da
iry
proc
esse
s ex
cept
milk
hea
t tr
eatm
ent.
App
licab
le t
o m
ost
of d
airy
pro
cess
es inc
ludi
ng
heat
tre
atm
ent
proc
esse
s.T
ypes
of m
ilkO
nly
who
le m
ilk w
as c
onsi
dere
d.W
hole
and
ski
m m
ilks
with
differ
ent
dry
mat
ter
wer
e co
nsid
ered
.D
iffer
ent
type
s of
milk
(e.
g., w
hole
, sk
im, an
d co
ncen
trat
ed)
wer
e co
nsid
ered
.In
fluen
ce o
f op
erat
ing
cond
itio
nsT
he inf
luen
ce o
f te
mpe
ratu
re a
lone
on
the
phy
sica
l pr
oper
ties
of m
ilk w
as
stud
ied.
The
inf
luen
ce o
f di
ffer
ent
oper
atin
g co
nditio
ns
on t
he p
hysi
cal pr
oper
ties
of m
ilk w
as s
tudi
ed.
The
inf
luen
ce o
f te
mpe
ratu
re a
nd d
iffer
ent
solid
co
ncen
trat
ions
on
the
phys
ical
pro
pert
ies
of m
ilk
was
stu
died
.W
hey
prot
eins
Whe
y pr
otei
ns w
ere
igno
red.
Whe
y pr
otei
ns w
ere
igno
red.
Whe
y pr
otei
ns w
ere
cons
ider
ed t
o ev
alua
te t
he
influ
ence
of he
at t
reat
men
t on
milk
pro
tein
s.V
isco
sity
The
vis
cosi
ty o
f m
ilk w
ith
high
er t
otal
so
lids
was
not
con
side
red.
The
vis
cosi
ty o
f m
ilk w
ith
high
er t
otal
sol
ids
seem
s an
uns
olve
d is
sue
due
to n
on-N
ewto
nian
flo
w b
ehav
ior.
Exp
ande
d flu
id a
nd p
ower
law
mod
els
wer
e us
ed t
o pr
edic
t no
n-N
ewto
nian
flo
w b
ehav
ior
of
conc
entr
ated
milk
vis
cosi
ty.
Hea
t ca
paci
tyT
he h
eat
capa
city
of m
ilk w
ith
high
er
tota
l so
lids
was
not
stu
died
.T
he h
eat
capa
city
of m
ilk w
ith
high
er fat
co
ncen
trat
ions
see
ms
an u
nsol
ved
prob
lem
.A
n ex
pres
sion
for
the
hea
t ca
paci
ty a
s a
func
tion
of te
mpe
ratu
re a
nd fat
con
tent
was
po
stul
ated
to
capt
ure
the
doub
le G
auss
ian
peak
s.

3382 MUNIR ET AL.
Journal of Dairy Science Vol. 99 No. 5, 2016
component milk modeling approach is simpler because the milk component properties are specified as constant or depending only on temperature. Such a modeling ap-proach can therefore only be used for situations where composition remains constant or for the simulation of heating or cooling of milk. On the other hand, in the pseudo-milk component approach, the milk compo-nents are divided into several pseudo-components: fat, proteins, lactose, and minerals. In this approach, the physical properties of individual pseudo-milk compo-nents are modeled and added to compute mixture (i.e., milk) properties. This modeling approach is preferred over the unique component approach because it can be used for unit operations in which composition changes.
The physical properties such as thermal conductivity, density, viscosity, and heat capacity are necessary to predict milk behavior. The physical properties of indi-vidual pseudo-milk components can be modeled either by utilizing literature models (e.g., Fernández-Martín, 1972b), or by artificially developing the physical prop-erties of individual pseudo-components (Cheng and Friis, 2007), or by assimilating the physical properties of individual pseudo-components to the properties of a representative component (Zhang et al., 2003, 2015). The literature models as a function of operating pa-rameters (e.g., temperature) are mostly used to give the physical properties of individual pseudo-components. In the absence of literature models, the physical proper-ties of individual pseudo-components are optimized to match the experimentally measured mixture properties, perhaps using a simple trial-and-error strategy. As-similating the physical properties of individual pseudo-components to the properties of a representative com-ponent is another way to model the physical properties of individual pseudo-components. For example, in non-milk-related work on vegetable oils, Zhang et al. (2003) represented canola oil by triolein.
In recent work, Zhang et al. (2015) developed a pseudo-milk compound for use within a commercial process simulator. Here, the influence of temperature alone on the physical properties of milk (i.e., thermal conductivity, density, viscosity, and heat capacity) was studied. However, the physical properties of milk are also strongly affected by TS (involving proteins, lac-tose, fat, and minerals) as well as temperature, and we aimed to address this addition in the current work. The prediction of milk viscosity prediction was another problem in Zhang et al. (2015) that was not addressed.
The amount of milk solids varies along the produc-tion line of dairy processing. For example, in the milk powder plant, milk is concentrated from 12 to 13% (wt/wt) to 48 to 52% (wt/wt) TS under vacuum in the evaporator. However, the “pseudo-milk” developed in Zhang et al. (2015) was ineffective at predicting the
desired physical properties of milk at higher milk TS. Consequently, in this work, we studied the effect of changing milk TS (i.e., whole milk, skim milk, and con-centrated milk) and temperature on key milk physical properties (i.e., thermal conductivity, density, viscosity, and heat capacity) simultaneously.
The key differences between Zhang et al. (2015) and the present study are outlined in Table 2. The prop-erties of pseudo-components were specified differently from previous work. For example, milk fat was consid-ered as a pseudo-component instead of free fatty acids, significantly different molecular weights of fats and proteins were used, milk minerals were considered a pseudo-component, and expanded fluid and power law models were used for the prediction of milk viscosity. Casein and whey proteins were also considered in this study. These alterations were necessary to model the physico-chemical characteristics of real milk constitu-ents. Multiple multivariate models were also used in this study to compare different models.
The creation of an improved pseudo-milk and exten-sion of the already existing pseudo-components in the pseudo-milk mixture will expand the application of process simulators to dairy processes. The creation of an improved pseudo-milk will enable modeling of unit operations such as evaporators and spray driers where milk streams with different TS and temperatures are involved. This work will also enable prediction of the correct material and energy balances around dairy pro-cess unit operations.
MATERIALS AND METHODS
Raw Material (Milk): Composition and Assumptions for Modeling
Nutritionally, milk is regarded as a complete food given that it contains water, fats, proteins, lactose (car-bohydrates), minerals, and vitamins. Normally, milk is divided into 2 components: the milk solids and the aqueous phase. The solid components are dispersed in the aqueous phase. For instance, the gross composition of whole milk (13% by weight total milk solids) is 87% water, 4% fats, 3.4% proteins, 4.8% lactose, and 0.8% various minerals as shown in Table 3. The composi-tions of other products common in New Zealand (for example) with different TS [e.g., skim, trim (fat-free), and concentrated milk] are also shown in Table 3. These gross compositions are also relevant elsewhere with minor changes. In this study, whole milk, skim milk, and concentrated milk were considered. Trim milk was ignored as major differences in physical properties are not expected because the milk fat concentration is very small (0.3% by weight) and it is the main cause of

Journal of Dairy Science Vol. 99 No. 5, 2016
VIRTUAL MILK FOR MODELING AND SIMULATION 3383
differences. Creams as separate streams were also not considered explicitly in this study, as extra light (12 to 12.5% fat) and light (15 to 19.1% fat; Morison et al., 2012) cream streams are already included as concen-trated milk. Heavy creams, those above 40% fat, were deliberately excluded from consideration in this study due to complex rheological behavior.
In this study, the following assumptions were adopted after the following considerations.
(1) Milk was considered as a homogeneous mixture; it is, in fact, a colloid of water, fats, proteins, lac-tose, and minerals. Vitamins were not considered in this study as they are soluble in fats and their overall concentration is small.
(2) The chemical formulas of the pseudo-components were not specified. They were considered as inert, because mostly, there is no chemical reaction in milk processing. However, the chemical formulas of the pseudo-components need to be specified in the modeling of cheese making process.
(3) Ordinarily, milk proteins consist of 2 major cat-egories; ~80% casein proteins and ~20% whey proteins (by weight). The casein proteins mainly contain phosphorus-containing amino acids. On the other hand, the whey proteins consist of β-LG (>50% by wt.), α-LA (>20% by wt.), and many minor proteins. The whey proteins mainly contain phosphorus-containing amino acids, and are soluble in nature, have a more complex struc-ture, but are a minor component (Bylund, 1995). Only casein and whey proteins were considered in this work because other minor categories of proteins are in smaller quantities.
(4) The aqueous phase of milk was only considered. Milk properties for other phases might not be valid.
(5) The heat capacity of milk for the temperature range 60 to 75°C remains constant as most solid milk fats become liquid and there is no latent heat effect (Hu et al., 2009). Heat capacity data in Fernández-Martín (1972a) also validates this assumption.
(6) The heat capacity of milk for the temperature range 4 to 75°C was assumed reversible for the simulation purposes because the reversibility of the heat capacity of heated milk is largely un-known. The reversibility can also restore initial heat capacity values.
Process Simulation and Process Simulator Details
One of the original aims of this work was to estab-lish whether a standard chemical process simulator T
able
2. K
ey d
iffer
ence
s be
twee
n Zha
ng e
t al
. (2
015)
and
the
pre
sent
stu
dy
Key
diff
eren
ce
Zha
ng e
t al
. (2
015)
P
rese
nt s
tudy
Milk
fat
sFr
ee fat
ty a
cids
wer
e us
ed t
o re
pres
ent
milk
fat
. Fa
tty
acid
s ar
e no
t tr
ue r
epre
sent
ativ
es o
f th
e m
ilk fat
mol
ecul
e.M
ilk fat
was
dev
elop
ed a
s a
pseu
do-c
ompo
nent
. M
olec
ular
wei
ght
used
w
as m
uch
high
er t
han
that
use
d in
Zha
ng e
t al
. (2
015)
.M
ilk p
rote
ins
An
aver
age
mol
ecul
ar w
eigh
t of
23,
000
g/m
ol w
as u
sed.
An
aver
age
mol
ecul
ar w
eigh
t of
2.5
E8
g/m
ol w
as u
sed.
Pro
tein
typ
esO
nly
case
in w
as c
onsi
dere
d.C
asei
n an
d w
hey
prot
eins
wer
e co
nsid
ered
.M
ilk m
iner
als
Sodi
um a
nd p
otas
sium
sal
ts w
ere
used
to
repr
esen
t m
ilk
min
eral
s.M
ilk m
iner
als
wer
e de
velo
ped
as a
pse
udo-
com
pone
nt. C
alci
um,
mag
nesi
um, an
d ot
her
impo
rtan
t sa
lts
wer
e m
issi
ng in
Zha
ng e
t al
. (2
015)
.T
herm
al c
ondu
ctiv
ity
A s
ingl
e m
odel
was
use
d fo
r va
lidat
ion.
Mul
tipl
e m
odel
s w
ere
used
for
val
idat
ion.
Den
sity
A s
ingl
e m
odel
was
use
d fo
r va
lidat
ion.
Mul
tipl
e m
odel
s w
ere
used
for
val
idat
ion.
Vis
cosi
ty c
alcu
lation
met
hod
A s
impl
e m
odel
was
use
d fo
r vi
scos
ity
pred
iction
.E
xpan
ded
fluid
and
pow
er law
mod
els
wer
e us
ed t
o pr
edic
t m
ilk
visc
osity.
The
se m
odel
s ar
e re
com
men
ded
for
non-
New
toni
an flu
ids.
Hea
t ca
paci
ty c
alcu
lation
m
etho
dA
sin
gle
vari
able
mod
el w
as u
sed
for
the
pred
iction
of he
at
capa
city
.A
mul
tiva
riat
e m
odel
was
use
d fo
r th
e pr
edic
tion
of he
at c
apac
ity.

3384 MUNIR ET AL.
Journal of Dairy Science Vol. 99 No. 5, 2016
designed for oil and gas processing was suitable for the simulation of dairy processes. For this study, VMGSim v8.0 (Virtual Materials Group Inc., 2014), was used as the process simulator. As with many similar simula-tors, except water, all the other components (e.g., fats*, proteins*, lactose*, and minerals*) were not originally available in the component library of the process simu-lator. Consequently, these components were treated as hypothetical or pseudo-components (denoted by the asterisk, *) and generated by populating their key basic properties. The classification of the components in a milk mixture used in the process simulator is also shown in Figure 1.
The advanced Peng–Robinson equation of state (EOS) model was selected as the property package for the simulation due to the presence of polar (e.g., water) and hydrocarbon-based (e.g., proteins and fats) compounds in milk (Mühlbauer and Raal, 1995; Díaz et al., 2011; Munir et al., 2012c). Other EOS and activity property packages (e.g., the Wilson activity package) suitable for polar substances were tried but gave poor results compared with the advanced Peng–Robinson thermodynamic model.
Pseudo-Milk Components
The hypothetical component manager (hypo man-ager) tool in VMGSim was used to generate milk pseudo-components. Key basic properties such as mo-lecular weight, normal boiling point, and liquid density of pseudo-components were loaded into this tool. These properties can also be fine-tuned as these normally have ranges with minimum and maximum values.
The fine-tuning of the properties can help to best match simulation results with real or literature data. A systematic algorithm for the fine-tuning of the basic properties of the pseudo-components is given in Figure 2. The algorithm started with a manual input of the key basic properties in the hypo manager tool. The model was simulated with water and pseudo-components using these basic properties to predict milk physical properties. The milk physical properties were then compared with real or literature data. This fine-tuning then becomes an optimization problem. The key basic properties were varied in a systematic manner such that the norm of the average relative error (ARE) for the 4 physical properties was minimized. In practice,
Table 3. Quantitative milk composition (% by weight); data are from Bylund (1995) and Bon et al. (2010)
Product
Component
Water Fat Proteins Lactose Minerals TS
Whole milk 87.0 4.0 3.4 4.8 0.8 13.0Skim milk 89.3 1.7 3.5 4.7 0.8 10.7Trim (fat-free) milk 90.5 0.3 3.5 4.8 0.9 9.5Concentrated milk 50.0 16.0 13.0 18.0 3.0 50.0
Figure 1. Classification of components in a milk mixture in the simulator (* = pseudo- or hypothetical components).

Journal of Dairy Science Vol. 99 No. 5, 2016
VIRTUAL MILK FOR MODELING AND SIMULATION 3385
we found that the normal boiling point parameter for milk fat was the most important fitted parameter.
The pseudo-milk components details and their data are given as follows:
• Milk fat*: Milk fat is a complex structure contain-ing around 350 to 437 different types of fatty acids. Three fatty acids in a fat molecule are attached to a backbone mostly made of triglycerides. Milk fat
globules (size range: 0.1–17 μm) are in a partially stable emulsion of a milk plasma phase. In this work, the molecular weight of milk fat was set to be 1.355E9 g/mol, as estimated in Madoumier et al. (2015). Milk fat density was set to be 931 kg/m3 as given in Fox (2003). Byluppala (2010) also modeled milk fat as a mixture of 12 differ-ent fatty acids. However, the milk fat modeling strategy presented in Byluppala (2010) and Zhang
Figure 2. A systematic algorithm for fine-tuning the basic properties of the pseudo-components. Color version available online.

3386 MUNIR ET AL.
Journal of Dairy Science Vol. 99 No. 5, 2016
et al. (2015) was not used in this study because a mixture of different fatty acids is quite different from the actual milk fat structure.
• Milk proteins*: Casein proteins are present in cluster called a casein micelle. In this work, an average molecular weight of casein micelles was set to be around 2.5E8 g/mol, as estimated in De-wan et al. (1974). The density was set to be 1,250 kg/m3, similar to our previous work in Zhang et al. (2015). The molecular weight of whey proteins was set to be ~18,400 g/mol, as reported in Kon-topidis et al. (2004).
• Milk lactose*: Lactose is a milk sugar made up of saccharide molecules. Milk lactose was hypotheti-cally generated by setting an average molecular weight to 342 g/mol, and density around 1,451 kg/m3 (Zadow, 1984).
• Milk minerals*: Milk is a source of sodium, cal-cium, phosphorous, zinc, iodine, magnesium, potassium, and other minerals. Milk minerals were represented as a pseudo-component with an estimated average molecular weight according to their weight fractions. In this study, an average molecular weight of milk minerals was set to be around 66 g/mol and density around 3,000 kg/m3 (Jensen, 1995; Gaucheron, 2005).
Milk Viscosity Measurement
The viscosity measurements were obtained using a rheometer (AR-G2, TA Instruments, Crawley, UK). The viscosity of the milk was measured using the starch cell and conical concentric cylinder geometry. The starch cell held the sample at a specified temperature, and conical cylinder is the geometry used for low-viscosity fluids. The viscosity was measured at increasing shear rates from 1 to 1,000 s−1, with 50 data points in be-tween. These values were chosen to cover a large range of process conditions that the milk would be exposed to, while keeping the temperature constant, and then repeated at different temperatures from 25°C to 70°C at intervals of 5°C. Each of the tests was carried out 3 times.
RESULTS AND DISCUSSION
The milk product streams with different TS (whole milk, skim milk, and concentrated milk) were simulated in the process simulator. Selecting the thermodynamic model, entering process basic information (temperature, pressure, and flow), selecting milk mixture components (i.e., available and pseudo-components), and specifying
their compositions were the main steps involved in this simulation.
Sensitivity analysis is a technique that can be used to identify the influence of each physical property model on the overall process simulation model. Recently, Madoumier et al. (2015) used this technique to study the influence of each physical property model on the process simulation of milk. Madoumier et al. (2015) concluded that the process simulation model was most sensitive to any variation in thermal conductivity, fol-lowed by density, viscosity, and heat capacity. It is in-teresting to note that heat capacity has the least effect on the process simulation model. However, in this work, all 4 of these properties in whole milk, skim milk, and concentrated milk were modeled.
The simulation results of the milk physical proper-ties were validated using experimental data or empiri-cal models available in the literature. Table 4 presents a literature review of several empirical models of the milk physical properties reported prominently in the literature. These models are compared over tempera-ture ranges common in a dairy plant such as 4 to 75°C for temperature, and TS contents for whole, skim, and concentrated milk.
Milk Thermal Conductivity Results and Validation
Milk thermal conductivity is a measure of milk’s abil-ity to conduct heat. It plays an important role in heat or energy balance calculations in the process simulator. For this reason, careful attention to thermal conductiv-ity modeling is necessary.
The thermal conductivity of different milks with different TS (whole, skim, and concentrated milk) is primarily influenced by temperature (Fox, 2003). Fox (2003) claimed that the thermal conductivity of milk increases linearly with an increase in temperature and decreases with an increase in TS. However, the TS concentration only secondarily affects thermal conduc-tivity. For example, the thermal conductivity of whole and skim milk ranges from 0.530 to 0.613 and 0.527 to 0.622 W/(m·K), respectively, over a temperature range of 0 to 100°C (Lewis, 1993; McCarthy and Singh, 2009).
The empirical models of Minim et al. (2002), More and Prasad (1988), and Riedel (1949) for thermal con-ductivity shown in Table 4 were used to validate the simulated thermal conductivity. The experimental data of Minim et al. (2002) was also used for validation, as shown in Figure 3, which shows simulated, empirical model, and experimental results of the thermal conduc-tivity. It also compares different empirical models.
Three clear trends are immediately evident in Figure 3. The first is that thermal conductivity increases lin-

Journal of Dairy S
cience Vol. 99 No. 5, 2016
VIR
TUA
L MILK
FOR
MO
DE
LING
AN
D S
IMU
LATION
3387
Table 4. Existing physical property regression models for milk
Physical property Regression model Reference
Thermal conductivity (λ)
λ = × + ×( ) − ×( )− − −5 9 10 1 2 10 1 7 8 101 3 3. . . ,T X where T = temperature (°C), X = TS percentage , λ = thermal conductivity (W/m·K), also denoted by k.
More and Prasad (1988)
λ = + − ×( ) × + ×( )− − −326 58 1 0412 3 37 10 4 6 10 5 4 10 1 73 2 1 1. . . . . .T T XWater 33 10 3× − , where XWater = water fraction (and other terms are as previously defined).
Riedel (1949)
λ = × + × + + ×− − −1 63 10 1 4 10 0 2 4 102 3 2. . .T X XWater Fat λ = × + × − × − + ×( )− − − −5 28 10 2 13 10 7 32 10 1 0 843 1 9 101 3 6 2 3. . . . . ,T T X TFat where XFat = fat fraction (and other terms are as previously defined).
Minim et al. (2002) (using regression modeling)
Density (ρ) ρ = − × − ×( )− + × −− − −1 040 7 2 665 10 2 3 10 1 011 9 76 10 41 3 2 3, . . . . . .T T X TFat 881 10 5 2×( )⎡⎣⎢
⎤⎦⎥
− T , where ρ = density (kg/m3) (and other terms are as previously defined).
Kessler (2002)
ρ = − + × −1 042 01 0 37 3 6 10 4 2, . . .T T Minim et al. (2002)
ρρ
=1
Σw iX
i,
, where ρFat T= × −925 56 4 1757 10 1. – . , ρProteins T= − × −1 329 9 5 1840 10 1, . . , ρLactose T= − × −1 599 1 3 1046 10 1, . . ,
ρMinerals T= − × −2 423 8 2 8063 10 1, . . , where X = component mass fraction, w,i = weight fraction of component i (and other terms are as previously defined).
Choi and Okos (1986)
Viscosity (μ) μ = − × + ×( )+ − ×− − −0 9565 1 3004 10 1 9580 10 0 4766 1 144 103 4 2. . . . .T T XFat22 5 27 2642 10T T+ ×( )−. , where μ =
viscosity (cP)
Kessler (2002)
log ,μ = + + + + +( ) + + +( )A AT AT B BT B T S C C T C T S0 1 22
0 1 22
0 1 22 2 where S = total solids content (% in mass),
and Ai, Bi, and Ci are dimensionless coefficients (and other terms are as previously defined).
Fernández-Martín (1972b)
μ μ=⎛
⎝⎜⎜⎜⎜
⎞
⎠⎟⎟⎟⎟⎟
∑1 000, ,Wateri i
Water
AXXexp where A T TFat = + × −3 46 0 025 1 6 10 4 2. – . . , A T TProteins = − +15 367 0 175 0 0017 2. . . ,
and A T TLactose = − × + ×− −3 35 2 38 10 1 25 102 4 2. . . .
Morison et al. (2012)
Heat capacity (Cp) C T Tp = + + × −3 744 48 1 15 3 93 10 3 2, . . . Minim et al. (2002), and Hu et al. (2009)
C C Xp p ii=∑ , where C T TpFat
= + × − ×− −1 984 1 473 10 4 8008 103 6 2. . . , C T TpProteins= + × − ×− −2 008 1 2089 10 1 3129 103 6 2. . . ,
C T TpLactose= + × − ×− −1 5488 1 9625 10 5 9399 103 6 2. . . , C T TpMinerals
= + × − ×− −1 0926 1 8896 10 3 6817 103 6 2. . . , and C T X Xp Water Fat= + × + + ×− −1 4017 1 1 10 1 18 4 33 103 2. . . . , where Cp = heat capacity (J/g per K) (and other terms are as previously defined).
Choi and Okos (1986)

3388 MUNIR ET AL.
Journal of Dairy Science Vol. 99 No. 5, 2016
early with an increase in temperature. This observation agrees with Fox (2003), as noted above. The second ob-vious trend is that, for whole and skim milk, simulated conductivity, empirical models, and experimental data were mutually consistent (relative error ≤2%). Howev-er, the model of Riedel (1949) showed the closest match to the simulated conductivity (relative error ≤0.7%). The third trend was that for concentrated milk, the models of Minim et al. (2002) and More and Prasad (1988) appear different (relative errors ≤14% and ≤31%, respectively) from the model of Riedel (1949) and simulated conductivity. However, the discrepancy
between simulated thermal conductivity and Minim et al. (2002) was smaller (relative error ≤1%). These discrepancies may be explained by the fact that Minim et al. (2002) used a higher ratio of fat to other TS (i.e., TS other than fat), and More and Prasad (1988) calcu-lated thermal conductivity for uncommon temperature (40–90°C) and TS (37–73% wt.) ranges. The model of Riedel (1949) also showed the closest match (relative error ≤0.5%) to the simulated thermal conductivity for concentrated milk. For this reason, the model of Riedel (1949) is the best choice for milk thermal conductivity followed by the model of Minim et al. (2002). However, valid experimental data for concentrated milk thermal conductivity was not available to further validate it.
The models of Minim et al. (2002) and Riedel (1949) for thermal conductivity of most milk streams with different TS emerged as the most relevant empirical models. These models for thermal conductivity and perhaps, more importantly, the reported experimental data of Minim et al. (2002) validated the simulated thermal conductivity results. However, for concentrated milk process simulation, careful attention to the energy balance calculation might be necessary as the simulated thermal conductivity results can only be compared with empirical model results in this case.
Milk Density Results and Validation
The density of milk depends on temperature and composition (i.e., fat, water, proteins, lactose, and min-erals densities) and their mass fractions. It is interesting to note that the fat component of milk (density ≈931 kg/m3) with the lowest density among the components (water ≈999 kg/m3, proteins ≈1,250 kg/m3, lactose ≈1,451 kg/m3, and minerals ≈3,000 kg/m3) is mainly responsible for the complicated influence of tempera-ture and composition on milk density. This influence of fat is complicated by the fact that the density of the milk fat depends on the ratio of liquid fat (with lower density) to solid fat (with higher density) within the milk fat melting point range (−35°C to 40°C). Above 40°C, almost all milk fat becomes liquid, with a lower density (McCarthy and Singh, 2009).
The density of milk can be determined using dif-ferent methods, such as hydrometry (Bradley, 2010), hydrostatic balance (Al-Nabulsi et al., 2011), and di-latometric analysis (Kumar et al., 2010). Furthermore, the empirical models of Kessler (2002), Minim et al. (2002), and Choi and Okos (1986) for prediction of milk density are available in the literature.
In this work, the simulated milk with different TS (whole, skim, and concentrated) densities were com-pared with real milk literature data. The empirical
Figure 3. Simulation of the thermal conductivity [k, W/(m·K)] of whole, skim, and concentrated milk over a range of temperatures. Expt = experimental. Color version available online.

Journal of Dairy Science Vol. 99 No. 5, 2016
VIRTUAL MILK FOR MODELING AND SIMULATION 3389
models of Kessler (2002), Minim et al. (2002), and Choi and Okos (1986), shown in Table 4, were used in this work to predict the actual density of whole, skim, and concentrated milk over the temperature range 4 to 75°C. Similarly, another empirical model of milk den-sity and experimental data were reported in Fernández-Martín (1972b). McCarthy and Singh (2009) discussed and elaborated upon the advantages of the Fernández-Martín (1972b) empirical model over other milk density empirical models available in the literature. However, the experimental data of Minim et al. (2002) was used
for validation, as shown in Figure 4. Fernández-Martín (1972b)’s empirical model and experimental data were not used in this study because it had a similar meth-odology and same fat-to-nonfat solids ratio to that in Minim et al. (2002).
The simulated, empirical model, and experimental results of the whole, skim, and concentrated milk densi-ties are graphically presented in Figure 4, which shows that milk density linearly decreases with an increase in temperature. This trend is in conformity with reports by Kessler (2002), Minim et al. (2002), Solanki and Rizvi (2001), Choi and Okos (1986), and Fernández-Martín (1972b). An increase in milk density with an increase in TS is also evident in Figure 4. Note that the density of concentrated milk is higher than that of whole or skim milk.
For the whole and skim milks, the simulated density, Kessler (2002) and Minim et al. (2002) empirical mod-els, and experimental data were mutually consistent (relative error ≤2%). However, for the concentrated milk only, Minim et al. (2002)’s empirical model and experimental data were in relatively good agreement with simulated density (relative error ≤4%). Choi and Okos (1986)’s empirical model does not consider the effect of TS on milk density. This seems to be a major reason for the discrepancy between the simulated and Choi and Okos (1986) milk densities (relative error ≤8%). Furthermore, the empirical model of Kessler (2002) was quite different for concentrated milk.
Milk Viscosity Results and Validation
Milk viscosity is an important parameter in the production of milk powder. The viscosity of milk con-centrate has a considerable effect on the performance of milk concentrating unit operations, maintenance, and product quality. The viscosity and flow behavior of milk also varies with temperature and TS concen-tration. For these reasons, accurate modeling of milk viscosity is necessary to model unit operations such as the evaporator and the drier, where temperature and TS change during processing.
The viscosities of whole, skim, and concentrated milk were simulated and compared with the empirical models of Morison et al. (2012), Kessler (2002), and Fernández-Martín (1972b) for milk viscosity, as shown in Figure 5. The simulated results were also compared with experimentally measured viscosities (explained in the Milk Viscosity Measurement section). In this study, a rheometer was used for the viscosity measurement over the temperature range 25 to 70°C. These results are consistent with those reported by Souza (2011), with a relative error ≤0.4% for of milk viscosity.
Figure 4. Simulated, model, and experimental (Expt) density (ρ, kg/m3) of whole, skim, and concentrated milk over a range of tempera-tures. Color version available online.

3390 MUNIR ET AL.
Journal of Dairy Science Vol. 99 No. 5, 2016
Four observations in Figure 5 are evident. The first is that the viscosity of the milk decreases with an increase in temperature. This is because the ratio of liquid milk fat to solid milk fat increases with increase in temperature, causing a decrease in milk viscosity. The second observation is that a bump in the simulated viscosity above 40°C is evident. This is because all solid fat becomes liquid above 40°C (McCarthy and Singh, 2009). The third observation is that the simulated milk viscosities, empirical model of Fernández-Martín (1972b), and experimental data were mutually con-sistent (relative error ≤2.5%), especially above 25°C.
The fourth observation is that the empirical model of Kessler (2002) was quite different from the simulated and experimental viscosities of skim and concentrated milks (relative error ≥25%). The empirical model of Morison et al. (2012) was slightly better as it consid-ers the non-Newtonian behavior of concentrated milk (relative error ≤20%). The non-Newtonian behavior of concentrated milk has been reported by several other authors; for example, Vélez-Ruiz and Barbosa-Cánovas (1998) and Wang and Hirai (2011).
The empirical model of Fernández-Martín (1972b) predicted significantly higher viscosity values for con-centrated milk below 25°C. This discrepancy is because Fernández-Martín (1972b) used a general equation for 10 different types of milk, kinematic viscosity coeffi-cients were used, and the coefficients were calculated by the least squares error method. These might explain the significantly higher predicted viscosity values at lower temperature. In addition, the viscosity of non-Newtonian fluids depends on many parameters such as operating conditions, equipment, and shear rate. These parameters might also be responsible for significantly higher predicted viscosity values at lower temperatures in Fernández-Martín (1972b). It is evident in Figure 5 that the experimental values of concentrated milk viscosity are much lower than viscosity values predicted by the empirical model of Fernández-Martín (1972b).
Milk viscosity prediction was an unresolved issue in Madoumier et al. (2015) and Zhang et al. (2015). This was due to complex non-Newtonian behavior of milk. In the current study, we used expanded fluid-based viscos-ity correlation and power law models to model the non-Newtonian behavior of the concentrated milk. Recently, Yarranton and Satyro (2009) used an expanded fluid-based viscosity correlation to model the non-Newtonian behavior of heavy hydrocarbons in VMGSim. The same methodology was used in this work.
Milk Heat Capacity Results and Validation
Heat capacity measures the specific amount of heat required to raise the temperature of milk and, there-fore, is key in modeling, for example, the economics of a dairy plant. The measured heat capacity of the complex compound milk includes both latent and sensible heats, and is, therefore, termed “apparent heat capacity.” Fur-thermore, milk is a mixture of substances with different melting points, and apparent heat must be added or removed to bring about changes in temperature during heating or cooling.
Like thermal conductivity, viscosity, and density, the heat capacity of milk is a function of temperature and TS concentration, although, unlike the other physical properties, it is considerably more complex and non-
Figure 5. Simulated, model, and experimental (Expt) viscosity (μ, cP) of whole, skim, and concentrated milk over a range of tempera-tures. Color version available online.

Journal of Dairy Science Vol. 99 No. 5, 2016
VIRTUAL MILK FOR MODELING AND SIMULATION 3391
monotonic, as shown in Figures 6, 7, and 8. Although heat capacity is a combination of the individual com-ponent heat capacities of the constituents, the milk fat component dominates. The influence of nonfat TS on milk heat capacity is not significant (Hu et al., 2009). Milk heat capacity data with different fat concentra-tions (e.g., 0.1, 3.5, 15, 25, and 35% by weight) are plotted in Figure 6. Note that the fat concentrations of whole, skim, and concentrated milk fall within this range.
Figure 6 shows the apparent heat capacity of milk for different fat contents over the temperature range of 0 to 60°C using data (plotted as circles) from Hu et al. (2009). Above 60°C, the apparent heat capacity of milk remains the same. At temperatures below 40°C, the heat capacity of milk fat mainly depends on tem-perature, and it changes significantly due to the latent heat effect. Above 40°C, milk heat capacity does not change significantly because most solid milk fats have become liquid and there is no latent heat effect. The apparent heat capacity of milk with fat content less
Figure 6. The apparent heat capacity (Cp; J/g per K) of milk at different fat contents over the temperature range of 0 to 60°C (data adapted from Hu et al., 2009). Note that circles show different fat concentrations (e.g., 0.1, 3.5, 15, 25, and 35 wt. %). Color version available online.
Figure 7. Model comparison of the heat capacity of milk (Cp; J/g per K) as a function of temperature (°C) and fat content (% by weight). See also Figure 8. Color version available online.
3392 MUNIR ET AL.
Journal of Dairy Science Vol. 99 No. 5, 2016
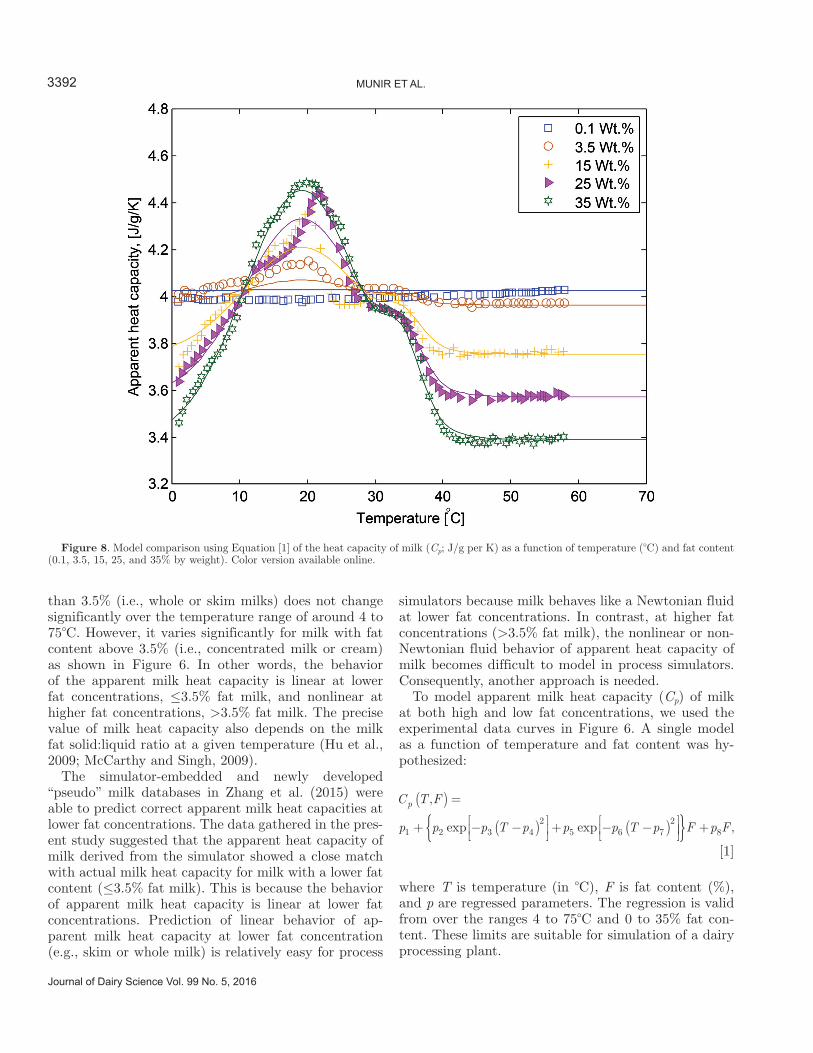
than 3.5% (i.e., whole or skim milks) does not change significantly over the temperature range of around 4 to 75°C. However, it varies significantly for milk with fat content above 3.5% (i.e., concentrated milk or cream) as shown in Figure 6. In other words, the behavior of the apparent milk heat capacity is linear at lower fat concentrations, ≤3.5% fat milk, and nonlinear at higher fat concentrations, >3.5% fat milk. The precise value of milk heat capacity also depends on the milk fat solid:liquid ratio at a given temperature (Hu et al., 2009; McCarthy and Singh, 2009).
The simulator-embedded and newly developed “pseudo” milk databases in Zhang et al. (2015) were able to predict correct apparent milk heat capacities at lower fat concentrations. The data gathered in the pres-ent study suggested that the apparent heat capacity of milk derived from the simulator showed a close match with actual milk heat capacity for milk with a lower fat content (≤3.5% fat milk). This is because the behavior of apparent milk heat capacity is linear at lower fat concentrations. Prediction of linear behavior of ap-parent milk heat capacity at lower fat concentration (e.g., skim or whole milk) is relatively easy for process
simulators because milk behaves like a Newtonian fluid at lower fat concentrations. In contrast, at higher fat concentrations (>3.5% fat milk), the nonlinear or non-Newtonian fluid behavior of apparent heat capacity of milk becomes difficult to model in process simulators. Consequently, another approach is needed.
To model apparent milk heat capacity (Cp) of milk at both high and low fat concentrations, we used the experimental data curves in Figure 6. A single model as a function of temperature and fat content was hy-pothesized:
C T F
p p p T p p p T p
p ,
exp exp
( ) =
+ − −( )⎡⎣⎢
⎤⎦⎥+ − −( )⎡
⎣⎢⎤⎦1 2 3 4
25 6 7
2⎥⎥{ } + ,F p F8
[1]
where T is temperature (in °C), F is fat content (%), and p are regressed parameters. The regression is valid from over the ranges 4 to 75°C and 0 to 35% fat con-tent. These limits are suitable for simulation of a dairy processing plant.
Figure 8. Model comparison using Equation [1] of the heat capacity of milk (Cp; J/g per K) as a function of temperature (°C) and fat content (0.1, 3.5, 15, 25, and 35% by weight). Color version available online.

Journal of Dairy Science Vol. 99 No. 5, 2016
VIRTUAL MILK FOR MODELING AND SIMULATION 3393
This model form captures the double Gaussian peaks evident in the data, and captures the influence of in-creasing fat content. The regression of the 8 nonlinear parameters in Equation [1] was done via the OPTI optimization toolbox for Matlab (MathWorks, Natick, MA) from Currie and Wilson (2012).
The comparison with the experimental data adapted from Hu et al. (2009) is given in Figure 7 and the values of the parameters p of the regressed model in Equation [1] are given in Table 5. Note that the Cp of milk at very low fat concentrations is essentially water and is therefore practically independent of T (over the studied range) and fat content F as expected. Figure 8 compares the model with the experimental data on a 2-dimensional plot. Figure 9 shows separate model fits to experimental data at higher fat concentrations (>3.5% fat milk).
The representative Equation [1] was programmed as an external routine into the process simulator to predict complex behavior and the correct values of milk heat capacity. After programming the external routine into the process simulator, apparent heat capacity values also showed a close match (relative error ≤1.5%) with actual milk heat capacity values for higher fat content milk.
The available evidence seems to suggest that recent commercial simulators can simulate all heat capacity
behavior for all fat concentrations over the temperature range of 4 to 75°C. Heat capacity behavior (mostly non-Newtonian) can be modeled by writing external programming routines to be integrated with the process simulator. Furthermore, the accuracy of heat capacity prediction may be less important, because milk tem-perature and milk heat requirements are connected by feedback process control loops. However, heat capacity is still important for process design.
CONCLUSIONS
In this work, the validity of the previously developed “pseudo” milk by Zhang et al. (2015) was extended by studying the effect of total milk solids and temperature on several physical properties of milk. Milk was consid-ered a “mixture” of water and pseudo-components. The physical properties of this milk mixture were predicted using a process simulator as a function of the individual component physical properties. The simulated results were validated against experimental and literature data. The simulated results of the milk physical properties showed a reasonable match [e.g., thermal conductiv-ity (≤2%), density (≤4%), viscosity (≤3%), and heat capacity (≤1.5%)] with the experimental results. Con-sequently, modeling with such a process simulator can predict material and energy balances for dairy process-
Table 5. Regressed parameters (p) in Equation [1]1
Item p1 p2 p3 p4 p5 p6 p7 p8
Value 4.0283 0.0304 0.0069 19.2424 0.0071 0.0686 34.1363 −0.01821R2 = 0.9730; R2 (adjusted coefficient of determination) = 0.9724.
Figure 9. Separate model fit to experimental data of the apparent heat capacity of milk (J/g per K) as a function of fat content (15, 25, and 35% by weight). Color version available online.

3394 MUNIR ET AL.
Journal of Dairy Science Vol. 99 No. 5, 2016
es. This work also further enables commercial process simulators for credible simulation of milk as a collection of pseudo-components for varying TS, including whole, skim, and concentrated milks over normal processing temperature ranges from 4 to 75°C. Complicated milk viscosity behavior was also modeled in this work. The complication is due to fact that milk rheological behav-ior (from Newtonian to non-Newtonian) changes under the following conditions: temperature ≤40°C, TS ≥40% (by weight), and moderate to high shear rates. Expand-ed fluid-based viscosity correlation and power-law mod-els were used to model the non-Newtonian behavior of the concentrated milk. Finally, an 8-parameter simple correlation to predict heat capacity as a function of temperature and fat content was shown to be accurate over the temperature and fat ranges common in a dairy plant.
ACKNOWLEDGMENTS
The authors acknowledge the Primary Growth Part-nership (PGP) program from the New Zealand Minis-try of Primary Industries (New Zealand) for funding the project.
REFERENCES
Abakarov, A., and M. Nuñez. 2012. Thermal food processing optimiza-tion: Algorithms and software. J. Food Eng. 115:428–442.
Al-Nabulsi, A., R. Shaker, T. Osaili, S. Clark, F. Harte, and G. Barbosa-Cánovas. 2011. Impact of high hydrostatic pressure and heat treatments on milk gel properties: A comparative rheological study. Int. J. Food Prop. 15:613–627.
Arthur, C. J., M. T. Munir, B. R. Young, and W. Yu. 2014. Process simulation of the transport gasifier. Fuel 115:479–489.
Bon, J., G. Clemente, H. Vaquiro, and A. Mulet. 2010. Simulation and optimization of milk pasteurization processes using a general process simulator (ProSimPlus). Comput. Chem. Eng. 34:414–420.
Bradley, R., Jr. 2010. Moisture and total solids analysis. Pages 85–104 in Food Analysis. S. S. Nielsen, ed. Springer US, New York, NY.
Bylund, G. 1995. Dairy Processing Handbook. Tetra Pak Processing Systems AB, Lund, Sweden.
Byluppala, H. 2010. Process design and simulation for extraction of milk fat using liquid propane. MSc Thesis. Oklahoma State Uni-versity, Stillwater.
Cheng, H., and A. Friis. 2007. Operability and flexibility of a milk production line. Food Bioprod. Process. 85:372–380.
Choi, Y., and M. Okos. 1986. Effects of temperature and composi-tion on the thermal properties of foods. Food Eng. Process Appl. 1:93–101.
Currie, J., and D. I. Wilson. 2012. Opti: Lowering the Barrier Between Open Source Optimizers and the Industrial MATLAB User. N. Sahinidis and J. Pinto, ed. Savannah, GA.
Dewan, R. K., A. Chudgar, R. Mead, V. A. Bloomfield, and C. V. Morr. 1974. Molecular weight and size distribution of bovine milk casein micelles. Biochim. Biophys. Acta Prot. Struct. 342:313–321.
Díaz, O. C., J. Modaresghazani, M. A. Satyro, and H. W. Yarranton. 2011. Modeling the phase behavior of heavy oil and solvent mix-tures. Fluid Phase Equilib. 304:74–85.
Fernández-Martín, F. 1972a. Influence of temperature and composi-tion on some physical properties of milk and milk concentrates. I. Heat capacity. J. Dairy Res. 1:65–73.
Fernández-Martín, F. 1972b. Influence of temperature and composi-tion on some physical properties of milk and milk concentrates. II. Viscosity. J. Dairy Res. 1:75–82.
Fox, P. F. 2003. Advanced Dairy Chemistry: Lactose, Water, Salts and Minor Constituents. 3rd ed. Springer Science & Business Media, New York, NY.
Gaucheron, F. 2005. The minerals of milk. Reprod. Nutr. Dev. 45:473–483.
Hu, J., O. Sari, S. Eicher, and A. Rija Rakotozanakajy. 2009. Determi-nation of specific heat of milk at different fat content between 1°C and 59°C using micro DSC. J. Food Eng. 90:395–399.
Jensen, R. G. 1995. Handbook of Milk Composition. Academic Press, San Diego, CA.
Kessler, H. G. 2002. Food and Bioprocess Engineering: Dairy Technol-ogy. Verlag A. Kessler, Munich, Germany.
Kontopidis, G., C. Holt, and L. Sawyer. 2004. Invited review: β-Lactoglobulin: Binding properties, structure, and function. J. Dairy Sci. 87:785–796.
Kumar, M., V. Sharma, D. Lal, A. Kumar, and R. Seth. 2010. A com-parison of the physico-chemical properties of low-cholesterol ghee with standard ghee from cow and buffalo creams. Int. J. Dairy Technol. 63:252–255.
Lewis, M. J. 1993. Physical properties of dairy products. Pages 331–380 in Modern Dairy Technology. R. K. Robinson, ed. Springer US, New York, NY.
Luyben, W. L. 2002. Plantwide Dynamic Simulators in Chemical Pro-cessing and Control. Marcel Dekker Inc., New York, NY.
Madoumier, M., C. Azzaro-Pantel, G. Tanguy, and G. Gésan-Guiziou. 2015. Modelling the properties of liquid foods for use of process flowsheeting simulators: Application to milk concentration. J. Food Eng. 164:70–89.
McCarthy, O. J., and H. Singh. 2009. Physico-chemical properties of milk. Pages 691–758 in Advanced Dairy Chemistry. P. McSweeney and P. F. Fox, ed. Springer, New York, NY.
Minim, L. A., J. S. R. Coimbra, V. P. R. Minim, and J. Telis-Romero. 2002. Influence of temperature and water and fat contents on the thermophysical properties of milk. J. Chem. Eng. Data 47:1488–1491.
More, G. R., and S. Prasad. 1988. Thermal conductivity of concen-trated whole milk. J. Food Process Eng. 10:105–112.
Morison, K. R., J. P. Phelan, and C. G. Bloore. 2012. Viscosity and non-Newtonian behaviour of concentrated milk and cream. Int. J. Food Prop. 16:882–894.
Mühlbauer, A. L., and J. D. Raal. 1995. Computation and thermody-namic interpretation of high-pressure vapour–liquid equilibrium—A review. Chem. Eng. J. Biochem. Eng. J. 60:1–29.
Munir, M., W. Yu, and B. R. Young. 2012a. Determination of plant-wide control loop configuration and eco-efficiency. Pages 441–457 in Plantwide Control: Recent Developments and Applications. G. P. Rangaiah and V. Kariwala, ed. John Wiley & Sons Ltd., Hobo-ken, NJ.
Munir, M. T., W. Yu, and B. R. Young. 2012b. Recycle effect on the relative exergy array. Chem. Eng. Res. Des. 90:110–118.
Munir, M. T., W. Yu, and B. R. Young. 2012c. A software algorithm/package for control loop configuration and eco-efficiency. ISA Trans. 51:827–833.
Munir, M. T., W. Yu, and B. R. Young. 2013. Plant-wide control: Eco-efficiency and control loop configuration. ISA Trans. 52:162–169.
Ribeiro, C. P., and M. H. C. Andrade. 2003. Performance analysis of the milk concentrating system from a Brazilian milk powder plant. J. Food Process Eng. 26:181–205.
Ribeiro Jr, C. P., and M. H. Caño Andrade. 2002. A heat transfer model for the steady-state simulation of climbing-falling-film plate evaporators. J. Food Eng. 54:309–320.
Riedel, L. 1949. Thermal conductivity measurements on sugar solu-tions, fruit juices and milk. Dairy Sci. Technol. 93:537–549.
Seborg, D. E., T. F. Edgar, and D. A. Mellichamp. 2004. Process Dy-namics and Control. John Wiley & Sons, New York, NY.
Solanki, G., and S. S. H. Rizvi. 2001. Physico-chemical properties of skim milk retentates from microfiltration. J. Dairy Sci. 84:2381–2391.

Journal of Dairy Science Vol. 99 No. 5, 2016
VIRTUAL MILK FOR MODELING AND SIMULATION 3395
Souza, G. D. 2011. Milk dryer viscosity measurement and advanced control. PhD Thesis. The University of Auckland, New Zealand.
Tajammal Munir, M., W. Yu, B. R. Young, and D. I. Wilson. 2015. The current status of process analytical technologies in the dairy industry. Trends Food Sci. Technol. 43:205–218.
Tomasula, P. M., N. Datta, W. C. F. Yee, A. J. McAloon, D. W. Nut-ter, F. Sampedro, and L. M. Bonnaillie. 2014. Computer simula-tion of energy use, greenhouse gas emissions, and costs for alterna-tive methods of processing fluid milk. J. Dairy Sci. 97:4594–4611.
Tomasula, P. M., W. C. F. Yee, A. J. McAloon, D. W. Nutter, and L. M. Bonnaillie. 2013. Computer simulation of energy use, green-house gas emissions, and process economics of the fluid milk pro-cess1. J. Dairy Sci. 96:3350–3368.
Trystram, G. 2012. Modelling of food and food processes. J. Food Eng. 110:269–277.
Vélez-Ruiz, J. F., and G. V. Barbosa-Cánovas. 1998. Rheological prop-erties of concentrated milk as a function of concentration, tem-perature and storage time. J. Food Eng. 35:177–190.
Virtual Materials Group Inc. 2014. VMGSim V. 8.0 User’s Manual. Virtual Materials Group Inc., Calgary, AB, Canada.
Wang, Z., and S. Hirai. 2011. Modeling and estimation of rheological properties of food products for manufacturing simulations. J. Food Eng. 102:136–144.
Yarranton, H. W., and M. A. Satyro. 2009. Expanded fluid-based viscosity correlation for hydrocarbons. Ind. Eng. Chem. Res. 48:3640–3648.
Zadow, J. G. 1984. Lactose: Properties and uses. J. Dairy Sci. 67:2654–2679.
Zhang, Y., M. A. Dubé, D. D. McLean, and M. Kates. 2003. Biodiesel production from waste cooking oil: 1. Process design and techno-logical assessment. Bioresour. Technol. 89:1–16.
Zhang, Y., M. T. Munir, W. Yu, and B. R. Young. 2015. Development of hypothetical components for milk process simulation using a commercial process simulator. J. Food Eng. 121:87–93.