Embed Size (px)
Citation preview
Course Goals
• Understand the components of a Virtual Instrument
• Introduce LabVIEW and common LabVIEW functions
• Create a subroutine in LabVIEW
• Work with Arrays, Clusters, and Structures
• Develop in Basic Programming Architectures
Section I
• LabVIEW terms
• Components of a LabVIEW application
• LabVIEW programming tools
• Creating an application in LabVIEW
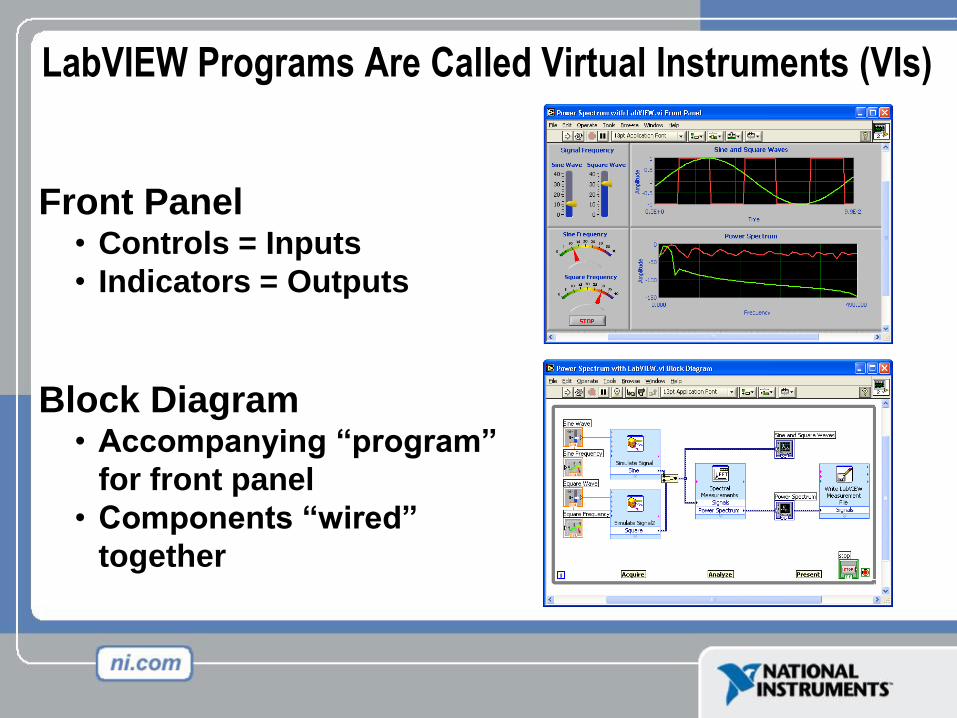
Front Panel• Controls = Inputs
• Indicators = Outputs
Block Diagram• Accompanying “program”
for front panel
• Components “wired”
together
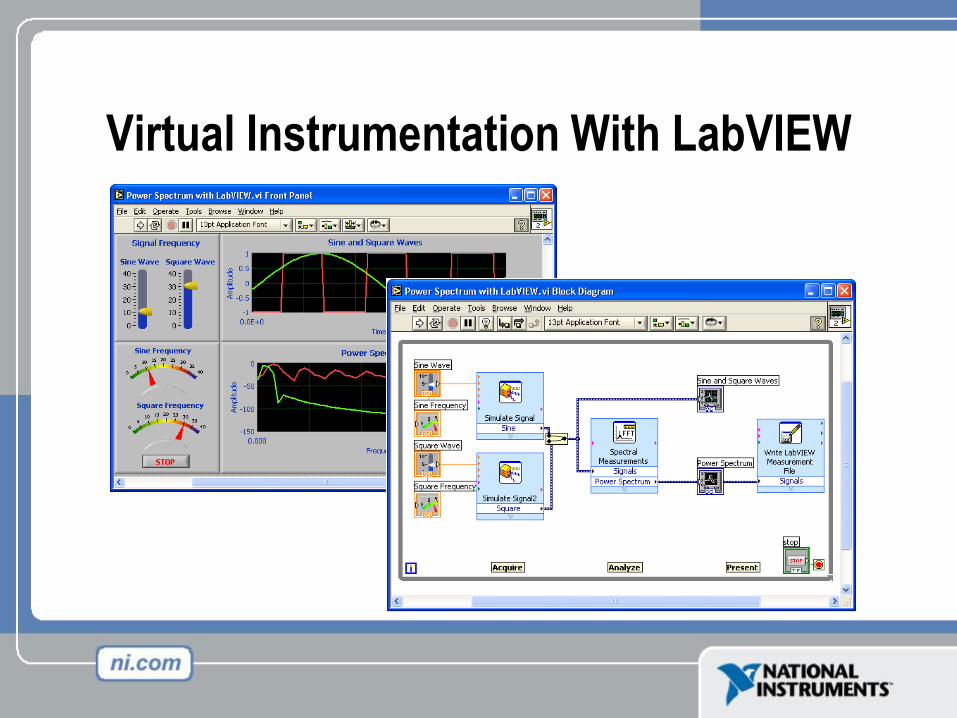
LabVIEW Programs Are Called Virtual Instruments (VIs)
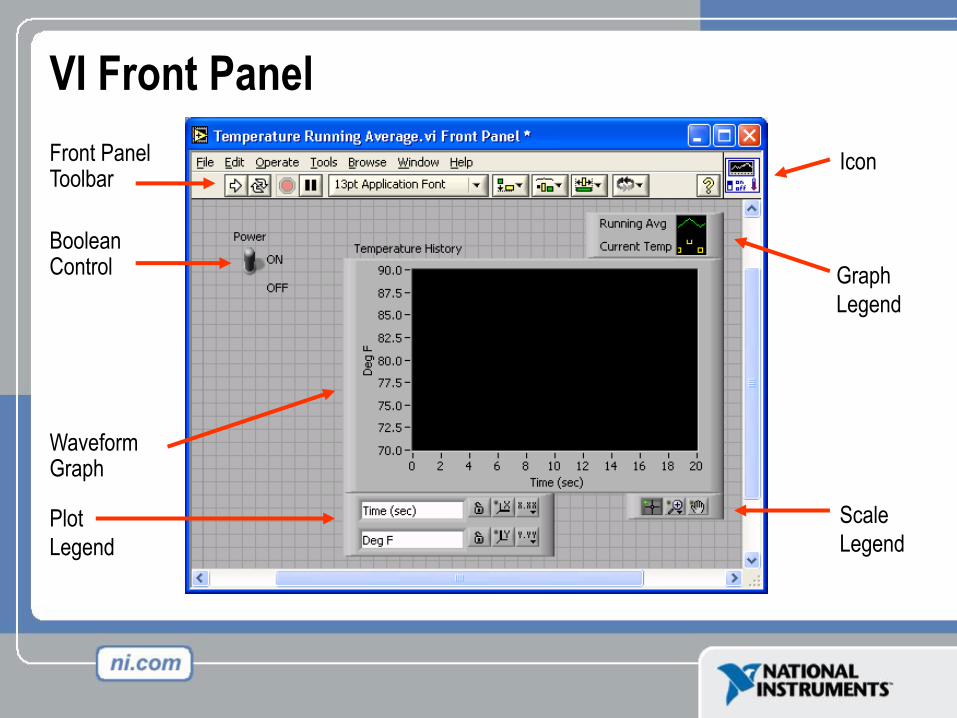
VI Front Panel
Front Panel Toolbar
Graph
Legend
BooleanControl
WaveformGraph
Icon
Plot
Legend
Scale
Legend
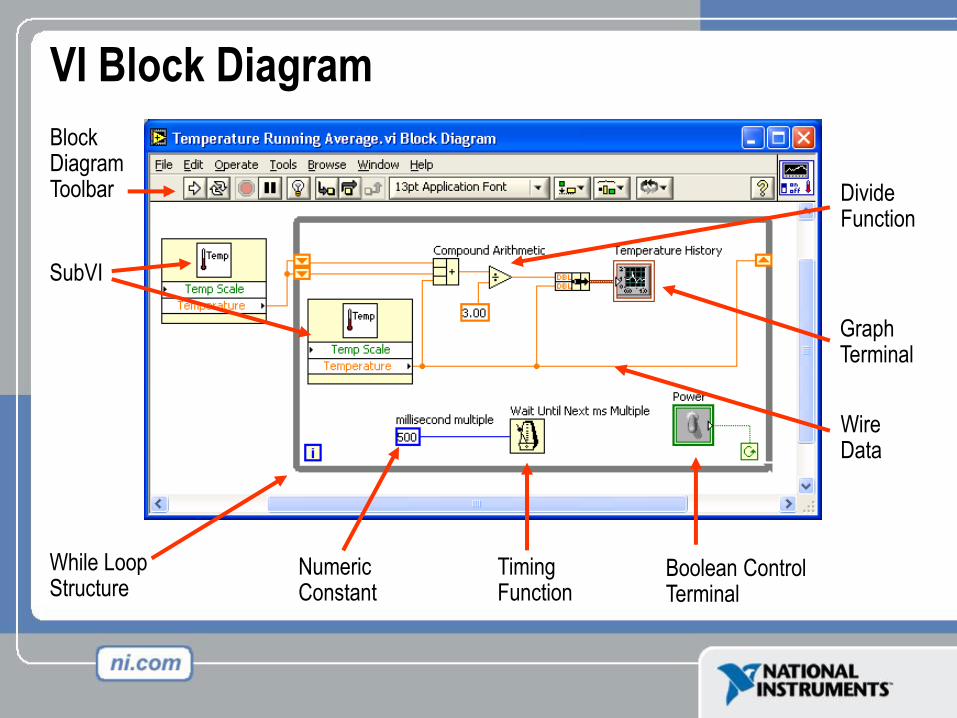
VI Block Diagram
Wire Data
GraphTerminal
SubVI
While LoopStructure
Block Diagram Toolbar Divide
Function
Numeric Constant
Timing Function
Boolean Control Terminal
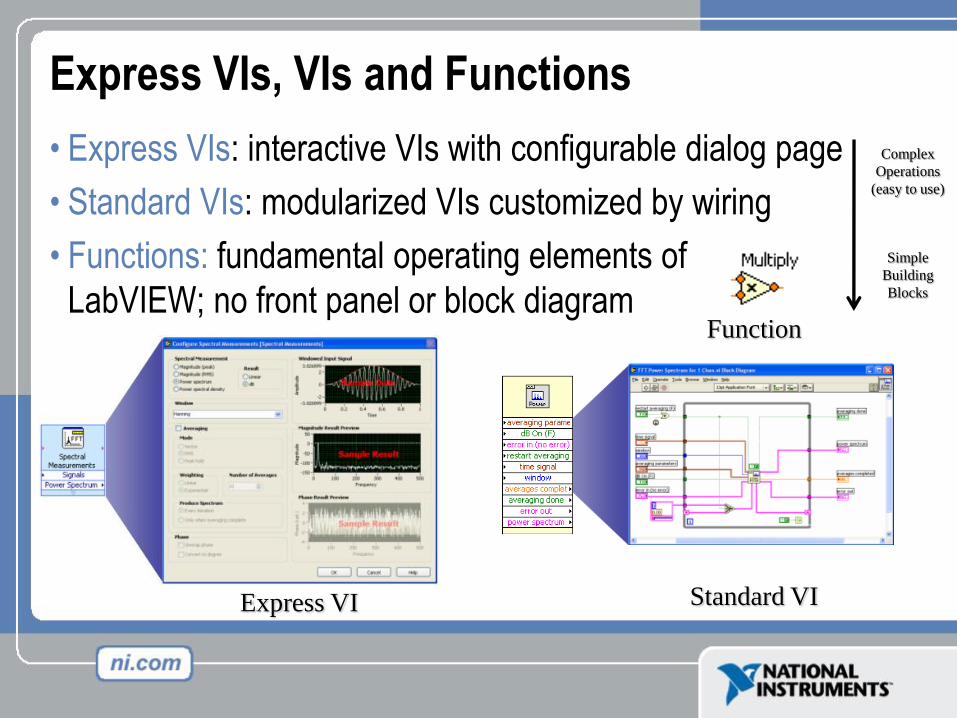
• Express VIs: interactive VIs with configurable dialog page
• Standard VIs: modularized VIs customized by wiring
• Functions: fundamental operating elements of
LabVIEW; no front panel or block diagram
Express VIs, VIs and Functions
Express VI Standard VI
Function
Complex
Operations
(easy to use)
Simple
Building
Blocks
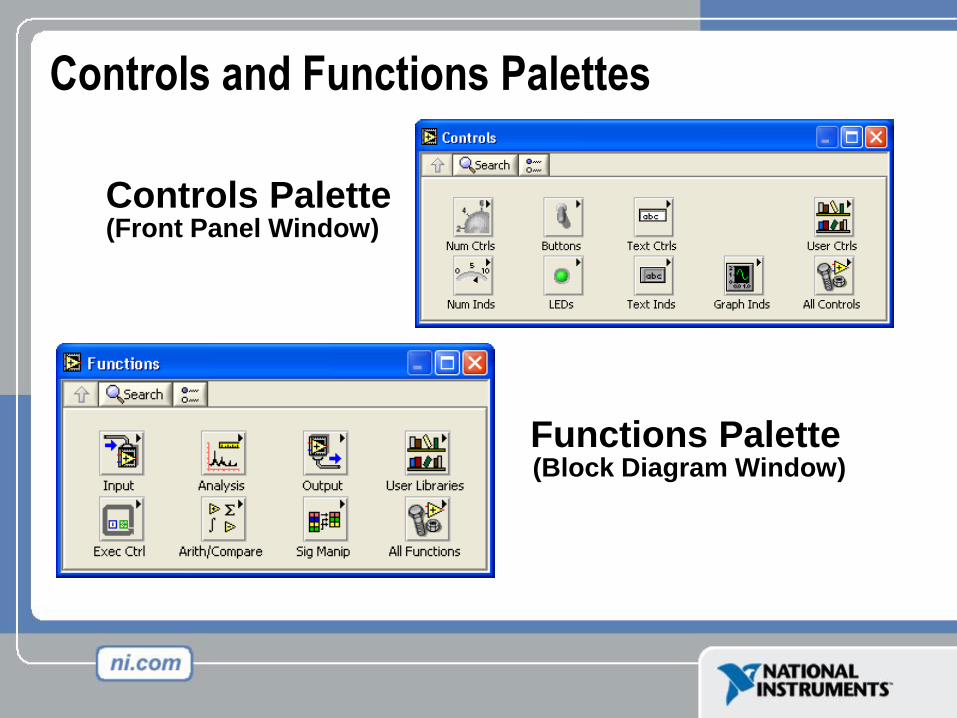
Controls and Functions Palettes
Controls Palette(Front Panel Window)
Functions Palette(Block Diagram Window)
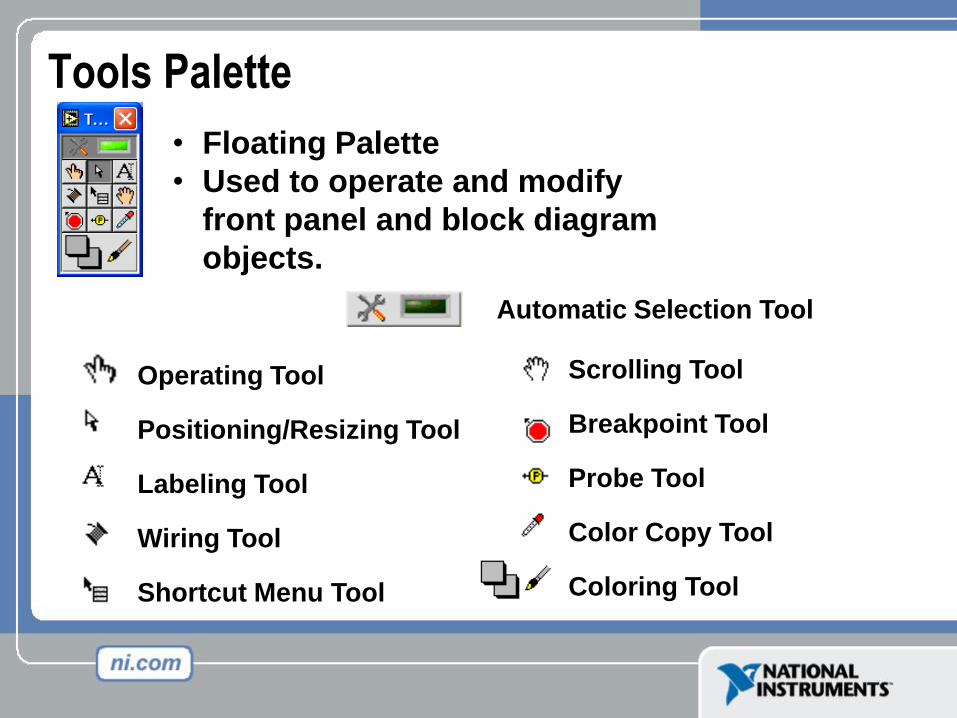
Operating Tool
Positioning/Resizing Tool
Labeling Tool
Wiring Tool
Shortcut Menu Tool
• Floating Palette
• Used to operate and modify
front panel and block diagram
objects.
Scrolling Tool
Breakpoint Tool
Probe Tool
Color Copy Tool
Coloring Tool
Tools Palette
Automatic Selection Tool
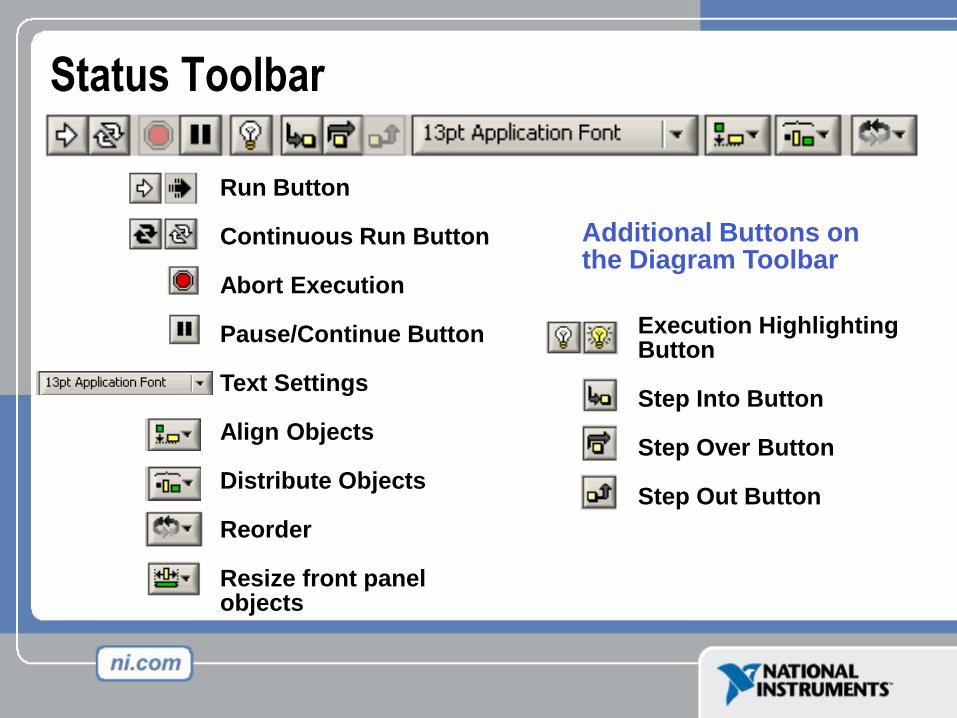
Run Button
Continuous Run Button
Abort Execution
Pause/Continue Button
Text Settings
Align Objects
Distribute Objects
Reorder
Resize front panel objects
Execution Highlighting Button
Step Into Button
Step Over Button
Step Out Button
Additional Buttons on the Diagram Toolbar
Status Toolbar
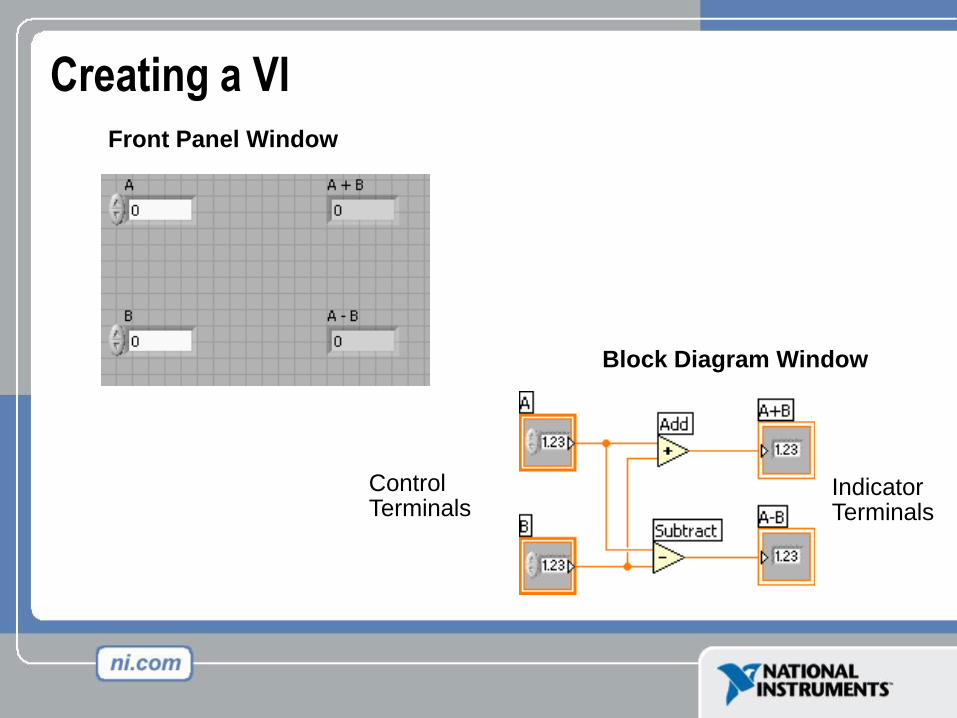
ControlTerminals
Block Diagram Window
Front Panel Window
Indicator Terminals
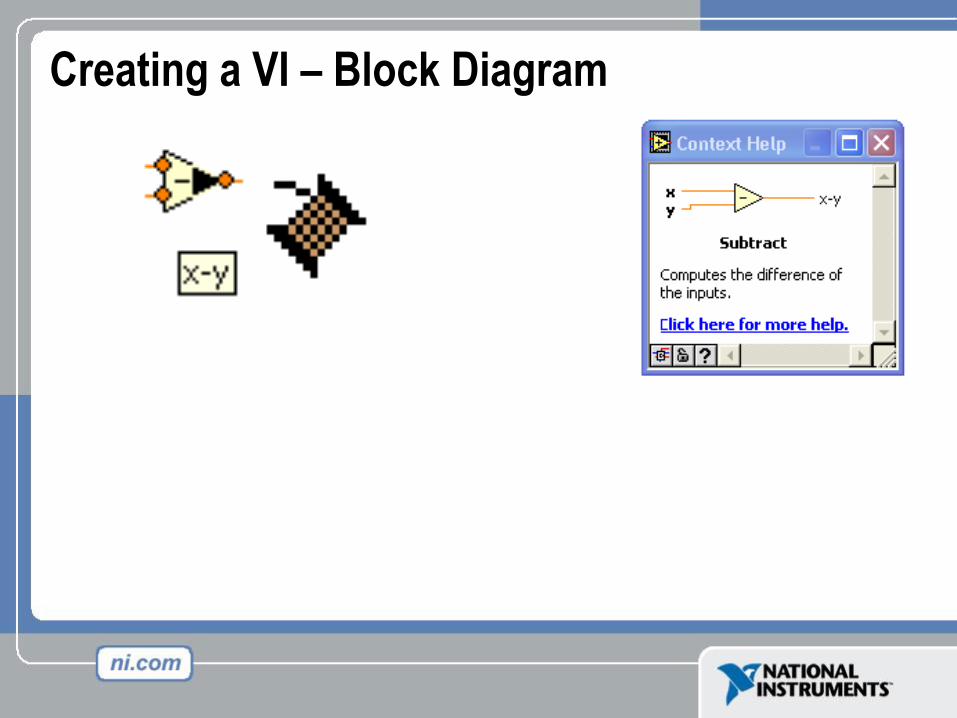
Creating a VI
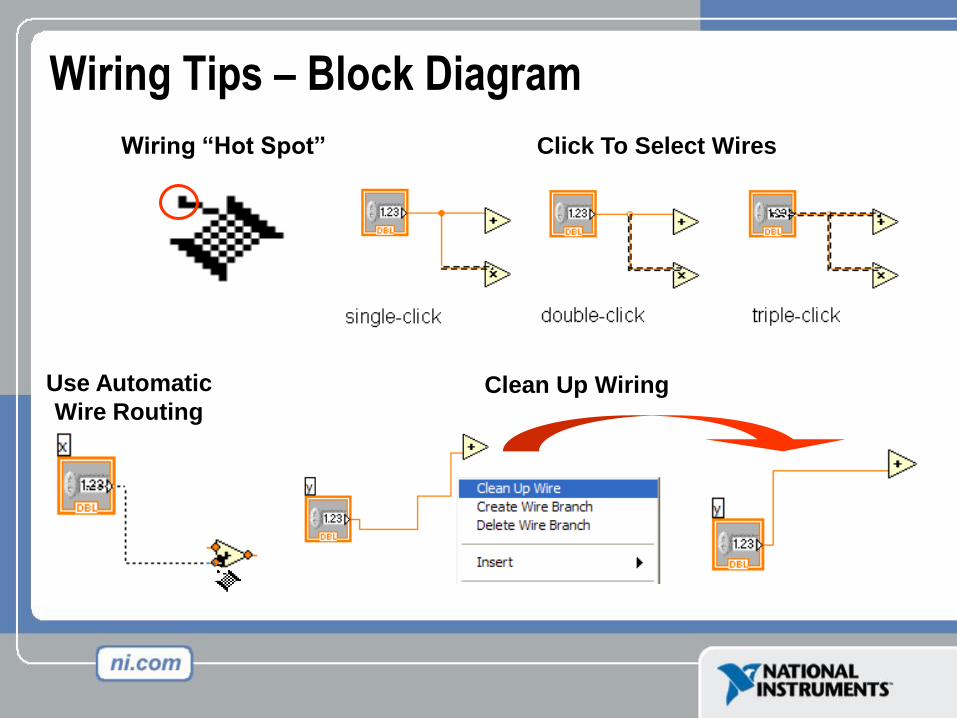
Wiring Tips – Block Diagram
Wiring “Hot Spot”
Clean Up WiringUse Automatic
Wire Routing
Click To Select Wires
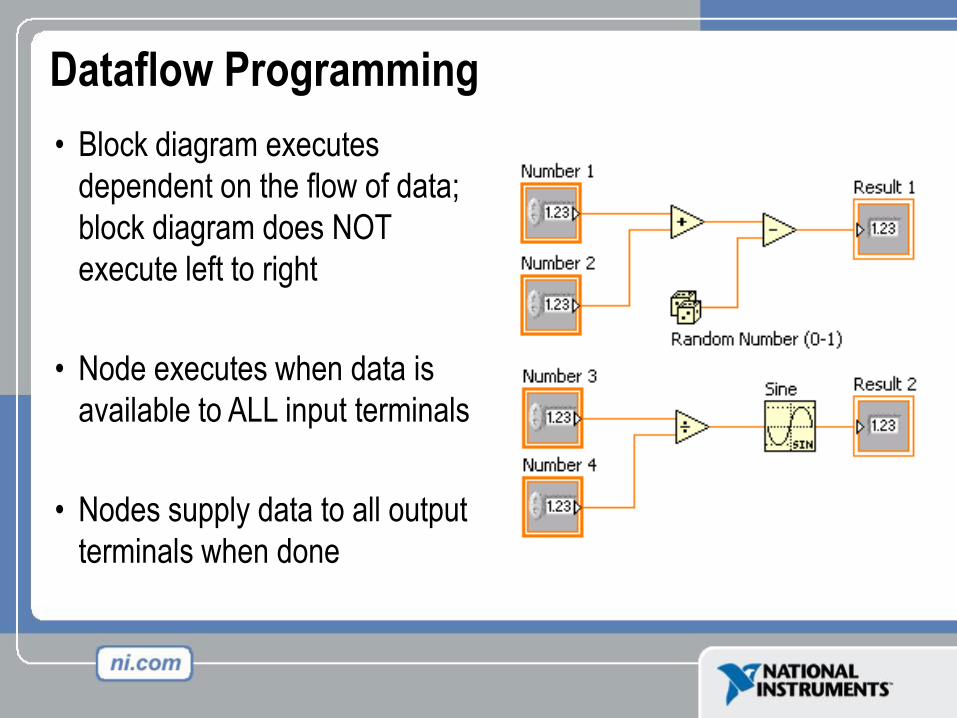
• Block diagram executes
dependent on the flow of data;
block diagram does NOT
execute left to right
• Node executes when data is
available to ALL input terminals
• Nodes supply data to all output
terminals when done
Dataflow Programming
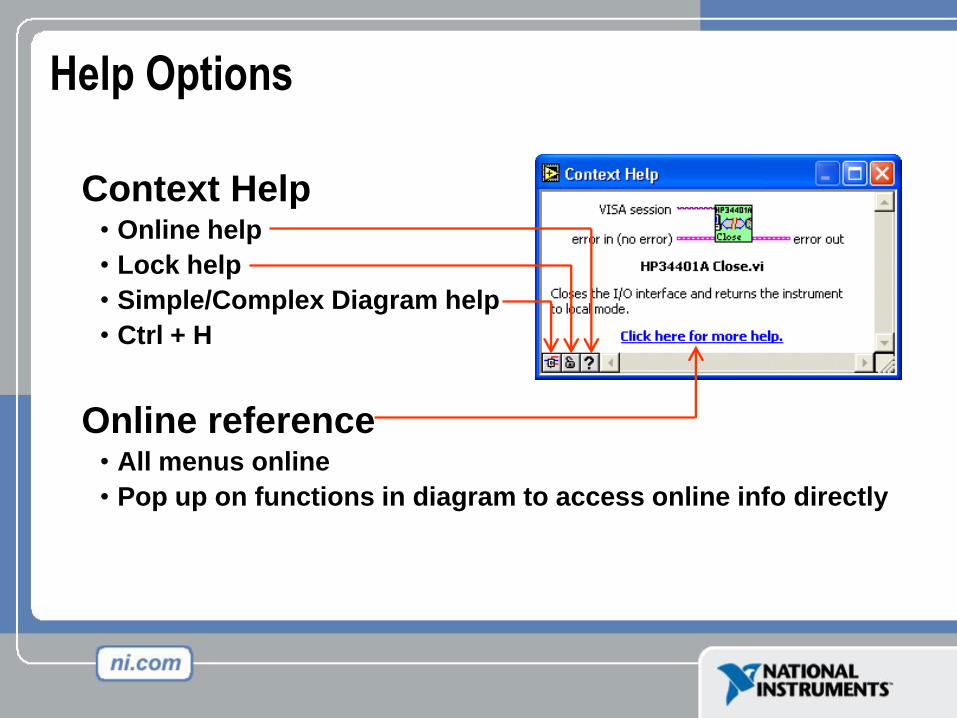
Help Options
Context Help• Online help
• Lock help
• Simple/Complex Diagram help
• Ctrl + H
Online reference• All menus online
• Pop up on functions in diagram to access online info directly
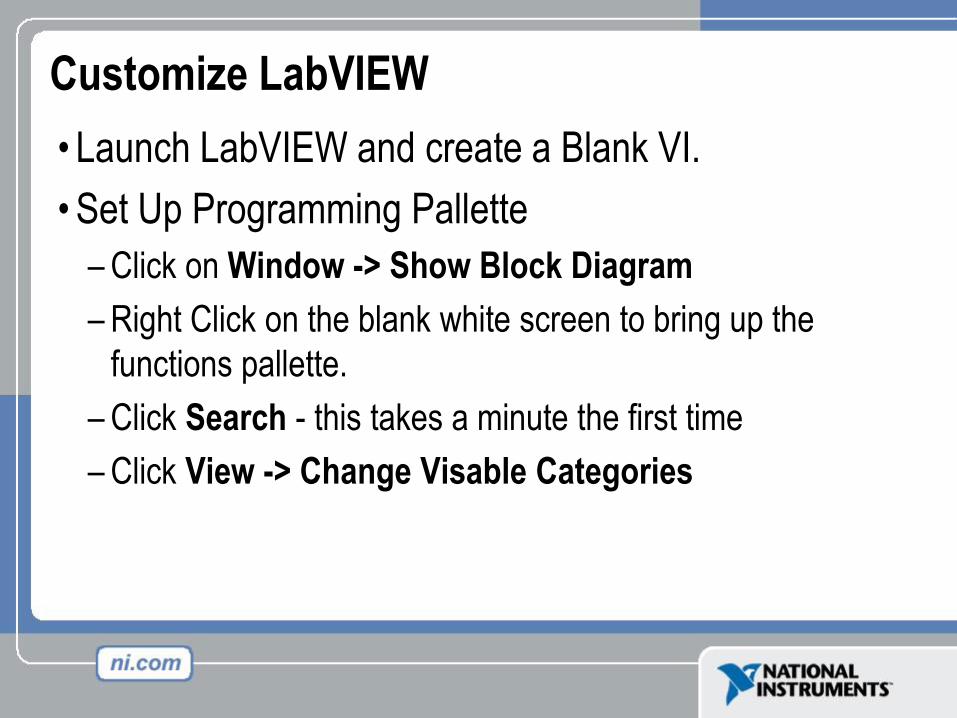
Customize LabVIEW
• Launch LabVIEW and create a Blank VI.
• Set Up Programming Pallette
– Click on Window -> Show Block Diagram
– Right Click on the blank white screen to bring up the
functions pallette.
– Click Search - this takes a minute the first time
– Click View -> Change Visable Categories
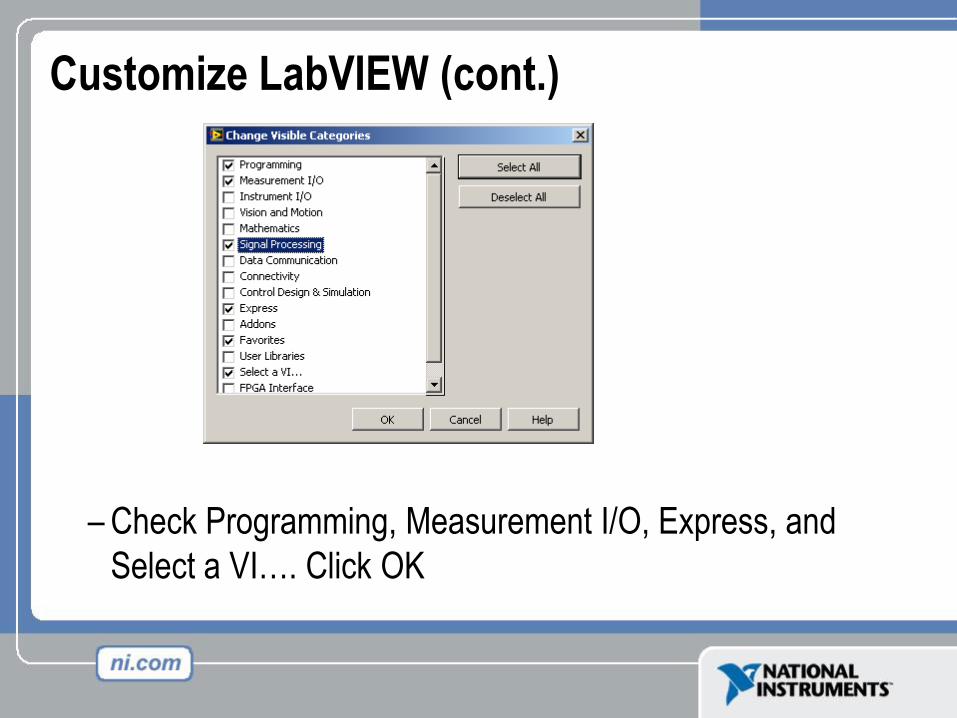
Customize LabVIEW (cont.)
– Check Programming, Measurement I/O, Express, and
Select a VI…. Click OK
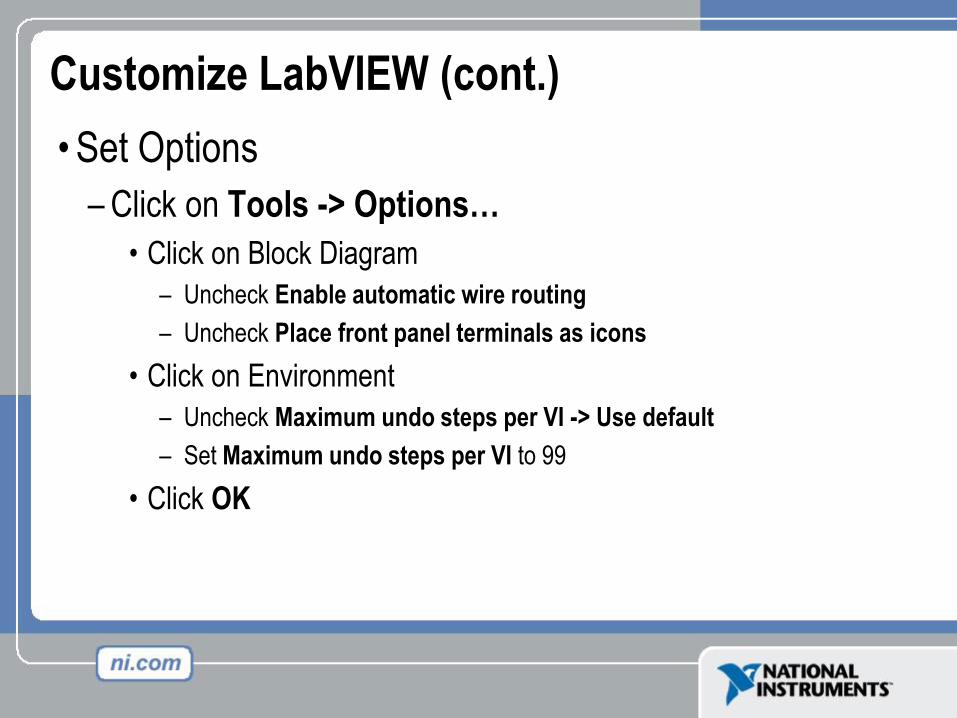
Customize LabVIEW (cont.)
• Set Options
– Click on Tools -> Options…
• Click on Block Diagram
– Uncheck Enable automatic wire routing
– Uncheck Place front panel terminals as icons
• Click on Environment
– Uncheck Maximum undo steps per VI -> Use default
– Set Maximum undo steps per VI to 99
• Click OK
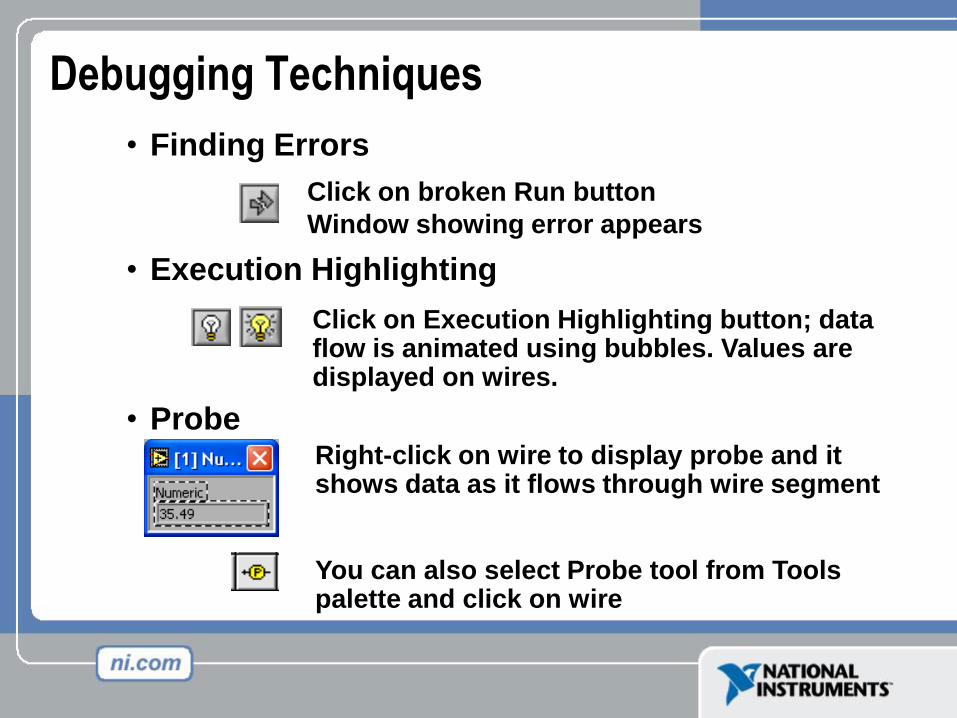
Debugging Techniques
• Finding Errors
• Execution Highlighting
• Probe
Click on broken Run button
Window showing error appears
Click on Execution Highlighting button; data flow is animated using bubbles. Values are displayed on wires.
Right-click on wire to display probe and it shows data as it flows through wire segment
You can also select Probe tool from Tools palette and click on wire
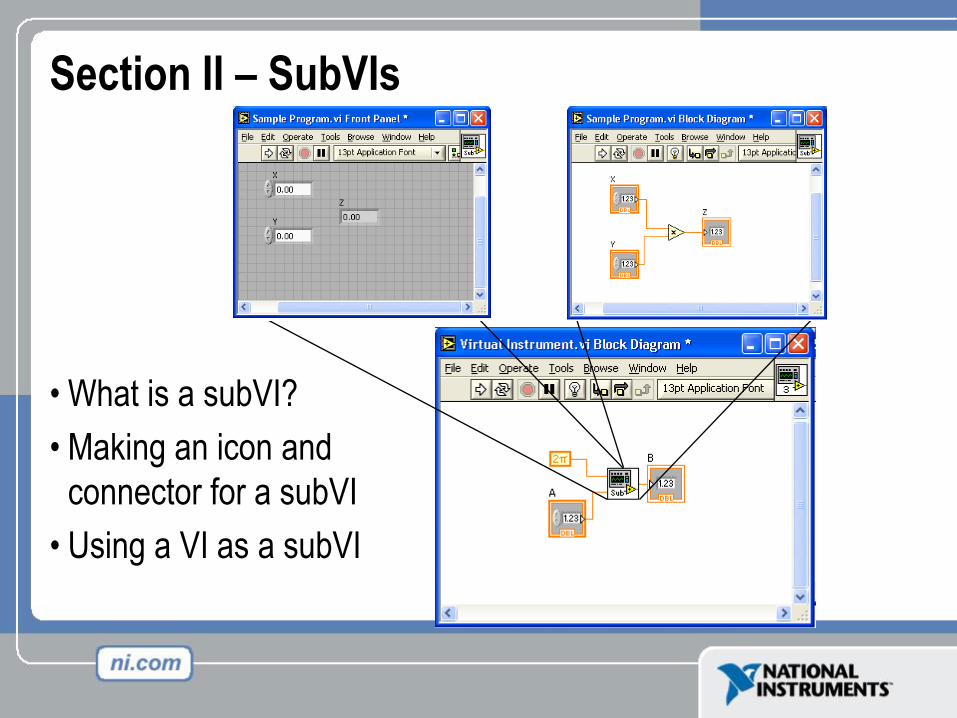
Section II – SubVIs
• What is a subVI?
• Making an icon and
connector for a subVI
• Using a VI as a subVI
SubVIs
• A SubVI is a VI that can be used within another VI
• Similar to a subroutine
• Advantages
– Modular
– Easier to debug
– Don’t have to recreate code
– Require less memory
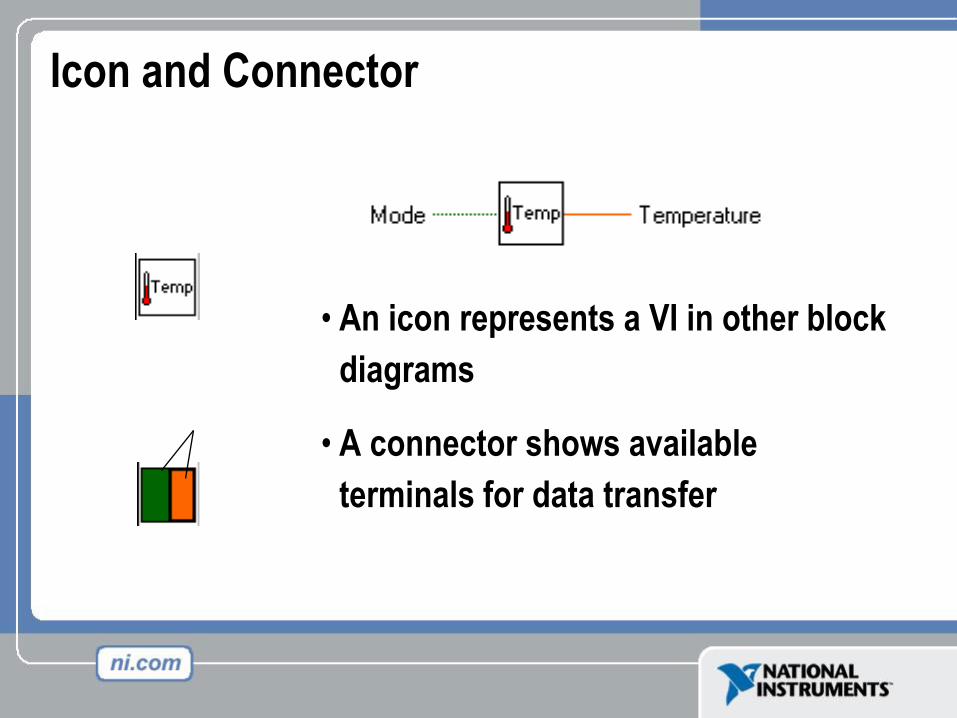
Icon and Connector
• An icon represents a VI in other block
diagrams
• A connector shows available
terminals for data transfer
Icon
Connector
Terminals
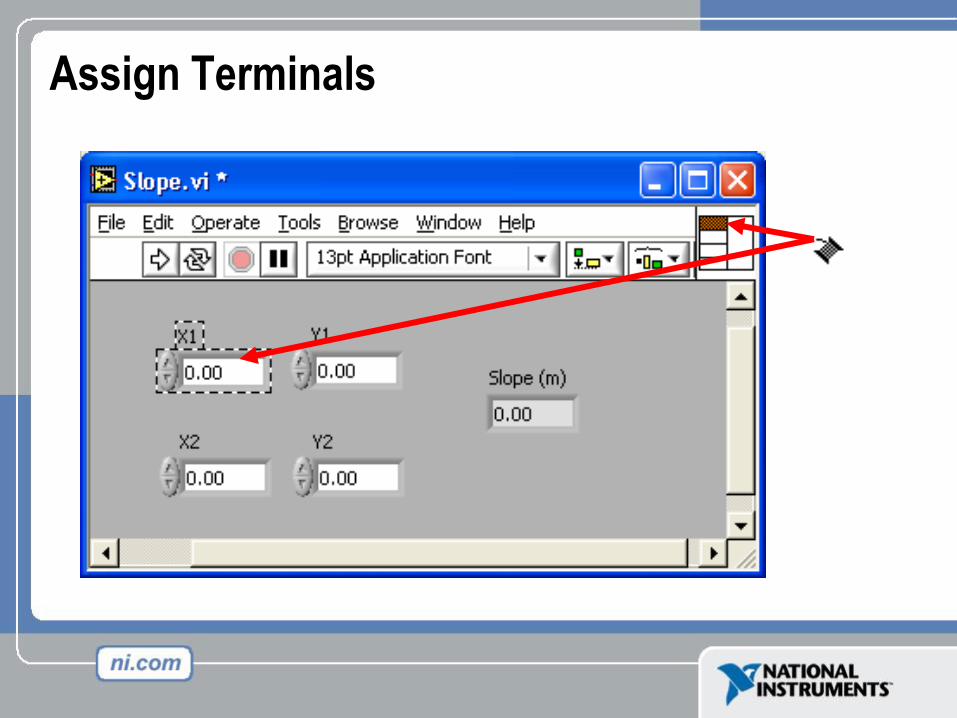
Steps to Create a SubVI
• Create the Icon
• Create the Connector
• Assign Terminals
• Save the VI
• Insert the VI into a Top Level VI
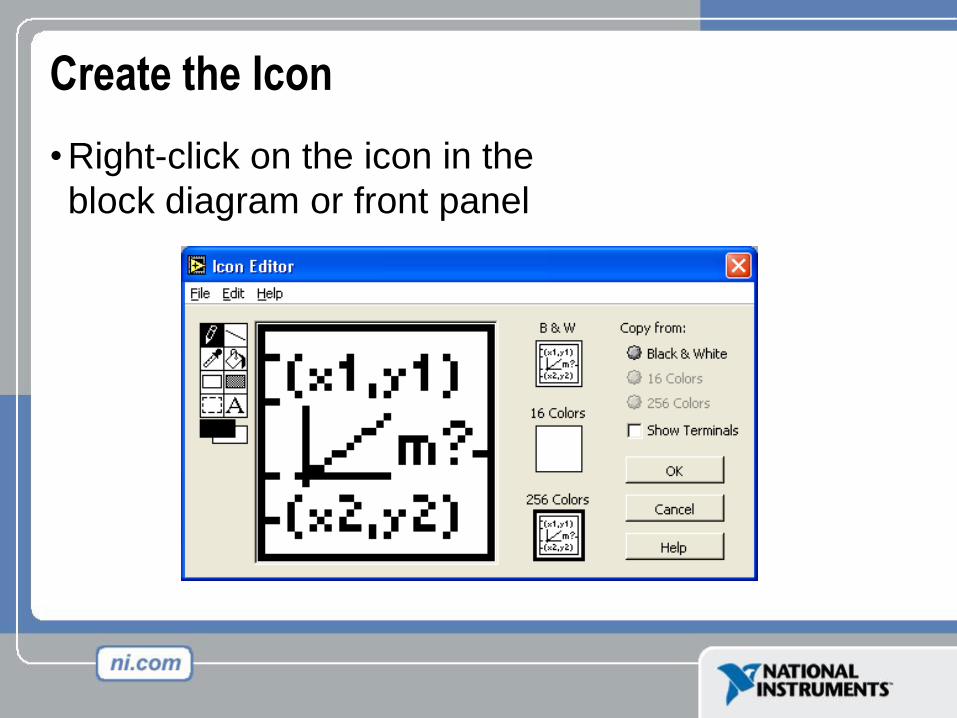
Create the Icon
• Right-click on the icon in the
block diagram or front panel
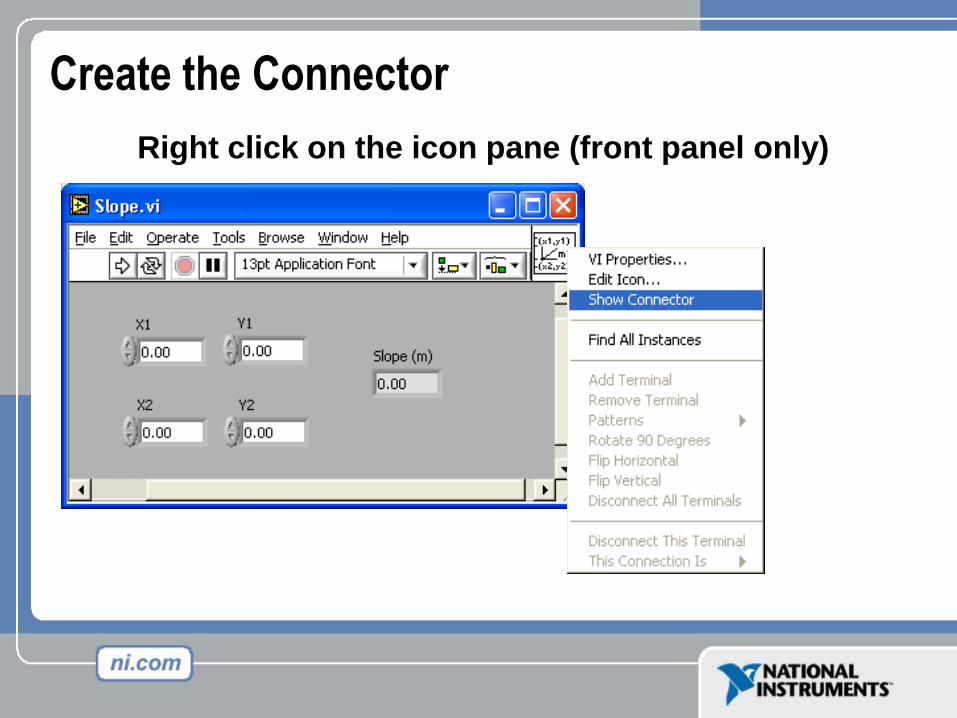
Create the Connector
Right click on the icon pane (front panel only)
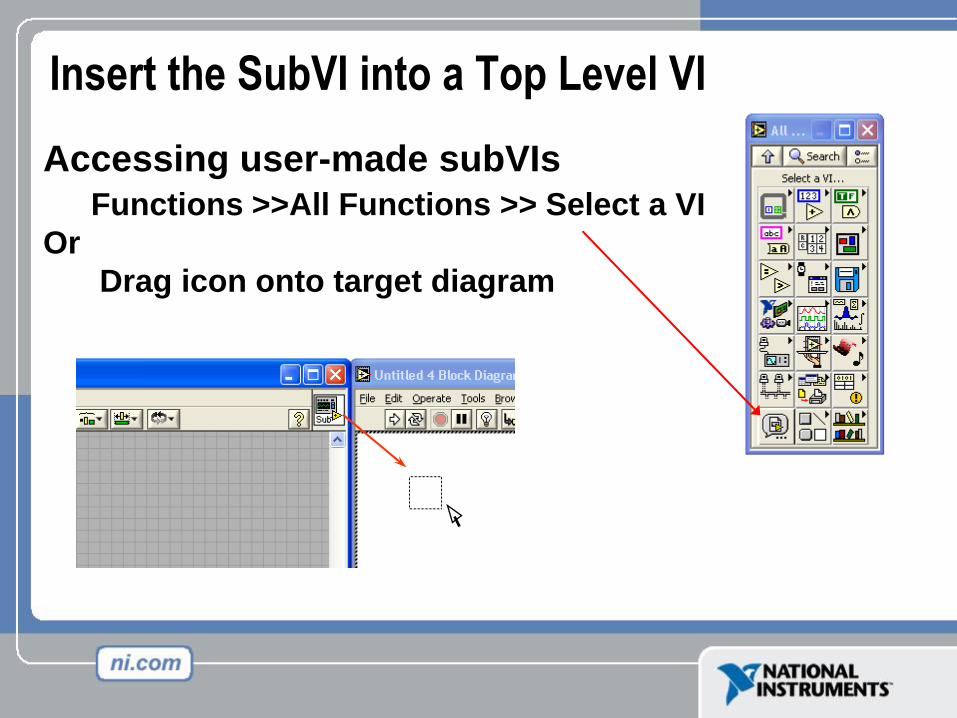
Insert the SubVI into a Top Level VI
Accessing user-made subVIs
Functions >>All Functions >> Select a VI
Or
Drag icon onto target diagram
Section III – Loops and Charts
• For Loop
• While Loop
• Charts
• Multiplots
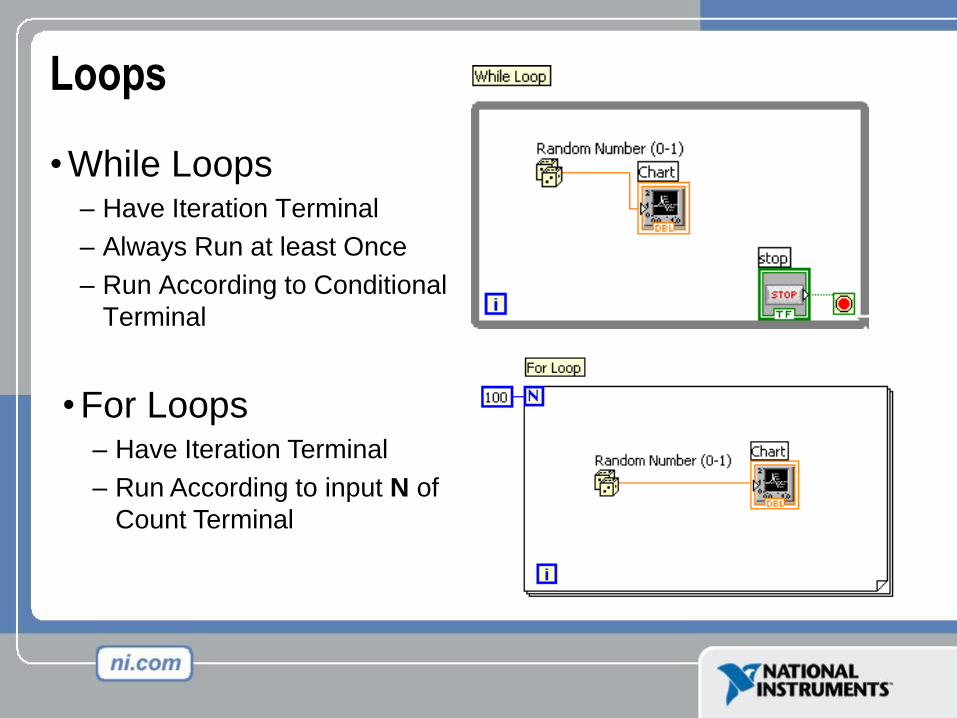
Loops
• While Loops– Have Iteration Terminal
– Always Run at least Once
– Run According to Conditional
Terminal
• For Loops– Have Iteration Terminal
– Run According to input N of
Count Terminal
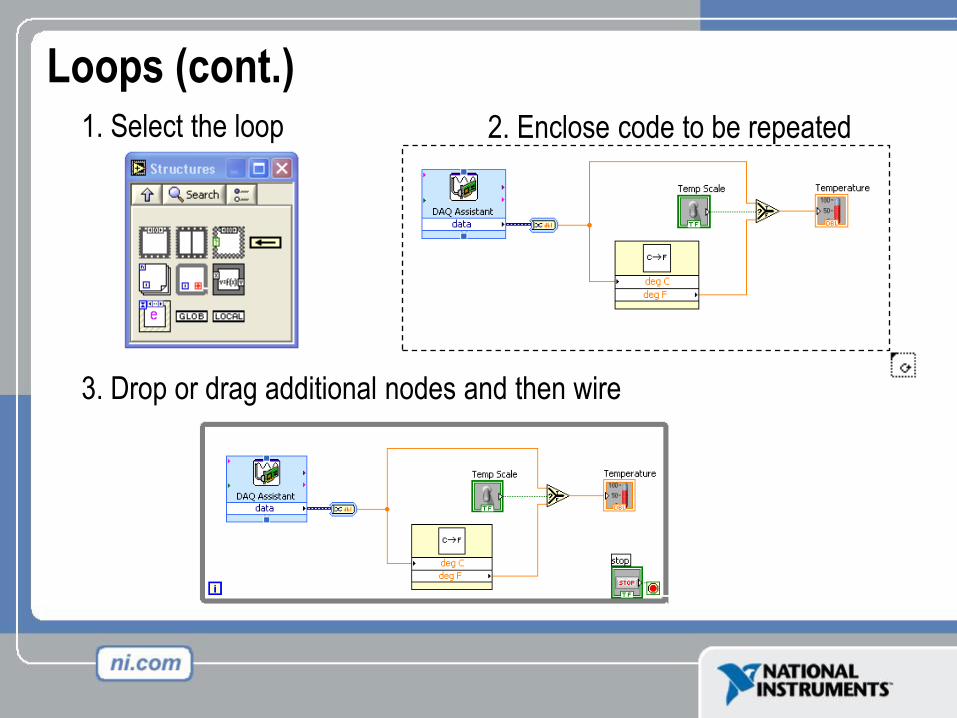
Loops (cont.)1. Select the loop 2. Enclose code to be repeated
3. Drop or drag additional nodes and then wire
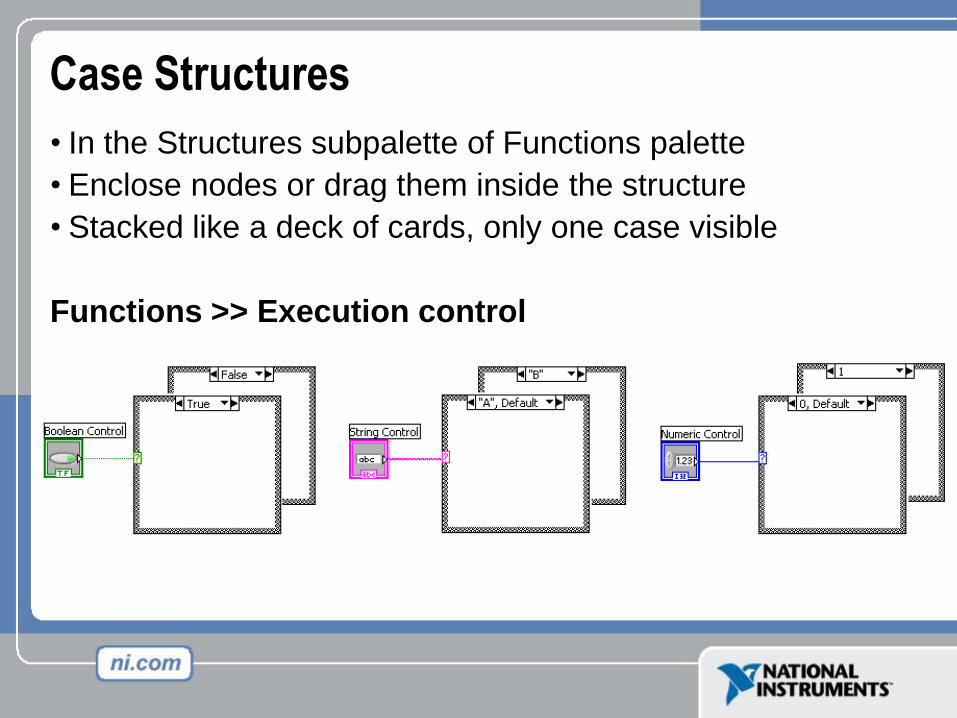
Case Structures
• In the Structures subpalette of Functions palette
• Enclose nodes or drag them inside the structure
• Stacked like a deck of cards, only one case visible
Functions >> Execution control
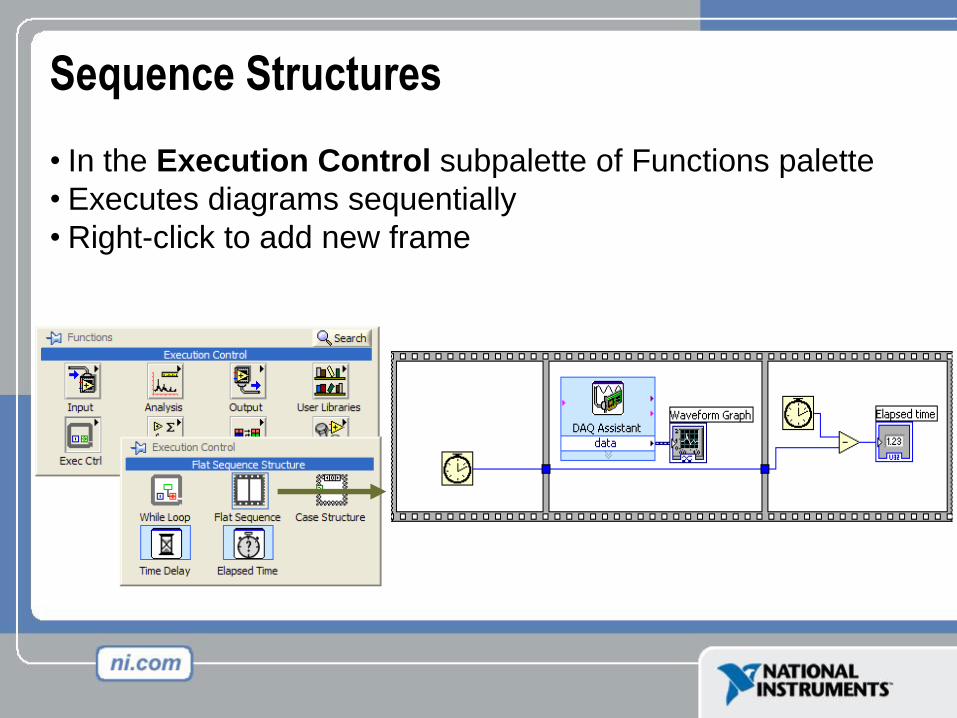
Sequence Structures
• In the Execution Control subpalette of Functions palette
• Executes diagrams sequentially
• Right-click to add new frame
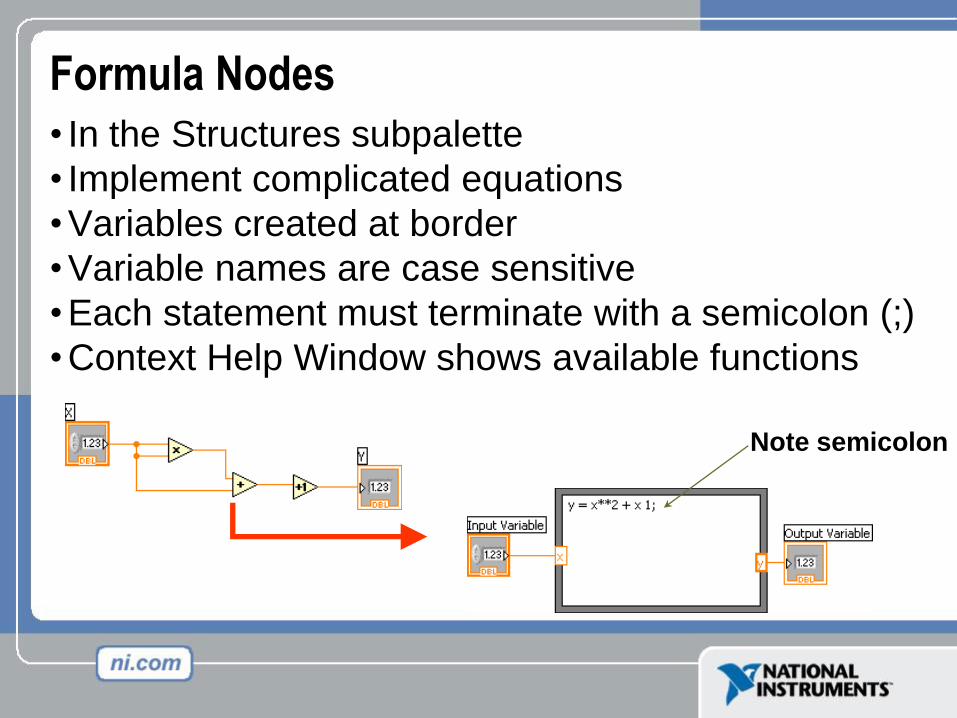
Formula Nodes
• In the Structures subpalette
• Implement complicated equations
• Variables created at border
• Variable names are case sensitive
• Each statement must terminate with a semicolon (;)
• Context Help Window shows available functions
Note semicolon
Section V – Arrays and Graphs
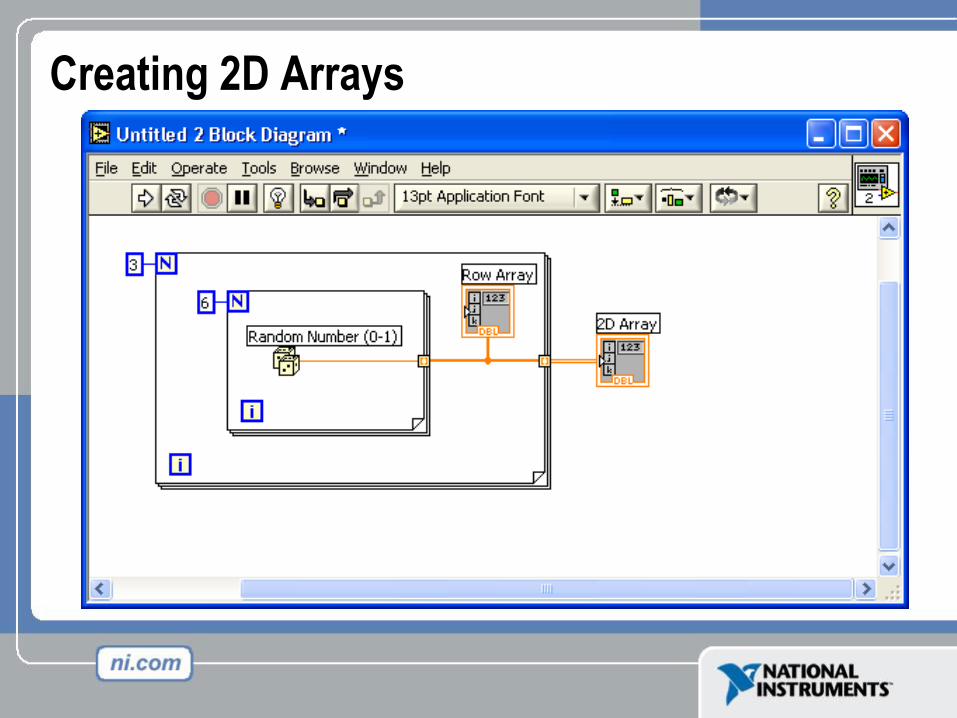
• Have LabVIEW build arrays automatically by
wiring a scalar (single value) to the edge of
For/While loop
• Multi Plot graphs
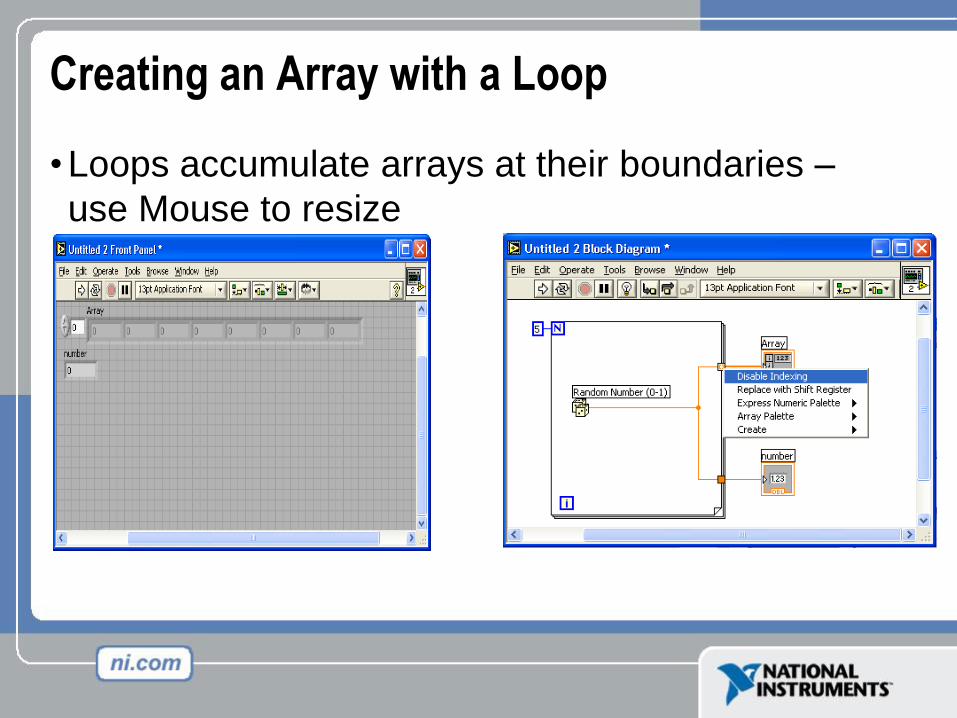
Creating an Array with a Loop
• Loops accumulate arrays at their boundaries –
use Mouse to resize
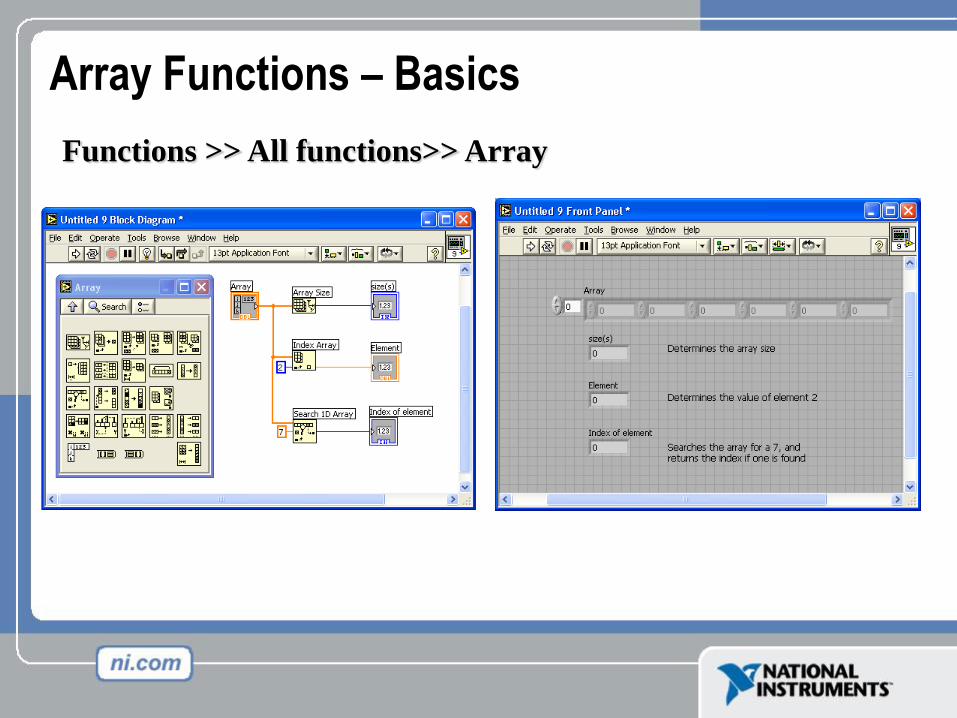
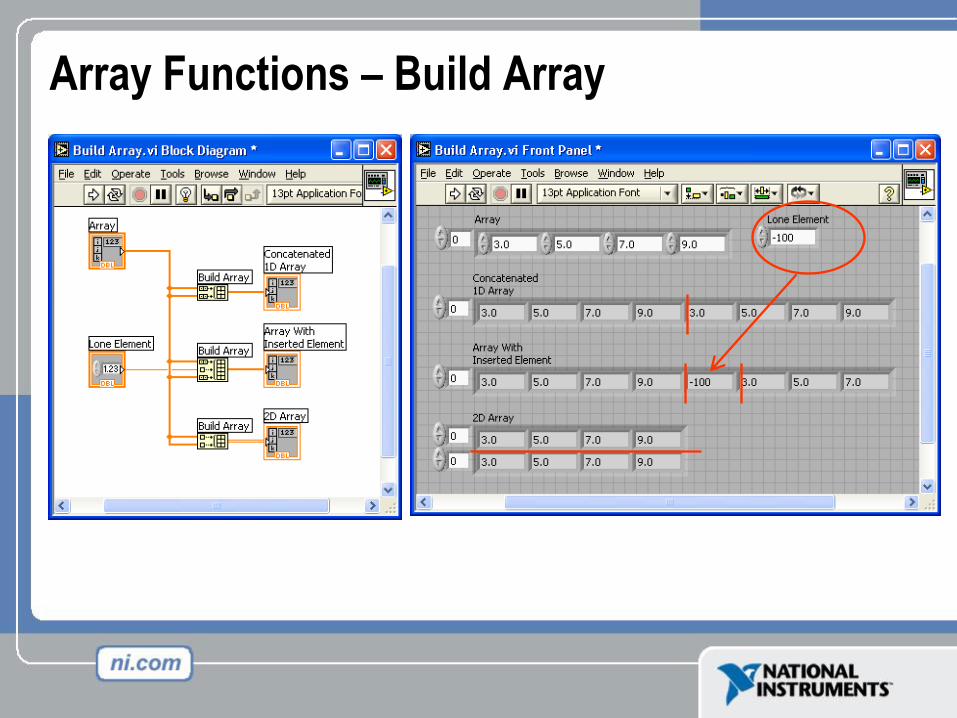
Array Functions – Basics
Functions >> All functions>> Array
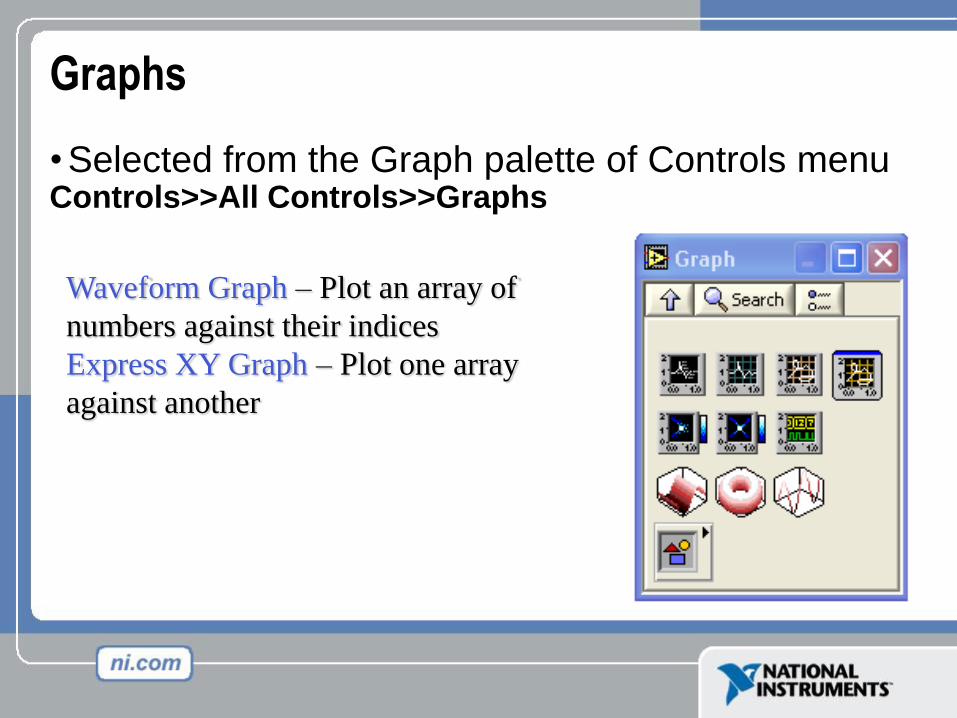
Graphs
• Selected from the Graph palette of Controls menuControls>>All Controls>>Graphs
Waveform Graph – Plot an array of
numbers against their indices
Express XY Graph – Plot one array
against another
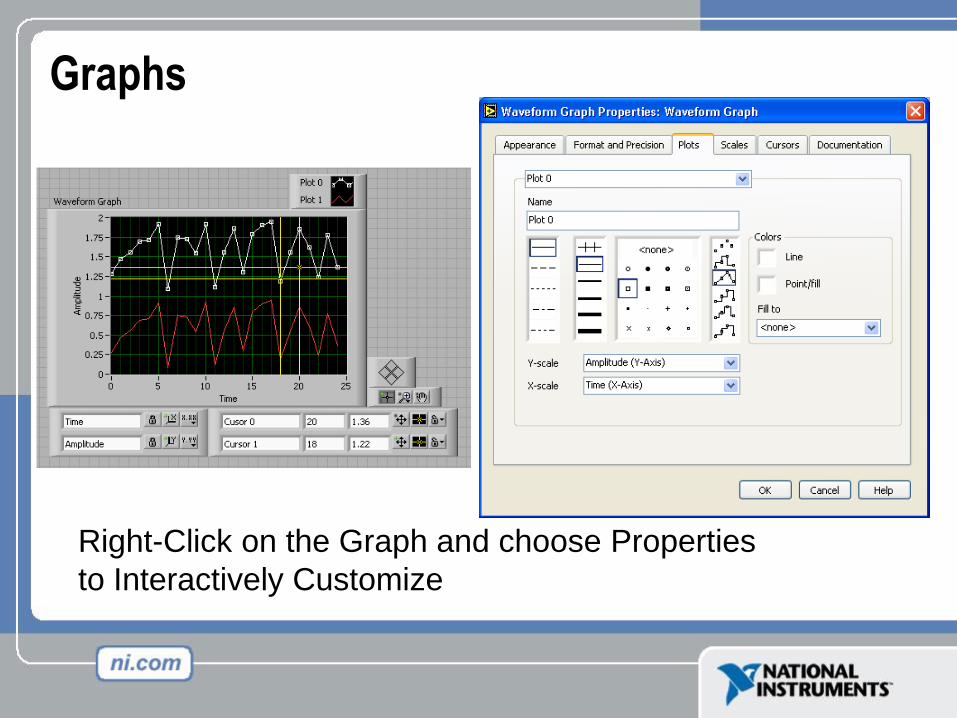
Graphs
Right-Click on the Graph and choose Properties
to Interactively Customize
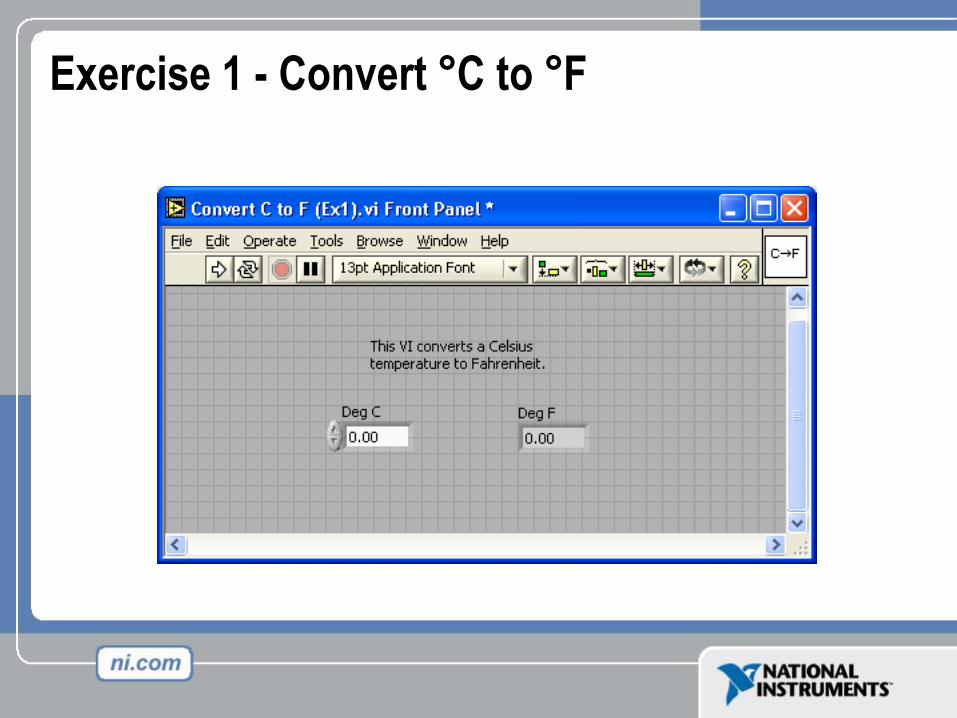
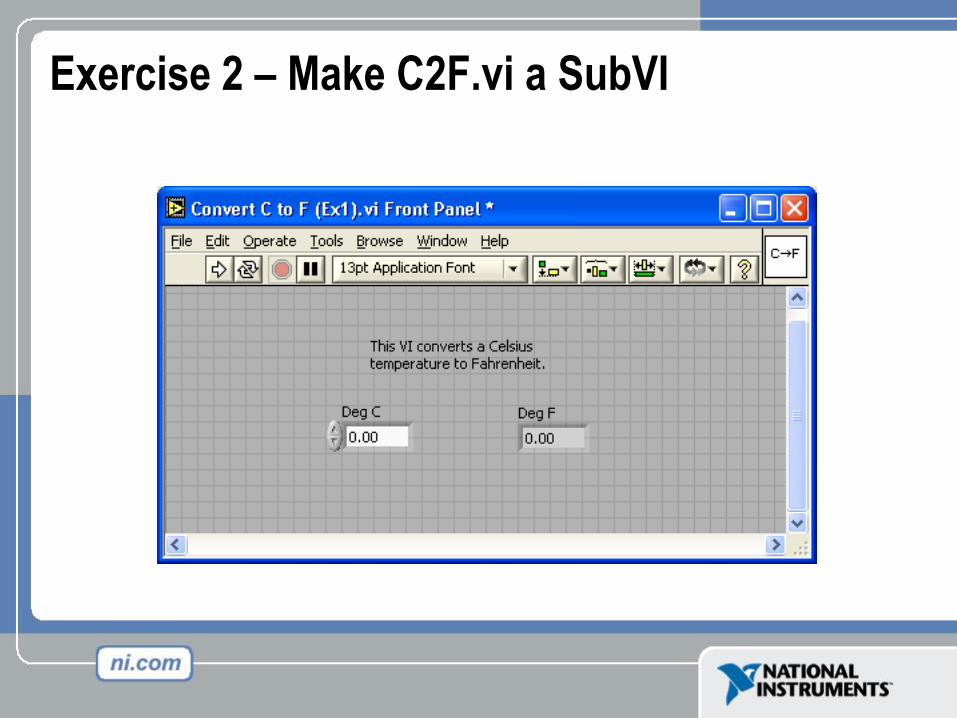
Exercise 3 – Instantiate C2F.vi in a Top Level
VI•Start with Block Diagram from Slide 39
•Add a case structure for Random * 100 or i (iteration counter from the
inner loop). Create a control to switch between the 2 cases.
•Instantiate C to F SubVI in the I case and use I as the Celsius input.
•Add graphs for the 1D and 2D outputs
•Turn on Dots to show how many points in each trace
•Execution Highlighting