Embed Size (px)
Citation preview

Special Issue Article
Proc IMechE Part H:J Engineering in Medicine2017, Vol. 231(5) 432–443� IMechE 2016Reprints and permissions:sagepub.co.uk/journalsPermissions.navDOI: 10.1177/0954411916673674journals.sagepub.com/home/pih
Virtual flow-diverter treatmentplanning: The effect of deviceplacement on bifurcation aneurysmhaemodynamics
Thomas Peach, Katerina Spranger and Yiannis Ventikos
AbstractBifurcation aneurysms account for a large fraction of cerebral aneurysms and often present morphologies that rendertraditional endovascular treatments, such as coiling, challenging and problematic. Flow-diverter stents offer a potentiallyelegant treatment option for such aneurysms, but clinical use of these devices remains controversial. Specifically, thedeployment of a flow-diverter device in a bifurcation entails jailing one or more potentially vital vessels with a low-porosity mesh designed to restrict the flow. When multiple device placement configurations exist, the most appropriateclinical decision becomes increasingly opaque. In this study, three bifurcation aneurysm geometries were virtually treatedby flow-diverter device. Each aneurysm was selected to offer two possible device deployment positions. Flow-diverterssimilar to commercially available designs were deployed with a fast-deployment algorithm before transient and steadystate computational fluid dynamics simulations were performed. Reductions in aneurysm inflow, mean wall shear stressand maximum wall shear stress, all factors often linked with aneurysm treatment outcome, were compared for differentdevice configurations in each aneurysm. In each of the three aneurysms modelled, a particular preferential device place-ment was shown to offer superior performance with the greatest reduction in the flow metrics considered. In all thethree aneurysm geometries, substantial variations in inflow reduction (up to 25.3%), mean wall shear stress reduction(up to 14.6%) and maximum wall shear stress reduction (up to 12.1%) were seen, which were all attributed to deviceplacement alone. Optimal device placement was found to be non-trivial and highly aneurysm specific; in only one-third ofthe simulated geometries, the best overall performance was achieved by deploying a device in the daughter vessel withthe highest flow rate. Good correspondence was seen between transient results and steady state computations thatoffered a significant reduction in simulation run time. If accurate steady state computations are combined with the fast-deployment algorithm used, the modest run time and corresponding hardware make a virtual treatment pipeline in theclinical setting a meaningful possibility.
KeywordsCardiovascular implants, haemodynamics, tubes and flow: haemodynamics, velocity: haemodynamics, modelling/simula-tion (Biomechanics)
Date received: 6 June 2016; accepted: 20 September 2016
Introduction
Flow-diverters (FDs) offer a unique and elegant treat-ment option for cerebral aneurysms at risk of growthor rupture. After a FD device has been deployed, theentire cerebral vessel is effectively reconstructed as thedevice endothelialises and isolates the aneurysm dome,leading to thrombosis and eventual aneurysm shrinkageand reabsorption.1 Currently, FDs are recommendedfor treatment of aneurysms where alternative endovas-cular (coiling) or surgical (clipping) treatments areunfeasible or have previously failed.1 However,
aneurysms located at vessel bifurcations, which accountfor the majority of cerebral aneurysms by some esti-mates,2 are also thought to be amenable to treatmentby FD device.3,4
Department of Mechanical Engineering, University College London,
London, UK
Corresponding author:
Thomas Peach, Department of Mechanical Engineering, University
College London, London WC1E 6BT, UK.
Email: [email protected]

Bifurcation aneurysms present a potentially signifi-cant, and entirely irreversible, clinical choice whentreatment by FD has been selected: in which daughtervessel should the device be placed and therefore whichdaughter vessel(s) should be jailed with the device?Such a decision is far from trivial, and a number ofcompeting factors must be weighed. For instance, thehaemodynamic environment in and around bothtreated and untreated bifurcation aneurysms is oftenhighly complex;5,6 small differences in daughter vesseldiameter and angle may alter the effective length andporosity of the deployed FD;7,8 reduced flow to jaileddaughter vessels may result in the loss of vesselpatency9,10 and collateral flow to jailed daughter vesselsmay prevent aneurysm occlusion.11 As such, bifurca-tion aneurysm treatment by FD remains rare and con-troversial.12–15
Modelling of aneurysm treatment, and specificallythrombus genesis and growth, is a highly complex pro-cess.16–18 Although animal models go some waytowards capturing the complex biochemistry involved,the aneurysms created in these models are often rudi-mentary in their morphology and offer little value forpatient-specific treatment planning.11,19,20
Consequently, a number of surrogate measuresextracted from patient-specific computational fluiddynamics (CFD) models are often correlated with like-lihood of thrombus growth. Reduction in aneurysminflow is linked to increased blood residence time in theaneurysm dome and corresponding platelet and fibrinaggregation.21,22 The role of wall shear stress (WSS) inaneurysm treatment is more complex with extremes ofboth high- and low-WSS linked to negative out-comes.2,5,23,24 However, a number of biochemical mod-els correlate an overall reduction in WSS with plateletdeposition and thrombosis growth.25,26 But, such heur-istics should be viewed cautiously with studies in the lit-erature also suggesting that both spatial and temporalvariations in WSS distribution, including local jettingand harmonic frequencies, may also play a significantrole in thrombus initiation and growth.27–29
In this study, three basilar artery bifurcation aneur-ysms are examined with CFD models, and the effects ofdifferent FD configurations on aneurysm inflow reduc-tion and changes in mean WSS and peak WSS are eval-uated. Each aneurysm geometry was chosen to haverelatively symmetric-sized daughter vessels (posteriorcerebral arteries), thus rendering the treatment decisionof where to deploy a FD device non-obvious.
Methodology
Three bifurcation aneurysm geometries located at thebasilar tip were selected and segmented from MagneticResonance Angiography (MRA) data in OsiriX (OsiriXv.4.1.1, Freeware) and converted to stereolithography(STL) format. The geometries were imported into blen-der (Stichting Blender Foundation, Amsterdam, The
Netherlands) and were trimmed to result in vessellengths of around five vessel diameters distal and proxi-mal to the aneurysm location, as shown in Figure 1.
A generic FD device (shown in Figure 2) was createdwith 70% porosity and both a mesh design and wirediameter are similar to the two devices commonly usedclinically: the Silk Flow Diverter (SILK; BaltExtrusion, Montmorency, France) and the PipelineEmbolization Device (PED; Covidien/Medtronic,Minneapolis, MN, USA).
Device deployment
Device deployment was completed with an in-housefast-deployment algorithm based on a spring analogyand implemented in MATLAB (Mathworks, Natick,MA, USA) and Blender, the details of which have beenpreviously reported by the authors25,30 and are notgiven here for the sake of brevity. Briefly, the device isfirst converted to a centreline representation, com-pressed radially, and aligned with the vessel to mimicthe device sheathed by a catheter. The radial compres-sion of the device is then relaxed progressively along itslength in an action similar to unsheathing. The deviceattempts to expand to its stress-free diameter and isopposed by the vessel wall. An offset in the device con-tact condition then allows for thickness to be addedback to the deployed centreline configuration, yieldingthe three-dimensional (3D) device in its deployed posi-tion. The deployed device is finally trimmed by remov-ing the lengths in the parent and daughter vessels (asshown in Figure 2), in order to reduce the size of subse-quently generated CFD meshes, and to improve theoverall computational efficiency.
A FD device was deployed in each aneurysm geome-try in two different positions, as shown in Figure 2, cor-responding to each Posterior Cerebral Artery (PCA).Device equilibrium was achieved in less than 200 itera-tions of the deployment algorithm and in near real time.Device sizing was chosen following the SILK and PEDmanufacturers’ guidance.
Meshing and solver setup
The aneurysm geometries with and without devicesdeployed were meshed using CFD-VisCART (ESIGroup, Paris, France) using a projected single domainconforming unstructured mesh, an Omnitree Cartesiantree type and three near-wall Cartesian layers to give asmooth and well-resolved boundary definition. Themeshes were then imported into the multi physics suiteCFD-ACE+ (ESI Group).
Blood was modelled as an incompressible fluid withunsteady 3D Navier–Stokes governing equations thatwere solved following the finite volume approach, witha central differencing scheme for spatial differentiationsand interpolations, as well as a Crank–Nicolsonsecond-order scheme for time-marching. The SIMPLE-Consistent (SIMPLEC) pressure correction method31,32
Peach et al. 433
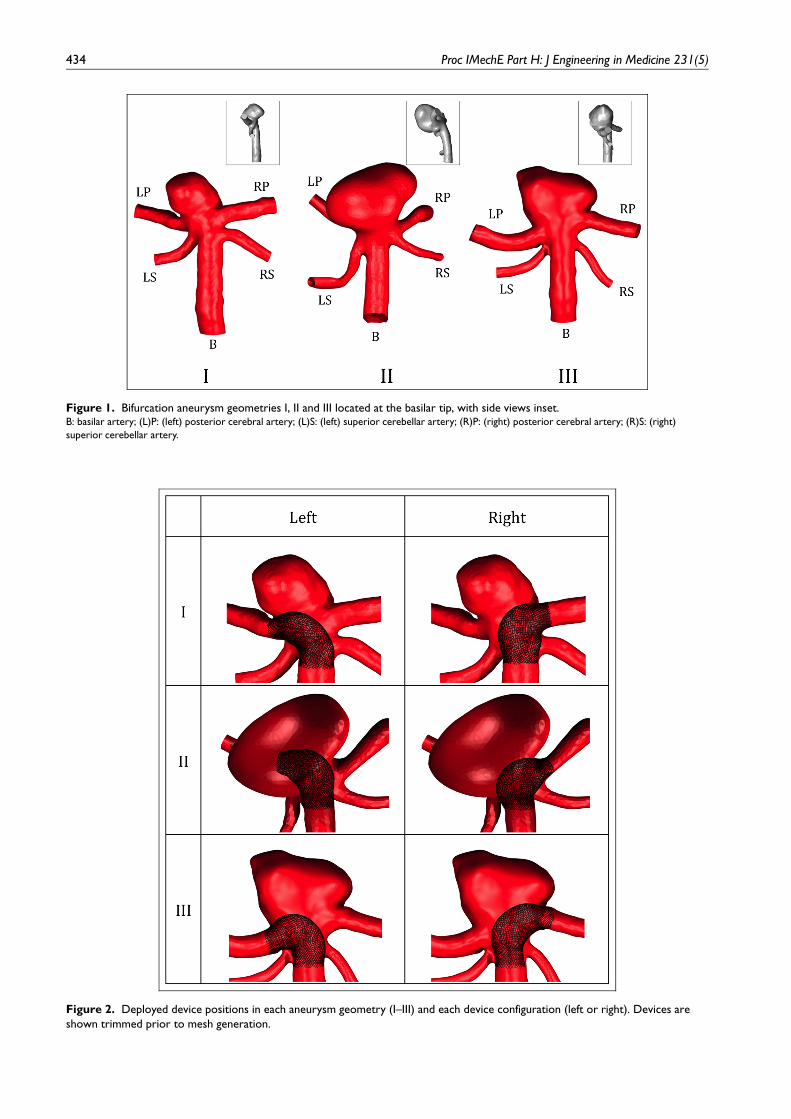
Figure 1. Bifurcation aneurysm geometries I, II and III located at the basilar tip, with side views inset.B: basilar artery; (L)P: (left) posterior cerebral artery; (L)S: (left) superior cerebellar artery; (R)P: (right) posterior cerebral artery; (R)S: (right)
superior cerebellar artery.
Figure 2. Deployed device positions in each aneurysm geometry (I–III) and each device configuration (left or right). Devices areshown trimmed prior to mesh generation.
434 Proc IMechE Part H: J Engineering in Medicine 231(5)

and an algebraic multigrid method for convergenceacceleration33 were used. Given previous studies in theliterature that confirmed the non-Newtonian effects ofblood to be small in the cerebral circulation,34,35 bloodis modelled as a Newtonian fluid with a density of1000 kg/m3 and a dynamic viscosity of 0.004Pa s.Arterial walls were modelled as rigid, with the effect ofsuch an assumption on flow patterns having beenshown to be negligible.36 A no-slip boundary conditionwas imposed on both the vessel walls and device struts.
Both steady state and transient computations wereperformed assuming a mean flow rate of 120ml/min, acardiac profile based on that reported by Valenciaet al.,35 and a heart rate of 75BPM. In both cases,Poiseuille flow was assumed, and a parabolic, radiallysymmetric velocity profile was prescribed at each geo-metry inlet along with a constant pressure boundarycondition at all outlets. A constant time-step of 0.001 swas used across all transient computations with threecardiac cycles simulated. Results were obtained fromthe third cycle only, to reduce the effects of initialtransients.
Inlet Reynolds numbers in the range of 221–270 wereseen across the steady state simulations. For the transi-ent simulations, mean inlet Reynolds numbers in therange of 221–270 were observed with an instantaneousvalue of 192–405. The relatively small inlet Womersleynumbers (1.68–1.89) confirmed little departure in tran-sient velocity profile from the parabolic steady statecase.
Post-processing
A plane was placed at the aneurysm neck in each geo-metry through which aneurysm inflow was measured.This plane also served to separate the aneurysm domefrom the parent vasculature with aneurysm WSS thencalculated on the aneurysm surface distal of the inletplane. Transient simulation results were reported asboth the mean, calculated by averaging distributionstaken at 0.02 s intervals, and the range over the cardiaccycle.
Mesh independence
The CFD simulations in this study are particularly sen-sitive to mesh refinement, as the deployed FD devicehas a very fine construction (;35mm wire diameterand ;200mm typical pore size) over which large velo-city gradients are present. As such, a comprehensivemesh-independence study was performed to evaluateany mesh-induced discretisation error in the key metricsused to evaluate device performance.
Meshes of all three aneurysm geometries with andwithout devices deployed were created with approxi-mate minimum mesh densities in the range of 50–50,000 cells/mm3, which resulted in mesh sizes of 0.088–28.0million cells. Steady state computations at meanflow rate were performed for each mesh density across
all three geometries using the same solver parameterspreviously detailed. The relative reduction in aneurysminflow (Qin), mean aneurysm WSS (WSSmean) and max-imum aneurysm WSS (WSSmax) for each mesh densityin each aneurysm and device combination are detailedin Figures 3–5, respectively.
From the figures, it can be assumed that simulationsconducted with a minimum mesh density around4000 cells/mm3 result in less than 1% variation in Qin
and WSSmax and less than 2% variation in WSSmean,due to mesh discretisation effects alone. Mesh refine-ment to this level produced meshes of between 2.88 and14.7 million cells for the aneurysm geometries with andwithout a device deployed. Details of the mesh cell sizeand refinement near the device struts are shown inFigure 6 for the level of mesh-independence discussed.This level of mesh refinement is consistent with previ-ous mesh-independence studies conducted by theauthors for both steady state and transientcomputations.25
Solution time-step independence for the transientcomputations was also assumed at a time-step of 0.001 s,as previously detailed. No appreciable difference wasobserved in the metrics discussed above for solutionsconducted at time-steps of 0.01–0.001 s, in line with simi-lar studies by the authors reported elsewhere.25 In thisparticular study, the greatest computational efficiencywas achieved with the 0.001-s time-step.
Results and discussion
The corresponding reductions in aneurysm inflow (Qin),mean WSS (WSSmean) and maximum WSS (WSSmax)for each geometry and device combination are plottedin Figures 7–9, respectively. Across all three metricsplotted in the figures, it is apparent that the steady statesolution (indicated in red) offers a good approximationto the mean transient distribution (in blue), despitearound a 50-fold reduction in computational load.
Figure 3. Aneurysm inflow reduction mesh independenceshowing \ 1% variation in inflow at a minimum mesh densitygreater than approximately 4000 cells/mm3.
Peach et al. 435

Transient variation in the reduction of both aneur-ysm inflow and WSS (indicated in black for Figures7–9) is relatively similar across all aneurysm anddevice combinations. In all cases, the lowest reduc-tion is seen at maximum parent vessel flow rate (peaksystole) and the greatest reduction is seen at
minimum parent vessel flow rate. These two condi-tions correspond to approximately 150% and 87% ofmean parent vessel flow rate, respectively, with a sim-ilar degree of asymmetry then seen in the correspond-ing variation about the mean percentage reduction ineach case.
Figure 4. Aneurysm mean WSS reduction mesh independence showing \ 2% variation in inflow at a minimum mesh densitygreater than approximately 4000 cells/mm3.
Figure 5. Aneurysm maximum WSS reduction mesh independence showing \ 1% variation in inflow at a minimum mesh densitygreater than approximately 4000 cells/mm3.
436 Proc IMechE Part H: J Engineering in Medicine 231(5)

In Figure 7, substantial differences in inflow reduc-tion, dependent on device position alone, are seen intwo aneurysms: a difference of 25.3% for Aneurysm Iand 5.5% for Aneurysm II. No significant difference(\ 1%) in inflow reduction is seen in Aneurysm III. Itis particularly striking that with a device deployed inthe left and right daughter vessels, respectively,Aneurysm I offers both the highest and lowest inflowreductions seen across all the simulation results.
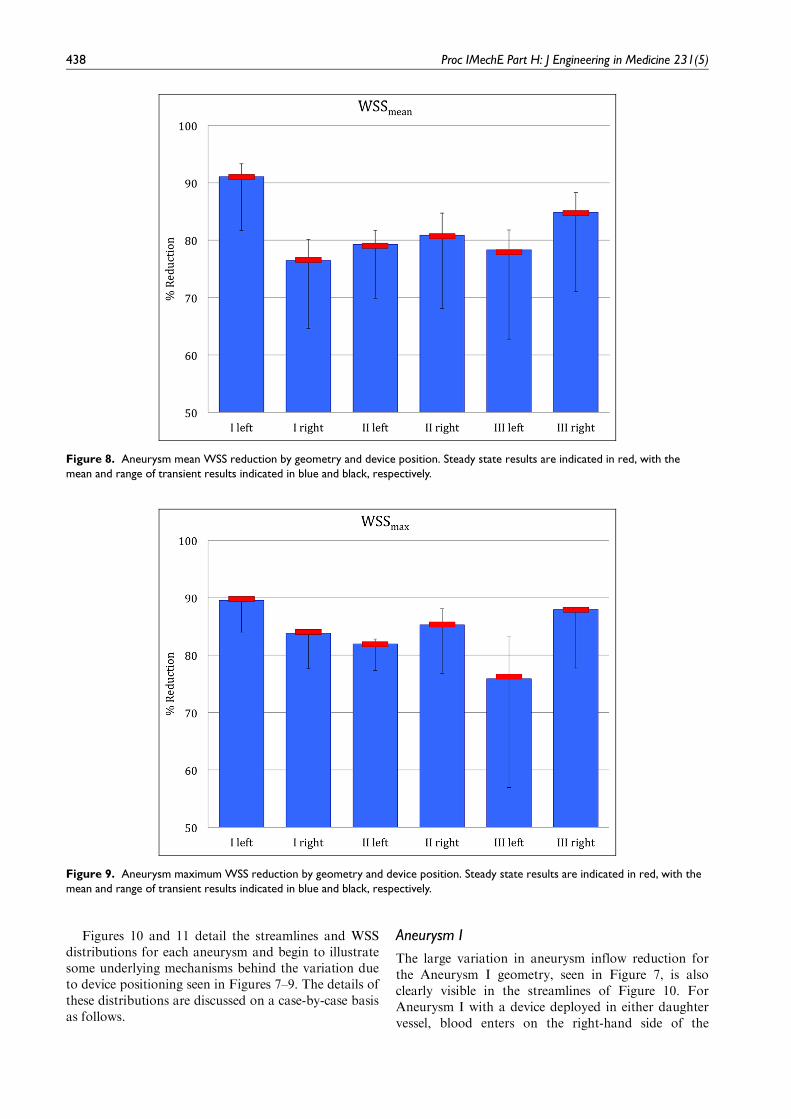
Although less variation is seen in mean WSS reduc-tion across the aneurysm and device combinations(shown in Figure 8), the differences of 14.6% and 6.5%for Aneurysms I and III, respectively, are still notable.
The corresponding differences in maximum WSSreduction (Figure 9) are more modest still, at 5.7%,3.3% and 12.1% for Aneurysms I, II and III, respec-tively, but an emerging pattern of a more successfuldevice placement position in each aneurysm is furtherreinforced.
Overall, the percentage reduction in both measuresof WSS is consistently higher (. 75% in all cases) thanthe reduction in aneurysm inflow achieved, whichranges from approximately 45% to 70%. Across allthree aneurysms, one configuration of device placementappears to offer better performance in each case: theleft configuration for Aneurysm I, and the right config-uration for Aneurysms II and III. In each case (exclud-ing Aneurysm III Qin and Aneurysm II WSSmean), thispreferential configuration significantly reduces eachmetric examined. As such, these preferential devicepositions may then translate to an increased probabilityof aneurysm thrombosis and successful treatment out-come although such an assertion is currently unverified.
Across all three aneurysm geometries, both with andwithout a device deployed, one of the two daughter ves-sels considered is dominant and transports a largeroverall fraction of the parent vessel flow rate, as shownin Table 1. The variation due to device positioning inthe proportion of flow exiting each daughter vessel isvery small (\ 2% of the total flow rate in all cases).Interestingly, the preferential device configuration forboth Aneurysms I and III corresponds to deploying theFD device in the non-dominant daughter vessel with alower overall fraction of outflow.
Figure 6. Details of mesh cell size and refinement at flow-diverter device struts for the ‘mesh independent’ meshdiscussed.
Figure 7. Aneurysm inflow reduction by geometry and device position. Steady state results are indicated in red, with the mean andrange of transient results indicated in blue and black, respectively.
Peach et al. 437
Figures 10 and 11 detail the streamlines and WSSdistributions for each aneurysm and begin to illustratesome underlying mechanisms behind the variation dueto device positioning seen in Figures 7–9. The details ofthese distributions are discussed on a case-by-case basisas follows.
Aneurysm I
The large variation in aneurysm inflow reduction forthe Aneurysm I geometry, seen in Figure 7, is alsoclearly visible in the streamlines of Figure 10. ForAneurysm I with a device deployed in either daughtervessel, blood enters on the right-hand side of the
Figure 8. Aneurysm mean WSS reduction by geometry and device position. Steady state results are indicated in red, with themean and range of transient results indicated in blue and black, respectively.
Figure 9. Aneurysm maximum WSS reduction by geometry and device position. Steady state results are indicated in red, with themean and range of transient results indicated in blue and black, respectively.
438 Proc IMechE Part H: J Engineering in Medicine 231(5)

aneurysm but then exits in the direction correspondingto the un-stented daughter vessel. Consequently, flow isboth entering and exiting the aneurysm in the sameregion in the Left configuration, which appears to sub-stantially reduce the degree to which higher speed(;0.25ms21) flow penetrates the aneurysm dome. Bycontrast, in the Right device configuration, almost allflow enters the aneurysm dome on the right, circulates
throughout the entire aneurysm dome and then exitsthrough the un-stented left daughter vessel.
The variation in Qin reduction seen between deviceconfigurations for Aneurysm I may be due to differencein apparent porosity of the device, which is dependenton both the degree of device opening and the incidentangle at which flow strikes the device mesh. In the Leftconfiguration, flow at the aneurysm neck appears to
Table 1. Percentages of total mean flow exiting each daughter vessel with no device deployed and by deployed device configuration(left and right).
no device Left Right
Left Right Others Left Right Others Left Right Others
Aneurysm I 32.0 40.0 28.0 34.8 ( + 8.75) 41.3 ( + 3.25) 23.9 (214.6) 34.3 ( + 7.19) 41.2 ( + 3.00) 24.5 (212.5)Aneurysm II 31.2 43.6 25.2 30.9 (20.96) 43.5 (20.23) 25.6 ( + 1.59) 31.8 ( + 1.92) 44.8 ( + 2.75) 23.4 (27.14)Aneurysm III 46.5 35.8 17.7 47.9 ( + 3.01) 36.7 ( + 2.51) 15.4 (213.0) 48.3 ( + 3.87) 34.9 (22.51) 16.8 (25.08)
The relative increase or decrease in vessel flow rate from the no device case is also indicated in parentheses.
Figure 10. Flow streamlines for transient simulations shown at mean flow rate by geometry and device position. Inflow (red) andoutflow (blue) regions of the aneurysm inlet plane are also shown.
Peach et al. 439

strike the device at a shallower angle than for theRight, thereby increasing the device’s relative porosity.Similarly, in the Right case, the wider ostium of theright-hand daughter vessel may result in greater deviceopening and lower device porosity locally, preciselywhere significant aneurysm inflow occurs.
However, the inflow reduction seen for Aneurysm Idoes not appear to be explained by porosity alone. Theproportion of overall flow in each stented daughter ves-sel, 34.8% and 41.2%, respectively for the Left andRight cases, implies that more flow passes through thedevice mesh in the Left case: 65.3% versus 58.8%. But,a lower proportion of the flow passing through thedevice then enters aneurysm dome in the Left case, aphenomenon that appears to be dictated by the aneur-ysm geometry and overall flow environment. Overall,Aneurysm I has the least-symmetric aneurysm domeand, correspondingly, the least-symmetric aneurysmflow pattern. Although not included in the figure, asimilar flow pattern to the Right configuration wasobserved when no device was deployed in the aneurysmgeometry.
The WSS distributions in Aneurysm I follow a simi-lar pattern to the flow streamlines for the correspond-ing device positions. For mean WSS value, the Left andRight device configurations again represent the highestand lowest reductions, respectively, seen across allaneurysms. As shown in Figure 11, there are significant
spatial differences in the aneurysm WSS distributionsfor the Left and Right configurations. This difference ismost stark on the front face of the aneurysm dome(left-hand image of each pair), wherein the Left config-uration local flow stasis has reduced the WSS to verynear zero across the entire surface. Overall, in bothdeployment positions, the device reduces the entireaneurysm WSS distribution to a magnitude consideredphysiologically normal.
Aneurysm II
The inflow patterns of Aneurysm II are very similaracross the Left and Right configurations, as shown inFigure 10. In both cases, higher-velocity flow enters inthe neck region towards the back-face of the aneurysm,and this flow then circulates through the entire aneur-ysm dome as a single vortex before exiting along thefront edge of the aneurysm neck. In each case, themajority of the blood leaving the aneurysm appears todo so in the direction of the corresponding un-stenteddaughter vessel.
The angle at which flow strikes the device mesh andthe daughter vessel ostium, and hence the effectivedevice porosity, appears similar for both device config-urations. Thus, the relatively small 5.5% difference inQin reduction seen between the Left and Right config-urations may not be the result of porosity differences,
Figure 11. WSS distributions for transient simulations shown at mean flow rate by geometry and device position (front and backviews).
440 Proc IMechE Part H: J Engineering in Medicine 231(5)

but the different fractions of flow exiting via eachdaughter vessel alone. As shown in Table 1, a largerfraction of the overall flow passes through the devicemesh in the Left compared to the Right configurations(69.1% vs 55.2%). Hence, given the very similar overallflow regimes between the two configurations, it seemslogically more flow would then enter the aneurysmoverall in the Left configuration and thereby reduce thedevice’s Qin reduction.
The WSS distributions for each deployed deviceposition also appear almost identical, which correlateswith the insignificant difference in mean WSS reductiondetailed in Figure 8. Although slightly elevated areas ofWSS are common to both device configurations, ineach case the elevated areas are shifted marginallyaway from the stented daughter vessel, especially at theaneurysm neck. These areas of higher WSS occur inregions where flow exits the aneurysm dome via the un-stented daughter vessel. In both the Left and Rightdevice configurations, peak WSS values are located inthese regions and adjacent to the un-stented daughtervessel in each case. As in the case of Aneurysm I, bothdevice positions reduce the WSS in the entirety of theaneurysm dome to values considered physiologicallynormal.
Aneurysm III
For Aneurysm III, the inflow streamlines are also simi-lar regardless of device positioning, as shown inFigure 10. Broadly, flow enters the aneurysm in thefront-central portion of the neck and circulates towardsthe back face in two vortices that are aligned with thelobes of the aneurysm dome. A very similar flow pat-tern was also seen in the no device case, which is notincluded in the figure for brevity.
Again, flow appears to exit the aneurysm primarilyin the direction of the un-stented vessel. Although moreof the total flow passes through the device mesh in theRight configuration (65.1% vs 52.1%), a significantfraction of the flow moves directly into the un-stented(left) daughter vessel in this case. By contrast, the flowenters the un-stented (right) daughter vessel in the Leftconfiguration almost entirely via the aneurysm dome.Hence, as in the case of Aneurysm I, although moreflow passes through the device mesh in the preferential
configuration, the local flow environment results in asmaller fraction of this flow entering the aneurysmdome.
Despite a very similar inflow reduction between theLeft and Right configurations, the flow entering theLeft geometry does so with a more pronounced jet,which penetrates further into the aneurysm geometry(Figure 10). This more coherent jet structure results inlocally increased WSS due to impact at the tip of theaneurysm in the Left configuration, clearly visible inFigure 11. The more favourable reductions in bothmean and maximum WSS achieved by the devicedeployed in the Right configuration appear to be adirect result of more effective suppression of this inflowjet. For Aneurysm III, as in all other cases, the deploy-ment of a FD in either daughter vessel reduces theWSS distribution in the aneurysm dome to a range con-sidered physiologically normal.
Across all three aneurysm geometries, an increase intotal flow delivered to both daughter vessels considered(left and right) occurs following device deployment ineither configuration in all but one case: Aneurysm IILeft. It appears in the remaining five cases flow to theother two daughter vessels (LS and RS in Figure 1 andreferred to collectively as ‘Others’ in Table 1) is reducedby 5.08%–14.6%. These ‘Others’ vessels are jailed in alldevice configurations and are both smaller in diameterthan the left and right vessels, and are orientated at amore obtuse angle to the flow direction – factors thatappear to exacerbate the effects of jailing. By contrast,there does not appear to be a correlation between pla-cement of a device in a vessel and a correspondingincrease in vessel flow rate for the left and right vessels.
Finally, a summary of the simulation workflow com-pleted is detailed in Table 2, with estimates of the corre-sponding execution time for each stage of the virtualtreatment pipeline. A complete virtual treatment case(with and without a device deployed) may be simulatedin less than 5 h, with a steady state calculation and anassumption of a solution mesh independence of thelevel discussed. Comparing two devices or two posi-tions of the same device would require around a further2.5 h.
The surprising, and perhaps counter-intuitive, flowpatterns induced by different device positions that havebeen elucidated in this study illustrate that optimal FD
Table 2. Simulation workflow with hardware and software setups and corresponding execution times.
Process Hardware Software Approximate execution time (h)
Segmentation/pre-processing 1 3 2.66 GHz CPU4 GB RAM
OsiriX (mac) 0.25
Device deployment 1 3 2.66 GHz CPU4 GB RAM
MATLAB (mac) 0.1
Mesh generationa 16 3 2.40 GHz CPUs32 GB RAM
CFD-VisCART (windows) 0.5
CFD solvera 32 3 2.80 GHz CPUs128 GB RAM
CFD-ACE + (Linux) 1.5 (steady); 75 (transient)
Post-processing 16 3 2.40 GHz CPUs32 GB RAM
CFD-VIEW + (windows) 0.25
CFD: computational fluid dynamics.aAssuming a mesh size equivalent to the level of mesh-independence previously detailed.
Peach et al. 441

placement is far from trivial. With the computationalframework proposed, accurate patient-specific simula-tions of multiple treatment options would be feasible inthe clinical setting with overnight computations onhigh-performance desktop hardware.
Study limitations
The results of this computational study should beviewed in the context of a number of limitations. Thesmall quantity of aneurysm geometries simulated imme-diately limits the generalisability of the study conclu-sions, and it is unclear whether the findings presentedare in any way representative. The use of average flowprofiles and flow rates in addition to uniform boundaryconditions at all outlets may be unrealistic and certainlyreduces the patient-specific nature of the simulations.In particular, the assumption of symmetric outletboundary conditions may be unrealistic, given thesubtle asymmetric flow patterns observed across allsimulated aneurysm geometries. Finally, as discussed insection ‘Introduction’, the flow metrics reported in thisstudy are considered surrogate measures that are linkedwith aneurysm thrombosis. However, the precise fac-tors governing aneurysm treatment outcome remainpoorly understood, rendering any predictions of signifi-cant difference in treatment outcome due to deviceposition entirely unverified.
Conclusion
In this study of virtual aneurysm treatment, substantialdifferences due to FD device position alone wereobserved for a number of haemodynamic metrics oftenlinked with positive clinical outcomes. In all cases, theflow environment in and around the aneurysm wasshown to be complex and non-trivial. In two-thirds ofthe aneurysms, the greatest reduction in the metrics wasachieved when a FD device was deployed in the non-dominant daughter vessel with a lower overall flow rate.Relatively, subtle differences in overall aneurysm mor-phology, and particularly the degree of aneurysm sym-metry, were shown to result in substantial changes inhaemodynamic environment following device deploy-ment. Although device jailing appears to reduce theflow rate in smaller daughter vessels that were angledaway from the flow direction, flow in larger vesselsappeared relatively unaffected by the device.
A larger study of the same virtual treatment proce-dure has the potential to elucidate the haemodynamicmechanisms underlying the high failure rate of bifurca-tion aneurysms treated by FD that are detailed in theliterature. For the aneurysms discussed, combiningsteady state CFD simulations with simplified devicedeployment techniques results in a computational loadsufficiently modest enough to make such predictions apossibility in the clinical setting.
Acknowledgements
The authors would like to thank Dr M. Megahed andthe ESI Group for allowing the use of the CFD-ACEsuite.
Declaration of conflicting interests
The author(s) declared no potential conflicts of interestwith respect to the research, authorship and/or publica-tion of this article.
Funding
The author(s) disclosed receipt of the following finan-cial support for the research, authorship, and/or publi-cation of this article: This work was supported by theEngineering and Physical Sciences Research Council(grant number: NS/A000008/1).
References
1. Byrne JV and Szikora I. Flow Diverters in the Manage-
ment of Intracranial Aneurysms: a review. EJMINT
Original Article, 2012: 1225000057 (22nd June 2012).2. Alfano J, Kolgega J, Natarajan SK, et al. Intracranial
aneurysms occur more frequently at bifurcation sites that
typically experience higher hemodynamic stresses. Neuro-
surgery 2013; 73(3): 497–505.3. Brinjikji W, Cloft HJ, Fiorella D, et al. Estimating the
proportion of intracranial aneurysms likely to be amen-
able to treatment with the pipeline embolization device. J
Neurointerv Surg, 2011, http://www.ncbi.nlm.nih.gov/
pubmed/22140137 (accessed 19 July 2012).4. Saatchi I, Yavuz K, Ozer C, et al. Treatment of intracra-
nial aneurysms using the pipeline flow-diverter emboliza-
tion device: a single-center experience with long-term
follow-up results. AJNR Am J Neuroradiol 2012; 33:
1436–1446.5. Castro M, Putman C, Radaelli A, et al. Hemodynamics
and rupture of terminal cerebral aneurysms. Acad Radiol
2009; 16: 1201–1207.6. Tang AY, Eric WC, Anderson JQ, et al. Computational
fluid dynamics study of bifurcation aneurysms treated
with pipeline embolization device: side branch diameter
study. J Med Biol Eng 2015; 35(3): 293–304.7. Fernandez H, Macho JM, Blasco J, et al. Computation
of the change in length of a braided device when
deployed in realistic vessel models. Int J Comput Assist
Radiol Surg, 2015, http://link.springer.com/10.1007/
s11548-015-1230-18. Aurboonyawat T, Blanc R, Schmidt P, et al. An in vitro
study of silk stent morphology. Neuroradiology 2011;
53(9): 659–667.9. Saleme S, Iosif C, Ponomarjova S, et al. Flow-diverting
stents for intracranial bifurcation aneurysm treatment.
Neurosurgery 2014; 75(6): 623–631.10. Caroff J, Neki H, Mihalea C, et al. Flow-diverter stents for
the treatment of saccular middle cerebral artery bifurcation
aneurysms. AJNR Am J Neuroradiol 2015; 37: 279–284.11. Fahed R, Gentric JC, Salazkin I, et al. Flow diversion of
bifurcation aneurysms is more effective when the jailed
branch is occluded: an experimental study in a novel
442 Proc IMechE Part H: J Engineering in Medicine 231(5)

canine model. J NeuroInterv Surg. Epub ahead of print11 April 2016. DOI: 10.1136/neurintsurg-2015-012240.
12. Kulcsar Z, Ernemann U, Wetzel SG, et al. High-profileflow diverter (silk) implantation in the basilar artery.Stroke 2010; 41(8): 1690–1696.
13. Wong GKC, Kwan MCL, Ng RYT, et al. Flow divertersfor treatment of intracranial aneurysms: current statusand ongoing clinical trials. J Clin Neurosci 2011; 18(6):737–740.
14. Mangiafico S, Guarnieri G, Consoli A, et al. Endovascu-lar strategy for unruptured cerebral aneurysms. Eur J
Radiol 2012; 82: 1638–1645.15. Iosif C and Mounayer C. Flow-diverter stents for the
treatment of saccular middle cerebral artery bifurcationaneurysms: is ‘unsuitable’ the right conclusion? AJNR
Am J Neuroradiol 2016; 37: E13.16. Ngoepe MN and Ventikos Y. Computational modelling
of clot development in patient-specific cerebral aneurysmcases. J Thromb Haemost 2016; 14(2): 262–272.
17. Cito S, Mazzeo MD and Badimon L. A review of macro-scopic thrombus modeling methods. Thromb Res 2013;131(2): 116–124.
18. Furie B and Furie BC. Mechanisms of thrombus forma-tion. N Engl J Med 2008; 359(9): 938–949.
19. Cebral JR, Mut F, Raschi M, et al. Analysis of hemody-namics and aneurysm occlusion after flow-diverting treat-ment in rabbit models. AJNR Am J Neuroradiol 2014; 35:1567–1573.
20. Byrne JV and Hubbard N. A novel two-stage techniquefor construction of experimental aneurysms. AJNR Am J
Neuroradiol 2004; 25: 319–321.21. Gester K, Lu I and Bu M. In vitro evaluation of intra-
aneurysmal, flow-diverter-induced thrombus formation: afeasibility study. AJNR Am J Neuroradiol 2016; 37: 490–496.
22. Cebral JR, Vazquez M, Sforza DM, et al. Analysis ofhemodynamics and wall mechanics at sites of cerebralaneurysm rupture. J Neurointerv Surg 2014; 7: 530–536.
23. Chen H, Selimovic A, Thompson H, et al. Investigatingthe influence of haemodynamic stimuli on intracranialaneurysm inception. Ann Biomed Eng 2013; 41(7): 1492–1504.
24. Griffith TM. Modulation of blood flow and tissue perfu-sion by endothelium-derived relaxing factor. Exp Physiol
1994; 79: 873–913.
25. Peach TW, Ngoepe M, Spranger K, et al. Personalizingflow-diverter intervention for cerebral aneurysms: fromcomputational hemodynamics to biochemical modeling.Int J Numer Method Biomed Eng 2014; 30(11): 1387–1407.
26. Ouared R, Chopard B, Stahl B, et al. Thrombosis model-ing in intracranial aneurysms: a lattice Boltzmann numer-ical algorithm. Comput Phys Commun 2008; 179(1–3):128–131.
27. Chong W, Zhang Y, Qian Y, et al. Computational hemo-dynamics analysis of intracranial aneurysms treated withflow diverters: correlation with clinical outcomes. AJNR
Am J Neuroradiol 2014; 35(1): 136–142.28. Ribeiro de Sousa D, Vallecilla C, Chodzynski K, et al.
Determination of a shear rate threshold for thrombusformation in intracranial aneurysms. J Neurointerv Surg.Epub ahead of print 27 July 2015. DOI: 10.1136/neurint-
surg-2015-011737.29. Malaspinas O, Turjman A, Ribeiro de Sousa D, et al. A
spatio-temporal model for spontaneous thrombus forma-tion in cerebral aneurysms. J Theor Biol 2016; 394: 68–76.
30. Spranger K and Ventikos Y. Which spring is the best?Comparison of methods for virtual stenting. IEEE Trans
Biomed Eng 2014; 61(7): 1998–2010.31. Ni M and Abdou MA. A bridge between projection
methods and SIMPLE type methods for incompressibleNavier–Stokes equations. Int J Numer Method Eng 2007;72: 1490–1512.
32. Van Doormaal JP and Raithby GD. Enhancements of
the simple method for predicting incompressible fluidflows. Numer Heat Transfer 1984; 7: 147–163.
33. Webster R. An algebraic multigrid solver for Navier-Stokes problems. Int J Numer Meth Fluid 1994; 18: 761–780.
34. Perktold K, Resch M and Florian H. Pulsatile non-New-tonian flow characteristics in a three-dimensional humancarotid bifurcation model. J Biomech Eng 1991; 113(4):464–475.
35. Valencia A, Guzman AM, Finol E, et al. Blood flowdynamics in saccular aneurysm models of the basilarartery. J Biomech Eng 2006; 128(4): 516–526.
36. Dempere-Marco L, Oubel E, Castro M, et al. CFD anal-ysis incorporating the influence of wall motion: applica-tion to intracranial aneurysms. Med Image Comput
Comput Assist Interv 2006; 9: 438–445.
Peach et al. 443


![PVG 32 Metric Ports Technical InformationPVBD, 6/2 diverter valve Max pressure PVBZ module with mounted diverter PVBD, Port A/B 280 bar [4061 psi] Oil flow max recommended, rated PVBZ](https://img.pdfslide.us/doc/110x75/61155b995483af7cb21ef0b5/pvg-32-metric-ports-technical-information-pvbd-62-diverter-valve-max-pressure.jpg)