Embed Size (px)
Citation preview
VIRTUAL DRIVEABILITY & NVH
DEVELOPMENT OF HEV IMPULSE
START FROM CONCEPT TO SOP
PDiM, Chalmers University, Göteborg, SwedenDr. Stephen Jones [email protected] +43 664 8509172Hannes Boehm, Nicola Zandalasini,Dr. Bernd Klima, Erik Bogner, Patrick Weingerl

Jones, Stephen John | DS | 30 November 2017 | 3Public
▪ Introduction / Background
▪ Aim: Virtual Driveability & NVH Development
▪ 3D Co-Simulation Toolchain
▪ Driveability Evaluation of Impulse Start
▪ Validation of Methodology
▪ Simulation Examples
▪ Summary
OVERVIEW
Jones, Stephen John | DS | 30 November 2017 | 4Public
▪ Introduction / Background
▪ Aim: Virtual Driveability & NVH Development
▪ 3D Co-Simulation Toolchain
▪ Driveability Evaluation of Impulse Start
▪ Validation of Methodology
▪ Simulation Examples
▪ Summary
OVERVIEW
Jones, Stephen John | DS | 30 November 2017 | 5Public
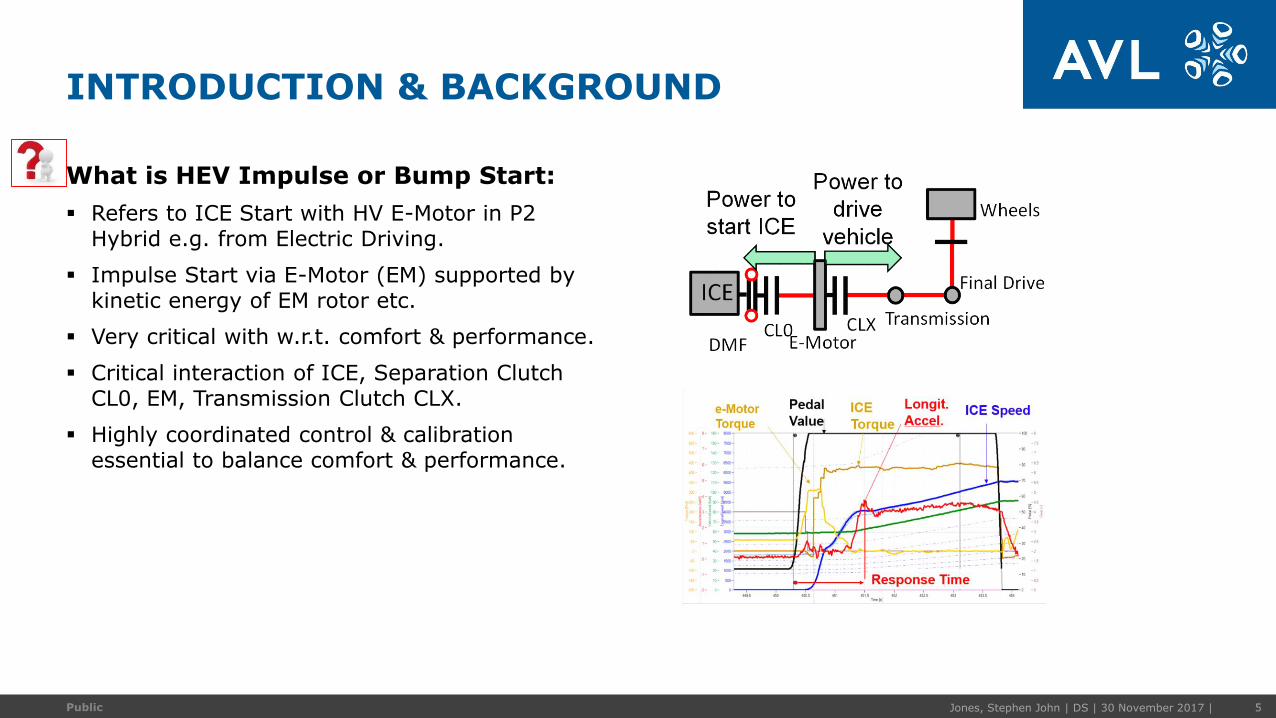
What is HEV Impulse or Bump Start:
▪ Refers to ICE Start with HV E-Motor in P2 Hybrid e.g. from Electric Driving.
▪ Impulse Start via E-Motor (EM) supported by kinetic energy of EM rotor etc.
▪ Very critical with w.r.t. comfort & performance.
▪ Critical interaction of ICE, Separation Clutch CL0, EM, Transmission Clutch CLX.
▪ Highly coordinated control & calibration essential to balance comfort & performance.
INTRODUCTION & BACKGROUND

Jones, Stephen John | DS | 30 November 2017 | 6Public
Performance & Comfort Challenges:
▪ Drop in propulsion power
resulting from cranking ICE
via same EM’s power.
▪ High propulsion power
demand in electric driving
reduces available EM power
for impulse start Critical
w.r.t. comfort & performance.
▪ Trade-off between
performance, comfort &
operation strategy.
INTRODUCTION & BACKGROUND
AVL Solution:
▪ Frontloaded virtual drive-
ability & NVH development
of hybrid impulse start.
▪ Model Based Development
of critical HW/SW interactions
& virtual driveability
evaluation.
▪ Addressing all aspects:
Control function & SW,
powertrain complexity, 3D
vehicle, driveability.
Jones, Stephen John | DS | 30 November 2017 | 7Public
▪ Introduction / Background
▪ Aim: Virtual Driveability & NVH Development
▪ 3D Co-Simulation Toolchain
▪ Driveability Evaluation of Impulse Start
▪ Validation of Methodology
▪ Simulation Examples
▪ Summary
OVERVIEW
Jones, Stephen John | DS | 30 November 2017 | 8Public
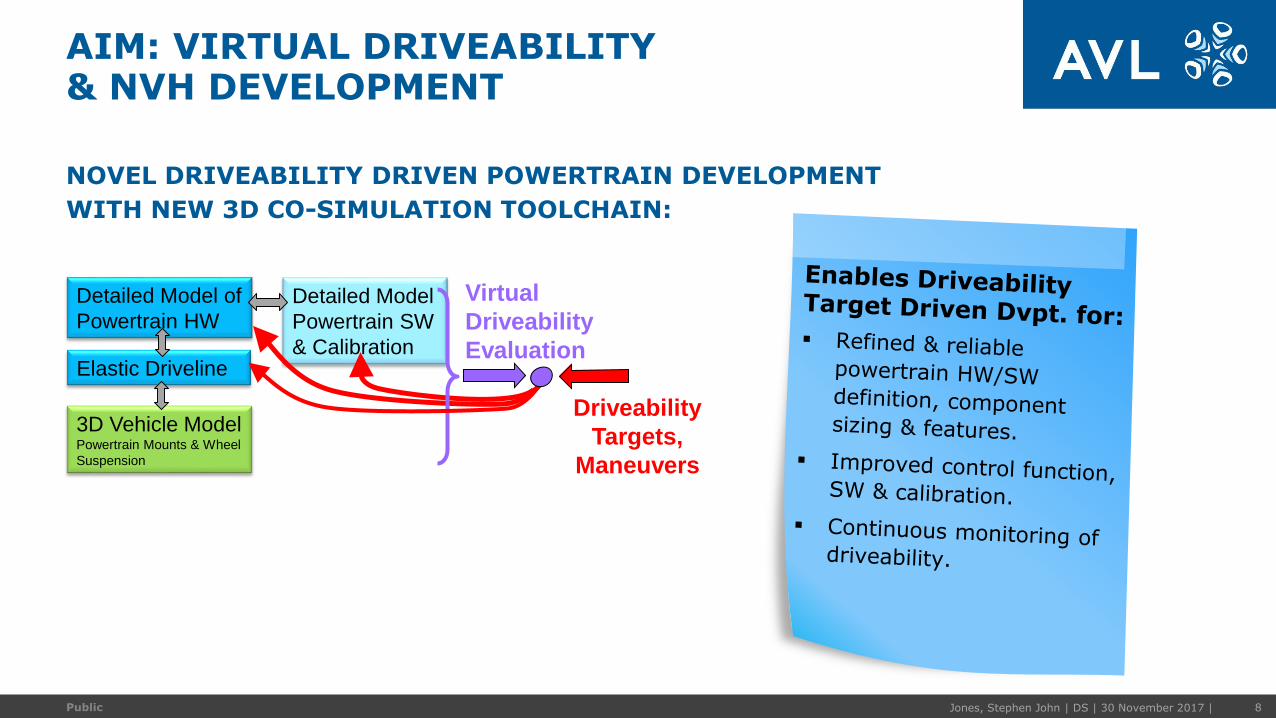
NOVEL DRIVEABILITY DRIVEN POWERTRAIN DEVELOPMENT
WITH NEW 3D CO-SIMULATION TOOLCHAIN:
AIM: VIRTUAL DRIVEABILITY& NVH DEVELOPMENT
Detailed Model of
Powertrain HW
Detailed Model
Powertrain SW
& Calibration
3D Vehicle Model Powertrain Mounts & Wheel
Suspension
Elastic Driveline
Virtual
Driveability
Evaluation
Driveability
Targets,
Maneuvers
Jones, Stephen John | DS | 30 November 2017 | 9Public
▪ Introduction / Background
▪ Aim: Virtual Driveability & NVH Development
▪ 3D Co-Simulation Toolchain
▪ Driveability Evaluation of Impulse Start
▪ Validation of Methodology
▪ Simulation Examples
▪ Summary
OVERVIEW
Jones, Stephen John | DS | 30 November 2017 | 10Public
TSS
AVL-DRIVE™AVL VSM™
AVL TSS*
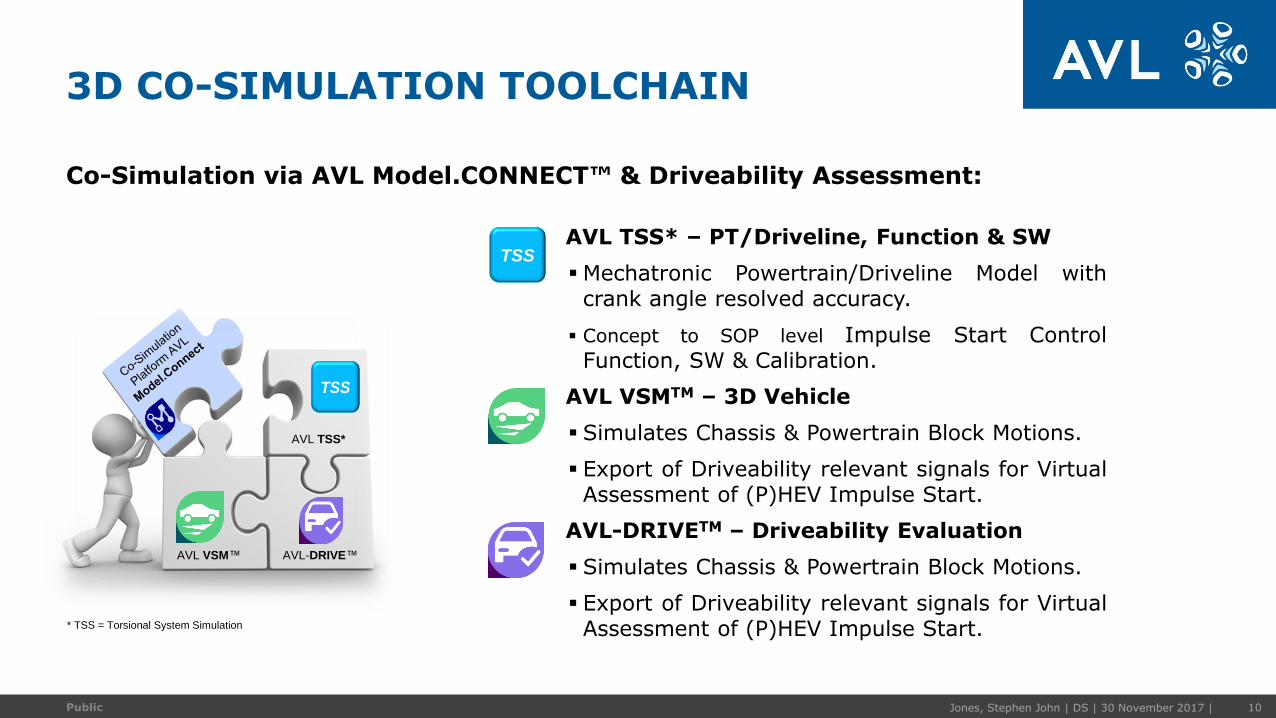
Co-Simulation via AVL Model.CONNECT™ & Driveability Assessment:
3D CO-SIMULATION TOOLCHAIN
AVL TSS* – PT/Driveline, Function & SW
▪Mechatronic Powertrain/Driveline Model withcrank angle resolved accuracy.
▪ Concept to SOP level Impulse Start ControlFunction, SW & Calibration.
AVL VSMTM – 3D Vehicle
▪ Simulates Chassis & Powertrain Block Motions.
▪ Export of Driveability relevant signals for VirtualAssessment of (P)HEV Impulse Start.
AVL-DRIVETM – Driveability Evaluation
▪ Simulates Chassis & Powertrain Block Motions.
▪ Export of Driveability relevant signals for VirtualAssessment of (P)HEV Impulse Start.
TSS
* TSS = Torsional System Simulation
Jones, Stephen John | DS | 30 November 2017 | 11Public
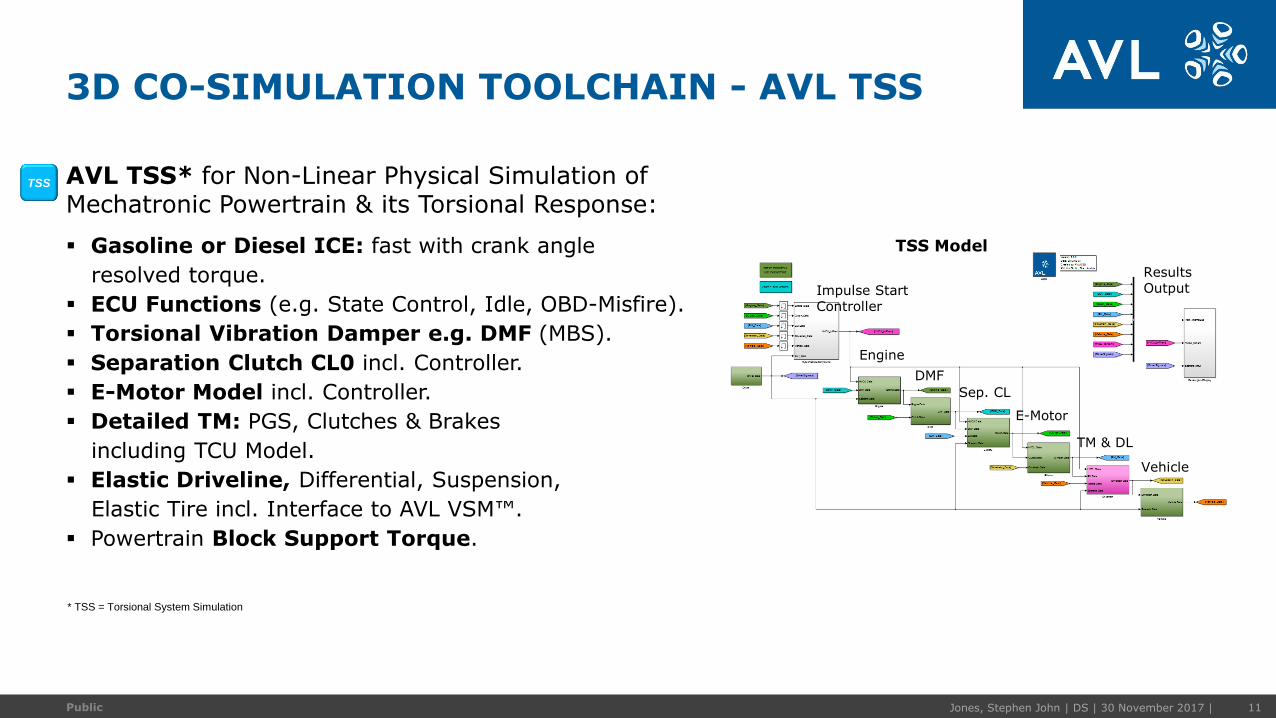
AVL TSS* for Non-Linear Physical Simulation of Mechatronic Powertrain & its Torsional Response:
▪ Gasoline or Diesel ICE: fast with crank angle
resolved torque.
▪ ECU Functions (e.g. State Control, Idle, OBD-Misfire).
▪ Torsional Vibration Damper e.g. DMF (MBS).
▪ Separation Clutch CL0 incl. Controller.
▪ E-Motor Model incl. Controller.
▪ Detailed TM: PGS, Clutches & Brakes
including TCU Model.
▪ Elastic Driveline, Differential, Suspension,
Elastic Tire incl. Interface to AVL VSM™.
▪ Powertrain Block Support Torque.
3D CO-SIMULATION TOOLCHAIN - AVL TSS
TSS Model
Engine
DMF
Sep. CL
E-Motor
TM & DL
Vehicle
Impulse Start Controller
Results Output
* TSS = Torsional System Simulation
TSS
Jones, Stephen John | DS | 30 November 2017 | 12Public
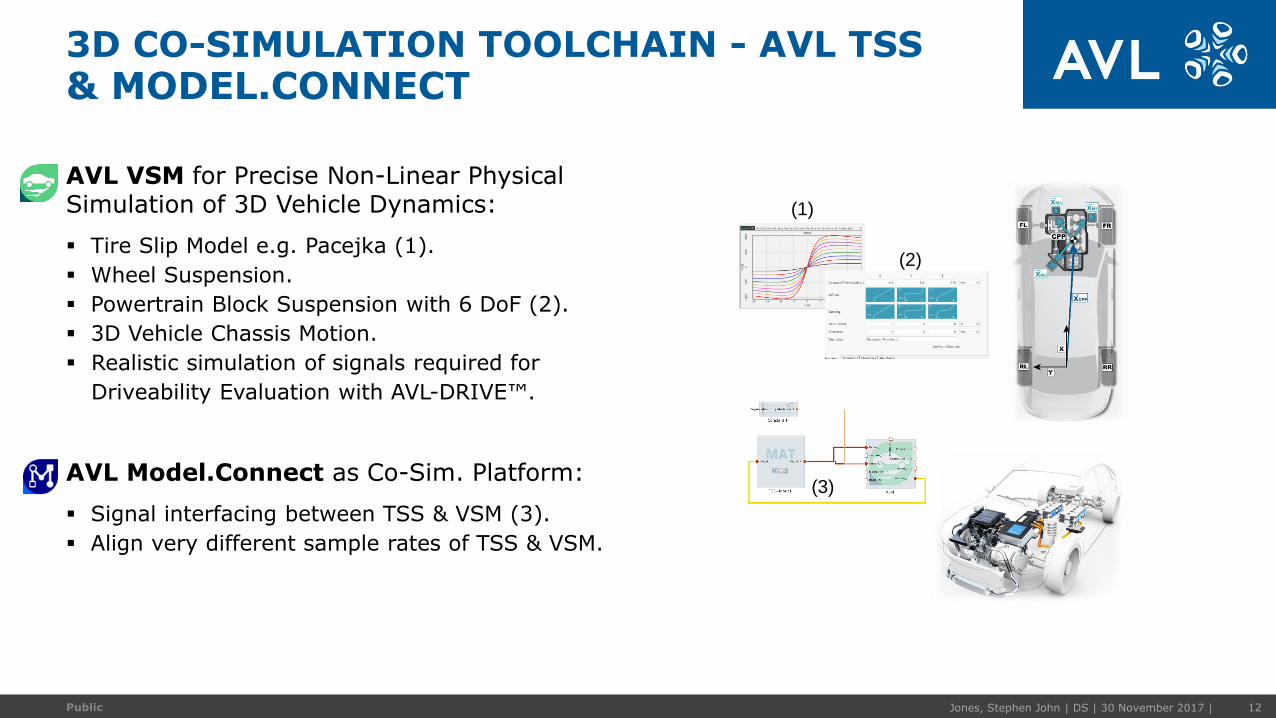
AVL VSM for Precise Non-Linear PhysicalSimulation of 3D Vehicle Dynamics:
▪ Tire Slip Model e.g. Pacejka (1).
▪ Wheel Suspension.
▪ Powertrain Block Suspension with 6 DoF (2).
▪ 3D Vehicle Chassis Motion.
▪ Realistic simulation of signals required for
Driveability Evaluation with AVL-DRIVE™.
AVL Model.Connect as Co-Sim. Platform:
▪ Signal interfacing between TSS & VSM (3).
▪ Align very different sample rates of TSS & VSM.
3D CO-SIMULATION TOOLCHAIN - AVL TSS& MODEL.CONNECT
(3)
(1)
(2)
Jones, Stephen John | DS | 30 November 2017 | 13Public
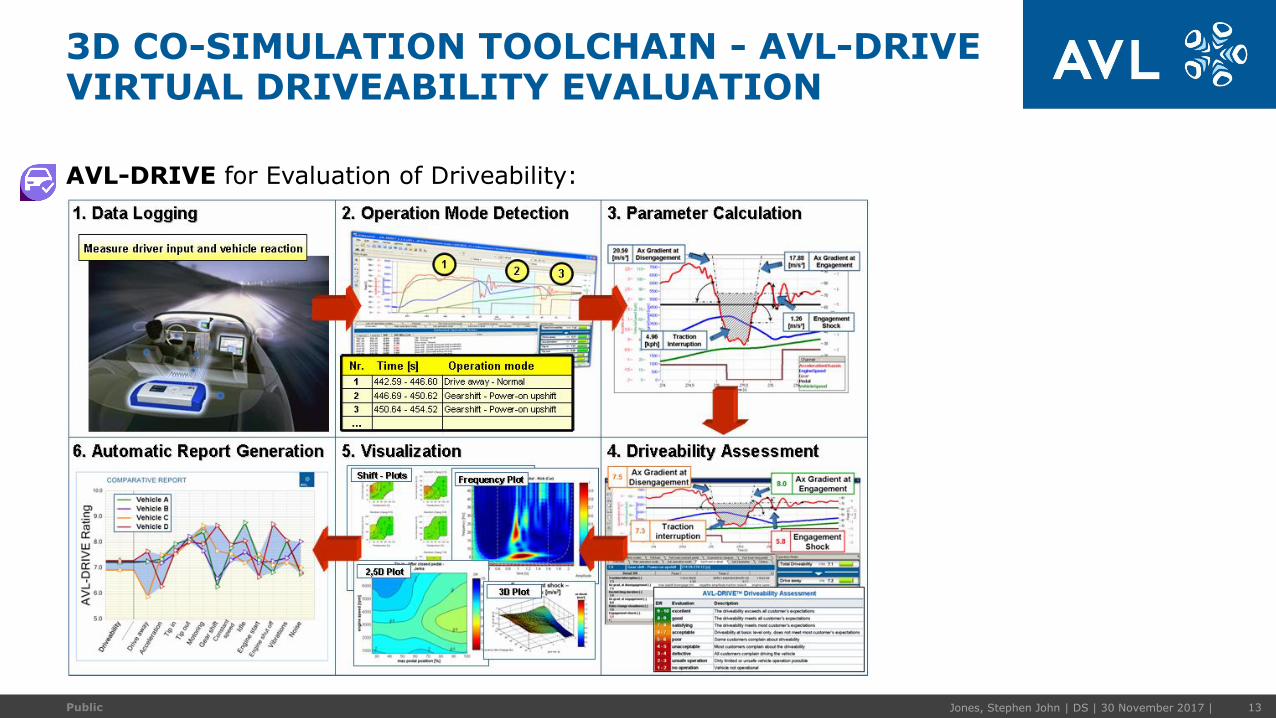
AVL-DRIVE for Evaluation of Driveability:
3D CO-SIMULATION TOOLCHAIN - AVL-DRIVEVIRTUAL DRIVEABILITY EVALUATION
Jones, Stephen John | DS | 30 November 2017 | 14Public
▪ Introduction / Background
▪ Aim: Virtual Driveability & NVH Development
▪ 3D Co-Simulation Toolchain
▪ Driveability Evaluation of Impulse Start
▪ Validation of Methodology
▪ Simulation Examples
▪ Summary
OVERVIEW
Jones, Stephen John | DS | 30 November 2017 | 15Public
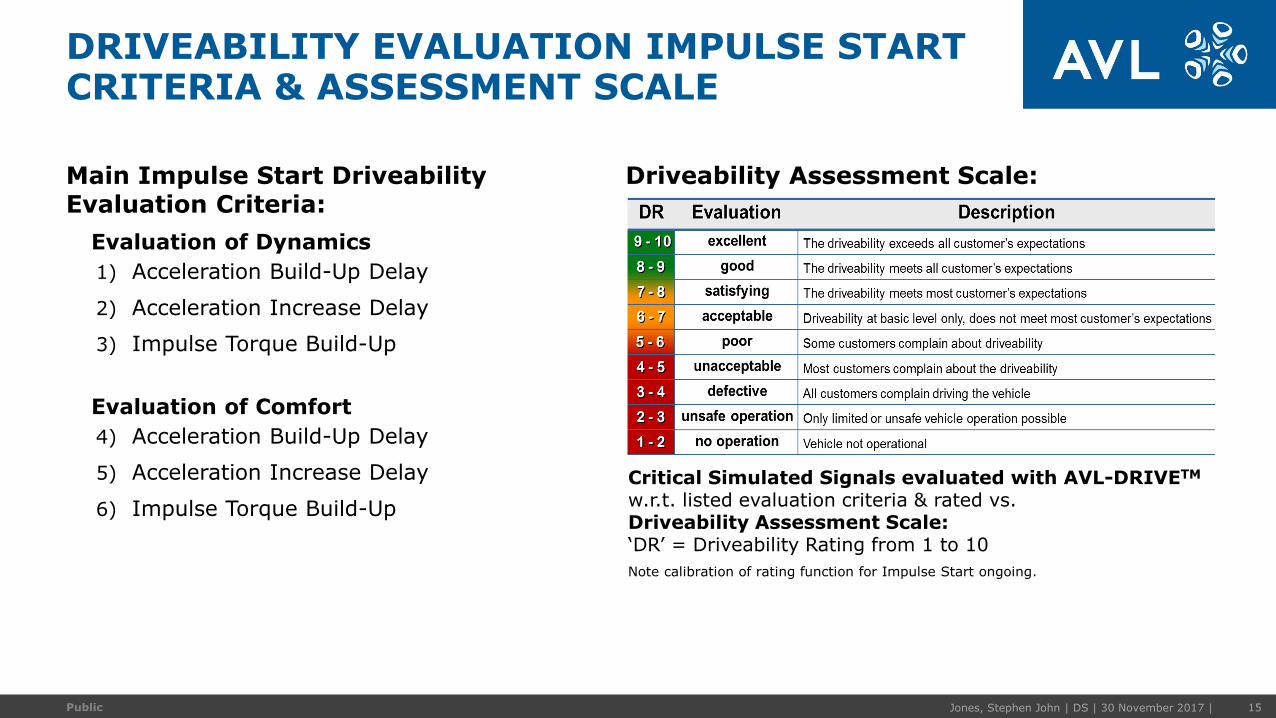
Main Impulse Start Driveability Evaluation Criteria:
Evaluation of Dynamics
1) Acceleration Build-Up Delay
2) Acceleration Increase Delay
3) Impulse Torque Build-Up
Evaluation of Comfort
4) Acceleration Build-Up Delay
5) Acceleration Increase Delay
6) Impulse Torque Build-Up
DRIVEABILITY EVALUATION IMPULSE STARTCRITERIA & ASSESSMENT SCALE
Driveability Assessment Scale:
Critical Simulated Signals evaluated with AVL-DRIVETM
w.r.t. listed evaluation criteria & rated vs.Driveability Assessment Scale:‘DR’ = Driveability Rating from 1 to 10
Note calibration of rating function for Impulse Start ongoing.
Jones, Stephen John | DS | 30 November 2017 | 16Public
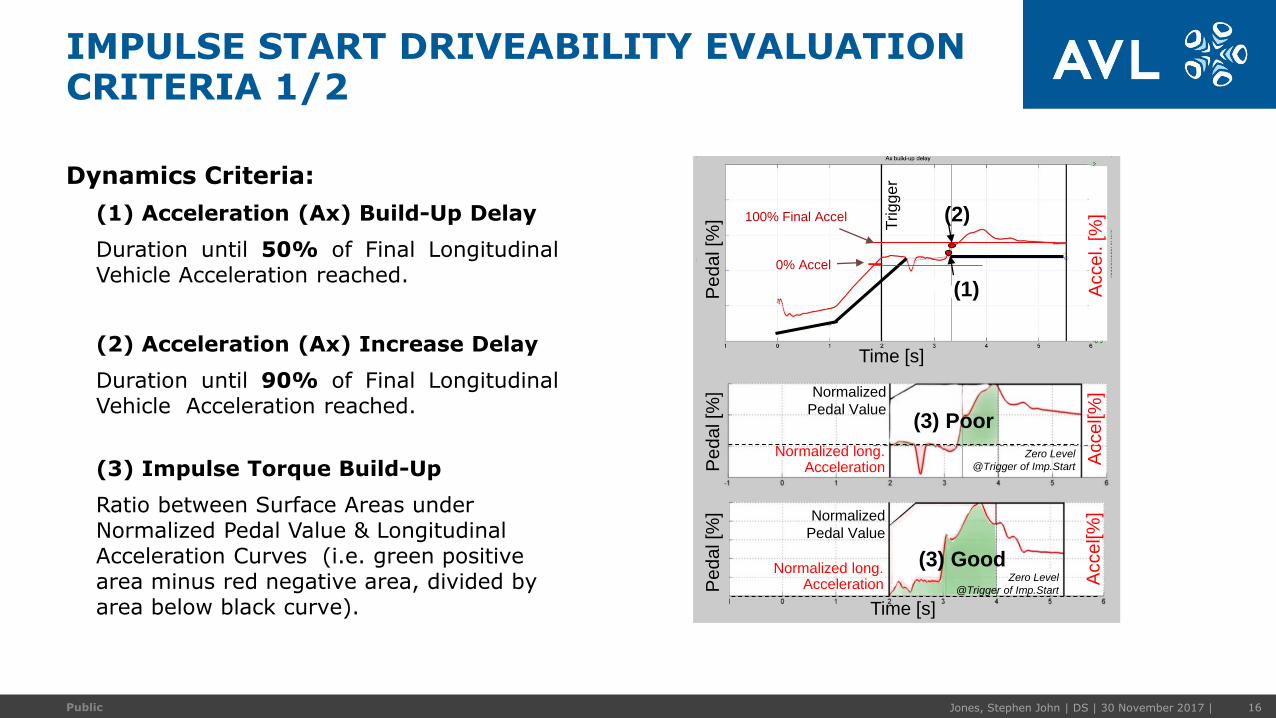
Dynamics Criteria:
(1) Acceleration (Ax) Build-Up Delay
Duration until 50% of Final LongitudinalVehicle Acceleration reached.
(2) Acceleration (Ax) Increase Delay
Duration until 90% of Final LongitudinalVehicle Acceleration reached.
(3) Impulse Torque Build-Up
Ratio between Surface Areas under Normalized Pedal Value & Longitudinal Acceleration Curves (i.e. green positive area minus red negative area, divided by area below black curve).
IMPULSE START DRIVEABILITY EVALUATION CRITERIA 1/2
Pe
da
l [%
] Trigge
r
100% Final Accel
0% Accel
Acce
l. [%
]
Normalized
Pedal Value
zero level
Time [s]
Pe
da
l [%
]
Normalized long. Acceleration
Normalized
Pedal Value
Zero Level
@Trigger of Imp.Start
Normalized long. Acceleration
Normalized
Pedal Value
Zero Level
@Trigger of Imp.Start Acce
l[%
]
Pe
da
l [%
]
Acce
l[%
]
Time [s]
(1)
(2)
(3) Poor
(3) Good
Jones, Stephen John | DS | 30 November 2017 | 17Public
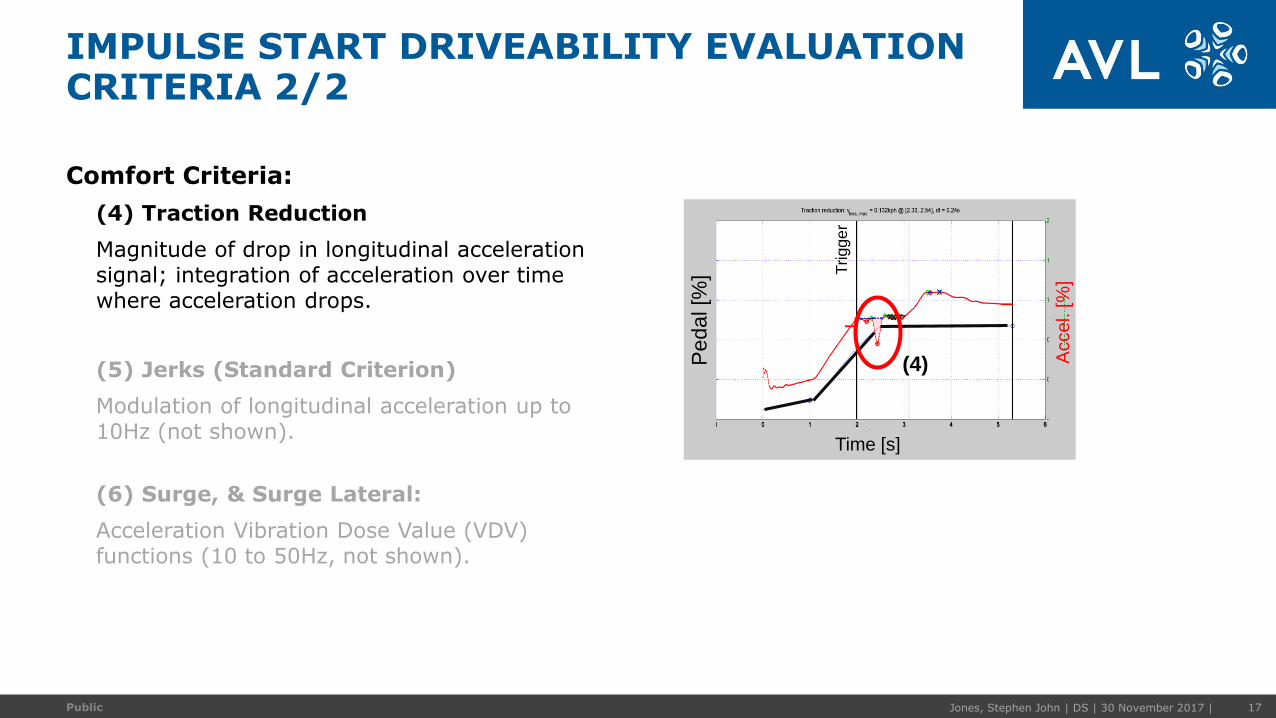
Comfort Criteria:
(4) Traction Reduction
Magnitude of drop in longitudinal acceleration signal; integration of acceleration over time where acceleration drops.
(5) Jerks (Standard Criterion)
Modulation of longitudinal acceleration up to 10Hz (not shown).
(6) Surge, & Surge Lateral:
Acceleration Vibration Dose Value (VDV) functions (10 to 50Hz, not shown).
IMPULSE START DRIVEABILITY EVALUATION CRITERIA 2/2
Trigge
r
Accel. [%
]
Peda
l [%
]
Time [s]
(4)
Jones, Stephen John | DS | 30 November 2017 | 18Public
▪ Introduction / Background
▪ Aim: Virtual Driveability & NVH Development
▪ 3D Co-Simulation Toolchain
▪ Driveability Evaluation of Impulse Start
▪ Validation of Methodology
▪ Simulation Examples
▪ Summary
OVERVIEW

Jones, Stephen John | DS | 30 November 2017 | 20Public
Impulse Start – Measurement (4th Gear):
METHODOLOGY VALIDATIONCORRELATION 1/3
(1) Transmission
Pre-Control
(3) E-Motor
Speed Phase
Tri
gg
er
Imp
uls
e S
tart
(4) ICE Acceleration
via CL0
(2)CL0 Filling Phase
(1) Transmission Pre-Control:
Slip in Brake B
(2) Separation Clutch CL0:
Filling Phase
(3) E-Motor Speed Phase
(Kinetic Energy rise)
(4) Ramp up CL0:
Acceleration ICE Crankshaft
(5) ICE Firing & CL0 Opening
(6) Torque Handover:
EM ICE
(7) Brake B closing
(5) ICE Firing &
CL0 Opening
(7) Brk B
closing
(6) Trq Handover
EMICE
Jones, Stephen John | DS | 30 November 2017 | 21Public
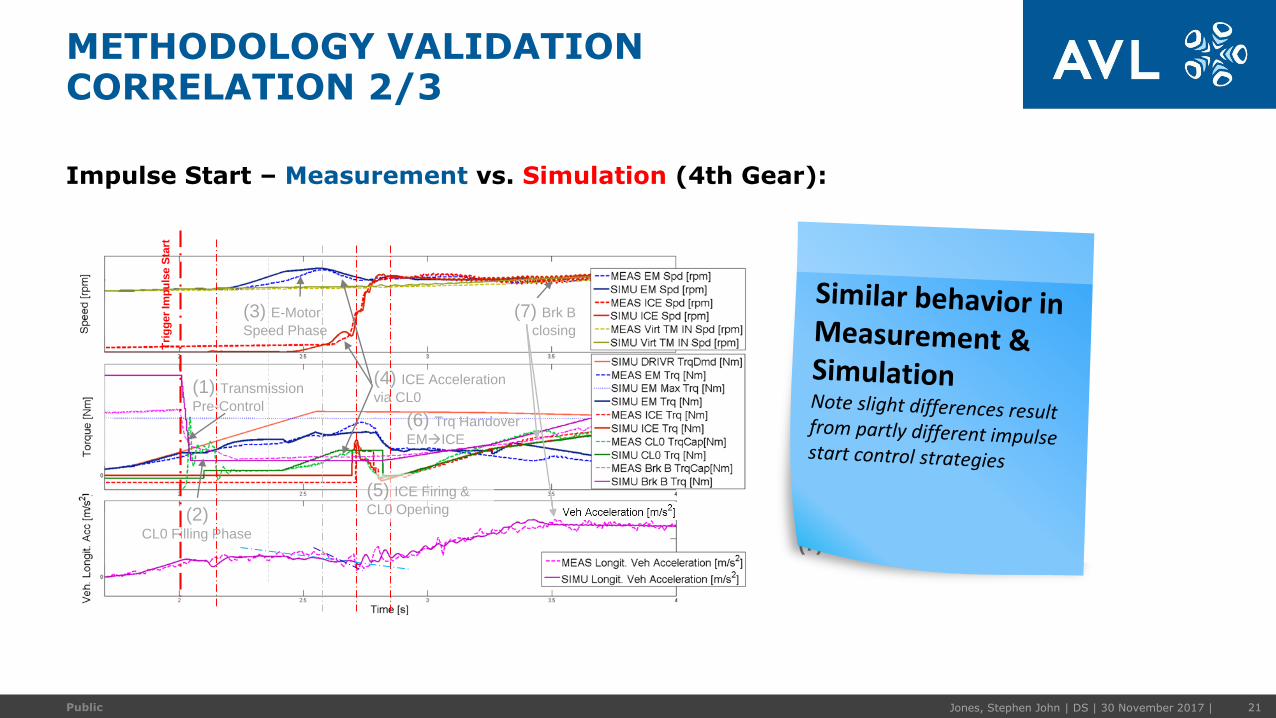
Impulse Start – Measurement vs. Simulation (4th Gear):
METHODOLOGY VALIDATIONCORRELATION 2/3
(1) Transmission
Pre-Control
(3) E-Motor
Speed Phase
(4) ICE Acceleration
via CL0
(5) ICE Firing &
CL0 Opening
(7) Brk B
closing
(6) Trq Handover
EMICE
(1) Transmission Pre-Control:
Slip in Brake B
(2) Separation Clutch CL0:
Filling Phase
(3) E-Motor Speed Phase
(Kinetic Energy rise)
(4) Ramp up CL0:
Acceleration ICE Crankshaft
(5) ICE Firing & CL0 Opening
(6) Torque Handover:
EM ICE
(7) Brake B closing
Tri
gg
er
Imp
uls
e S
tart
(2)CL0 Filling Phase
Jones, Stephen John | DS | 30 November 2017 | 22Public
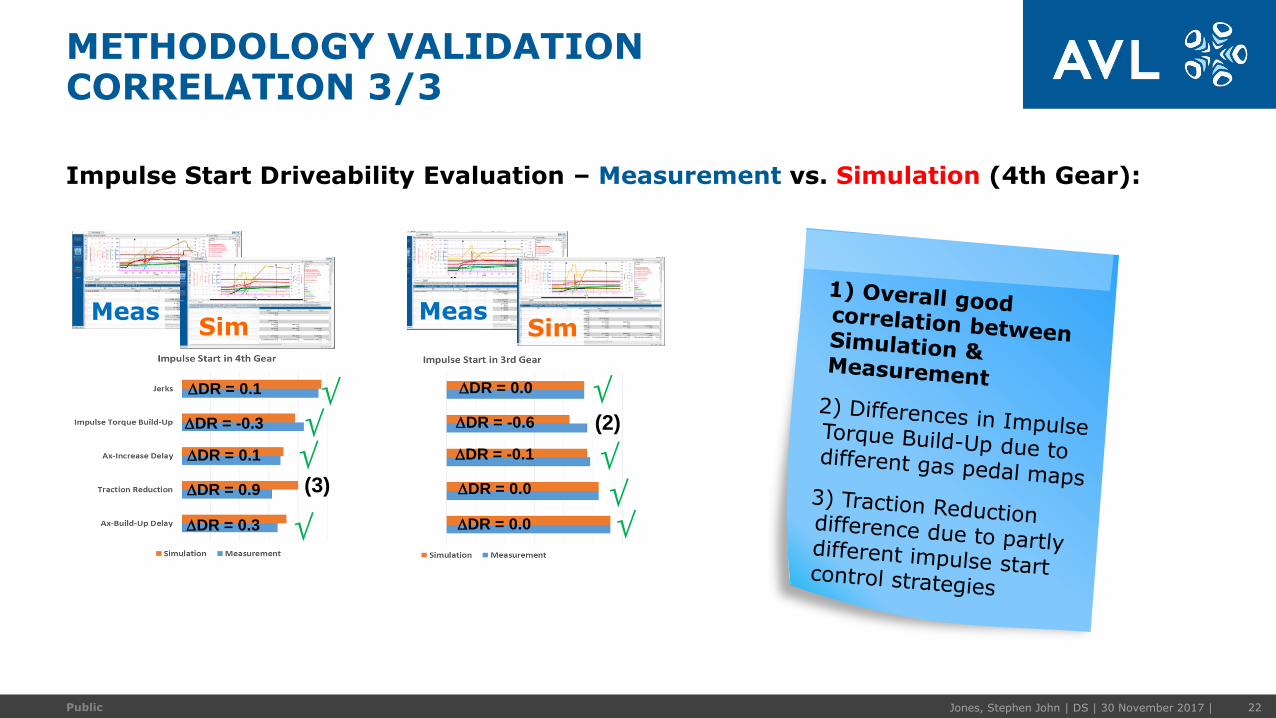
Impulse Start Driveability Evaluation – Measurement vs. Simulation (4th Gear):
METHODOLOGY VALIDATIONCORRELATION 3/3
SimMeas
DDR = 0.1
DDR = -0.3
DDR = 0.1
DDR = 0.9
DDR = 0.3
(3)
MeasSim
DDR = 0.0
DDR = -0.6
DDR = -0.1
DDR = 0.0
DDR = 0.0
(2)
Jones, Stephen John | DS | 30 November 2017 | 23Public
▪ Introduction / Background
▪ Aim: Virtual Driveability & NVH Development
▪ 3D Co-Simulation Toolchain
▪ Driveability Evaluation of Impulse Start
▪ Validation of Methodology
▪ Simulation Examples
Example #1 – Control Functions & Driveability
Example #2 – Robustness & Driveability
Example #3 – E-Motor Sizing & Driveability
▪ Summary
OVERVIEW

Jones, Stephen John | DS | 30 November 2017 | 24Public
Proven methodology now applied to:
PHEV SUV with 1.8L TGDI & much more powerful E-Motor 90kW, AT8, 4WD, north/south configuration.
PHEV impulse starts at significantly higher initial propulsion power demand & driving speeds vs. earlier HEV validation vehicle.
SIMULATION EXAMPLES –APPLICATION OF METHODOLOGY
PG
S1 P
GS
2
PG
S3
PG
S4
InputshaftOutputshaft
Autm. Transmission
Wheels
Front Prop-Shaft
Rear Prop-Shaft
Sideshaft
Sideshaft Wheels
CL0
CLC
Jones, Stephen John | DS | 30 November 2017 | 25Public
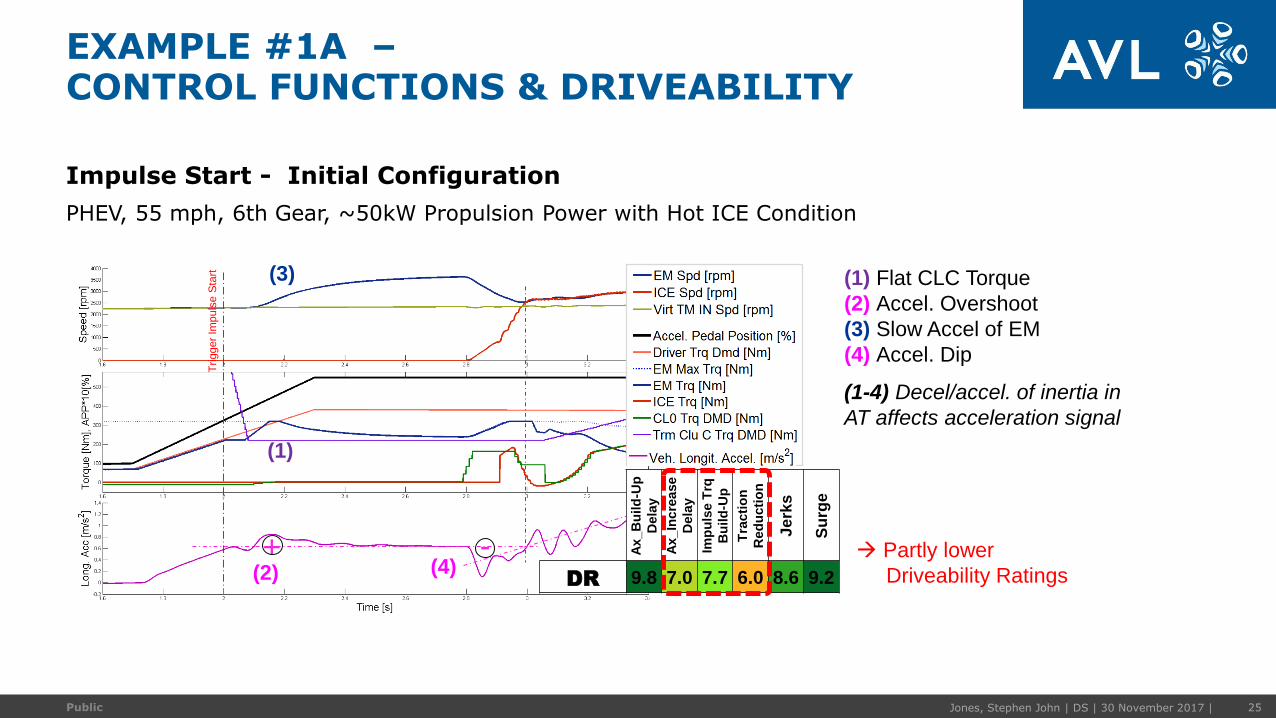
Impulse Start - Initial Configuration
PHEV, 55 mph, 6th Gear, ~50kW Propulsion Power with Hot ICE Condition
EXAMPLE #1A –CONTROL FUNCTIONS & DRIVEABILITY
Trigger
Impuls
e S
tart
Partly lower
Driveability Ratings
(1) Flat CLC Torque
(2) Accel. Overshoot
(3) Slow Accel of EM
(4) Accel. Dip
(1-4) Decel/accel. of inertia in
AT affects acceleration signal
+ -
(1)
(3)
(4) (2)
Ax_B
uild
-Up
Dela
y
Ax_In
cre
ase
Dela
y
Imp
uls
e T
rq
Bu
ild
-Up
Tra
cti
on
Red
ucti
on
Je
rks
Su
rge
DR 9.8 7.0 7.7 6.0 8.6 9.2
Jones, Stephen John | DS | 30 November 2017 | 26Public
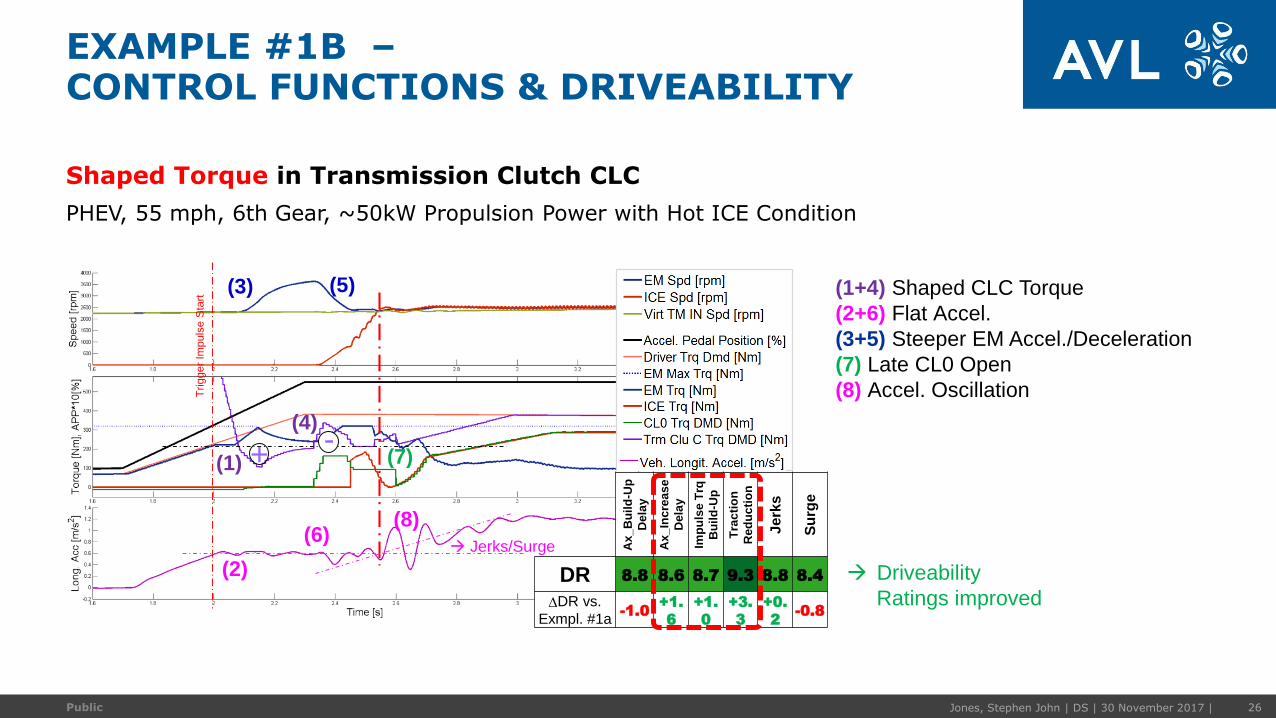
Shaped Torque in Transmission Clutch CLC
PHEV, 55 mph, 6th Gear, ~50kW Propulsion Power with Hot ICE Condition
EXAMPLE #1B –CONTROL FUNCTIONS & DRIVEABILITY
Trigger
Impuls
e S
tart
(1+4) Shaped CLC Torque
(2+6) Flat Accel.
(3+5) Steeper EM Accel./Deceleration
(7) Late CL0 Open
(8) Accel. Oscillation
+(1)
(3)
(2)
-(4)
(6)
(5)
(7)
(8)
Jerks/Surge
Driveability
Ratings improved
Ax
_B
uil
d-U
p
Dela
y
Ax
_In
cre
as
e
Dela
y
Imp
uls
e T
rq
Bu
ild
-Up
Tra
cti
on
Red
uc
tio
n
Jerk
s
Su
rge
DR 8.8 8.6 8.7 9.3 8.8 8.4
DDR vs.
Exmpl. #1a-1.0
+1.
6
+1.
0
+3.
3
+0.
2-0.8
Jones, Stephen John | DS | 30 November 2017 | 27Public
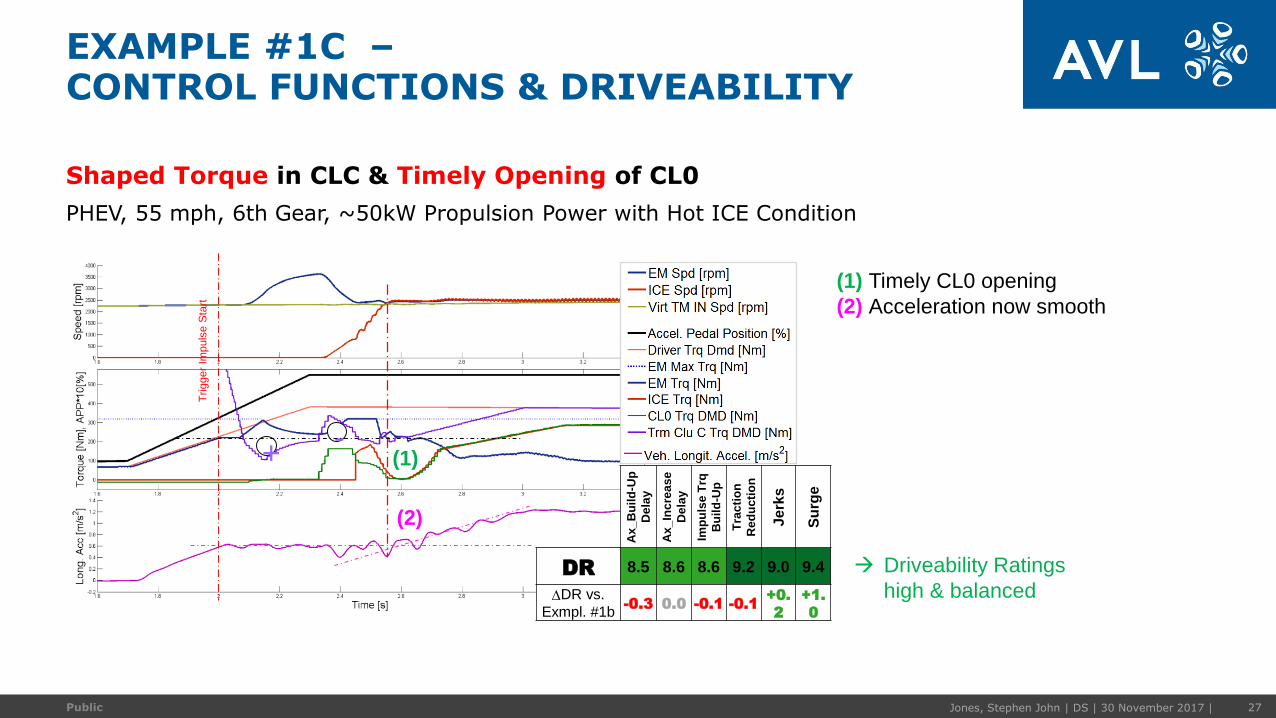
Shaped Torque in CLC & Timely Opening of CL0
PHEV, 55 mph, 6th Gear, ~50kW Propulsion Power with Hot ICE Condition
EXAMPLE #1C –CONTROL FUNCTIONS & DRIVEABILITY
+-
Trigger
Impuls
e S
tart
(1) Timely CL0 opening
(2) Acceleration now smooth
(1)
(2)
Driveability Ratings
high & balanced
Ax
_B
uil
d-U
p
Dela
y
Ax
_In
cre
as
e
Dela
y
Imp
uls
e T
rq
Bu
ild
-Up
Tra
cti
on
Red
uc
tio
n
Jerk
s
Su
rge
DR 8.5 8.6 8.6 9.2 9.0 9.4
DDR vs.
Exmpl. #1b-0.3 0.0 -0.1 -0.1
+0.
2
+1.
0
Jones, Stephen John | DS | 30 November 2017 | 29Public
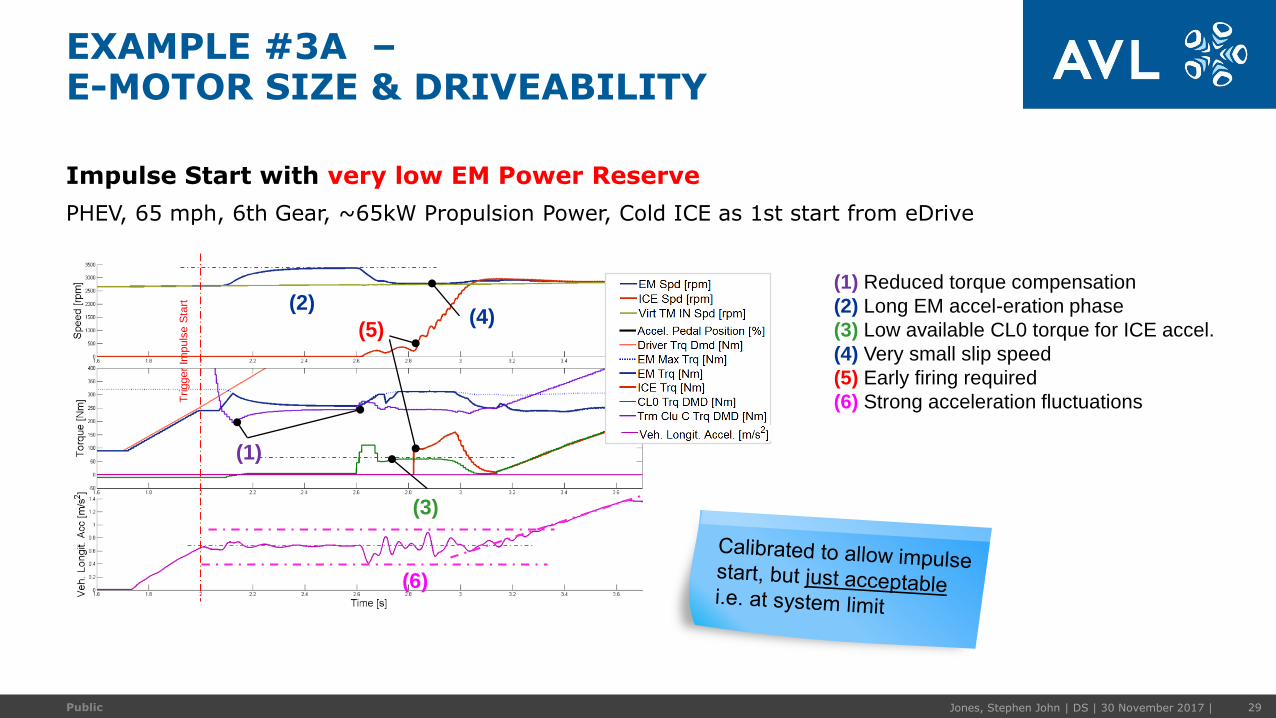
Impulse Start with very low EM Power Reserve
PHEV, 65 mph, 6th Gear, ~65kW Propulsion Power, Cold ICE as 1st start from eDrive
EXAMPLE #3A –E-MOTOR SIZE & DRIVEABILITY
Trigger
Impuls
e S
tart
(1) Reduced torque compensation
(2) Long EM accel-eration phase
(3) Low available CL0 torque for ICE accel.
(4) Very small slip speed
(5) Early firing required
(6) Strong acceleration fluctuations
(1)
(2)(4)
(5)
(3)
(6)

Jones, Stephen John | DS | 30 November 2017 | 30Public
As before but +5% EM Power & Recalibration
PHEV, 65 mph, 6th Gear, ~65kW Propulsion Power, Cold ICE as 1st start from eDrive
EXAMPLE #3B –E-MOTOR SIZE & DRIVEABILITY
(1)
(3)
(4)
(5)
(2)(1) Stronger torque compensation
(2) Short EM acceler-ation phase
(3) Safer slip speed
(4) Early firing still required Jerks
(5) Smoother
(6) Faster
(6)

Jones, Stephen John | DS | 30 November 2017 | 31Public
▪ Introduction / Background
▪ Aim: Virtual Driveability & NVH Development
▪ 3D Co-Simulation Toolchain
▪ Driveability Evaluation of Impulse Start
▪ Validation of Methodology
▪ Simulation Examples
▪ Summary
OVERVIEW

Jones, Stephen John | DS | 30 November 2017 | 32Public
Novel & validated Co-Simulation Toolchain allows:
▪ Model to Driveability Based Development (M2DBD) of Hybrid Topology, Mechanical HW & Control SW Requirements & Features.
▪ MiL, SiL development of Functions, SW & Calibration.
▪ Continuous monitoring of vehicle behavior through dvpt. process & informed refinement of detailed HW/SW design.
SUMMARY
TSS
AVL-DRIVE™AVL VSM™
AVL TSS Mdl
Jones, Stephen John | DS | 30 November 2017 | 33Public
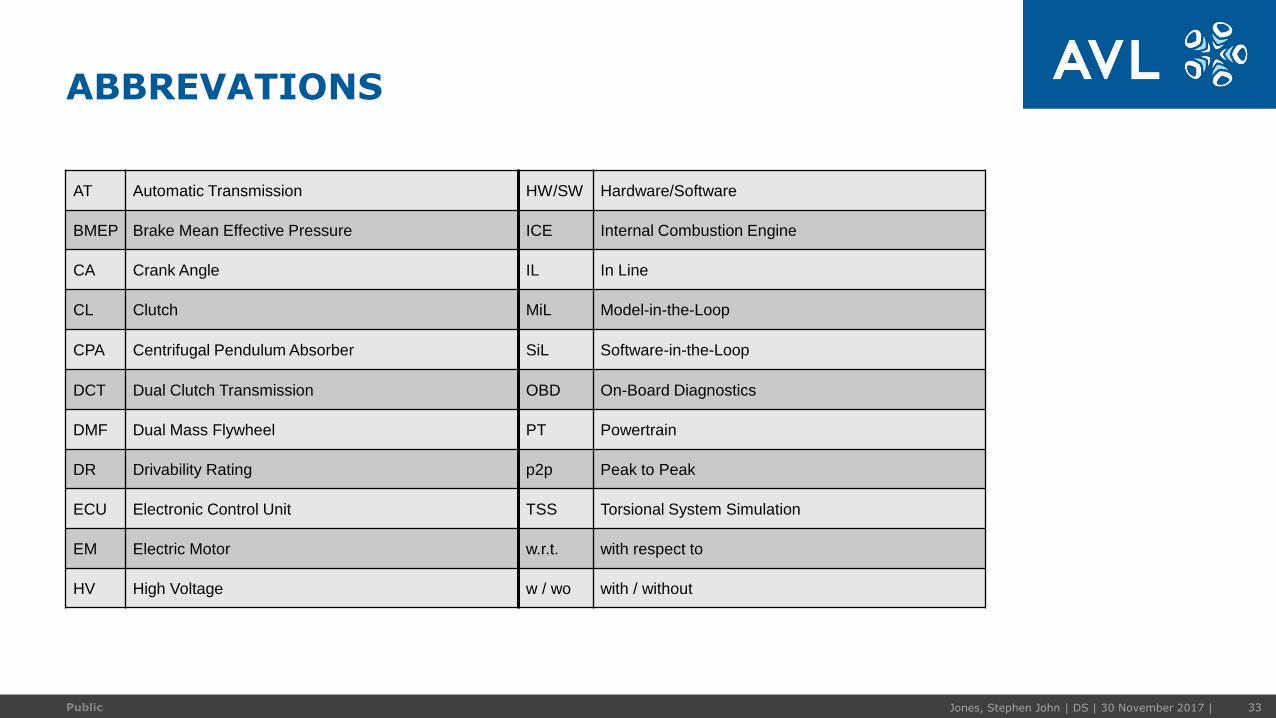
ABBREVATIONS
AT Automatic Transmission HW/SW Hardware/Software
BMEP Brake Mean Effective Pressure ICE Internal Combustion Engine
CA Crank Angle IL In Line
CL Clutch MiL Model-in-the-Loop
CPA Centrifugal Pendulum Absorber SiL Software-in-the-Loop
DCT Dual Clutch Transmission OBD On-Board Diagnostics
DMF Dual Mass Flywheel PT Powertrain
DR Drivability Rating p2p Peak to Peak
ECU Electronic Control Unit TSS Torsional System Simulation
EM Electric Motor w.r.t. with respect to
HV High Voltage w / wo with / without

www.avl.com
THANK YOU