Embed Size (px)
Citation preview
INTERNATIONAL JOURNAL ON SMART SENSING AND INTELLIGENT SYSTEMS VOL. 6, NO. 5, DECEMBER 2013
1830
Virtual Detection Zone in smart phone, with CCTV, and Twitter as
part of an Integrated ITS
B. Hardjono1,2
, A. Wibisono1, A. Nurhadiyatna
1, I.Sina
1 and W. Jatmiko
1
1Faculty of Computer Science. Universitas Indonesia,
Jl Margonda Raya, Depok, 16424, Indonesia
2Faculty of Computer Science. Universitas Pelita Harapan,
Thamrin Blvd., Lippo Village - Tangerang, 15811, Indonesia
Emails: [email protected], [email protected],
Submitted: June 22, 2013 Accepted: Oct. 30, 2013 Published: Dec. 16, 2013
Abstract- In this proposed integrated Intelligent Transport System, GPS enabled smart phones, and
video cameras are used as traffic sensors, while Twitter is used as verifier. They are attractive because
they are non intrusive, and consequently more practical and cheaper to implement. Our novel Virtual
Detection Zone (VDZ) method has been able to map match by using pre-determined check points. VDZ
speed accuracy ranges from 93.4 to 99.9% in higher speeds and it only needs one longitude and latitude
coordinate, to form a detection aware zone. Also by using ANFIS we show that a more accurate traffic
condition can be obtained using our three sources of data.
Index terms: Closed-circuit Television (CCTV), integrated Intelligent Transport System (ITS),
Traffic data, vehicle detection, Virtual Detection Zone (VDZ), Adaptive Neuro Fuzzy Inference
System (ANFIS).
B. Hardjono, A. Wibisono, A. Nurhadiyatna, I.Sina and W. Jatmiko, VIRTUAL DETECTION ZONE IN SMART PHONE, WITH CCTV, AND TWITTER AS PART OF AN INTEGRATED ITS
1831
I. INTRODUCTION
Traditional traffic monitoring technologies consist of on the road sensors, which are necessary
but not sufficient because of their limited coverage and expensive costs of implementation
(including time needed to lay the sensors on target roads) and maintenance [1]. In general, traffic
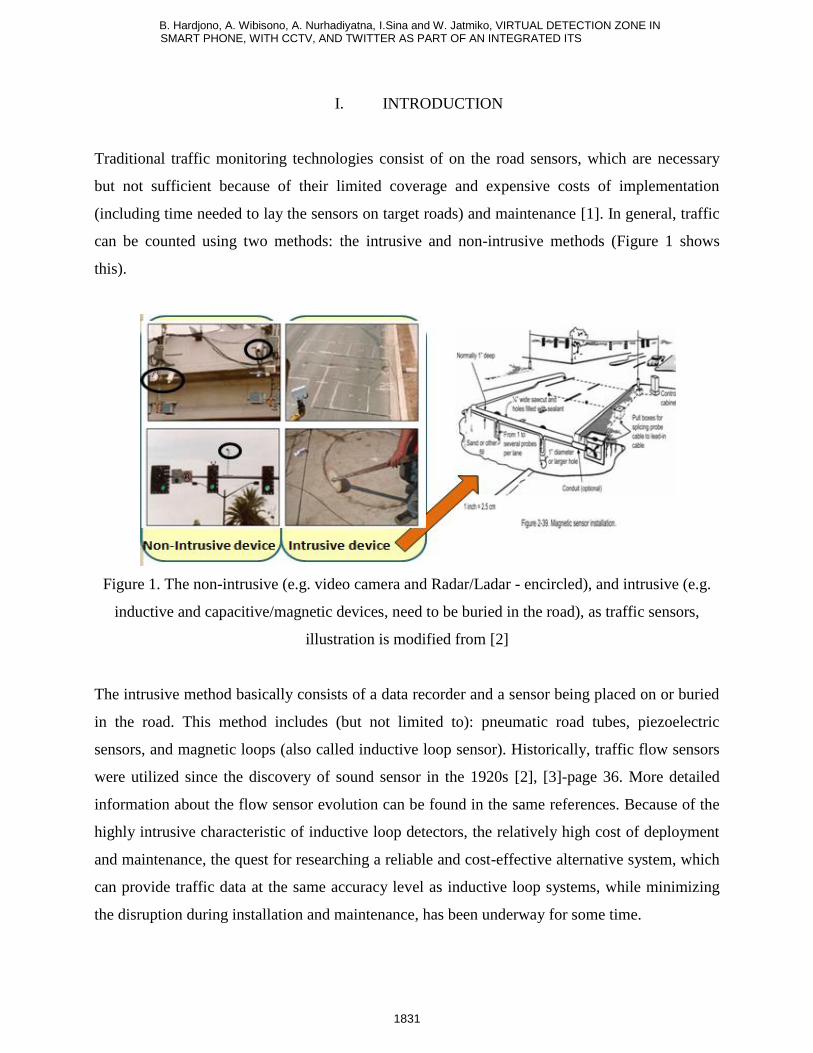
can be counted using two methods: the intrusive and non-intrusive methods (Figure 1 shows
this).
Figure 1. The non-intrusive (e.g. video camera and Radar/Ladar - encircled), and intrusive (e.g.
inductive and capacitive/magnetic devices, need to be buried in the road), as traffic sensors,
illustration is modified from [2]
The intrusive method basically consists of a data recorder and a sensor being placed on or buried
in the road. This method includes (but not limited to): pneumatic road tubes, piezoelectric
sensors, and magnetic loops (also called inductive loop sensor). Historically, traffic flow sensors
were utilized since the discovery of sound sensor in the 1920s [2], [3]-page 36. More detailed
information about the flow sensor evolution can be found in the same references. Because of the
highly intrusive characteristic of inductive loop detectors, the relatively high cost of deployment
and maintenance, the quest for researching a reliable and cost-effective alternative system, which
can provide traffic data at the same accuracy level as inductive loop systems, while minimizing
the disruption during installation and maintenance, has been underway for some time.
B. Hardjono, A. Wibisono, A. Nurhadiyatna, I.Sina and W. Jatmiko, VIRTUAL DETECTION ZONE IN SMART PHONE, WITH CCTV, AND TWITTER AS PART OF AN INTEGRATED ITS
1832
The non-intrusive technique is based on remote observations, which includes: manual counting,
wired and wireless sensors, like: passive and active infra-red, passive magnetic, radio frequency
or micro wave Radio or Laser Detection and Ranging (Radar or Ladar), and video image
detection. The motivation of developing wireless sensor networks based surveillance system is to
provide a direct replacement for the inductive loop systems, or to complement the use of other
existing traffic sensors and to extend the coverage of Intelligent Transport System (ITS)
applications. Video camera is another non-intrusive sensor already shown in Figure 1. In general
[4], vehicle recognition must cope with a number of limitations that complicate the task: vehicles
are generally of similar shapes, similar in sizes, but can be seen differently due to: reflections,
shadows, varying weather and quality of light, vibrations (e.g. for cameras installed on bridges),
different angles of view. Further on, the requirement to distinguish sub-classes such as minivan
vs. car vs. taxi complicates the task. Although in urban ITS, it is more common to use broader
categories of road user such as car, van, bus and motorcycle. One group of researchers in [5], has
adopted a manual approach to segmentation. They aim to discover the potential of using simple
low level features to achieve high levels of classification performance by filtering out noise
before the image segmentation step. Following this idea, in our future work we would like also
restrict ourselves to a fixed existing un-calibrated camera [6][7][8][9] in an outdoor non-
structured environment which captures information of a simple traffic scene under not so low
visibility conditions. Other researchers have used calibrated cameras to obtain more accurate
speed measurements and we have adopted this method as an initial step. This method is rather
impractical as existing video cameras must be calibrated first. Maduro et al [10] [11] have used
rectified video images to calculate the vehicle speeds. While Garibotto et al [12] have used
license plate to track the vehicle and then calculate its speeds. In fact there are a number of other
ways to calculate vehicle speeds such as in [13][14][15][16].
Twitter can be another non-intrusive source of traffic data. Related research was recently carried
out by Endarnoto, et al. [17] and more recently by Singh et al [18], in London. We have
attempted to extract traffic updates from the Twitter account of the Traffic Management Centre
(TMC) of Jakarta Metropolitan Police (Polda Metro Jaya) (@TMCPoldaMetro) in [19] and in
this paper, by providing our own Twitter data to simulate it. In previous study Natural Language
Processing (NLP) technique based on Context-Free Grammar (CFG) parser, has been used. But
in [20], it has been found that most tweets (95%) do not use grammatical language. Only a total
B. Hardjono, A. Wibisono, A. Nurhadiyatna, I.Sina and W. Jatmiko, VIRTUAL DETECTION ZONE IN SMART PHONE, WITH CCTV, AND TWITTER AS PART OF AN INTEGRATED ITS
1833
of 54 sample tweets (5%), which mostly are from online portals such Kompas.com and
Detik.com, have used grammatical language. This is why for traffic updates, the use of NLP
techniques have been abandoned. This preliminary analysis is important to design the analysis
component of our system, which has required an identification of the nature of the texts to be
processed.
Mobile phones can be used as traffic sensor, when location data of the user can be determined via
an application (agent), either by using US Global Positioning System (GPS) or from other
navigation satellites such as: Russia’s Glonass and Europe’s Galileo [21] [22] [23] [24] or from
non GPS enabled phones, using Cell ID [25] or Internet based devices [26]-[27]. It is noted also
that as technology progressed, the corresponding speed difference has become smaller or is
considered reasonably accurate, i.e. between the inductive loop data and probe vehicle, using
Global Positioning System/GPS enabled phones data, now, is in the range of 1.2 - 3.3% [28]. It
has been reported in [21] that speed data from GPS enabled devices is less accurate during
congested periods and for arterials. This study also aims to prove that as traffic sensor, mobile
phones can provide accurate vehicle data speed at lower speeds.
Preliminary work has been conducted in our papers [29], [30], [19], [31] and are presented again
in this paper, with more work on the three already mentioned traffic sensors. In [32], it has been
suggested that more CCTV as well as other sensors, should be utilized to localize the solution for
congestion. The work in this research is in line with this thought. In this case we propose the use
of GPS enabled mobile phones, existing CCTV and existing Twitter data as traffic condition
verifier. In the final section we will also present a case in which we utilize the algorithm of
Adaptive Neuro Fuzzy Inference System (ANFIS) in order to describe the traffic condition by
using the 3 sources of traffic data. Another way to solve this kind of problem is by using data
fusion [33], [34].
II. SENSORS IN INTEGRATED ITS
Various architectures have been reviewed in [35] [36], to be acquainted with future challenges in
developing distributed multi-sensor surveillance system, especially in terms of communication or
integration between different modules of communication protocols and the creation of metadata
B. Hardjono, A. Wibisono, A. Nurhadiyatna, I.Sina and W. Jatmiko, VIRTUAL DETECTION ZONE IN SMART PHONE, WITH CCTV, AND TWITTER AS PART OF AN INTEGRATED ITS
1834
standards. In our previous work [37] we have attempted to provide intelligence to the traffic light
system with swarm-self organizing map.
In our proposed integrated ITS architecture, there are 3 actors, or 2 traffic sensors and 1 traffic
verifier. Hand phones with location data acquisition, require user’s interface to act as agents,
while Twitter as a second actor, requires dedicated users to feed in traffic data. Thirdly, CCTV or
video cameras require no users, but their video images must be collated and processed to extract
useful traffic data. The embedded application or agent will have to perform various tasks, such
as, comparing current GPS coordinate to the nearest detection coordinates, and assigning road ID.
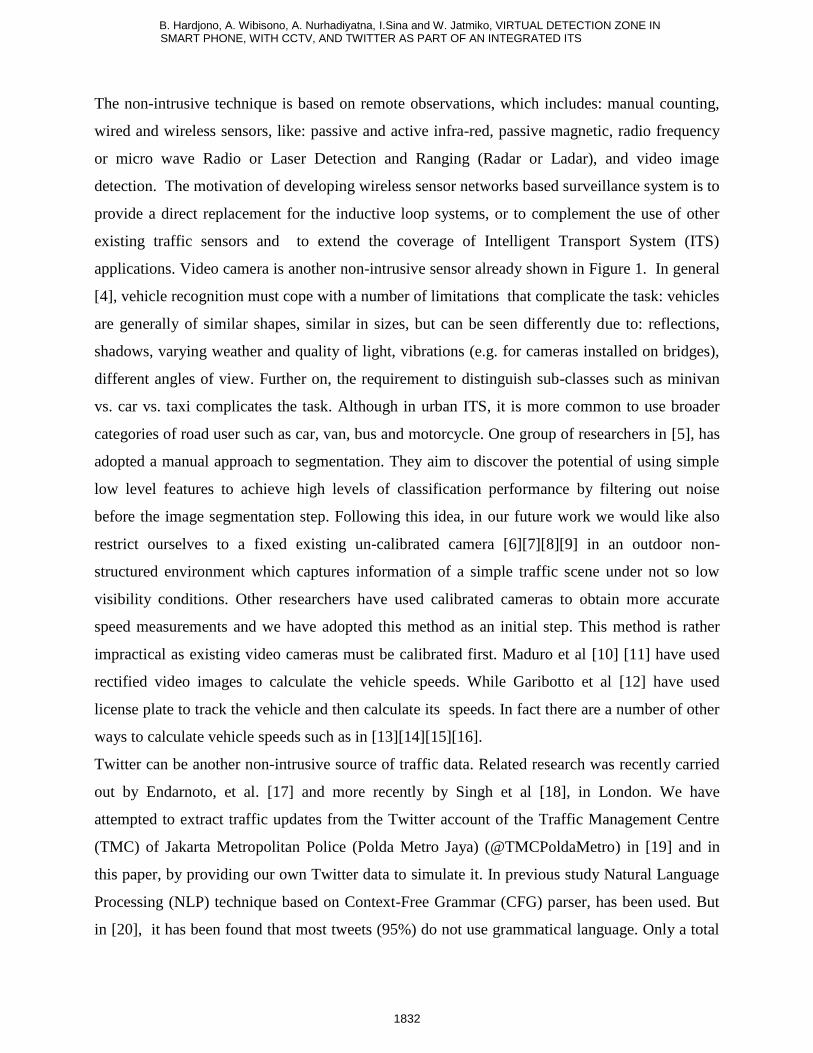
As part of the system, a database server, shown in Figure 2, will collate the data (as well as,
combine, and arbitrate) from multi agents of hand phone traffic sensor, filtered data from CCTV,
and Twitter.
Figure 2. Use Case of the proposed Integrated ITS’s architecture
Figure 2, shows the Use Case of our proposed integrated ITS architecture. In it we plan to have 3
actors, or 2 traffic sensors and 1 traffic verifier. Hand phones with location data acquisition,
require user’s interface to act as agents, while Twitter as a second actor, requires dedicated users
B. Hardjono, A. Wibisono, A. Nurhadiyatna, I.Sina and W. Jatmiko, VIRTUAL DETECTION ZONE IN SMART PHONE, WITH CCTV, AND TWITTER AS PART OF AN INTEGRATED ITS
1835
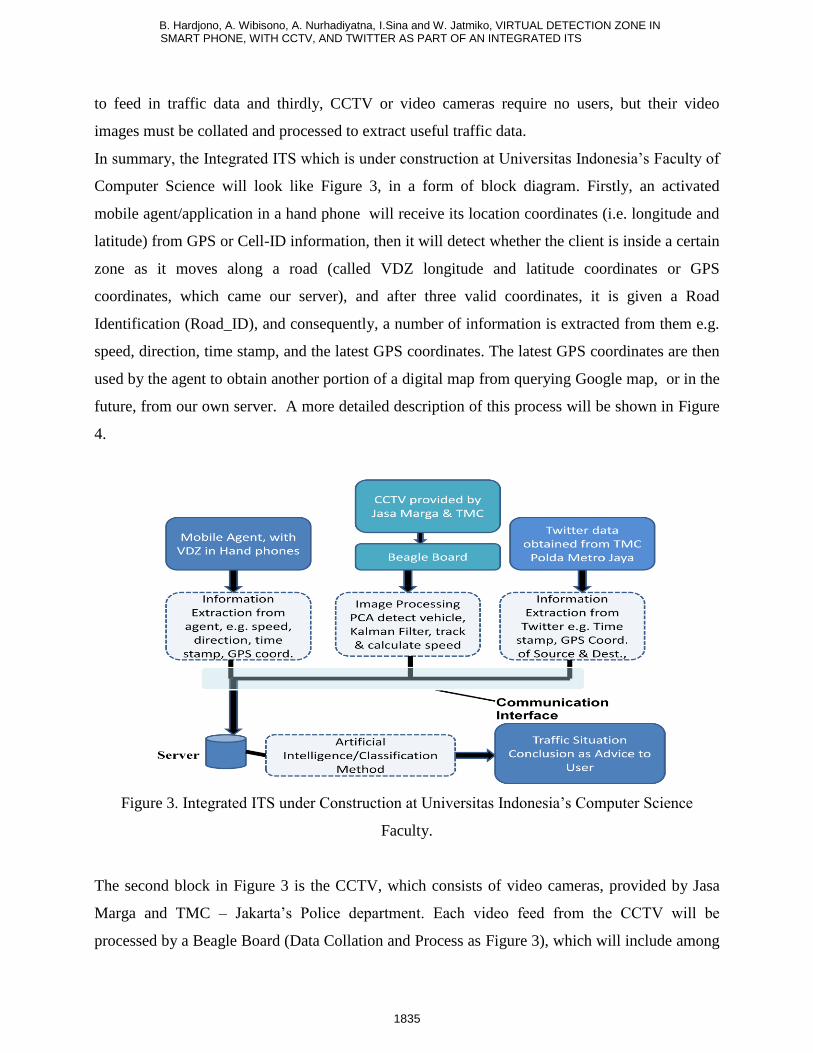
to feed in traffic data and thirdly, CCTV or video cameras require no users, but their video
images must be collated and processed to extract useful traffic data.
In summary, the Integrated ITS which is under construction at Universitas Indonesia’s Faculty of
Computer Science will look like Figure 3, in a form of block diagram. Firstly, an activated
mobile agent/application in a hand phone will receive its location coordinates (i.e. longitude and
latitude) from GPS or Cell-ID information, then it will detect whether the client is inside a certain
zone as it moves along a road (called VDZ longitude and latitude coordinates or GPS
coordinates, which came our server), and after three valid coordinates, it is given a Road
Identification (Road_ID), and consequently, a number of information is extracted from them e.g.
speed, direction, time stamp, and the latest GPS coordinates. The latest GPS coordinates are then
used by the agent to obtain another portion of a digital map from querying Google map, or in the
future, from our own server. A more detailed description of this process will be shown in Figure
4.
Figure 3. Integrated ITS under Construction at Universitas Indonesia’s Computer Science
Faculty.
The second block in Figure 3 is the CCTV, which consists of video cameras, provided by Jasa
Marga and TMC – Jakarta’s Police department. Each video feed from the CCTV will be
processed by a Beagle Board (Data Collation and Process as Figure 3), which will include among
B. Hardjono, A. Wibisono, A. Nurhadiyatna, I.Sina and W. Jatmiko, VIRTUAL DETECTION ZONE IN SMART PHONE, WITH CCTV, AND TWITTER AS PART OF AN INTEGRATED ITS
1836
other things: Image processing, vehicle classification, tracking and speed estimation. Initially,
the Beagle board has been used to emulate the functions of high performance server, which
would be available in the near future. While in the third block of Figure 3, traffic situation is
extracted from TMC’s Twitter data. Finally, the relevant data from three traffic sensors is sent via
a communication interface to a server, and is processed to give a useful traffic advice to the user.
In the following section, the inner workings of these 3 sensors are discussed in detail, in sub
sections A to C.
A. Smart phone as Traffic Sensor
Many researchers have done ground breaking work in order to make mobile phones practicable,
as traffic sensors. It has been found that the smart mobile phone (both GSM and CDMA based),
from several references [38], [39], [24], [40], [21], [23], [41], is considered as a suitable device
for location finder or traffic sensor. To provide location data, a hand phone must use either GPS
(data obtained directly from satellites), A-GPS (data obtained from phone network), Cell-ID, or
Wi-Fi devices, or a mix of them. Based on a our recent experiments, as well as in [30], it has
been decided that the circle of VDZ should be about 50 to 100 meters in radius, and to make the
average speed measurement valid, minimum penetration rate must be satisfied. This requirement
is discussed next, and is followed by the use of parallel threads in VDZ system.
i) Penetration rate
The average speed calculation, using only a few agents for a certain section of a street, would be
valid if the minimum penetration rate is satisfied. Concurrently, we are devising a way to ensure
that minimum penetration rate is satisfied [42], which should be greater than 2-3%. This means
the minimum number of agents should be more than 2% out of the total incoming vehicles during
the period of the experiment. This rule also applies to our average speed calculation from video
images of CCTV.
Similarly as in [23] [39] [40] [43] [44] [45] [46], we apply limitations on the experiment (in our
case, one target road and 3 mobile agents), and the total number of cars is calculated when the
agents/our cars have appeared in our video camera until they have reached a certain road length
in order to estimate the car speed. We call this period of recording and speed measurement as a
B. Hardjono, A. Wibisono, A. Nurhadiyatna, I.Sina and W. Jatmiko, VIRTUAL DETECTION ZONE IN SMART PHONE, WITH CCTV, AND TWITTER AS PART OF AN INTEGRATED ITS
1837
cycle, as the agents will come back again and again, to the same video view, around the chosen
target or road circuit. The results, which include our penetration rate, are presented in Table 3.
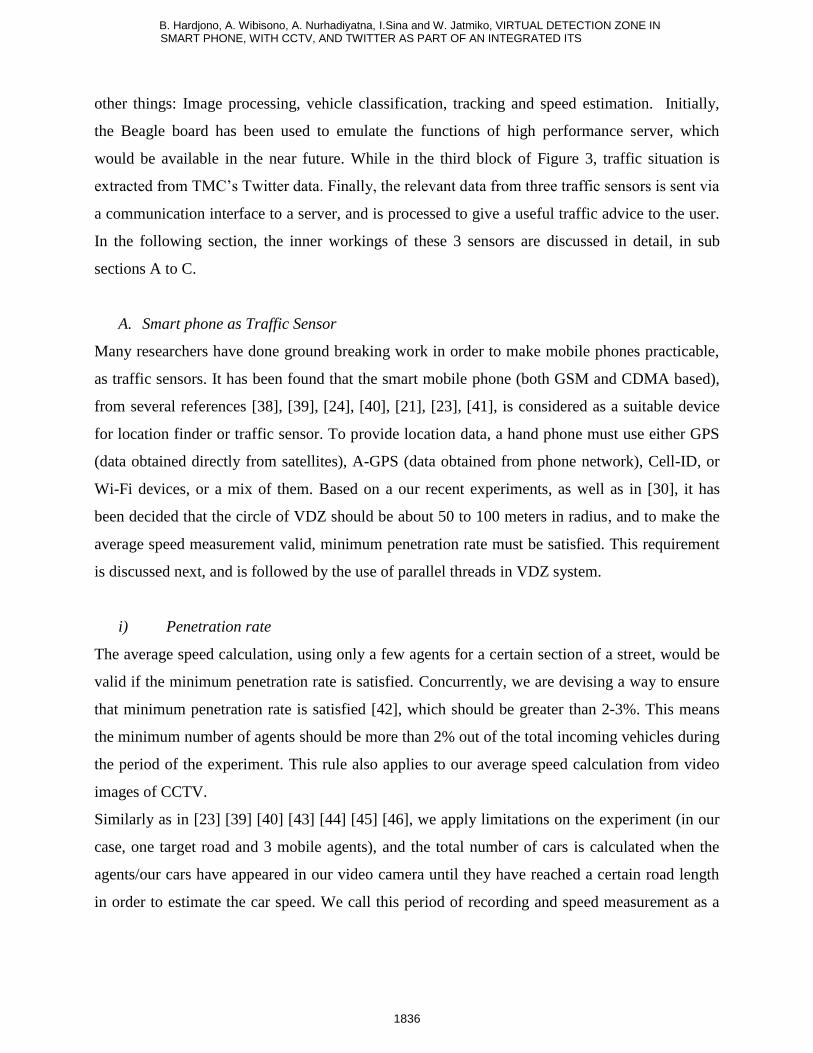
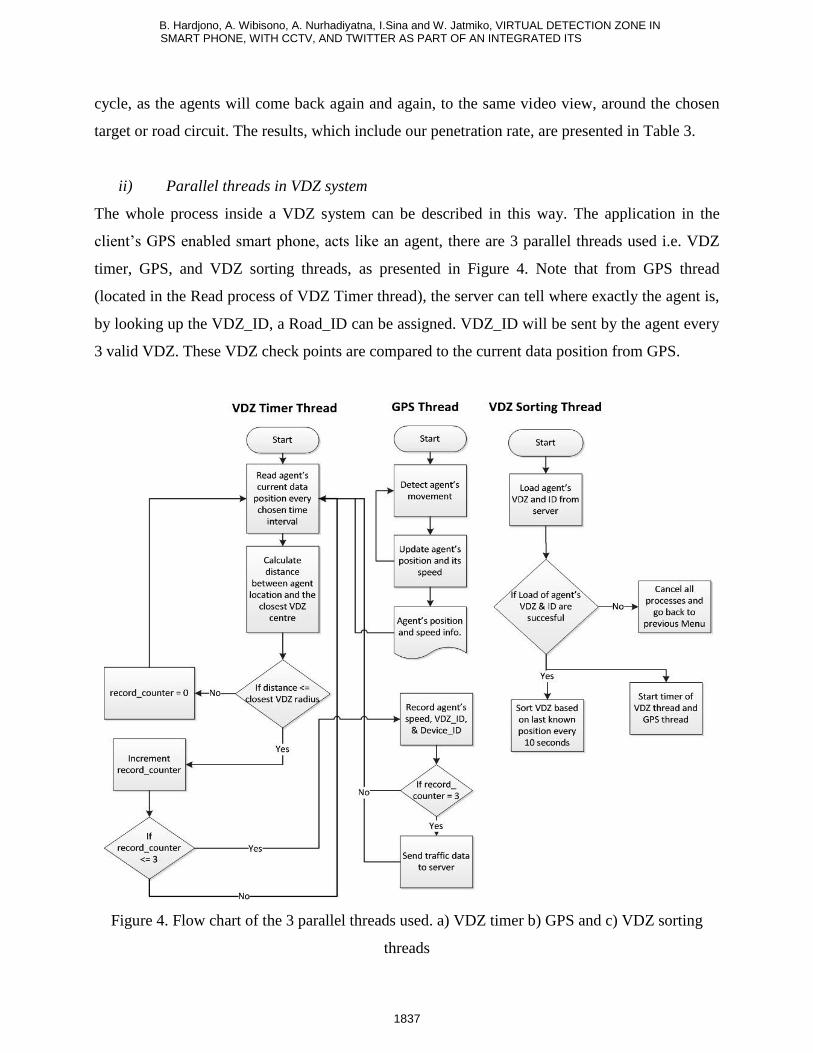
ii) Parallel threads in VDZ system
The whole process inside a VDZ system can be described in this way. The application in the
client’s GPS enabled smart phone, acts like an agent, there are 3 parallel threads used i.e. VDZ
timer, GPS, and VDZ sorting threads, as presented in Figure 4. Note that from GPS thread
(located in the Read process of VDZ Timer thread), the server can tell where exactly the agent is,
by looking up the VDZ_ID, a Road_ID can be assigned. VDZ_ID will be sent by the agent every
3 valid VDZ. These VDZ check points are compared to the current data position from GPS.
Figure 4. Flow chart of the 3 parallel threads used. a) VDZ timer b) GPS and c) VDZ sorting
threads
B. Hardjono, A. Wibisono, A. Nurhadiyatna, I.Sina and W. Jatmiko, VIRTUAL DETECTION ZONE IN SMART PHONE, WITH CCTV, AND TWITTER AS PART OF AN INTEGRATED ITS
1838
The comparison process is performed in VDZ Timer Thread, for every second, which is shown
again in Figure 4. We use a counter to emulate a timer. One second is deemed to be quick
enough, from a simple calculation. VD circular zone of 100m in radius means, 200m of diameter.
If a car travels 150km per hour, it will cover 41.7m in one second. This means VDZ Timer
Thread, theoretically, can get up to 4 detections (200/41.7). If a car travels only 100 km/hour then
in one second it will cover 27.8m, or up to 7 detections. While in the VDZ Sorting Thread, the
sorting process is performed every 10 seconds (for our experiments we also try every 2 seconds).
B. CCTV as traffic sensor
The police and transport departments, as well as, a number of privately owned companies in
Jakarta, have utilized CCTV as the source of information in surveillance and traffic management.
However, in the case of CCTV, its images are only used to observe the traffic manually, without
any automatic system which can detect the condition of each lane. In our previous research
efforts of computer vision [47][48][31], traffic information has been extracted from the recorded
video images. One of our main reasons to use CCTV as traffic sensor is because Jakarta is one
among many cities in Indonesia, which has the largest number of CCTV [49] already installed.
But even in Jakarta, no automatic system has been applied to detect the traffic conditions.
Basically many methods have been proposed in [6], [7], [8], [9], [10], [12], [13], [14], [15]
especially for vehicles speed estimation using video processing via CCTV.
Further more in our previous research [47], [49], [31], we have developed a system which can
detect a vehicle, track it, and count the number of vehicles in a certain period and measure its
speed. Haar-like features are used to detect the vehicle, as the main feature of vehicle detection.
Weak detection (AdaBoost) is used to perform classification between the target vehicle and non
target vehicle. While Kalman filter is used to track the vehicle, so that the target vehicle will not
be accounted for repeatedly in different video frames. An adaptive method is adopted in [47],
[49], and it is implemented in to a Beagle-boardTM
. This board has been used to emulate a High
Performance server which will take all the mentioned video image processes. The High
Performance server, shown already in Figure 3, will also process all the data for the other two
sources, namely Twitter, and smart phones. Adaptive here means to be able to give appropriate
waiting time for the traffic lights in the intersection, according to the car density in that
B. Hardjono, A. Wibisono, A. Nurhadiyatna, I.Sina and W. Jatmiko, VIRTUAL DETECTION ZONE IN SMART PHONE, WITH CCTV, AND TWITTER AS PART OF AN INTEGRATED ITS
1839
intersection. In particular, Distributed Constraint Satisfaction Problem (DCSP) method has been
applied to give the needed waiting time for the traffic lights, to suit the car volume distribution
for each lane. The consequent research [31] is to calculate the car speed on a particular lane as
one of the determining parameters of the traffic condition. Machine learning (Haar training)
method has been used to train the system. This system has three major steps, namely, i) Vehicles
detection, ii) Vehicle tracking, and iii) Vehicle counting [47]. These steps are described in the
following paragraphs.
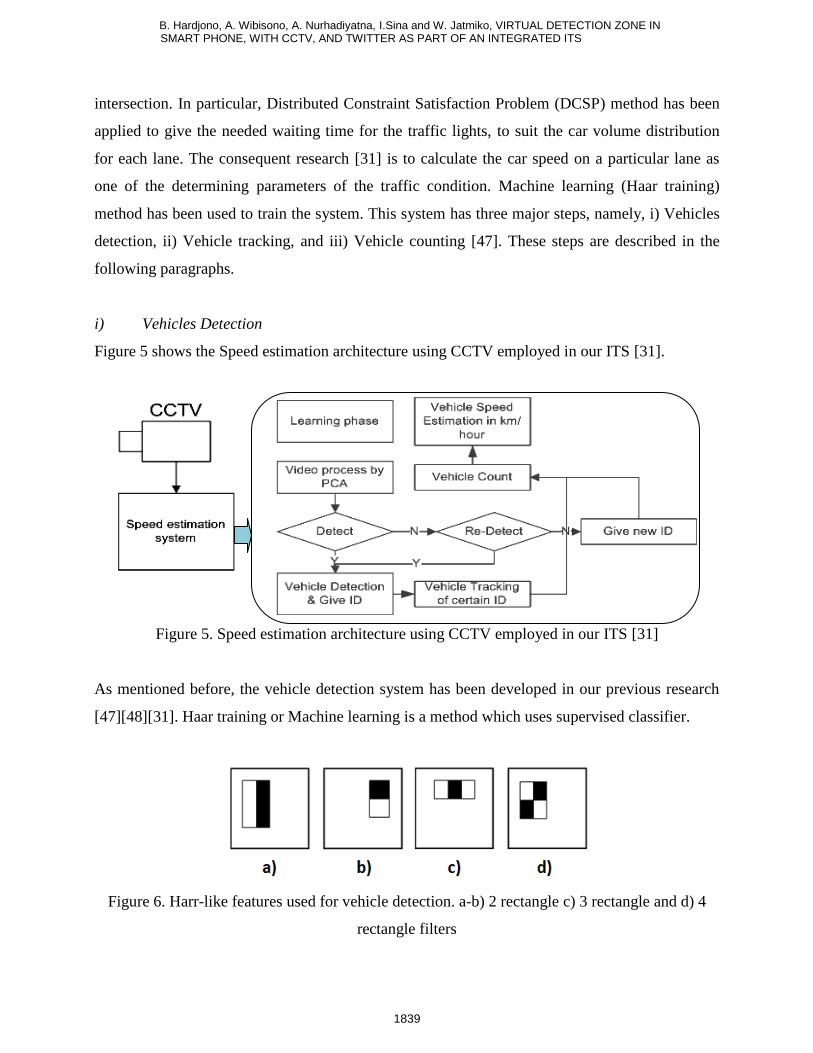
i) Vehicles Detection
Figure 5 shows the Speed estimation architecture using CCTV employed in our ITS [31].
Figure 5. Speed estimation architecture using CCTV employed in our ITS [31]
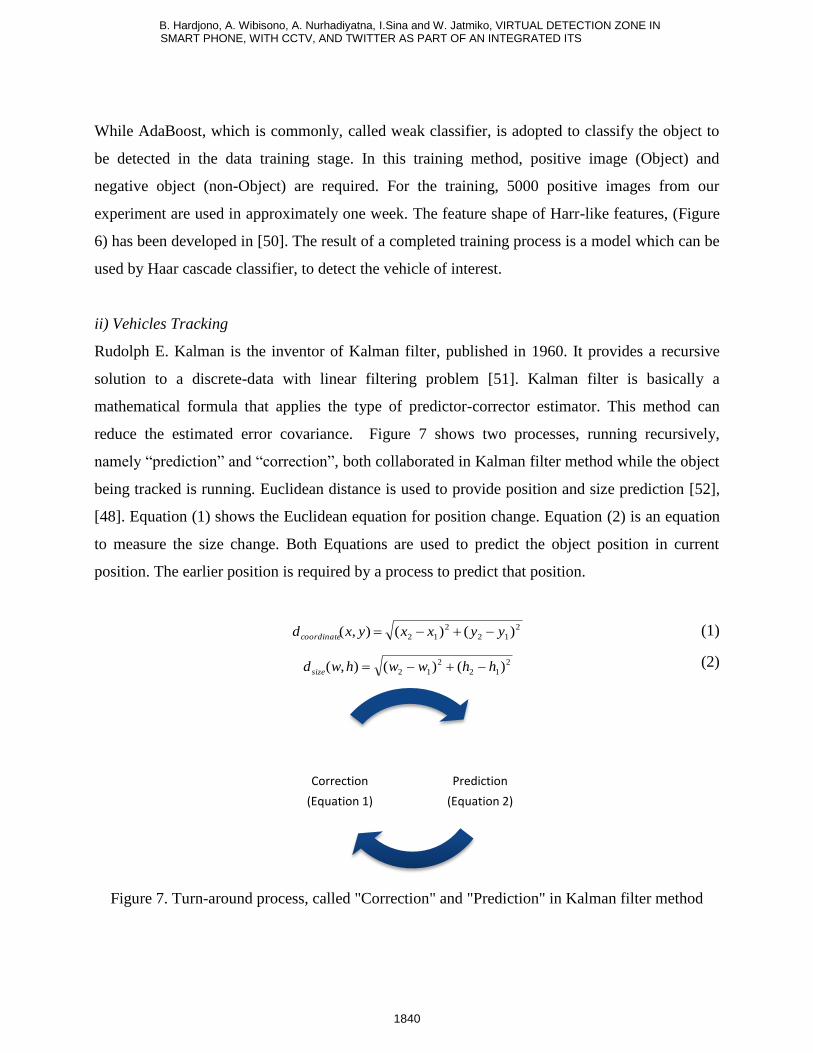
As mentioned before, the vehicle detection system has been developed in our previous research
[47][48][31]. Haar training or Machine learning is a method which uses supervised classifier.
Figure 6. Harr-like features used for vehicle detection. a-b) 2 rectangle c) 3 rectangle and d) 4
rectangle filters
B. Hardjono, A. Wibisono, A. Nurhadiyatna, I.Sina and W. Jatmiko, VIRTUAL DETECTION ZONE IN SMART PHONE, WITH CCTV, AND TWITTER AS PART OF AN INTEGRATED ITS
1840
While AdaBoost, which is commonly, called weak classifier, is adopted to classify the object to
be detected in the data training stage. In this training method, positive image (Object) and
negative object (non-Object) are required. For the training, 5000 positive images from our
experiment are used in approximately one week. The feature shape of Harr-like features, (Figure
6) has been developed in [50]. The result of a completed training process is a model which can be
used by Haar cascade classifier, to detect the vehicle of interest.
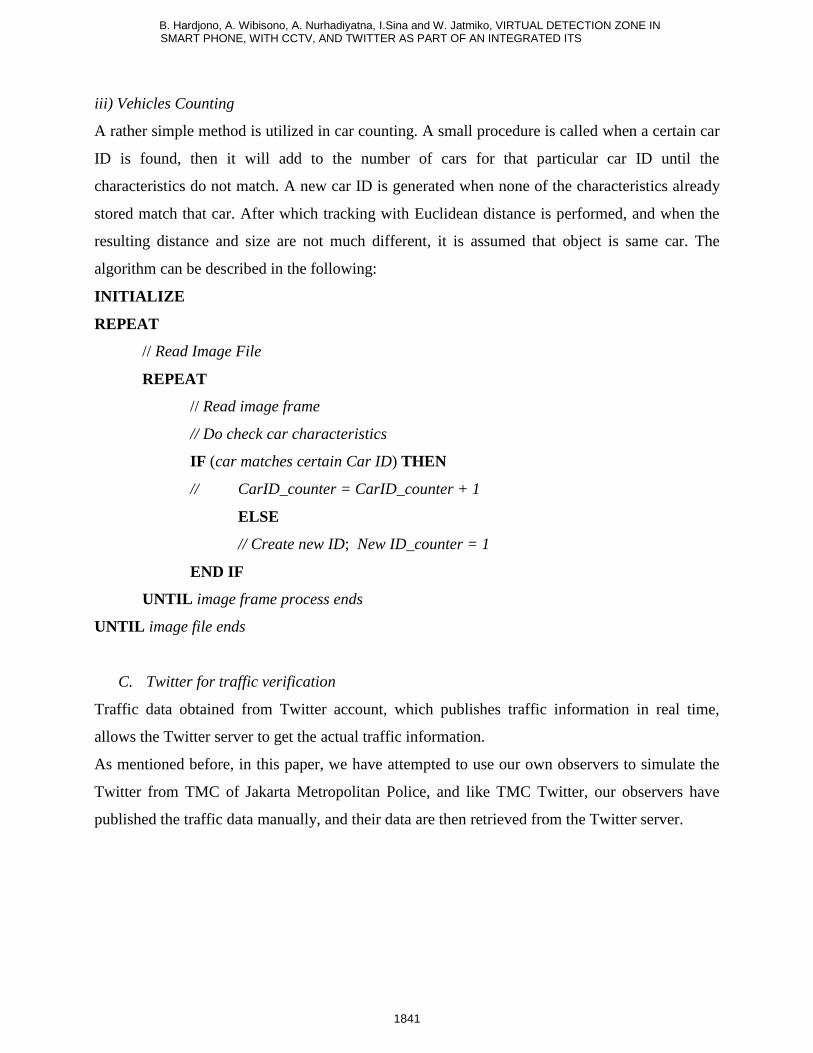
ii) Vehicles Tracking
Rudolph E. Kalman is the inventor of Kalman filter, published in 1960. It provides a recursive
solution to a discrete-data with linear filtering problem [51]. Kalman filter is basically a
mathematical formula that applies the type of predictor-corrector estimator. This method can
reduce the estimated error covariance. Figure 7 shows two processes, running recursively,
namely “prediction” and “correction”, both collaborated in Kalman filter method while the object
being tracked is running. Euclidean distance is used to provide position and size prediction [52],
[48]. Equation (1) shows the Euclidean equation for position change. Equation (2) is an equation
to measure the size change. Both Equations are used to predict the object position in current
position. The earlier position is required by a process to predict that position.
(1)
(2)
Figure 7. Turn-around process, called "Correction" and "Prediction" in Kalman filter method
2
12
2
12 )()(),( yyxxyxdcoordinate
2
12
2
12 )()(),( hhwwhwd size
Prediction
(Equation 2)
Correction
(Equation 1)
B. Hardjono, A. Wibisono, A. Nurhadiyatna, I.Sina and W. Jatmiko, VIRTUAL DETECTION ZONE IN SMART PHONE, WITH CCTV, AND TWITTER AS PART OF AN INTEGRATED ITS
1841
iii) Vehicles Counting
A rather simple method is utilized in car counting. A small procedure is called when a certain car
ID is found, then it will add to the number of cars for that particular car ID until the
characteristics do not match. A new car ID is generated when none of the characteristics already
stored match that car. After which tracking with Euclidean distance is performed, and when the
resulting distance and size are not much different, it is assumed that object is same car. The
algorithm can be described in the following:
INITIALIZE
REPEAT
// Read Image File
REPEAT
// Read image frame
// Do check car characteristics
IF (car matches certain Car ID) THEN
// CarID_counter = CarID_counter + 1
ELSE
// Create new ID; New ID_counter = 1
END IF
UNTIL image frame process ends
UNTIL image file ends
C. Twitter for traffic verification
Traffic data obtained from Twitter account, which publishes traffic information in real time,
allows the Twitter server to get the actual traffic information.
As mentioned before, in this paper, we have attempted to use our own observers to simulate the
Twitter from TMC of Jakarta Metropolitan Police, and like TMC Twitter, our observers have
published the traffic data manually, and their data are then retrieved from the Twitter server.
B. Hardjono, A. Wibisono, A. Nurhadiyatna, I.Sina and W. Jatmiko, VIRTUAL DETECTION ZONE IN SMART PHONE, WITH CCTV, AND TWITTER AS PART OF AN INTEGRATED ITS
1842
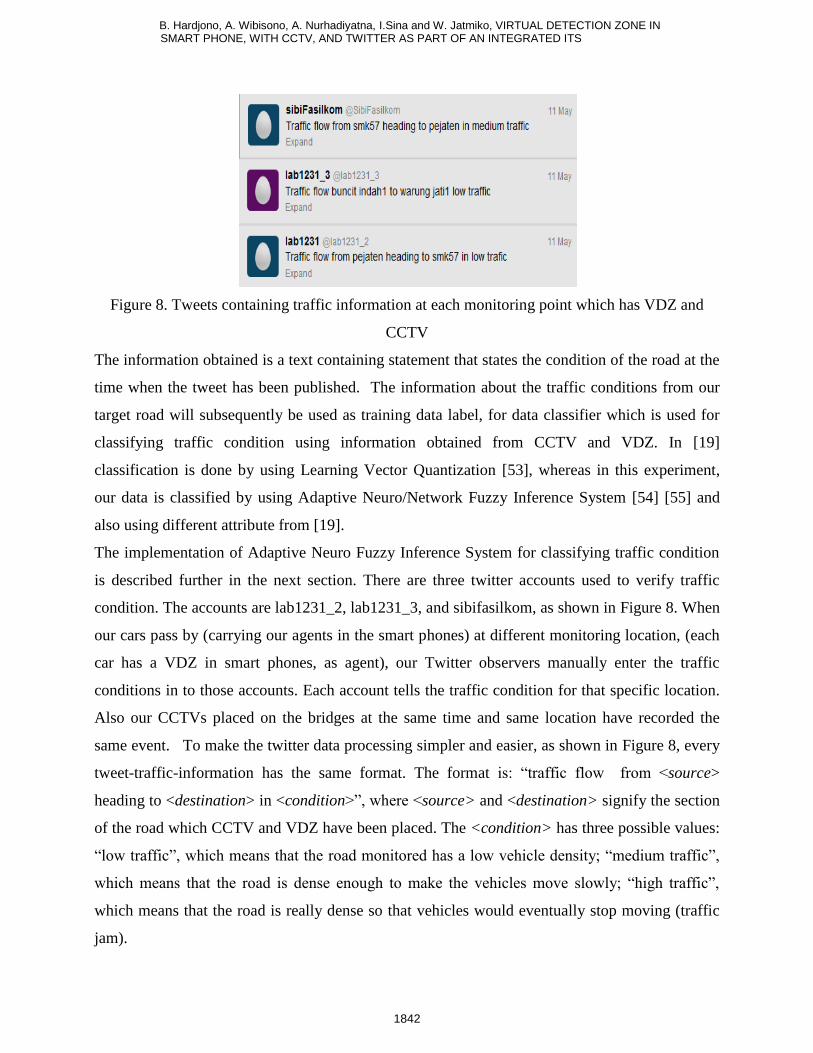
Figure 8. Tweets containing traffic information at each monitoring point which has VDZ and
CCTV
The information obtained is a text containing statement that states the condition of the road at the
time when the tweet has been published. The information about the traffic conditions from our
target road will subsequently be used as training data label, for data classifier which is used for
classifying traffic condition using information obtained from CCTV and VDZ. In [19]
classification is done by using Learning Vector Quantization [53], whereas in this experiment,
our data is classified by using Adaptive Neuro/Network Fuzzy Inference System [54] [55] and
also using different attribute from [19].
The implementation of Adaptive Neuro Fuzzy Inference System for classifying traffic condition
is described further in the next section. There are three twitter accounts used to verify traffic
condition. The accounts are lab1231_2, lab1231_3, and sibifasilkom, as shown in Figure 8. When
our cars pass by (carrying our agents in the smart phones) at different monitoring location, (each
car has a VDZ in smart phones, as agent), our Twitter observers manually enter the traffic
conditions in to those accounts. Each account tells the traffic condition for that specific location.
Also our CCTVs placed on the bridges at the same time and same location have recorded the
same event. To make the twitter data processing simpler and easier, as shown in Figure 8, every
tweet-traffic-information has the same format. The format is: “traffic flow from <source>
heading to <destination> in <condition>”, where <source> and <destination> signify the section
of the road which CCTV and VDZ have been placed. The <condition> has three possible values:
“low traffic”, which means that the road monitored has a low vehicle density; “medium traffic”,
which means that the road is dense enough to make the vehicles move slowly; “high traffic”,
which means that the road is really dense so that vehicles would eventually stop moving (traffic
jam).
B. Hardjono, A. Wibisono, A. Nurhadiyatna, I.Sina and W. Jatmiko, VIRTUAL DETECTION ZONE IN SMART PHONE, WITH CCTV, AND TWITTER AS PART OF AN INTEGRATED ITS
1843
All tweets of traffic information published by the three accounts can be retrieved by requesting
the Twitter API service. Each tweet is then processed to be tokenized for extracting necessary
information based on our/TMC token categories. The categories are:
1. Time Stamp, containing information when the tweet is made. This information is required
to enable data matching between VDZ and CCTV.
2. Source, is the location where vehicles come from on the way to a certain destination.
3. Destination, is the location where the vehicles want to go to. This is also the location of
the observer, where he/she has observed and sends his/her tweet.
4. Condition, is the state of the traffic condition, based on the observer’s considerations
(which should be either low, medium or high traffic).
Further data processing (from CCTV, VDZ, and Twitter) is carried out by the server. Correlation
of data from CCTV, VDZ, and twitter are obtained from time distance when the data have been
created. After data grouping, the data is ready to become training data for multi-label classifier,
which produces an output that describes traffic condition conclusion. This condition can either
be: “low traffic”, or “medium traffic”, or “high traffic”. This classification is needed because
information obtained from twitter is manually generated by human observer, consequently that
kind of information is not always available. That is why the conclusion of the traffic condition
should be acquired from data classification with VDZ and CCTV as input parameters.
III. INTEGRATION OF ITS DATA USING ADAPTIVE NEURO FUZZY INFERENCE
SYSTEM
Adaptive Network-based Fuzzy Inference System, in short ANFIS, was first introduced by Jang
in 1993 [54]. ANFIS provides a basis of constructing a fuzzy if-then rules [56] with appropriate
membership functions to generate the predicted input-output pairs. In this integrated ITS we have
proposed the use of ANFIS to integrate the traffic data from our three sources.
Each function must have equal quantity of membership functions, and rules. ANFIS can be
described by first-order rules of Sugeno fuzzy model.
B. Hardjono, A. Wibisono, A. Nurhadiyatna, I.Sina and W. Jatmiko, VIRTUAL DETECTION ZONE IN SMART PHONE, WITH CCTV, AND TWITTER AS PART OF AN INTEGRATED ITS
1844
Legend:
x, y : Input vectors
Ai, Bi : Fuzzy Set
fi : The output which is in the fuzzy area made by fuzzy rule.
pi, qi, and ri are the determining parameters which are created during the training
process.
A and B are labels of fuzzy sets characterized by appropriate membership functions. Due to their
short form, these if-then rules are often applied to capture the imprecise decisions of reasoning
that have been accounted for, in the human ability to make decisions in an environment of
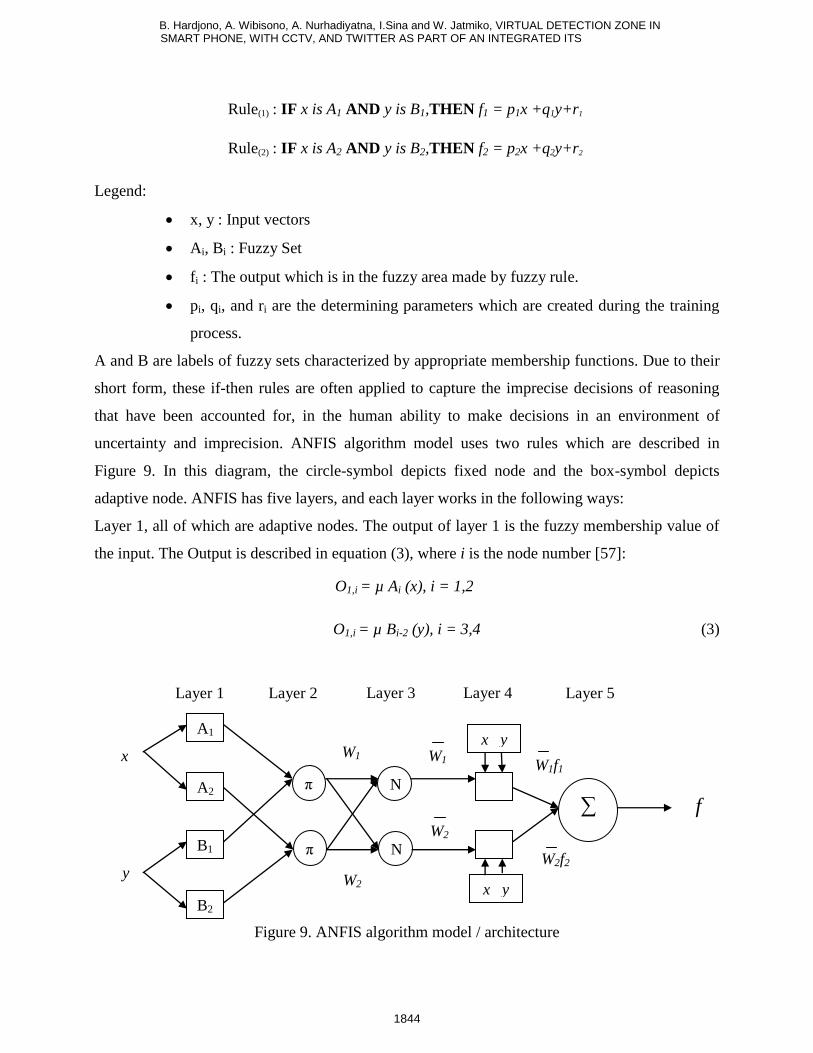
uncertainty and imprecision. ANFIS algorithm model uses two rules which are described in
Figure 9. In this diagram, the circle-symbol depicts fixed node and the box-symbol depicts
adaptive node. ANFIS has five layers, and each layer works in the following ways:
Layer 1, all of which are adaptive nodes. The output of layer 1 is the fuzzy membership value of
the input. The Output is described in equation (3), where i is the node number [57]:
O1,i = µ Bi-2 (y), i = 3,4 (3)
Figure 9. ANFIS algorithm model / architecture
O1,i = µ Ai (x), i = 1,2
Rule(2) : IF x is A2 AND y is B2,THEN f2 = p2x +q2y+r2
Rule(1) : IF x is A1 AND y is B1,THEN f1 = p1x +q1y+r1
A1
A2
B1
B2
π
π
N
N
∑
x
y
Layer 1 Layer 2 Layer 3 Layer 5 Layer 4
x y
x y
W1f1
W2f2
W1
W2
W1
W2
f
B. Hardjono, A. Wibisono, A. Nurhadiyatna, I.Sina and W. Jatmiko, VIRTUAL DETECTION ZONE IN SMART PHONE, WITH CCTV, AND TWITTER AS PART OF AN INTEGRATED ITS
1845
x and y are the input to node i, and Ai and Bi are the linguistic naming such as high, low, medium
or small, large, extra large. They are a part of layer 1 (if-part), which relate to the function node.
µAi(x) and µBi-2(y) can use different kinds of fuzzy membership functions. For example, a bell-
shaped function can be implemented with equation (4) or (5). While the effects of changing
parameters {a, b, c} can seen again in [57].
(4)
or the use of Gaussian membership function in equation (5),
(5)
Ai, Bi, Ci are the parameters of the membership functions. The nodes which are contained in layer
2 is fixed node. Inside this layer there is a fuzzy operator. Layer 2 and 3 consist of the rules and
normalization. Fuzzy operator is used to perform fuzzification operation. The input is represented
in the form of π, means that the input is considered as a simple multiplier. The output of the layer
can be represented as equation (6).
O2,i = wi = µAi (x)* µBi (y), i = 1,2 (6)
Equation (5) is named as additional reinforcement for the rules. In the layer 3, the nodes are also
fixed nodes that are labeled with N, N plays role as a normalization of the previous layer. The
output of layer 3 is represented by the equation (7).
(7)
The fourth layer or also called the then-part layer, contains adaptive nodes. The output of each
node in this layer is a multiplier of the normalized firing strength and a first order polynomial.
The output of this layer is represented by the equation (8).
(8)
ῶ is the weight of the output of the third layer, pi, qi, and ri which are parameters. In the fifth
layer, there is only one fixed node with the name of Σ, this node acts as a summation of all input
coming which is represented in the equation (9).
B. Hardjono, A. Wibisono, A. Nurhadiyatna, I.Sina and W. Jatmiko, VIRTUAL DETECTION ZONE IN SMART PHONE, WITH CCTV, AND TWITTER AS PART OF AN INTEGRATED ITS
1846
(9)
Hybrid Learning Algorithm
Learning algorithm which is used in the ANFIS is a combination of gradient descent method and
least squares method. In the forward pass of the hybrid learning algorithm, the output node will
run forward until it reaches fourth layer and the parameters will be determined using the least
square algorithm. In the backward pass, error markers will propagate backward, and the premise
parameters are updated using a gradient descent method. Hybrid learning approach can be used to
find a convergent point faster than the back propagation method. The output of the hybrid
algorithm can be represented in equation (10),
(10)
p1,q1, r1, p2, q2 and r2 are linear parameters. Least squares method is used to identify the optimal
values of all parameters. When the premise parameters are not fixed then the search dimension
become larger and consequently through training, convergence can be achieved but slower. The
ANFIS algorithm combines the two methods, the method of least square and gradient descent
method to solve the problem of search dimensions. Least squared method is used to optimize the
consequent parameters. Gradient of descent method is used to perform the optimization of the
premise parameters. The output of ANFIS is calculated by using the consequent parameters
which are obtained from the forward pass. Output error is used to learn from the premise
parameters. The output proves that the hybrid algorithm is more efficient in conducting training
in ANFIS system.
IV. TRAFFIC SENSORS RESULTS AND DISCUSSION
i) Experiment Data Gathering Scenario
The data needed, as mentioned before, are obtained from two vehicle detection sensors i.e. CCTV
camera and smart phone with VDZ, and one verifier i.e. Twitter. The experiment has also been
B. Hardjono, A. Wibisono, A. Nurhadiyatna, I.Sina and W. Jatmiko, VIRTUAL DETECTION ZONE IN SMART PHONE, WITH CCTV, AND TWITTER AS PART OF AN INTEGRATED ITS
1847
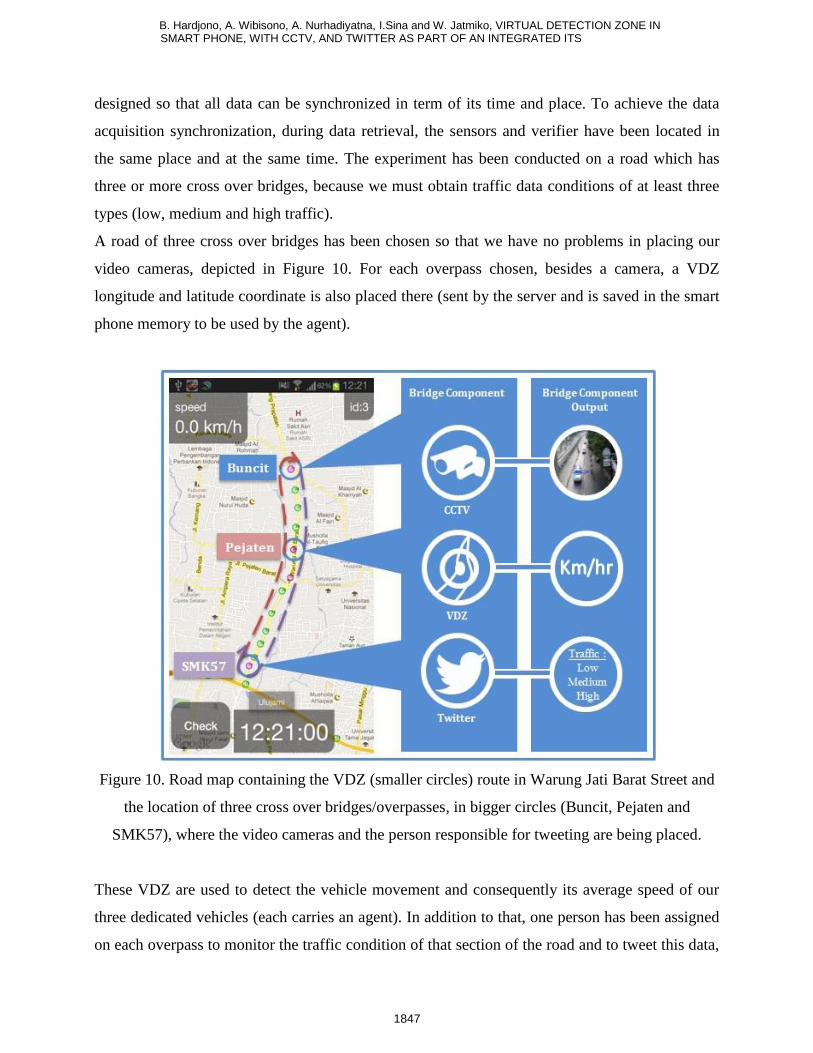
designed so that all data can be synchronized in term of its time and place. To achieve the data
acquisition synchronization, during data retrieval, the sensors and verifier have been located in
the same place and at the same time. The experiment has been conducted on a road which has
three or more cross over bridges, because we must obtain traffic data conditions of at least three
types (low, medium and high traffic).
A road of three cross over bridges has been chosen so that we have no problems in placing our
video cameras, depicted in Figure 10. For each overpass chosen, besides a camera, a VDZ
longitude and latitude coordinate is also placed there (sent by the server and is saved in the smart
phone memory to be used by the agent).
Figure 10. Road map containing the VDZ (smaller circles) route in Warung Jati Barat Street and
the location of three cross over bridges/overpasses, in bigger circles (Buncit, Pejaten and
SMK57), where the video cameras and the person responsible for tweeting are being placed.
These VDZ are used to detect the vehicle movement and consequently its average speed of our
three dedicated vehicles (each carries an agent). In addition to that, one person has been assigned
on each overpass to monitor the traffic condition of that section of the road and to tweet this data,
B. Hardjono, A. Wibisono, A. Nurhadiyatna, I.Sina and W. Jatmiko, VIRTUAL DETECTION ZONE IN SMART PHONE, WITH CCTV, AND TWITTER AS PART OF AN INTEGRATED ITS
1848
in to the Twitter account described before (as a verifier) using a hand phone. Consequently, there
are 3 smart phones (GPS enabled) inside three dedicated vehicles and another 3 phones to enter
traffic condition in to 3 Twitter accounts.
Distance between the three agent vehicles is designed to be close so that the vehicles can enter
VDZ and pass the overpass in a short period of time. When the vehicles have entered VDZ, the
agent application (which has been installed in the android – GPS enabled mobile phones), sends
the data to our server. To obtain a complete data, the three vehicle-carrying agents drove around
(as a cycle) the experimental route several times, as shown again in Figure 10.
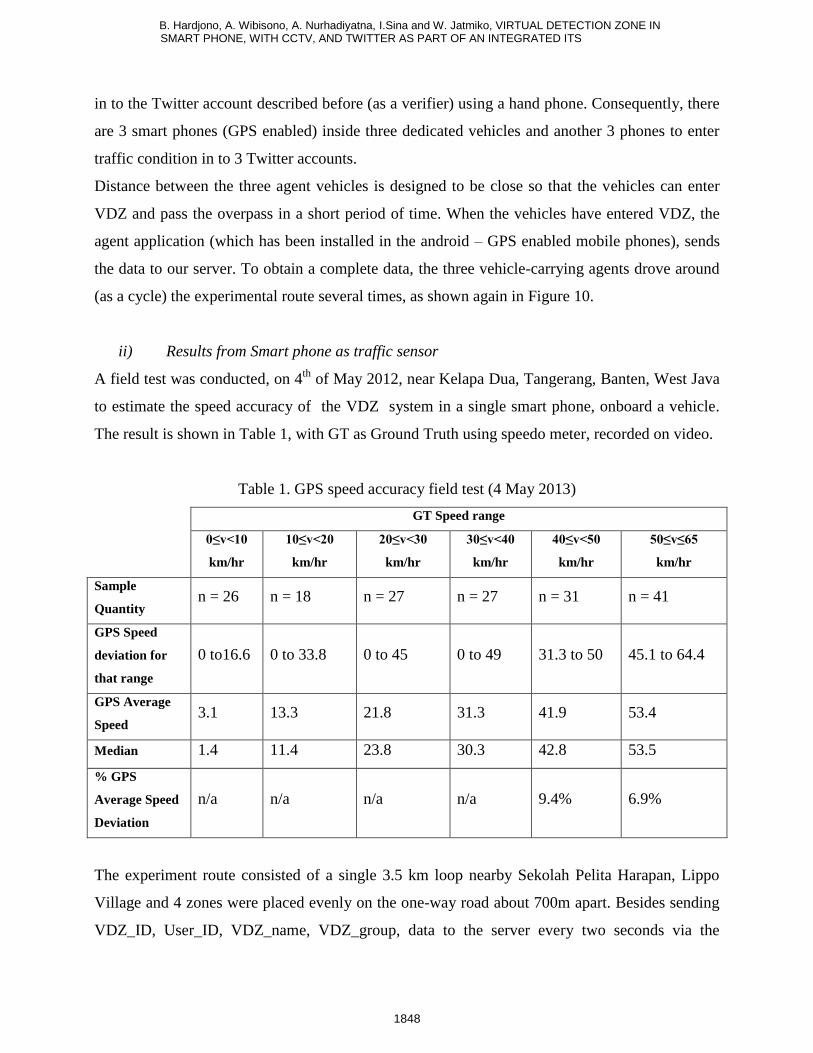
ii) Results from Smart phone as traffic sensor
A field test was conducted, on 4th
of May 2012, near Kelapa Dua, Tangerang, Banten, West Java
to estimate the speed accuracy of the VDZ system in a single smart phone, onboard a vehicle.
The result is shown in Table 1, with GT as Ground Truth using speedo meter, recorded on video.
Table 1. GPS speed accuracy field test (4 May 2013)
GT Speed range
0≤v<10
km/hr
10≤v<20
km/hr
20≤v<30
km/hr
30≤v<40
km/hr
40≤v<50
km/hr
50≤v≤65
km/hr
Sample
Quantity n = 26 n = 18 n = 27 n = 27 n = 31 n = 41
GPS Speed
deviation for
that range
0 to16.6 0 to 33.8 0 to 45 0 to 49 31.3 to 50 45.1 to 64.4
GPS Average
Speed 3.1 13.3 21.8 31.3 41.9 53.4
Median 1.4 11.4 23.8 30.3 42.8 53.5
% GPS
Average Speed
Deviation
n/a n/a n/a n/a 9.4% 6.9%
The experiment route consisted of a single 3.5 km loop nearby Sekolah Pelita Harapan, Lippo
Village and 4 zones were placed evenly on the one-way road about 700m apart. Besides sending
VDZ_ID, User_ID, VDZ_name, VDZ_group, data to the server every two seconds via the
B. Hardjono, A. Wibisono, A. Nurhadiyatna, I.Sina and W. Jatmiko, VIRTUAL DETECTION ZONE IN SMART PHONE, WITH CCTV, AND TWITTER AS PART OF AN INTEGRATED ITS
1849
CDMA phone network, speed measurement via GPS is displayed (as in Figure 13) on the smart
phone, which has been captured using a video camera, located behind the driver’s seat, together
with the car’s speedometer.
As it can be seen in Table 1 the difference between GPS average speed and its median speed,
becomes smaller as it goes to higher speed. In 50≤v≤65 km/hr range the difference is only 0.1,
while at the lowest speed range, 0≤v<10 km/hr, the difference can be as big as 1.7 km/hr.
Nevertheless, in the lowest speed range of 0≤v<10 km/hr, the deviation can be in the range of 0
to16.6 km/hr. The cell with n/a signifies that the speed reading can be showing 0 km/hour in
those speed ranges. The result would be better if GPS data is read every second rather than every
two seconds, however, it would also drain the smart phone battery faster. One explanation for
such a big deviation in low range speed is GPS speed can be read just before the car stops.
Consequently, the smart phone will still show the last speed, while as GT, the car has completely
stopped. These GPS speed data have been obtained using a CDMA based, hand phone, Samsung
Galaxy Young which has cost less than USD100 in mid 2012, purchased in Tangerang. Other
phones used in our experiments are Samsung Galaxy Note 1, and Galaxy Tab.
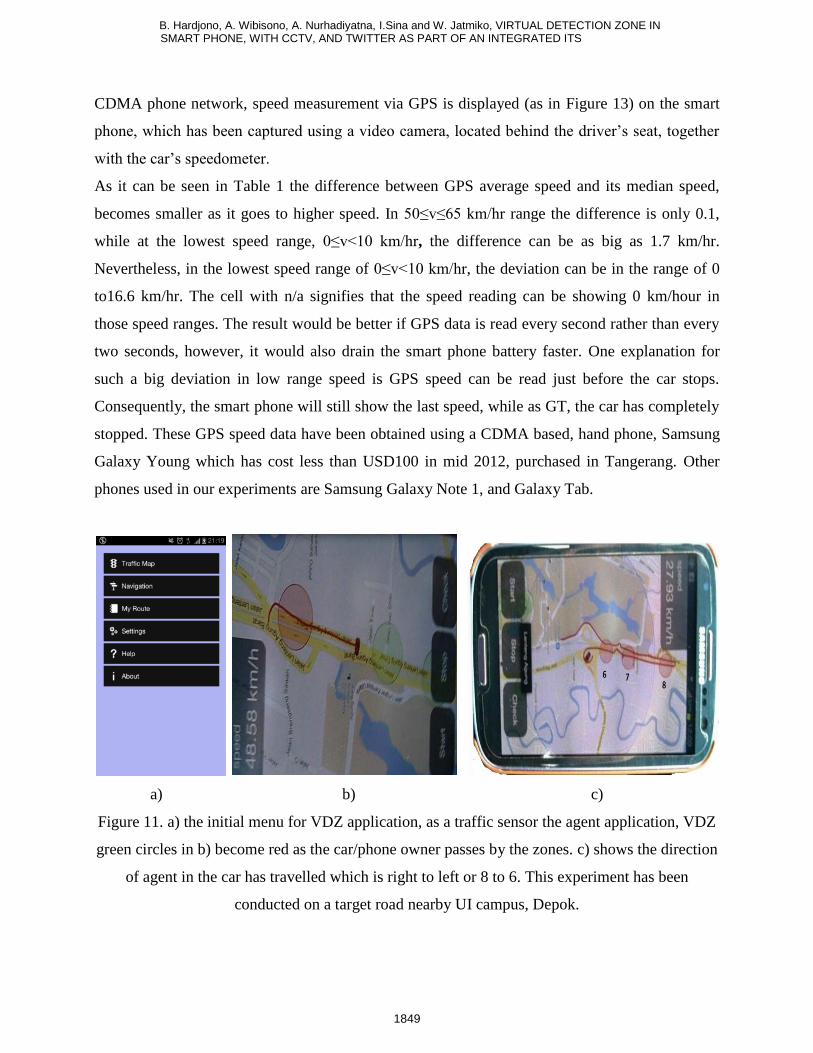
a) b) c)
Figure 11. a) the initial menu for VDZ application, as a traffic sensor the agent application, VDZ
green circles in b) become red as the car/phone owner passes by the zones. c) shows the direction
of agent in the car has travelled which is right to left or 8 to 6. This experiment has been
conducted on a target road nearby UI campus, Depok.
B. Hardjono, A. Wibisono, A. Nurhadiyatna, I.Sina and W. Jatmiko, VIRTUAL DETECTION ZONE IN SMART PHONE, WITH CCTV, AND TWITTER AS PART OF AN INTEGRATED ITS
1850
Figure 11 a) shows the initial menu for VDZ application, as a traffic sensor. VDZ green circles in
the agent application b) become red as the car of the smart phone owner (see b), passes by the
zones. This experiment has been conducted on a target road nearby UI campus, Depok. While c)
shows the VDZ_ID given by the server (zones 8, 7, 6 become red after the agent has passed by).
Referring again to Figure 11a-c, the graphic user interface in the mobile VDZ application, is
designed so that when the VD circle turns red from green (see second circle from left of b),
during the experiment, the driver can confirm via a handy talkie, whether the speed from smart
phone is well recorded in the server. We have another person, with a handy talkie, who is
monitoring the data in the server concurrently, in a nearby coffee shop.
a)
b) c)
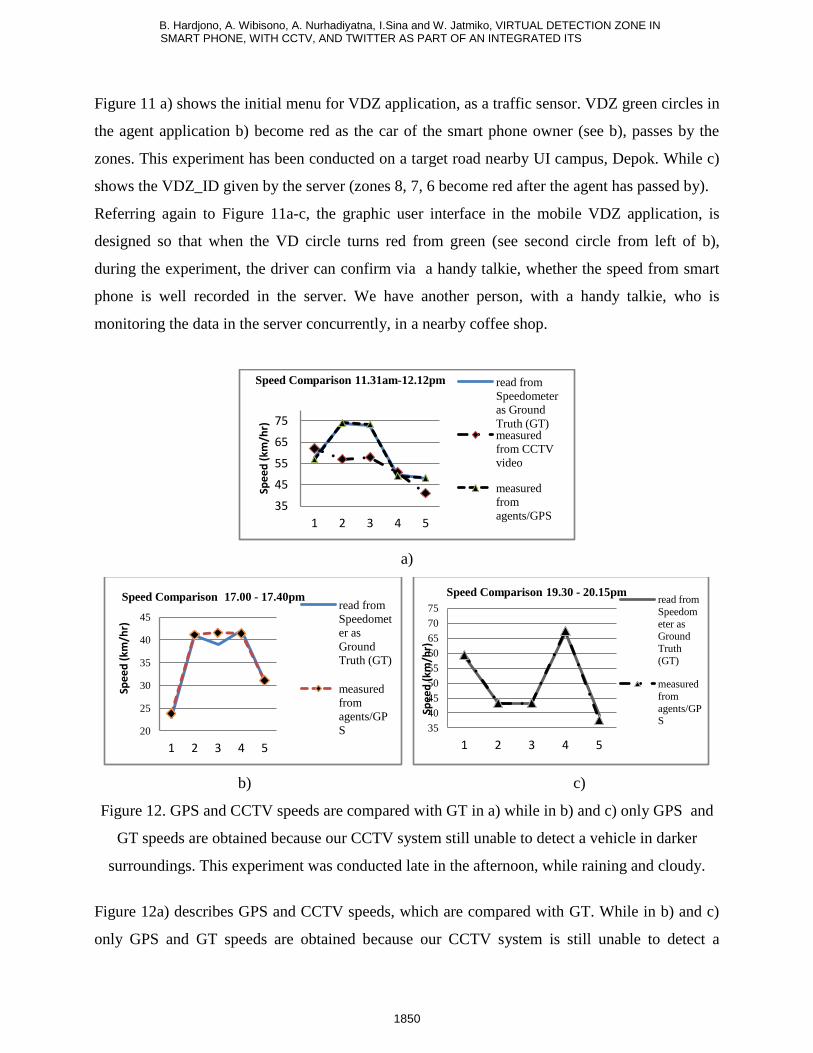
Figure 12. GPS and CCTV speeds are compared with GT in a) while in b) and c) only GPS and
GT speeds are obtained because our CCTV system still unable to detect a vehicle in darker
surroundings. This experiment was conducted late in the afternoon, while raining and cloudy.
Figure 12a) describes GPS and CCTV speeds, which are compared with GT. While in b) and c)
only GPS and GT speeds are obtained because our CCTV system is still unable to detect a
35
45
55
65
75
1 2 3 4 5
Spe
ed
(km
/hr)
Speed Comparison 11.31am-12.12pm read from
Speedometer
as Ground
Truth (GT) measured
from CCTV
video
measured
from
agents/GPS
20
25
30
35
40
45
1 2 3 4 5
Spe
ed
(km
/hr)
Speed Comparison 17.00 - 17.40pm read from
Speedomet
er as
Ground
Truth (GT)
measured
from
agents/GP
S 35
40
45
50
55
60
65
70
75
1 2 3 4 5
Spe
ed
(km
/hr)
Speed Comparison 19.30 - 20.15pm read from
Speedom
eter as Ground
Truth
(GT)
measured
from
agents/GPS
B. Hardjono, A. Wibisono, A. Nurhadiyatna, I.Sina and W. Jatmiko, VIRTUAL DETECTION ZONE IN SMART PHONE, WITH CCTV, AND TWITTER AS PART OF AN INTEGRATED ITS
1851
vehicle in darker surroundings (close to night time). This experiment was conducted late in the
afternoon, while raining and cloudy. As it can be observed, the agent provides a closer agreement
to the GT speed records than the extracted speeds from CCTV video images.
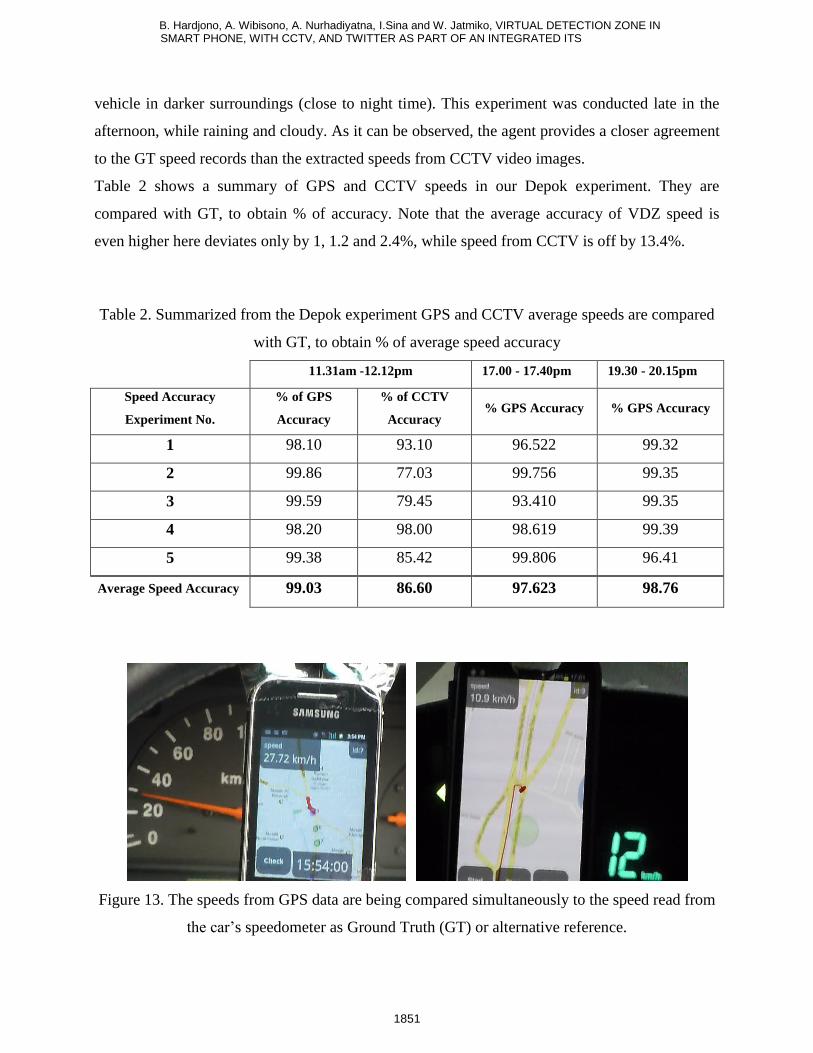
Table 2 shows a summary of GPS and CCTV speeds in our Depok experiment. They are
compared with GT, to obtain % of accuracy. Note that the average accuracy of VDZ speed is
even higher here deviates only by 1, 1.2 and 2.4%, while speed from CCTV is off by 13.4%.
Table 2. Summarized from the Depok experiment GPS and CCTV average speeds are compared
with GT, to obtain % of average speed accuracy
11.31am -12.12pm 17.00 - 17.40pm 19.30 - 20.15pm
Speed Accuracy
Experiment No.
% of GPS
Accuracy
% of CCTV
Accuracy % GPS Accuracy % GPS Accuracy
1 98.10 93.10 96.522 99.32
2 99.86 77.03 99.756 99.35
3 99.59 79.45 93.410 99.35
4 98.20 98.00 98.619 99.39
5 99.38 85.42 99.806 96.41
Average Speed Accuracy 99.03 86.60 97.623 98.76
Figure 13. The speeds from GPS data are being compared simultaneously to the speed read from
the car’s speedometer as Ground Truth (GT) or alternative reference.
B. Hardjono, A. Wibisono, A. Nurhadiyatna, I.Sina and W. Jatmiko, VIRTUAL DETECTION ZONE IN SMART PHONE, WITH CCTV, AND TWITTER AS PART OF AN INTEGRATED ITS
1852
Figure 13 shows the speeds from GPS data which are being compared simultaneously to the
speed read from the car’s speedometer as Ground Truth (GT) or alternative reference. In the Left
side of this figure, analog speedometer (Isuzu New Panther) is presented, showing 29km/hr while
the phone displays the agent’s speed of 27.7km/hr. In the right, a reading of a digital
speedometer, with a value of 12km/hr in a Toyota Vios is shown, while the phone displays
10.9km/hr. It should be noted that they both carry similar accuracy.
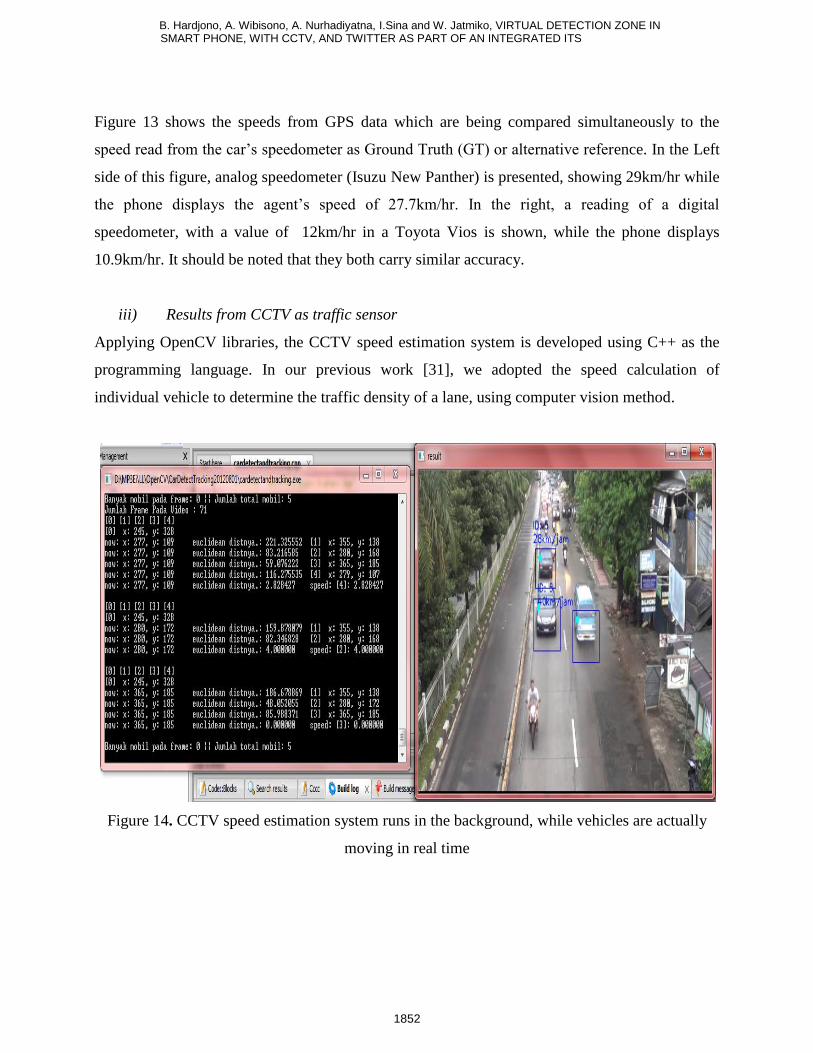
iii) Results from CCTV as traffic sensor
Applying OpenCV libraries, the CCTV speed estimation system is developed using C++ as the
programming language. In our previous work [31], we adopted the speed calculation of
individual vehicle to determine the traffic density of a lane, using computer vision method.
Figure 14. CCTV speed estimation system runs in the background, while vehicles are actually
moving in real time
B. Hardjono, A. Wibisono, A. Nurhadiyatna, I.Sina and W. Jatmiko, VIRTUAL DETECTION ZONE IN SMART PHONE, WITH CCTV, AND TWITTER AS PART OF AN INTEGRATED ITS
1853
Figure 14 shows the system as it runs the program (see left), it also displays the vehicles (see
right) in real time, with different rectangular colour, signifying the state of detection (successful
or unsuccessful) and the speed of each passing vehicle in the successful detection state.
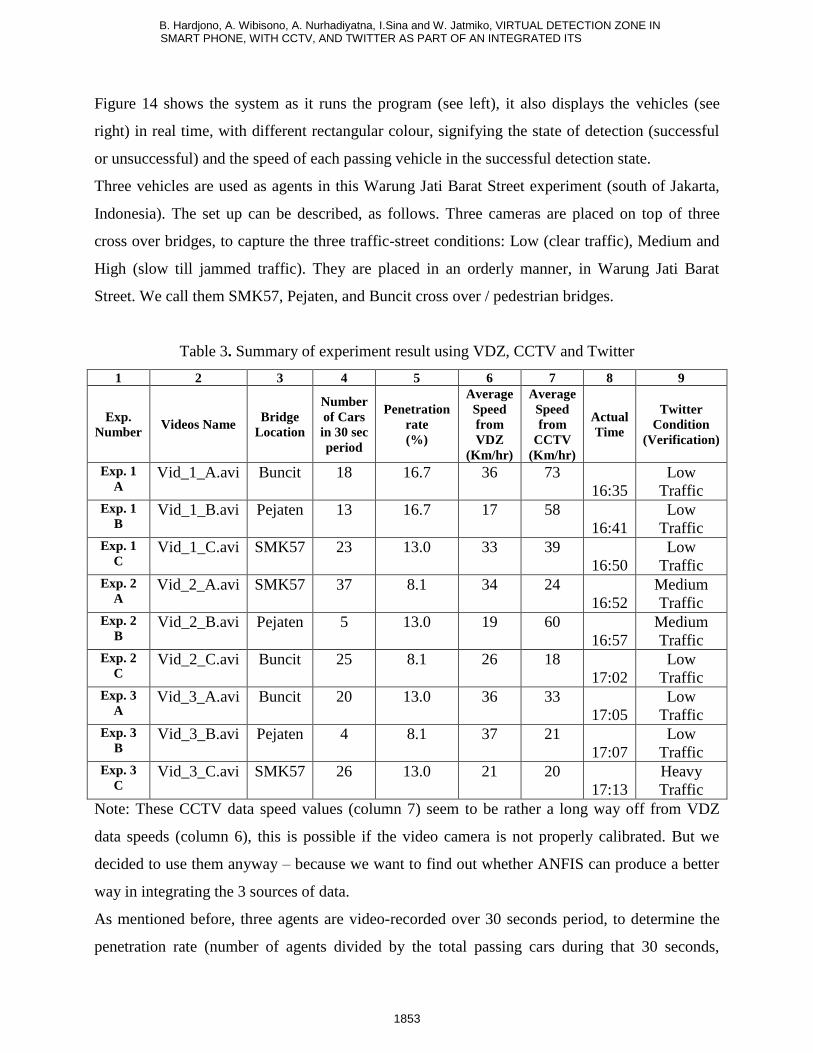
Three vehicles are used as agents in this Warung Jati Barat Street experiment (south of Jakarta,
Indonesia). The set up can be described, as follows. Three cameras are placed on top of three
cross over bridges, to capture the three traffic-street conditions: Low (clear traffic), Medium and
High (slow till jammed traffic). They are placed in an orderly manner, in Warung Jati Barat
Street. We call them SMK57, Pejaten, and Buncit cross over / pedestrian bridges.
Table 3. Summary of experiment result using VDZ, CCTV and Twitter
1 2 3 4 5 6 7 8 9
Exp.
Number Videos Name
Bridge
Location
Number
of Cars
in 30 sec
period
Penetration
rate
(%)
Average
Speed
from
VDZ
(Km/hr)
Average
Speed
from
CCTV
(Km/hr)
Actual
Time
Condition
(Verification)
Exp. 1
A Vid_1_A.avi Buncit 18 16.7 36 73
16:35
Low
Traffic Exp. 1
B Vid_1_B.avi Pejaten 13 16.7 17 58
16:41
Low
Traffic Exp. 1
C Vid_1_C.avi SMK57 23 13.0 33 39
16:50
Low
Traffic Exp. 2
A Vid_2_A.avi SMK57 37 8.1 34 24
16:52
Medium
Traffic Exp. 2
B Vid_2_B.avi Pejaten 5 13.0 19 60
16:57
Medium
Traffic Exp. 2
C Vid_2_C.avi Buncit 25 8.1 26 18
17:02
Low
Traffic Exp. 3
A Vid_3_A.avi Buncit 20 13.0 36 33
17:05
Low
Traffic Exp. 3
B Vid_3_B.avi Pejaten 4 8.1 37 21
17:07
Low
Traffic Exp. 3
C Vid_3_C.avi SMK57 26 13.0 21 20
17:13
Heavy
Traffic
Note: These CCTV data speed values (column 7) seem to be rather a long way off from VDZ
data speeds (column 6), this is possible if the video camera is not properly calibrated. But we
decided to use them anyway – because we want to find out whether ANFIS can produce a better
way in integrating the 3 sources of data.
As mentioned before, three agents are video-recorded over 30 seconds period, to determine the
penetration rate (number of agents divided by the total passing cars during that 30 seconds,
B. Hardjono, A. Wibisono, A. Nurhadiyatna, I.Sina and W. Jatmiko, VIRTUAL DETECTION ZONE IN SMART PHONE, WITH CCTV, AND TWITTER AS PART OF AN INTEGRATED ITS
1854
should be higher than 2%) and thus makes the average speed calculation valid. For example,
penetration rate of Exp. 1A (Table 3, second row, fifth column) 16.7 % is obtained from 3/18 (3
is the number of agents, and 18 is the total passing cars during that 30 seconds).
The average speed from CCTV data is shown in Table 3, column 7, and it is obtained by
summing all the individual speeds of each agent divided by the number of agents during that 30
seconds period. Similarly, the average speed from VDZ in Table 3, column 6, is shown next to
penetration rate data, column 5.In our previous research [47], [48], [58], we also used this kind of
environment to detect and track vehicles.
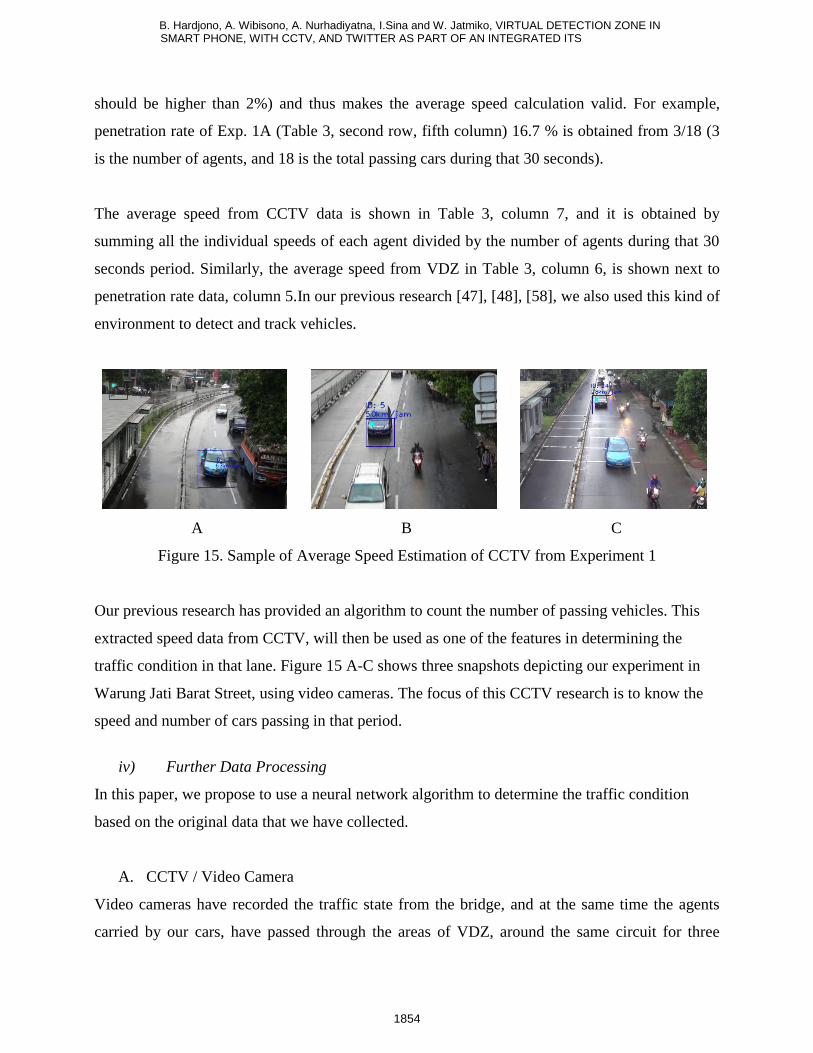
A B C
Figure 15. Sample of Average Speed Estimation of CCTV from Experiment 1
Our previous research has provided an algorithm to count the number of passing vehicles. This
extracted speed data from CCTV, will then be used as one of the features in determining the
traffic condition in that lane. Figure 15 A-C shows three snapshots depicting our experiment in
Warung Jati Barat Street, using video cameras. The focus of this CCTV research is to know the
speed and number of cars passing in that period.
iv) Further Data Processing
In this paper, we propose to use a neural network algorithm to determine the traffic condition
based on the original data that we have collected.
A. CCTV / Video Camera
Video cameras have recorded the traffic state from the bridge, and at the same time the agents
carried by our cars, have passed through the areas of VDZ, around the same circuit for three
B. Hardjono, A. Wibisono, A. Nurhadiyatna, I.Sina and W. Jatmiko, VIRTUAL DETECTION ZONE IN SMART PHONE, WITH CCTV, AND TWITTER AS PART OF AN INTEGRATED ITS
1855
times. The data which is obtained from the processed video footage is shown in Table 3, column
7.
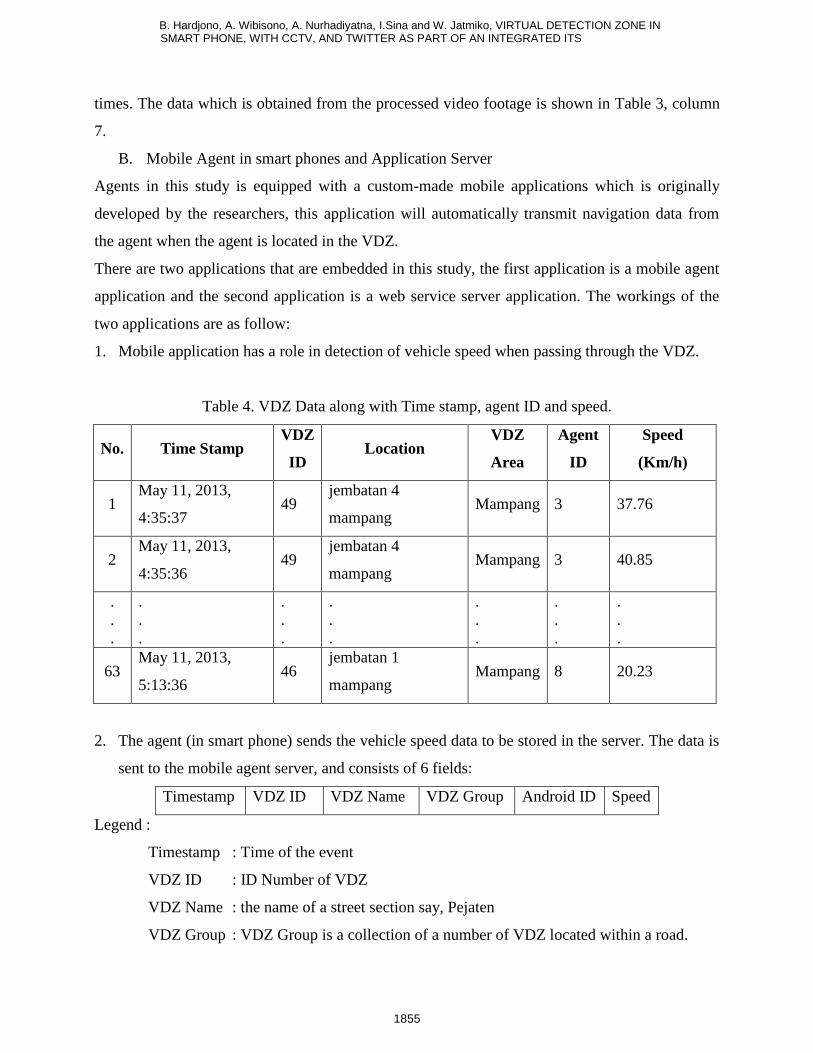
B. Mobile Agent in smart phones and Application Server
Agents in this study is equipped with a custom-made mobile applications which is originally
developed by the researchers, this application will automatically transmit navigation data from
the agent when the agent is located in the VDZ.
There are two applications that are embedded in this study, the first application is a mobile agent
application and the second application is a web service server application. The workings of the
two applications are as follow:
1. Mobile application has a role in detection of vehicle speed when passing through the VDZ.
Table 4. VDZ Data along with Time stamp, agent ID and speed.
No. Time Stamp VDZ
ID Location
VDZ
Area
Agent
ID
Speed
(Km/h)
1 May 11, 2013,
4:35:37 49
jembatan 4
mampang Mampang 3 37.76
2 May 11, 2013,
4:35:36 49
jembatan 4
mampang Mampang 3 40.85
.
.
.
.
.
.
.
.
.
.
.
.
.
.
.
.
.
.
.
.
.
63 May 11, 2013,
5:13:36 46
jembatan 1
mampang Mampang 8 20.23
2. The agent (in smart phone) sends the vehicle speed data to be stored in the server. The data is
sent to the mobile agent server, and consists of 6 fields:
Timestamp VDZ ID VDZ Name VDZ Group Android ID Speed
Legend :
Timestamp : Time of the event
VDZ ID : ID Number of VDZ
VDZ Name : the name of a street section say, Pejaten
VDZ Group : VDZ Group is a collection of a number of VDZ located within a road.
B. Hardjono, A. Wibisono, A. Nurhadiyatna, I.Sina and W. Jatmiko, VIRTUAL DETECTION ZONE IN SMART PHONE, WITH CCTV, AND TWITTER AS PART OF AN INTEGRATED ITS
1856
Android ID : Mobile Device ID
Speed : The speed of the vehicle which carries by the mobile phone, calculated
from GPS data
3. Web service application will receive the data from the entire mobile application and store it
into a database. Table 4 shows a sample of 63 records of collected data from VDZ traffic
sensor.
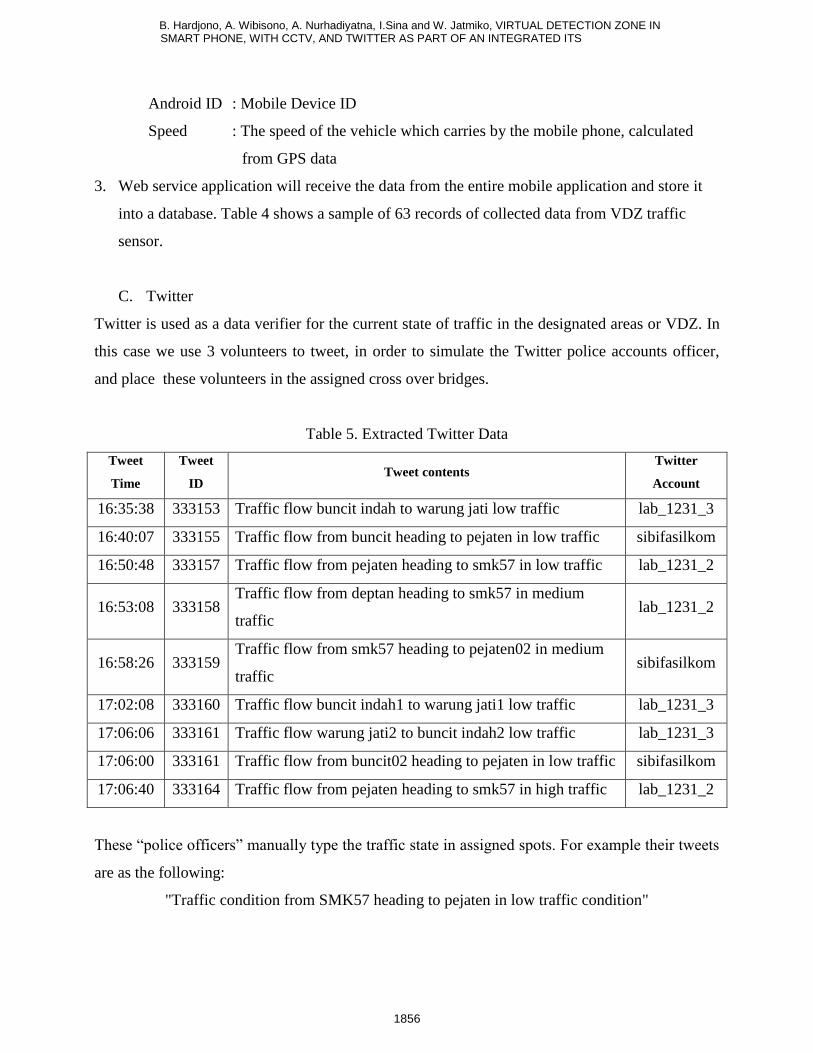
C. Twitter
Twitter is used as a data verifier for the current state of traffic in the designated areas or VDZ. In
this case we use 3 volunteers to tweet, in order to simulate the Twitter police accounts officer,
and place these volunteers in the assigned cross over bridges.
Table 5. Extracted Twitter Data
Tweet
Time
Tweet
ID Tweet contents
Account
16:35:38 333153 Traffic flow buncit indah to warung jati low traffic lab_1231_3
16:40:07 333155 Traffic flow from buncit heading to pejaten in low traffic sibifasilkom
16:50:48 333157 Traffic flow from pejaten heading to smk57 in low traffic lab_1231_2
16:53:08 333158 Traffic flow from deptan heading to smk57 in medium
traffic lab_1231_2
16:58:26 333159 Traffic flow from smk57 heading to pejaten02 in medium
traffic sibifasilkom
17:02:08 333160 Traffic flow buncit indah1 to warung jati1 low traffic lab_1231_3
17:06:06 333161 Traffic flow warung jati2 to buncit indah2 low traffic lab_1231_3
17:06:00 333161 Traffic flow from buncit02 heading to pejaten in low traffic sibifasilkom
17:06:40 333164 Traffic flow from pejaten heading to smk57 in high traffic lab_1231_2
These “police officers” manually type the traffic state in assigned spots. For example their tweets
are as the following:
"Traffic condition from SMK57 heading to pejaten in low traffic condition"
B. Hardjono, A. Wibisono, A. Nurhadiyatna, I.Sina and W. Jatmiko, VIRTUAL DETECTION ZONE IN SMART PHONE, WITH CCTV, AND TWITTER AS PART OF AN INTEGRATED ITS
1857
It means that the traffic condition of VDZ SMK 57 towards VDZ pejaten, is in low traffic
condition. The volunteer tweets every time the agent is passing an assigned spot. The twitter data
extraction results are described in Table 5. Every tweet should be the representation of the traffic
state in each VDZ.
v) The Use Of Adaptive Neuro Fuzzy Inference System To Classify Traffic Conditions
In this section, we present the data integration process of two different sensors (VDZ and
CCTV), as well as Twitter data as traffic verifier.
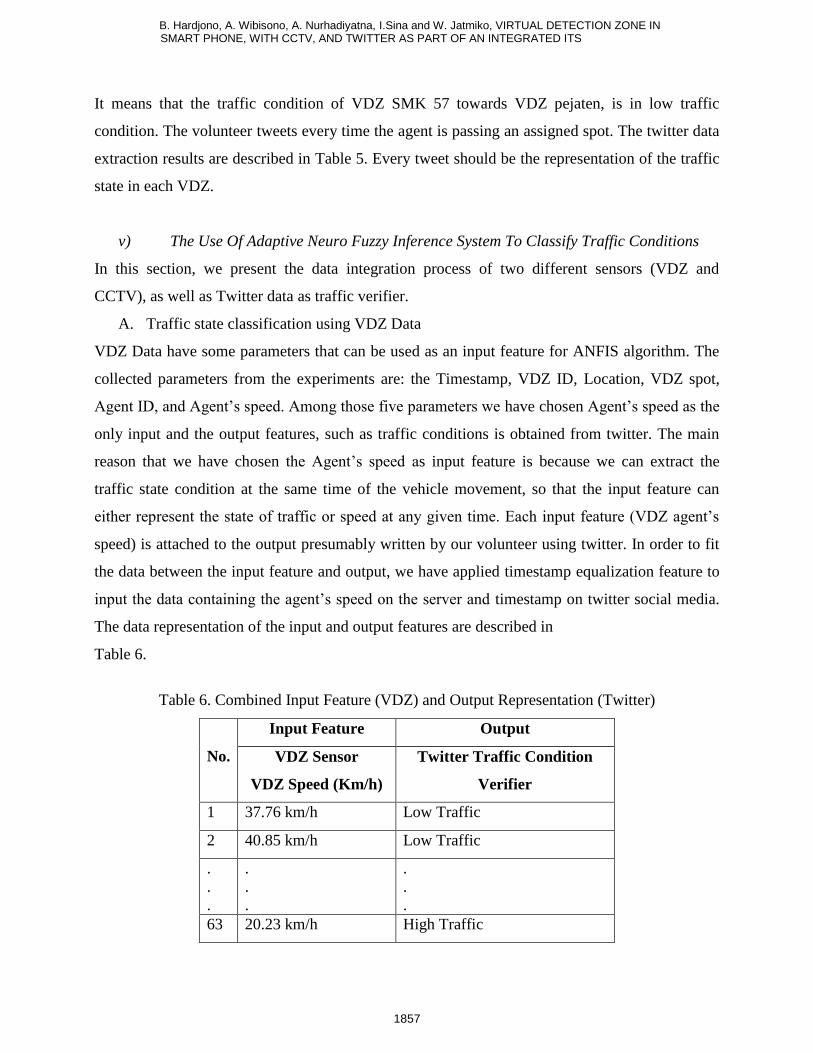
A. Traffic state classification using VDZ Data
VDZ Data have some parameters that can be used as an input feature for ANFIS algorithm. The
collected parameters from the experiments are: the Timestamp, VDZ ID, Location, VDZ spot,
Agent ID, and Agent’s speed. Among those five parameters we have chosen Agent’s speed as the
only input and the output features, such as traffic conditions is obtained from twitter. The main
reason that we have chosen the Agent’s speed as input feature is because we can extract the
traffic state condition at the same time of the vehicle movement, so that the input feature can
either represent the state of traffic or speed at any given time. Each input feature (VDZ agent’s
speed) is attached to the output presumably written by our volunteer using twitter. In order to fit
the data between the input feature and output, we have applied timestamp equalization feature to
input the data containing the agent’s speed on the server and timestamp on twitter social media.
The data representation of the input and output features are described in
Table 6.
Table 6. Combined Input Feature (VDZ) and Output Representation (Twitter)
No.
Input Feature Output
VDZ Sensor
VDZ Speed (Km/h)
Twitter Traffic Condition
Verifier
1 37.76 km/h Low Traffic
2 40.85 km/h Low Traffic
.
.
.
.
.
.
.
.
.
63 20.23 km/h High Traffic
B. Hardjono, A. Wibisono, A. Nurhadiyatna, I.Sina and W. Jatmiko, VIRTUAL DETECTION ZONE IN SMART PHONE, WITH CCTV, AND TWITTER AS PART OF AN INTEGRATED ITS
1858
We have tested this integrated system using cross validation of 90% of the data, as data train, and
the rest 10% is used for data testing. All data that we have collected is 67 records, which contain
all the three traffic states, including VDZ and CCTV speed data. While for data training we use
57, and 6 data for data testing. The selection of the data testing is done by selecting the
appropriate amount of data representative of each class in the data (low traffic, medium traffic,
and high traffic).
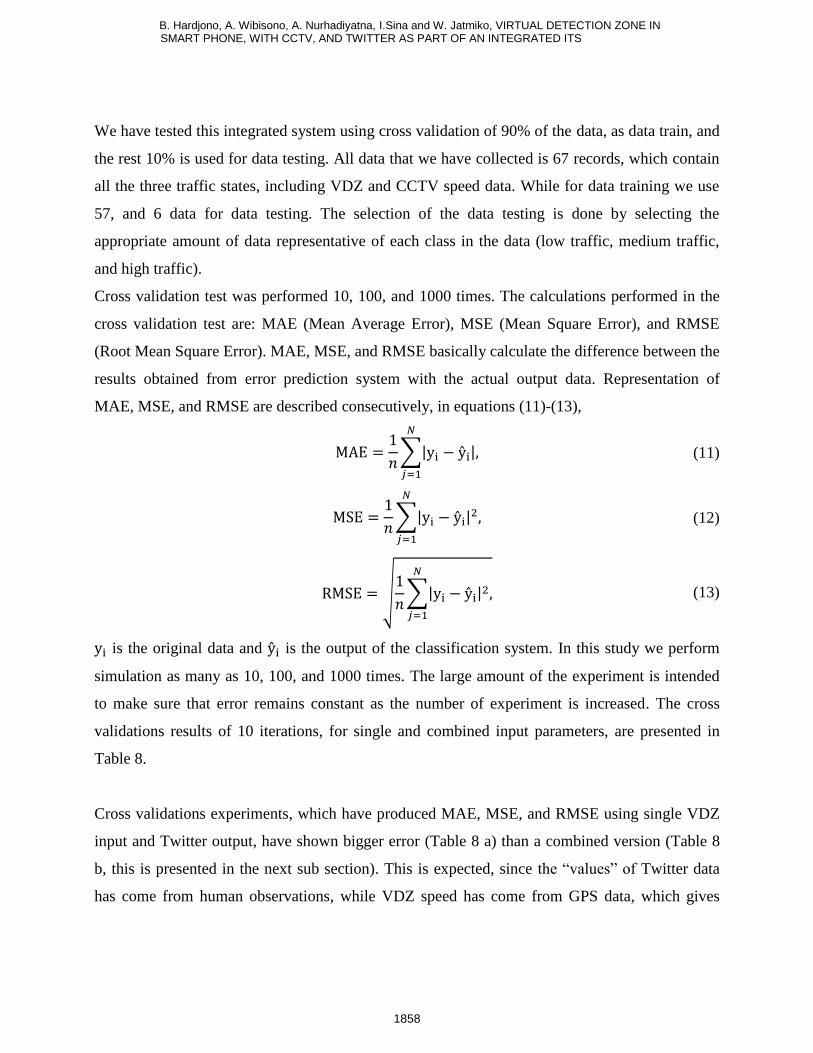
Cross validation test was performed 10, 100, and 1000 times. The calculations performed in the
cross validation test are: MAE (Mean Average Error), MSE (Mean Square Error), and RMSE
(Root Mean Square Error). MAE, MSE, and RMSE basically calculate the difference between the
results obtained from error prediction system with the actual output data. Representation of
MAE, MSE, and RMSE are described consecutively, in equations (11)-(13),
(11)
(12)
(13)
is the original data and is the output of the classification system. In this study we perform
simulation as many as 10, 100, and 1000 times. The large amount of the experiment is intended
to make sure that error remains constant as the number of experiment is increased. The cross
validations results of 10 iterations, for single and combined input parameters, are presented in
Table 8.
Cross validations experiments, which have produced MAE, MSE, and RMSE using single VDZ
input and Twitter output, have shown bigger error (Table 8 a) than a combined version (Table 8
b, this is presented in the next sub section). This is expected, since the “values” of Twitter data
has come from human observations, while VDZ speed has come from GPS data, which gives
B. Hardjono, A. Wibisono, A. Nurhadiyatna, I.Sina and W. Jatmiko, VIRTUAL DETECTION ZONE IN SMART PHONE, WITH CCTV, AND TWITTER AS PART OF AN INTEGRATED ITS
1859
more accurate values, so it obvious comparing between the two of them will produce bigger
error, than the combined one.
The greatest error rate representation for 10 trials of MAE for single VDZ input parameter is 0.59
and the smallest MAE value is 0.38. These results are presented in Table 8 a, column 2. While
the average error rate resulting from the whole experiment is 0.48. The experiments are
performed 10 times, 100 times, and 1000 times. The error rate representation up to 1000 trials
(MAE) is represented in Figure 17 a.
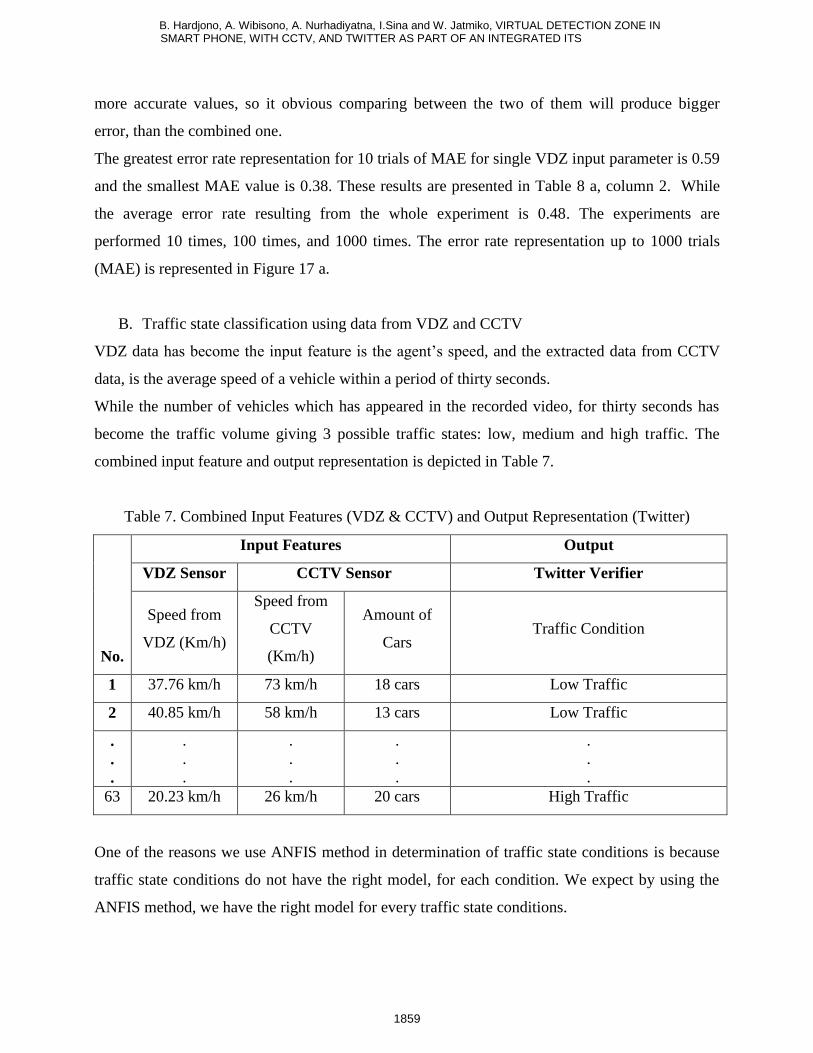
B. Traffic state classification using data from VDZ and CCTV
VDZ data has become the input feature is the agent’s speed, and the extracted data from CCTV
data, is the average speed of a vehicle within a period of thirty seconds.
While the number of vehicles which has appeared in the recorded video, for thirty seconds has
become the traffic volume giving 3 possible traffic states: low, medium and high traffic. The
combined input feature and output representation is depicted in Table 7.
Table 7. Combined Input Features (VDZ & CCTV) and Output Representation (Twitter)
No.
Input Features Output
VDZ Sensor CCTV Sensor Twitter Verifier
Speed from
VDZ (Km/h)
Speed from
CCTV
(Km/h)
Amount of
Cars Traffic Condition
1 37.76 km/h 73 km/h 18 cars Low Traffic
2 40.85 km/h 58 km/h 13 cars Low Traffic
.
.
.
.
.
.
.
.
.
.
.
.
.
.
.
63 20.23 km/h 26 km/h 20 cars High Traffic
One of the reasons we use ANFIS method in determination of traffic state conditions is because
traffic state conditions do not have the right model, for each condition. We expect by using the
ANFIS method, we have the right model for every traffic state conditions.
B. Hardjono, A. Wibisono, A. Nurhadiyatna, I.Sina and W. Jatmiko, VIRTUAL DETECTION ZONE IN SMART PHONE, WITH CCTV, AND TWITTER AS PART OF AN INTEGRATED ITS
1860
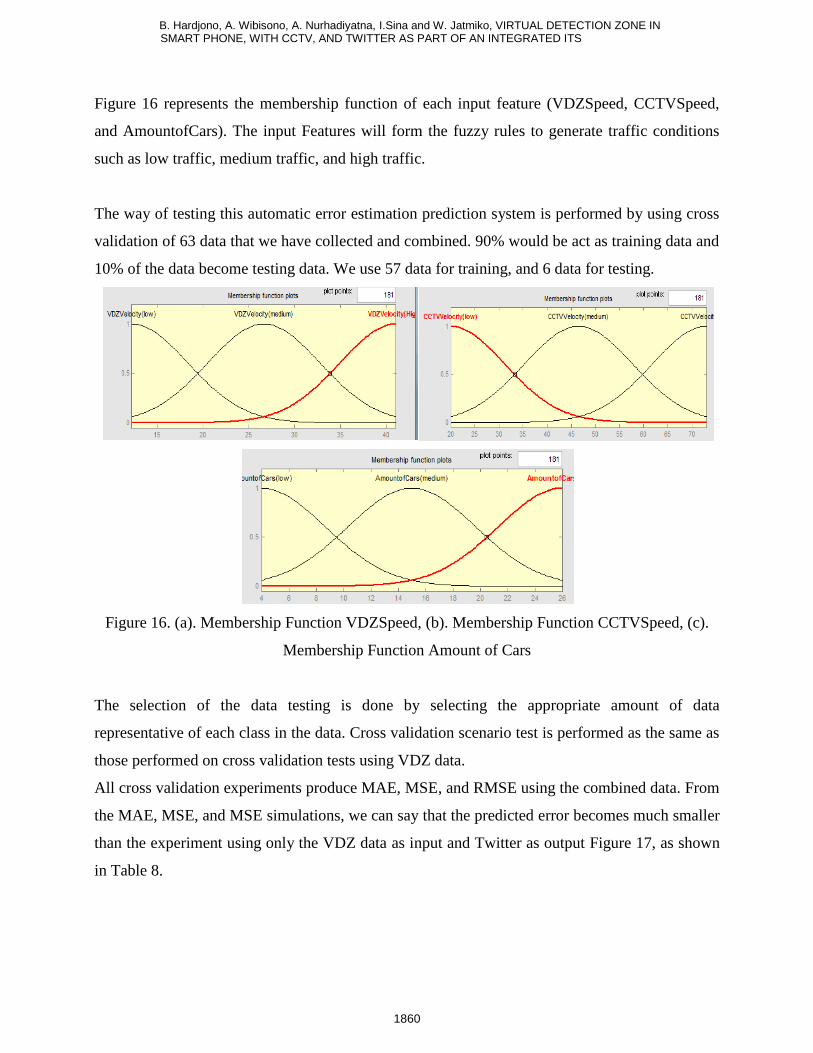
Figure 16 represents the membership function of each input feature (VDZSpeed, CCTVSpeed,
and AmountofCars). The input Features will form the fuzzy rules to generate traffic conditions
such as low traffic, medium traffic, and high traffic.
The way of testing this automatic error estimation prediction system is performed by using cross
validation of 63 data that we have collected and combined. 90% would be act as training data and
10% of the data become testing data. We use 57 data for training, and 6 data for testing.
Figure 16. (a). Membership Function VDZSpeed, (b). Membership Function CCTVSpeed, (c).
Membership Function Amount of Cars
The selection of the data testing is done by selecting the appropriate amount of data
representative of each class in the data. Cross validation scenario test is performed as the same as
those performed on cross validation tests using VDZ data.
All cross validation experiments produce MAE, MSE, and RMSE using the combined data. From
the MAE, MSE, and MSE simulations, we can say that the predicted error becomes much smaller
than the experiment using only the VDZ data as input and Twitter as output Figure 17, as shown
in Table 8.
B. Hardjono, A. Wibisono, A. Nurhadiyatna, I.Sina and W. Jatmiko, VIRTUAL DETECTION ZONE IN SMART PHONE, WITH CCTV, AND TWITTER AS PART OF AN INTEGRATED ITS
1861
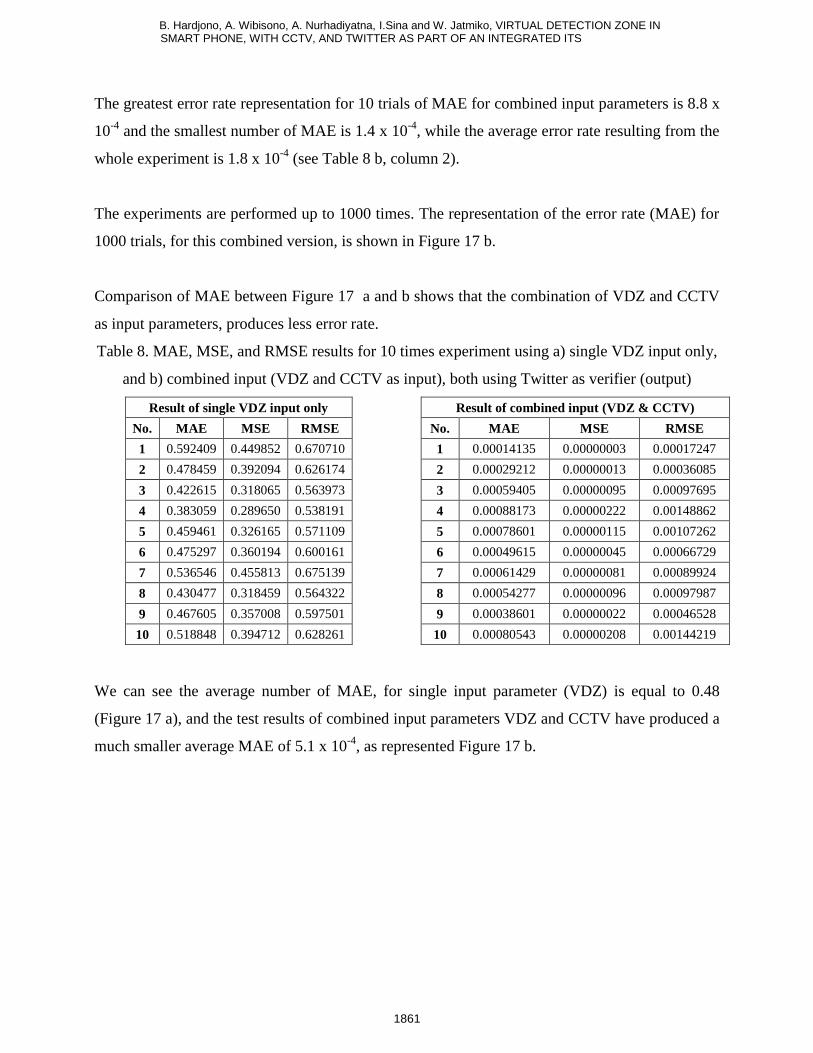
The greatest error rate representation for 10 trials of MAE for combined input parameters is 8.8 x
10-4
and the smallest number of MAE is 1.4 x 10⁻⁴
, while the average error rate resulting from the
whole experiment is 1.8 x 10⁻⁴
(see Table 8 b, column 2).
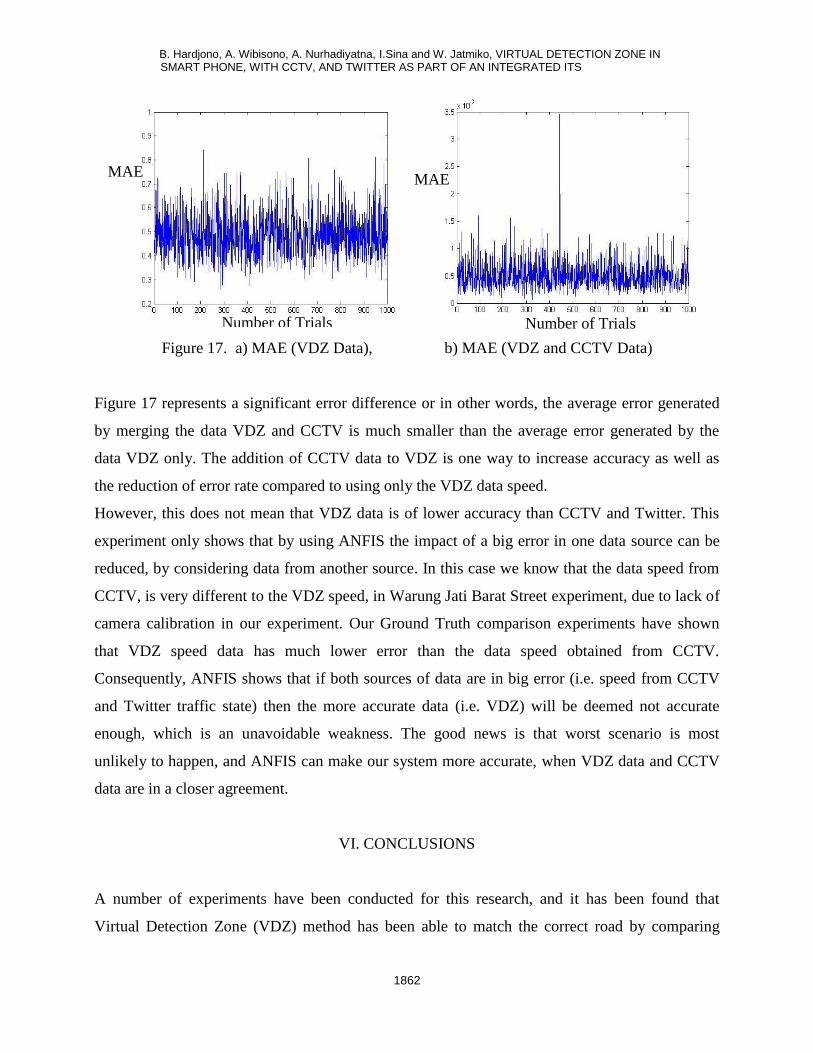
The experiments are performed up to 1000 times. The representation of the error rate (MAE) for
1000 trials, for this combined version, is shown in Figure 17 b.
Comparison of MAE between Figure 17 a and b shows that the combination of VDZ and CCTV
as input parameters, produces less error rate.
Table 8. MAE, MSE, and RMSE results for 10 times experiment using a) single VDZ input only,
and b) combined input (VDZ and CCTV as input), both using Twitter as verifier (output)
Result of single VDZ input only
No. MAE MSE RMSE
1 0.592409 0.449852 0.670710
2 0.478459 0.392094 0.626174
3 0.422615 0.318065 0.563973
4 0.383059 0.289650 0.538191
5 0.459461 0.326165 0.571109
6 0.475297 0.360194 0.600161
7 0.536546 0.455813 0.675139
8 0.430477 0.318459 0.564322
9 0.467605 0.357008 0.597501
10 0.518848 0.394712 0.628261
Result of combined input (VDZ & CCTV)
No. MAE MSE RMSE
1 0.00014135 0.00000003 0.00017247
2 0.00029212 0.00000013 0.00036085
3 0.00059405 0.00000095 0.00097695
4 0.00088173 0.00000222 0.00148862
5 0.00078601 0.00000115 0.00107262
6 0.00049615 0.00000045 0.00066729
7 0.00061429 0.00000081 0.00089924
8 0.00054277 0.00000096 0.00097987
9 0.00038601 0.00000022 0.00046528
10 0.00080543 0.00000208 0.00144219
We can see the average number of MAE, for single input parameter (VDZ) is equal to 0.48
(Figure 17 a), and the test results of combined input parameters VDZ and CCTV have produced a
much smaller average MAE of 5.1 x 10⁻⁴
, as represented Figure 17 b.
B. Hardjono, A. Wibisono, A. Nurhadiyatna, I.Sina and W. Jatmiko, VIRTUAL DETECTION ZONE IN SMART PHONE, WITH CCTV, AND TWITTER AS PART OF AN INTEGRATED ITS
1862
Figure 17. a) MAE (VDZ Data), b) MAE (VDZ and CCTV Data)
Figure 17 represents a significant error difference or in other words, the average error generated
by merging the data VDZ and CCTV is much smaller than the average error generated by the
data VDZ only. The addition of CCTV data to VDZ is one way to increase accuracy as well as
the reduction of error rate compared to using only the VDZ data speed.
However, this does not mean that VDZ data is of lower accuracy than CCTV and Twitter. This
experiment only shows that by using ANFIS the impact of a big error in one data source can be
reduced, by considering data from another source. In this case we know that the data speed from
CCTV, is very different to the VDZ speed, in Warung Jati Barat Street experiment, due to lack of
camera calibration in our experiment. Our Ground Truth comparison experiments have shown
that VDZ speed data has much lower error than the data speed obtained from CCTV.
Consequently, ANFIS shows that if both sources of data are in big error (i.e. speed from CCTV
and Twitter traffic state) then the more accurate data (i.e. VDZ) will be deemed not accurate
enough, which is an unavoidable weakness. The good news is that worst scenario is most
unlikely to happen, and ANFIS can make our system more accurate, when VDZ data and CCTV
data are in a closer agreement.
VI. CONCLUSIONS
A number of experiments have been conducted for this research, and it has been found that
Virtual Detection Zone (VDZ) method has been able to match the correct road by comparing
MAE
Number of Trials
MAE
Number of Trials
B. Hardjono, A. Wibisono, A. Nurhadiyatna, I.Sina and W. Jatmiko, VIRTUAL DETECTION ZONE IN SMART PHONE, WITH CCTV, AND TWITTER AS PART OF AN INTEGRATED ITS
1863
current location data in the GPS enabled phone with a set of pre-determined check points
(circular VDZ, successfully giving consistent results with a radius of 100m). It is also able to
provide traffic data speed in the accuracy range of 93.4% to 99.9% in higher speed range (50 to
65 km/hour) and able to detect lower speeds in range of 0 to 20 km/hour. VDZ only needs one
longitude and latitude coordinate, to be able to form a detection aware zone. Furthermore, we
have shown from experiments that in our integrated ITS, by using Adaptive Neuro Fuzzy
Inference System our speed data from video images captured from CCTV and extracted traffic
states from simulated police Twitter, along with VDZ data speed can be better classified to obtain
a more accurate traffic conditions.
REFERENCES
[1] G. Leduc, “Road Traffic Data : Collection Methods and Applications,” Luxembourg, 2008.
[2] U.S. Dept of Transportation and U. S. D. of Transportation, Traffic Detector Handbook :
Third Edition-Volume I, 3rd ed., vol. I, no. October. Springfield, VA, 22161 and Research
and Technology Product Distribution Center, 9701 Philadelphia Court, Unit Q, Lanham,
MD: Research, Development, and Technology Turner-Fairbank Highway Research
Center,, 2006, pp. 1–291.
[3] U. S. D. of Transportation, Traffic Detector Handbook : Third Edition-Volume II, Third.
Springfield, VA, 22161 and Research and Technology Product Distribution Center, 9701
Philadelphia Court, Unit Q, Lanham, MD: Research, Development, and Technology
Turner-Fairbank Highway Research Center,, 2006, pp. 1–396.
[4] Z. Chen and T. Ellis, “Multi-shape Descriptor Vehicle Classification for Urban Traffic,”
2011 International Conference on Digital Image Computing: Techniques and
Applications, pp. 456–461, Dec. 2011.
[5] A. Viloria, M. Gonzalo-Tasis, R. Martinez, L. M. Fuentes, and J. Finat, “Mobile Voronoi
Diagrams for Traffic Monitoring under Bad Visibility Conditions,” 2011 Eighth
International Symposium on Voronoi Diagrams in Science and Engineering, pp. 228–233,
Jun. 2011.
[6] D. J. Dailey, F. W. Cathey, and S. Pumrin, “An algorithm to estimate mean traffic speed
using uncalibrated cameras,” IEEE Transactions on Intelligent Transportation Systems,
vol. 1, no. 2, pp. 98–107, Jun. 2000.
B. Hardjono, A. Wibisono, A. Nurhadiyatna, I.Sina and W. Jatmiko, VIRTUAL DETECTION ZONE IN SMART PHONE, WITH CCTV, AND TWITTER AS PART OF AN INTEGRATED ITS
1864
[7] L. Grammatikopoulos, G. E. Karras, and E. Petsa, “Geometric Information From Single
Uncalibrated Images Of Roads,” in International Archives of Photogrammetry & Remote
Sensing, 2002, vol. 34, no. 5, pp. 21–26.
[8] F. W. W. Cathey and D. J. J. Dailey, “A Novel Technique to Dynamically Measure
Vehicle Speed using Uncalibrated Roadway Cameras,” in IEEE Proceedings. Intelligent
Vehicles Symposium, 2005., 2005, no. 2, pp. 777–782.
[9] L. Grammatikopoulos, G. Karras, and E. Petsa, “Automatic Estimation Of Vehicle Speed
From Uncalibrated Video Sequences,” in International Symposium On Modern
Technologies, Education And Professional Practice In Geodesy And Related Fields, 2005,
no. 2003, pp. 3–4.
[10] C. Maduro, K. Batista, P. Peixoto, and J. Batista, “Estimation Of Vehicle Velocity And
Traffic Intensity Using Rectified,” Coimbra, Portugal, 2008.
[11] C. Maduro, K. Batista, and J. Batista, “Estimating Traffic Intensity Using Profile Images
On Rectified Images,” in ISR-Institute of Systems and Robotics, 2009, pp. 1149–1152.
[12] G. Garibotto, P. Castello, E. Del Ninno, P. Pedrazzi, and G. Zan, “Speed-vision: speed
measurement by license plate reading and tracking,” ITSC 2001. 2001 IEEE Intelligent
Transportation Systems. Proceedings (Cat. No.01TH8585), pp. 585–590, 2001.
[13] T. Pai, W. Juang, and L. Wang, “An adaptive windowing prediction algorithm for vehicle
speed estimation,” ITSC 2001. 2001 IEEE Intelligent Transportation Systems. Proceedings
(Cat. No.01TH8585), pp. 901–906, 2001.
[14] T. N. Schoepflin, D. J. Dailey, and S. Member, “Dynamic Camera Calibration of Roadside
Traffic Management Cameras for Vehicle Speed Estimation,” IEEE Transactions On
Intelligent Transportation Systems, vol. 4, no. 2, pp. 90–98, 2003.
[15] X. He and N. C. Yung, “A Novel Algorithm for Estimating Vehicle Speed from Two
Consecutive Images,” 2007 IEEE Workshop on Applications of Computer Vision (WACV
’07), pp. 12–12, Feb. 2007.
[16] T. N. Schoepflin, D. J. Dailey, and S. Member, “Algorithms for Calibrating Roadside
Traffic Cameras and Estimating Mean Vehicle Speed,” in Proceedings of the 2007 IEEE
Intelligent Transportation Systems Conference, 2007, pp. 277–283.
[17] S. K. Endarnoto, S. Pradipta, A. S. Nugroho, and J. Purnama, “Traffic Condition
Information Extraction & Visualization from Social Media Twitter for Android Mobile
Application,” in International Conference on Electrical Engineering and Informatics,
2011, no. July, pp. 1–4.
[18] B. S. R. B. J. Singh, “Real Time Prediction of Road Traffic Condition in London via
Twitter and Related Sources by,” Middlesex University, 2012.
B. Hardjono, A. Wibisono, A. Nurhadiyatna, I.Sina and W. Jatmiko, VIRTUAL DETECTION ZONE IN SMART PHONE, WITH CCTV, AND TWITTER AS PART OF AN INTEGRATED ITS
1865
[19] A. Wibisono, I. Sina, M. A. Ihsannuddin, A. Hafidz, B. Hardjono, and P. Mursanto,
“Traffic Intelligent System Architecture Based on Social Media Information,” in ICACSIS,
2012, pp. 25–30.
[20] R. Kosala and E. Adi, “Harvesting Real Time Traffic Information from Twitter,” in
Procedia Engineering, 2012, vol. 50, no. Icasce, pp. 1–11.
[21] M. Berman, “Cell Phone Location System,” Tallahassee, 2007.
[22] J. Kim, “Energy-Efficient Rate-Adaptive GPS-based Positioning for Smartphones,” in
MobiSys, 2010, pp. 299–314.
[23] J. C. Herrera, D. B. Work, R. Herring, and X. Jeff, “Evaluation of Traffic Data Obtained
via GPS-enabled Mobile Phones : the Mobile Century field experiment,” in Transportation
Research, 2009, no. June, pp. 1–30.
[24] B. Hoh, T. Iwuchukwu, Q. Jacobson, D. Work, A. M. Bayen, R. Herring, J. C. Herrera, M.
Gruteser, M. Annavaram, J. Ban, I. C. Society, and S. Member, “Enhancing Privacy and
Accuracy in Probe Vehicle-Based Traffic Monitoring via Virtual Trip Lines,” IEEE
Transactions On Mobile Computing, vol. 11, no. 5, pp. 849–864, 2012.
[25] K. Yadav, V. Naik, P. Singh, A. Singh, and P. Range, “Alternative Localization Approach
for Mobile Phones Without GPS,” in ACM, 2010, pp. 1–4.
[26] “Privacy Policy (Google’s).” [Online]. Available:
http://www.google.com/policies/privacy/. [Accessed: 10-Jan-2013].
[27] B. Schwartz, “How Does Google’s Predictive Traffic Maps Work?,” Search Engine Round
Table, 2010. [Online]. Available: http://www.seroundtable.com/archives/023155.html.
[Accessed: 21-Jan-2013].
[28] S. Cheung, “Traffic Surveillance by Wireless Sensor Networks : Final Report,” Berkeley,
2007.
[29] B. Hardjono, A. Nurhadiyatna, P. Mursanto, and W. Jatmiko, “Development of Traffic
sensor system with Virtual Detection Zone,” in International Conference on Advanced
Computer Science and Information Systems (ICACSIS), 2012, pp. 19–23.
[30] B. Hardjono, A. Wibowo, M. F. Rachmadi, and W. Jatmiko, “Mobile phones as traffic
sensors with map matching and privacy considerations,” in Micro-Nano Human Science
(MHS), 2012, pp. 450–455.
[31] A. Nurhadiyatna, B. Hardjono, A. Wibisono, W. Jatmiko, and P. Mursanto, “ITS
Information Source : Vehicle Speed Measurement Using Camera as Sensor,” in ICACSIS,
2012, pp. 191–196.
B. Hardjono, A. Wibisono, A. Nurhadiyatna, I.Sina and W. Jatmiko, VIRTUAL DETECTION ZONE IN SMART PHONE, WITH CCTV, AND TWITTER AS PART OF AN INTEGRATED ITS
1866
[32] V. Jain, A. Sharma, and L. Subramanian, “Road Traffic Congestion in the Developing
World,” in ACM Computer for Development, 2012, p. 10.
[33] Q. Bai, T. Carrato, C. M. Laffoon, D. M. Mourad, P. Nesbitt, J. L. Ryan, L. Zhang, and V.
Srikanth, “Integrate traffic data with IBM Intelligent Transportation using a traffic data
gateway Meet the challenges of today’s traffic raw data collection from detectors
embedded in roadway infrastructures,” 2011.
[34] X. Xiaobin, Z. Zhe, and W. Chenglin, “Data Fusion Algorithm Of Fault Diagnosis,”
International Journal On Smart Sensing And Intelligent Systems, vol. 6, no. 1, pp. 171–
190, 2013.
[35] M. Valera and S. A. Velastin, “Intelligent distributed surveillance systems : a review,” IEE
Proc.-Vis. Image Signal Process, vol. 152, no.2, no. 20041147, pp. 192–204, 2005.
[36] U. Park, F. Silva, G. Guiliano, M. Hou, J. Heidemann, and X. Wang, “Single- and Multi-
Sensor Techniques to Improve Accuracy of Urban Vehicle Classification,” in ISI-TR,
2006, p. 13.
[37] W. Jatmiko, A. Azurat, A. Wibowo, H. Marihot, and M. Wicaksana, “Self-Organizing
Urban Traffic Control Architecture With Swarm-Self Organizing Map In Jakarta : Signal
Control System And Simulator,” International Journal On Smart Sensing And Intelligent
Systems, vol. 3, no. 3, p. 23, 2010.
[38] S. Jain, R. K. Ghosh, and R. K. Shyamsundar, “Engineering Location Based Pathfinding
on Indian Road Networks Over Low End Mobile Phones,” IEEE, pp. 1–9, 2010.
[39] B. Hoh, M. Gruteser, H. Xiong, S. Member, and A. Alrabady, “Achieving Guaranteed
Anonymity in GPS Traces via Uncertainty-Aware Path Cloaking,” IEEE Transactions On
Mobile Computing, vol. 9, no. 8, pp. 1089–1107, 2010.
[40] B. Hoh, M. Gruteser, R. Herring, J. Ban, D. Work, J. Herrera, and A. M. Bayen, “Virtual
Trip Lines for Distributed Privacy-Preserving Traffic Monitoring,” in ACM MobiSys,
2008, pp. 15–28.
[41] R. D. Haney, “Location sharing and tracking using mobile phones or other wireless
devices,” 7353034 B22008.
[42] A. Demers, G. F. List, W. A. Wallace, E. E. Lee, and J. M. Wojtowicz, “Probes as Path
Seekers: A New Paradigm,” Journal of the Transportation Research Board, 2006.
[Online]. Available: http://trb.metapress.com/content/e3u6163h011t6684/.
[43] B. Zan, P. Hao, M. Gruteser, and X. Ban, “VTL Zone-Aware Path Cloaking Algorithm,”
in International IEEE Conference on Intelligent Transportation Systems, 2011, pp. 1525–
1530.
B. Hardjono, A. Wibisono, A. Nurhadiyatna, I.Sina and W. Jatmiko, VIRTUAL DETECTION ZONE IN SMART PHONE, WITH CCTV, AND TWITTER AS PART OF AN INTEGRATED ITS
1867
[44] D. B. Work, O. Tossavainen, Q. Jacobson, A. M. Bayen, A. Smartphones, and L. Sensors,
“Lagrangian Sensing : Traffic Estimation with Mobile Devices,” Proceedings of the 2009
American Control Conference St. Louis, 2009.
[45] A. M. P. . Bayen, “Collecting 2008 Traffic Data from GPS-Equipped Cell Phones.” .
[46] S. Amin, S. Andrews, S. Apte, J. Arnold, J. Ban, M. Benko, A. M. Bayen, B. Chiou, C.
Claudel, C. Claudel, T. Dodson, O. Elhamshary, Batina, Gruteser, Herrera, Herring, Hoh,
Jacobson, Kumar, Iwuchukwu, Lew, Litrico, and Luddington, “Mobile Century Using
GPS Mobile Phones as Traffic Sensors : A Field Experiment,” in 15th World Congress on
Intelligent Transportation Systems, 2008, pp. 8–11.
[47] M. F. Rachmadi, F. Al Afif, W. Jatmiko, P. Mursanto, E. A. Manggala, M. A. Ma’sum,
and A. Wibowo, “Adaptive traffic signal control system using camera sensor and
embedded system,” in TENCON 2011 - 2011 IEEE Region 10 Conference, 2011, pp.
1261–1265.
[48] F. Al Afif, M. F. Rachmadi, W. Jatmiko, and P. Mursanto, “Enhanced Adaptive Traffic
Signal Control System Using Camera Sensor and Embedded System,” in MHS, 2011, pp.
367–372.
[49] “Traffic Management Center,” 2013. [Online]. Available:
http://www.tmcmetro.com/profil/traffic-management-center. [Accessed: 10-Jan-2013].
[50] P. Viola and M. Jones, “Rapid object detection using a boosted cascade of simple
features,” in Proceedings of the 2001 IEEE Computer Society Conference on Computer
Vision and Pattern Recognition. CVPR 2001, 2001, vol. 1, pp. I–511–I–518.
[51] G. Welch and G. Bishop, “An Introduction to the Kalman Filter,” 2006.
[52] N. Buch, S. a. Velastin, and J. Orwell, “A Review of Computer Vision Techniques for the
Analysis of Urban Traffic,” IEEE Transactions on Intelligent Transportation Systems, vol.
12, no. 3, pp. 920–939, Sep. 2011.
[53] I. M. A. Setiawan, E. M. Imah, and W. Jatmiko, “Arrhytmia Classification using Fuzzy-
Neuro Generalized Learning Vector Quantization,” in ICACSIS, 2011, pp. 978–979.
[54] J. R. Jang, “ANFIS : Adaptive Network-Based Fuzzy Inference System,” IEEE
Transactions On Systems, Man, And Cybernetics, vol. 23, no. 3, pp. 665–685, 1993.
[55] H. Yan, Z. Zou, and H. Wang, “Adaptive neuro fuzzy inference system for classification
of water quality status,” Journal of Environmental Sciences, vol. 22, no. 12, pp. 1891–
1896, Dec. 2010.
[56] L. A. Zadeh, “Fuzzy Sets,” Information and Control, vol. 8, no. 3, pp. 338–353, 1965.
B. Hardjono, A. Wibisono, A. Nurhadiyatna, I.Sina and W. Jatmiko, VIRTUAL DETECTION ZONE IN SMART PHONE, WITH CCTV, AND TWITTER AS PART OF AN INTEGRATED ITS
1868
[57] P. P. Bonissone, “Adaptive Neural Fuzzy Inference Systems ( ANFIS ): Analysis and
Applications,” 2002.
[58] B. Zaman, W. Jatmiko, A. Wibowo, E. M. Imah, U. Indonesia, N. Science, and U. N.
Surabaya, “Implementation Vehicle Classification On Distributed Traffic Light Control
System Neural Network Based,” in ICACSIS, 2011, pp. 978–979.