Embed Size (px)
Citation preview
Proceedings of the 23rd International Conference on Digital Audio Effects (DAFx-20), Vienna, Austria, September 8–12, 2020
VIRTUAL BASS SYSTEM WITH FUZZY SEPARATION OF TONES AND TRANSIENTS
Eloi Moliner, Jussi Rämö, and Vesa Välimäki ∗
Acoustics Lab, Dept. of Signal Processing and Acoustics
Aalto University
Espoo, Finland
ABSTRACT
A virtual bass system creates an impression of bass perception
in sound systems with weak low-frequency reproduction, which
is typical of small loudspeakers. Virtual bass systems extend the
bandwidth of the low-frequency audio content using either a non-
linear function or a phase vocoder, and add the processed signal
to the reproduced sound. Hybrid systems separate transients and
steady-state sounds, which are processed separately. It is still chal-
lenging to reach a good sound quality using a virtual bass system.
This paper proposes a novel method, which separates the tonal,
transient, and noisy parts of the audio signal in a fuzzy way, and
then processes only the transients and tones. Those upper harmon-
ics, which can be detected above the cutoff frequency, are boosted
using timbre-matched weights, but missing upper harmonics are
generated to assist the missing fundamental phenomenon. Listen-
ing test results show that the proposed algorithm outperforms se-
lected previous methods in terms of perceived bass sound quality.
The proposed method can enhance the bass sound perception of
small loudspeakers, such as those used in laptop computers and
mobile devices.
1. INTRODUCTION
Small loudspeakers have a limited frequency range in which they
can operate efficiently. Low-frequency sound reproduction requires
a large volume velocity, a condition that cannot be always satis-
fied due to the limitations of the loudspeaker. The lack of low-
frequency components when reproducing music usually leads to a
weak perception of bass and rhythm, as also drum sounds get sup-
pressed. This paper studies methods to enhance the bass sounds,
when a loudspeaker cannot reproduce low frequencies.
A conventional method to improve bass sounds is to boost the
low-frequency range of the audio signal using an equalizing filter.
However, a very high level of energy would be needed to boost the
lowest frequencies, which usually leads to distortion and might
cause unrecoverable damage to the loudspeaker. In practice, it is
therefore often impossible to much improve the bass response of a
small loudspeaker using a conventional equalizer.
A virtual bass system (VBS) enhances the bass perception by
tricking the human auditory system to perceive low tones from
higher harmonics. The goal of the VBS is to extend the low-
frequency bandwidth so that the missing fundamental phenomenon
∗ This research is part of the Nordic Sound and Music Computing Net-work (NordicSMC), NordForsk project no. 86892.
Copyright: © 2020 Eloi Moliner et al. This is an open-access article distributed
under the terms of the Creative Commons Attribution 3.0 Unported License, which
permits unrestricted use, distribution, and reproduction in any medium, provided the
original author and source are credited.
[1, 2] will help people to perceive the low frequencies that are
physically absent or significantly attenuated.
Early VBS systems distorted the low frequencies in the time
domain. In the late 1990s, several patents suggested full and half-
wave rectifiers for harmonic generation [3, 4, 5]. MaxxBass is one
of the first commercial VBS products, and is based on nonlinear
processing using a feedback multiplier [6, 7]. Gan et al. proposed a
VBS using an amplitude modulator, which performed slightly bet-
ter than MaxxBass [8]. Larsen and Aarts published a generic VBS
framework using nonlinear devices (NLDs) [9] and also the first
textbook on audio bandwidth extension [10], which analyzed the
use of NLDs from a psychoacoustical viewpoint. Oo and Gan con-
ducted an exhaustive study on the harmonic response and the inter-
modulation distortion of NLDs [11] and introduced novel NLDs,
such as polynomial-based harmonic shifting [12].
Alternatively, bandwidth extension can be accomplished us-
ing frequency-domain processing. Bai et al. proposed the first
VBS based on a phase vocoder (PV) [13]. They generated the har-
monic series by pitch shifting the entire lowpass filtered signal.
This method allows precise control over the weighting of the har-
monic components, and works better than most of NLDs for steady
state signals. However, because of the temporal smearing effect
caused by frame-based processing, this method performs poorly
in transient-like sounds.
The successive strategy consisted in combining the NLD and
the PV methods by separating the audio signal in transient and
steady state components. In 2010, Hill [14] presented the first
hybrid system having a transient detector based on the constant-
Q transform to switch between the NLDs and the PV. Mu and
Gan [15, 16] developed an improved hybrid VBS using the median
filtering technique for transient and steady state audio separation
[17].
The harmonics generated with a PV should be weighted in a
way that not only enhances the bass but also generates a pleasant
sound for the listener. Bai et al. [13] used a weighting based on the
equal-loudness contours. Mu et al. presented a timbre matching
approach [18], which consisted of weighting the harmonics with
the spectral envelope of the original signal. Moon et al. proposed
a phase-matched exponential weighting scheme [19], preserving
the phases of the harmonics already existing in the original signal.
This paper proposes a bass enhancement method based on a
fuzzy separation [20] of the transient, tonal, and noisy components
of the audio signal, and on an appropriate processing of these com-
ponents separately. In comparison to previous hybrid aproaches
[14, 15, 16], we use the information extracted from the median fil-
ters to separate also the noise, leading to a better discrimination of
transients and harmonic tones. The proposed method consists in
an NLD for the transients and a refined phase vocoder processing
for the tonal components, but no processing of the noisy part.
DAFx.1
DAF2
x21in
Proceedings of the 23rd International Conference on Digital Audio Effects (DAFx2020), Vienna, Austria, September 2020-21
86
Proceedings of the 23rd International Conference on Digital Audio Effects (DAFx-20), Vienna, Austria, September 8–12, 2020
Regarding the phase vocoder processing, we propose an im-
proved harmonic enhancement technique based on the detection
and preservation of the harmonics originally present in the signal.
We uniquely generate by pitch-shifting the non-detected harmon-
ics, while the detected ones only have their magnitudes scaled. We
include a limited timbre-matching weighting scheme as well as an
improved harmonic weighting methodology.
The rest of the paper is organized in the following way. Sec. 2
describes the idea of fuzzy separation of tonal, transient, and noise
components in an audio signal. Sec. 3 discusses the transient pro-
cessing and Sec. 4 the tonal processing in the proposed VBS. Sec. 5
presents a subjective listening test in which the proposed VBS is
compared with previous methods. Sec. 6 concludes this paper.
2. FUZZY CLASSIFICATION OF SPECTRAL BINS
The separation method used in the proposed system is based on the
median filter technique by Fitzgerald [17]. This method is based
on the fact that, in a time-frequency representation, the tonal com-
ponents of the signal tend to appear like ridges in the direction
of the time axis while transient components appear as ridges in
the direction of the frequency axis. In order to reduce the com-
putational cost of the overall system, the lowpass filtered signal
to be processed is first downsampled down to the sample rate of
fs = 4096Hz. Subsequently, the short-time Fourier Transform
(STFT) of the downsampled signal is computed, with a frame size
of 512 samples, no zero padding, a hop size of 64 samples and
using a Hann window.
The generated time-frequency signal X(m, k) is processed by
the median filter technique in two ways:
Xs(m, k) = med (|X (m0, k)| , ..., |X (mL, k)|) (1)
and
Xt(m, k) = med (|X (m, k0)| , ..., |X (m, kL)|) , (2)
where Xs(m, k) and Xt(m, k), respectively, are the tonal and tran-
sient STFTs, med() is the median filter operation, and m0 and mL
are the starting and ending index in the time direction:
m0 = m−Lt
2+ 1 (3)
and
mL = m+Lt
2, (4)
and Lt is the length of the median filter along the time axis. Pa-
rameters k0 and kL are the indices in the frequency direction:
k0 = m−Lf
2+ 1 (5)
and
kL = m+Lf
2, (6)
where Lf is the length of the median filters along the frequency
axis.
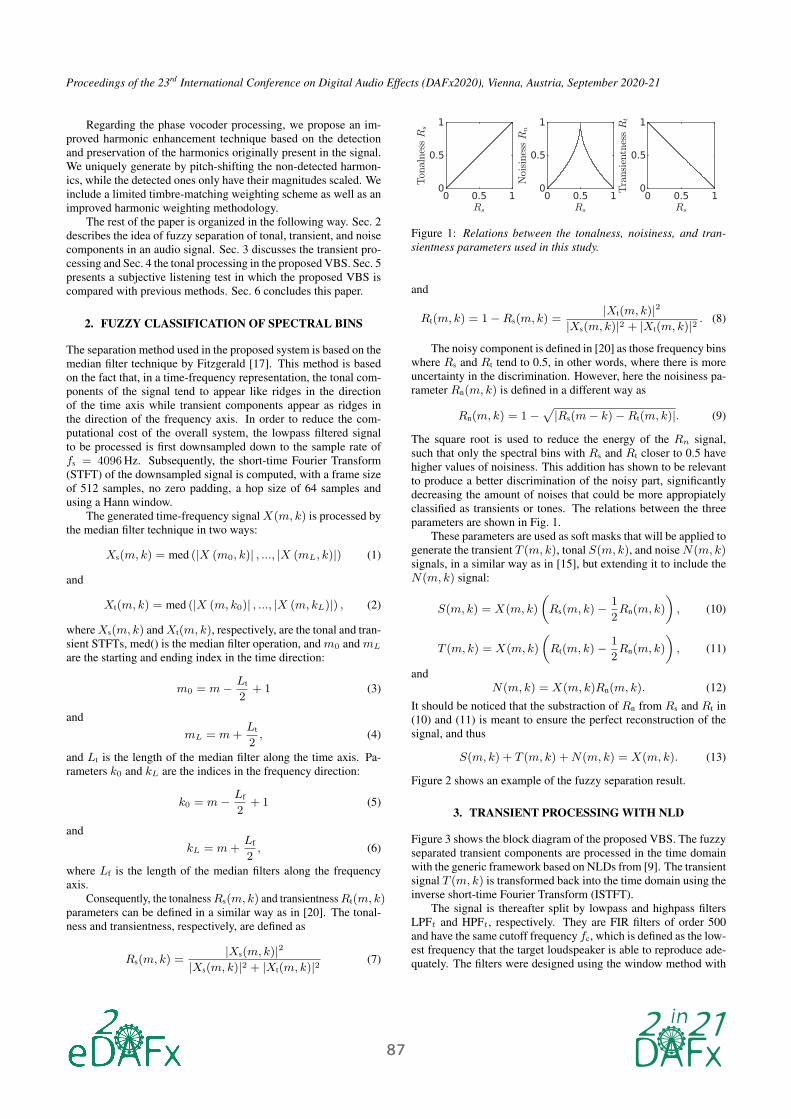
Consequently, the tonalness Rs(m, k) and transientness Rt(m, k)parameters can be defined in a similar way as in [20]. The tonal-
ness and transientness, respectively, are defined as
Rs(m, k) =|Xs(m, k)|2
|Xs(m, k)|2 + |Xt(m, k)|2(7)
Figure 1: Relations between the tonalness, noisiness, and tran-
sientness parameters used in this study.
and
Rt(m, k) = 1−Rs(m, k) =|Xt(m, k)|2
|Xs(m, k)|2 + |Xt(m, k)|2. (8)
The noisy component is defined in [20] as those frequency bins
where Rs and Rt tend to 0.5, in other words, where there is more
uncertainty in the discrimination. However, here the noisiness pa-
rameter Rn(m, k) is defined in a different way as
Rn(m, k) = 1−√
|Rs(m− k)−Rt(m, k)|. (9)
The square root is used to reduce the energy of the Rn signal,
such that only the spectral bins with Rs and Rt closer to 0.5 have
higher values of noisiness. This addition has shown to be relevant
to produce a better discrimination of the noisy part, significantly
decreasing the amount of noises that could be more appropiately
classified as transients or tones. The relations between the three
parameters are shown in Fig. 1.
These parameters are used as soft masks that will be applied to
generate the transient T (m, k), tonal S(m, k), and noise N(m, k)signals, in a similar way as in [15], but extending it to include the
N(m, k) signal:
S(m, k) = X(m, k)
(
Rs(m, k)−1
2Rn(m, k)
)
, (10)
T (m, k) = X(m, k)
(
Rt(m, k)−1
2Rn(m, k)
)
, (11)
and
N(m, k) = X(m, k)Rn(m, k). (12)
It should be noticed that the substraction of Rn from Rs and Rt in
(10) and (11) is meant to ensure the perfect reconstruction of the
signal, and thus
S(m, k) + T (m, k) +N(m, k) = X(m, k). (13)
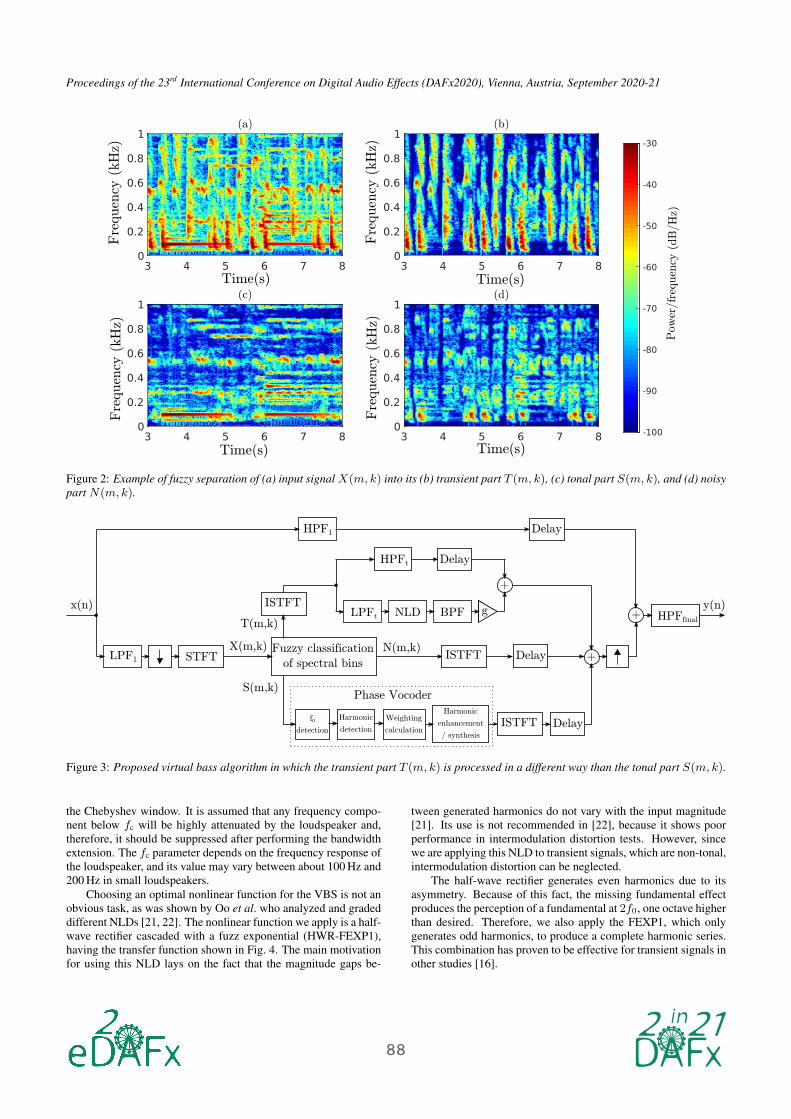
Figure 2 shows an example of the fuzzy separation result.
3. TRANSIENT PROCESSING WITH NLD
Figure 3 shows the block diagram of the proposed VBS. The fuzzy
separated transient components are processed in the time domain
with the generic framework based on NLDs from [9]. The transient
signal T (m, k) is transformed back into the time domain using the
inverse short-time Fourier Transform (ISTFT).
The signal is thereafter split by lowpass and highpass filters
LPFt and HPFt, respectively. They are FIR filters of order 500
and have the same cutoff frequency fc, which is defined as the low-
est frequency that the target loudspeaker is able to reproduce ade-
quately. The filters were designed using the window method with
DAFx.2
DAF2
x21in
Proceedings of the 23rd International Conference on Digital Audio Effects (DAFx2020), Vienna, Austria, September 2020-21
87
Proceedings of the 23rd International Conference on Digital Audio Effects (DAFx-20), Vienna, Austria, September 8–12, 2020
Time(s) Time(s)
Time(s) Time(s)
Fre
quen
cy (
kH
z)
Fre
quen
cy (
kH
z)Fre
quen
cy (
kH
z)
Fre
quen
cy (
kH
z)
Pow
er/f
requen
cy (
dB
/Hz)
Figure 2: Example of fuzzy separation of (a) input signal X(m, k) into its (b) transient part T (m, k), (c) tonal part S(m, k), and (d) noisy
part N(m, k).
HPF1
HPFfinal
LPF1 STFT
ISTFTLPFt NLD BPF
HPFt
Fuzzy classification
of spectral bins
g
+
Weighting
calculation
+
ISTFT
+
f0
detection
Harmonic
detection
Harmonic
enhancement
/ synthesis
Phase Vocoder
x(n) y(n)
T(m,k)
S(m,k)
N(m,k)X(m,k)
Delay
ISTFT
Delay
Delay
Delay
Figure 3: Proposed virtual bass algorithm in which the transient part T (m, k) is processed in a different way than the tonal part S(m, k).
the Chebyshev window. It is assumed that any frequency compo-
nent below fc will be highly attenuated by the loudspeaker and,
therefore, it should be suppressed after performing the bandwidth
extension. The fc parameter depends on the frequency response of
the loudspeaker, and its value may vary between about 100 Hz and
200 Hz in small loudspeakers.
Choosing an optimal nonlinear function for the VBS is not an
obvious task, as was shown by Oo et al. who analyzed and graded
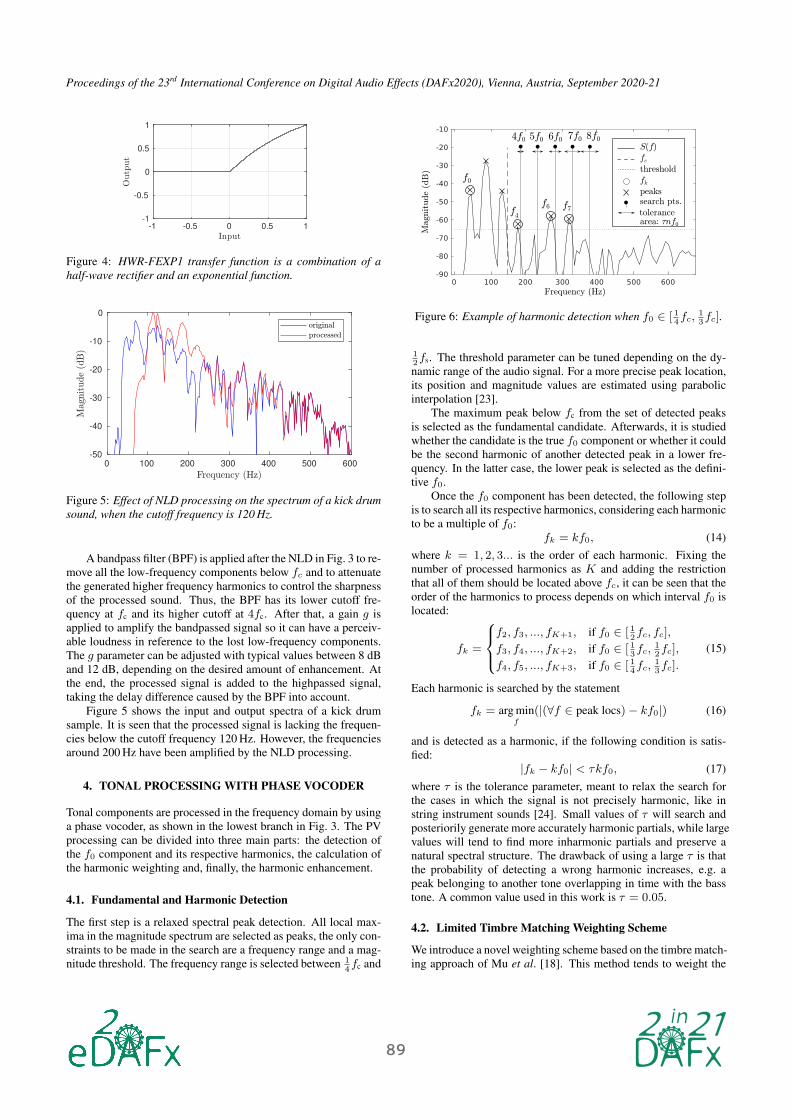
different NLDs [21, 22]. The nonlinear function we apply is a half-
wave rectifier cascaded with a fuzz exponential (HWR-FEXP1),
having the transfer function shown in Fig. 4. The main motivation
for using this NLD lays on the fact that the magnitude gaps be-
tween generated harmonics do not vary with the input magnitude
[21]. Its use is not recommended in [22], because it shows poor
performance in intermodulation distortion tests. However, since
we are applying this NLD to transient signals, which are non-tonal,
intermodulation distortion can be neglected.
The half-wave rectifier generates even harmonics due to its
asymmetry. Because of this fact, the missing fundamental effect
produces the perception of a fundamental at 2f0, one octave higher
than desired. Therefore, we also apply the FEXP1, which only
generates odd harmonics, to produce a complete harmonic series.
This combination has proven to be effective for transient signals in
other studies [16].
DAFx.3
DAF2
x21in
Proceedings of the 23rd International Conference on Digital Audio Effects (DAFx2020), Vienna, Austria, September 2020-21
88
Proceedings of the 23rd International Conference on Digital Audio Effects (DAFx-20), Vienna, Austria, September 8–12, 2020
-1 -0.5 0 0.5 1-1
-0.5
0
0.5
1
Figure 4: HWR-FEXP1 transfer function is a combination of a
half-wave rectifier and an exponential function.
0 100 200 300 400 500 600
-50
-40
-30
-20
-10
0
Figure 5: Effect of NLD processing on the spectrum of a kick drum
sound, when the cutoff frequency is 120 Hz.
A bandpass filter (BPF) is applied after the NLD in Fig. 3 to re-
move all the low-frequency components below fc and to attenuate
the generated higher frequency harmonics to control the sharpness
of the processed sound. Thus, the BPF has its lower cutoff fre-
quency at fc and its higher cutoff at 4fc. After that, a gain g is
applied to amplify the bandpassed signal so it can have a perceiv-
able loudness in reference to the lost low-frequency components.
The g parameter can be adjusted with typical values between 8 dB
and 12 dB, depending on the desired amount of enhancement. At
the end, the processed signal is added to the highpassed signal,
taking the delay difference caused by the BPF into account.
Figure 5 shows the input and output spectra of a kick drum
sample. It is seen that the processed signal is lacking the frequen-
cies below the cutoff frequency 120 Hz. However, the frequencies
around 200 Hz have been amplified by the NLD processing.
4. TONAL PROCESSING WITH PHASE VOCODER
Tonal components are processed in the frequency domain by using
a phase vocoder, as shown in the lowest branch in Fig. 3. The PV
processing can be divided into three main parts: the detection of
the f0 component and its respective harmonics, the calculation of
the harmonic weighting and, finally, the harmonic enhancement.
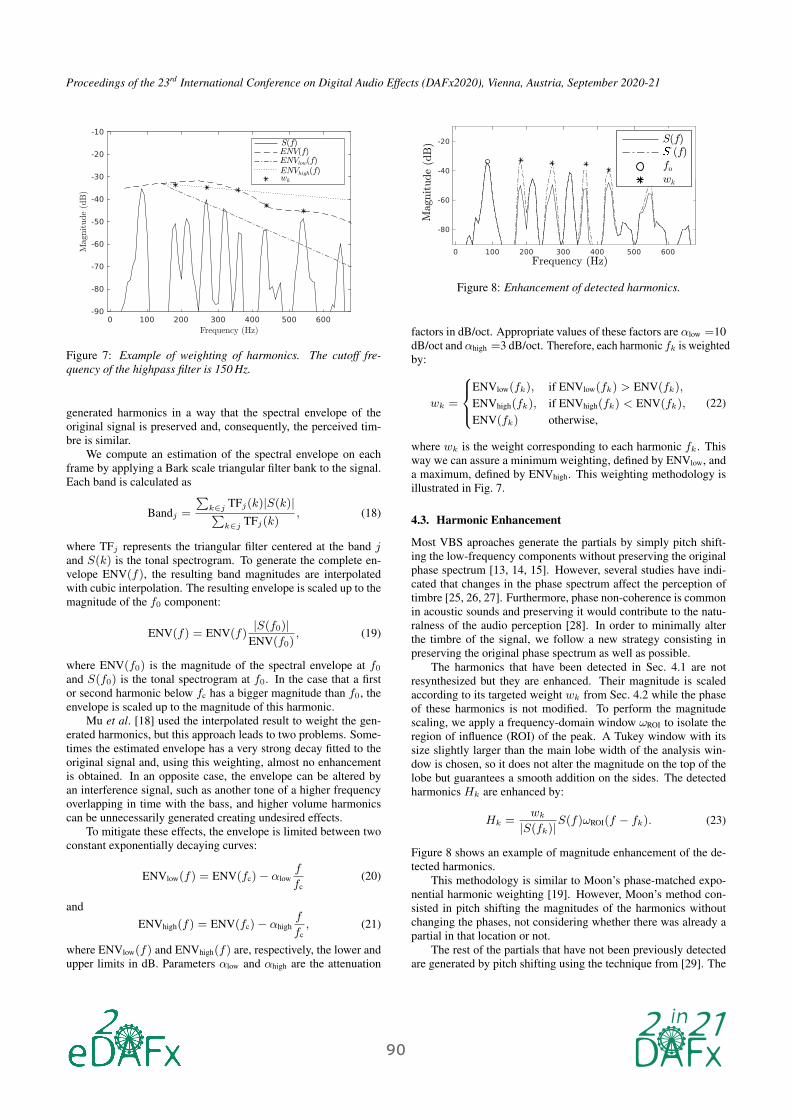
4.1. Fundamental and Harmonic Detection
The first step is a relaxed spectral peak detection. All local max-
ima in the magnitude spectrum are selected as peaks, the only con-
straints to be made in the search are a frequency range and a mag-
nitude threshold. The frequency range is selected between 14fc and
f0
f4f6 f7
4f0 5f0 6f0 7f0 8f0
S(f)
fcthreshold
fkpeakssearch pts.
tolerancearea: ¿nf0
Frequency (Hz)
Mag
nitude
(dB
)
Figure 6: Example of harmonic detection when f0 ∈ [ 14fc,
13fc].
12fs. The threshold parameter can be tuned depending on the dy-
namic range of the audio signal. For a more precise peak location,
its position and magnitude values are estimated using parabolic
interpolation [23].
The maximum peak below fc from the set of detected peaks
is selected as the fundamental candidate. Afterwards, it is studied
whether the candidate is the true f0 component or whether it could
be the second harmonic of another detected peak in a lower fre-
quency. In the latter case, the lower peak is selected as the defini-
tive f0.
Once the f0 component has been detected, the following step
is to search all its respective harmonics, considering each harmonic
to be a multiple of f0:
fk = kf0, (14)
where k = 1, 2, 3... is the order of each harmonic. Fixing the
number of processed harmonics as K and adding the restriction
that all of them should be located above fc, it can be seen that the
order of the harmonics to process depends on which interval f0 is
located:
fk =
f2, f3, ..., fK+1, if f0 ∈ [ 12fc, fc],
f3, f4, ..., fK+2, if f0 ∈ [ 13fc,
12fc],
f4, f5, ..., fK+3, if f0 ∈ [ 14fc,
13fc].
(15)
Each harmonic is searched by the statement
fk = arg minf
(|(∀f ∈ peak locs)− kf0|) (16)
and is detected as a harmonic, if the following condition is satis-
fied:
|fk − kf0| < τkf0, (17)
where τ is the tolerance parameter, meant to relax the search for
the cases in which the signal is not precisely harmonic, like in
string instrument sounds [24]. Small values of τ will search and
posteriorily generate more accurately harmonic partials, while large
values will tend to find more inharmonic partials and preserve a
natural spectral structure. The drawback of using a large τ is that
the probability of detecting a wrong harmonic increases, e.g. a
peak belonging to another tone overlapping in time with the bass
tone. A common value used in this work is τ = 0.05.
4.2. Limited Timbre Matching Weighting Scheme
We introduce a novel weighting scheme based on the timbre match-
ing approach of Mu et al. [18]. This method tends to weight the
DAFx.4
DAF2
x21in
Proceedings of the 23rd International Conference on Digital Audio Effects (DAFx2020), Vienna, Austria, September 2020-21
89
Proceedings of the 23rd International Conference on Digital Audio Effects (DAFx-20), Vienna, Austria, September 8–12, 2020
S(f)ENV(f)ENVlow(f)ENVhigh(f)wk
Figure 7: Example of weighting of harmonics. The cutoff fre-
quency of the highpass filter is 150 Hz.
generated harmonics in a way that the spectral envelope of the
original signal is preserved and, consequently, the perceived tim-
bre is similar.
We compute an estimation of the spectral envelope on each
frame by applying a Bark scale triangular filter bank to the signal.
Each band is calculated as
Bandj =
∑
k∈jTFj(k)|S(k)|
∑
k∈jTFj(k)
, (18)
where TFj represents the triangular filter centered at the band j
and S(k) is the tonal spectrogram. To generate the complete en-
velope ENV(f), the resulting band magnitudes are interpolated
with cubic interpolation. The resulting envelope is scaled up to the
magnitude of the f0 component:
ENV(f) = ENV(f)|S(f0)|
ENV(f0), (19)
where ENV(f0) is the magnitude of the spectral envelope at f0and S(f0) is the tonal spectrogram at f0. In the case that a first
or second harmonic below fc has a bigger magnitude than f0, the
envelope is scaled up to the magnitude of this harmonic.
Mu et al. [18] used the interpolated result to weight the gen-
erated harmonics, but this approach leads to two problems. Some-
times the estimated envelope has a very strong decay fitted to the
original signal and, using this weighting, almost no enhancement
is obtained. In an opposite case, the envelope can be altered by
an interference signal, such as another tone of a higher frequency
overlapping in time with the bass, and higher volume harmonics
can be unnecessarily generated creating undesired effects.
To mitigate these effects, the envelope is limited between two
constant exponentially decaying curves:
ENVlow(f) = ENV(fc)− αlow
f
fc
(20)
and
ENVhigh(f) = ENV(fc)− αhigh
f
fc
, (21)
where ENVlow(f) and ENVhigh(f) are, respectively, the lower and
upper limits in dB. Parameters αlow and αhigh are the attenuation
S(f)S (f)f0wk
Mag
nitude
(dB
)
Frequency (Hz)
Figure 8: Enhancement of detected harmonics.
factors in dB/oct. Appropriate values of these factors are αlow =10
dB/oct and αhigh =3 dB/oct. Therefore, each harmonic fk is weighted
by:
wk =
ENVlow(fk), if ENVlow(fk) > ENV(fk),
ENVhigh(fk), if ENVhigh(fk) < ENV(fk),
ENV(fk) otherwise,
(22)
where wk is the weight corresponding to each harmonic fk. This
way we can assure a minimum weighting, defined by ENVlow, and
a maximum, defined by ENVhigh. This weighting methodology is
illustrated in Fig. 7.
4.3. Harmonic Enhancement
Most VBS aproaches generate the partials by simply pitch shift-
ing the low-frequency components without preserving the original
phase spectrum [13, 14, 15]. However, several studies have indi-
cated that changes in the phase spectrum affect the perception of
timbre [25, 26, 27]. Furthermore, phase non-coherence is common
in acoustic sounds and preserving it would contribute to the natu-
ralness of the audio perception [28]. In order to minimally alter
the timbre of the signal, we follow a new strategy consisting in
preserving the original phase spectrum as well as possible.
The harmonics that have been detected in Sec. 4.1 are not
resynthesized but they are enhanced. Their magnitude is scaled
according to its targeted weight wk from Sec. 4.2 while the phase
of these harmonics is not modified. To perform the magnitude
scaling, we apply a frequency-domain window ωROI to isolate the
region of influence (ROI) of the peak. A Tukey window with its
size slightly larger than the main lobe width of the analysis win-
dow is chosen, so it does not alter the magnitude on the top of the
lobe but guarantees a smooth addition on the sides. The detected
harmonics Hk are enhanced by:
Hk =wk
|S(fk)|S(f)ωROI(f − fk). (23)
Figure 8 shows an example of magnitude enhancement of the de-
tected harmonics.
This methodology is similar to Moon’s phase-matched expo-
nential harmonic weighting [19]. However, Moon’s method con-
sisted in pitch shifting the magnitudes of the harmonics without
changing the phases, not considering whether there was already a
partial in that location or not.
The rest of the partials that have not been previously detected
are generated by pitch shifting using the technique from [29]. The
DAFx.5
DAF2
x21in
Proceedings of the 23rd International Conference on Digital Audio Effects (DAFx2020), Vienna, Austria, September 2020-21
90
Proceedings of the 23rd International Conference on Digital Audio Effects (DAFx-20), Vienna, Austria, September 8–12, 2020
S(f)S (f)f0wk
Mag
nitude
(dB
)
Frequency (Hz)
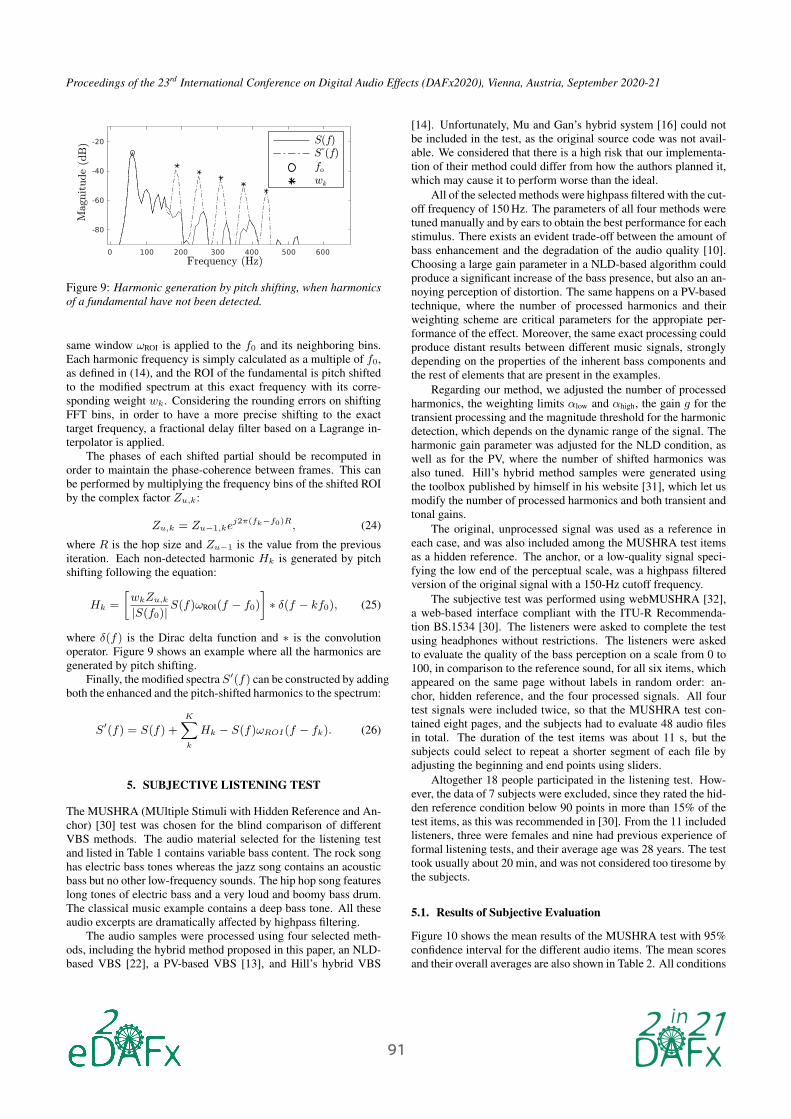
Figure 9: Harmonic generation by pitch shifting, when harmonics
of a fundamental have not been detected.
same window ωROI is applied to the f0 and its neighboring bins.
Each harmonic frequency is simply calculated as a multiple of f0,
as defined in (14), and the ROI of the fundamental is pitch shifted
to the modified spectrum at this exact frequency with its corre-
sponding weight wk. Considering the rounding errors on shifting
FFT bins, in order to have a more precise shifting to the exact
target frequency, a fractional delay filter based on a Lagrange in-
terpolator is applied.
The phases of each shifted partial should be recomputed in
order to maintain the phase-coherence between frames. This can
be performed by multiplying the frequency bins of the shifted ROI
by the complex factor Zu,k:
Zu,k = Zu−1,kej2π(fk−f0)R, (24)
where R is the hop size and Zu−1 is the value from the previous
iteration. Each non-detected harmonic Hk is generated by pitch
shifting following the equation:
Hk =
[
wkZu,k
|S(f0)|S(f)ωROI(f − f0)
]
∗ δ(f − kf0), (25)
where δ(f) is the Dirac delta function and ∗ is the convolution
operator. Figure 9 shows an example where all the harmonics are
generated by pitch shifting.
Finally, the modified spectra S′(f) can be constructed by adding
both the enhanced and the pitch-shifted harmonics to the spectrum:
S′(f) = S(f) +
K∑
k
Hk − S(f)ωROI(f − fk). (26)
5. SUBJECTIVE LISTENING TEST
The MUSHRA (MUltiple Stimuli with Hidden Reference and An-
chor) [30] test was chosen for the blind comparison of different
VBS methods. The audio material selected for the listening test
and listed in Table 1 contains variable bass content. The rock song
has electric bass tones whereas the jazz song contains an acoustic
bass but no other low-frequency sounds. The hip hop song features
long tones of electric bass and a very loud and boomy bass drum.
The classical music example contains a deep bass tone. All these
audio excerpts are dramatically affected by highpass filtering.
The audio samples were processed using four selected meth-
ods, including the hybrid method proposed in this paper, an NLD-
based VBS [22], a PV-based VBS [13], and Hill’s hybrid VBS
[14]. Unfortunately, Mu and Gan’s hybrid system [16] could not
be included in the test, as the original source code was not avail-
able. We considered that there is a high risk that our implementa-
tion of their method could differ from how the authors planned it,
which may cause it to perform worse than the ideal.
All of the selected methods were highpass filtered with the cut-
off frequency of 150 Hz. The parameters of all four methods were
tuned manually and by ears to obtain the best performance for each
stimulus. There exists an evident trade-off between the amount of
bass enhancement and the degradation of the audio quality [10].
Choosing a large gain parameter in a NLD-based algorithm could
produce a significant increase of the bass presence, but also an an-
noying perception of distortion. The same happens on a PV-based
technique, where the number of processed harmonics and their
weighting scheme are critical parameters for the appropiate per-
formance of the effect. Moreover, the same exact processing could
produce distant results between different music signals, strongly
depending on the properties of the inherent bass components and
the rest of elements that are present in the examples.
Regarding our method, we adjusted the number of processed
harmonics, the weighting limits αlow and αhigh, the gain g for the
transient processing and the magnitude threshold for the harmonic
detection, which depends on the dynamic range of the signal. The
harmonic gain parameter was adjusted for the NLD condition, as
well as for the PV, where the number of shifted harmonics was
also tuned. Hill’s hybrid method samples were generated using
the toolbox published by himself in his website [31], which let us
modify the number of processed harmonics and both transient and
tonal gains.
The original, unprocessed signal was used as a reference in
each case, and was also included among the MUSHRA test items
as a hidden reference. The anchor, or a low-quality signal speci-
fying the low end of the perceptual scale, was a highpass filtered
version of the original signal with a 150-Hz cutoff frequency.
The subjective test was performed using webMUSHRA [32],
a web-based interface compliant with the ITU-R Recommenda-
tion BS.1534 [30]. The listeners were asked to complete the test
using headphones without restrictions. The listeners were asked
to evaluate the quality of the bass perception on a scale from 0 to
100, in comparison to the reference sound, for all six items, which
appeared on the same page without labels in random order: an-
chor, hidden reference, and the four processed signals. All four
test signals were included twice, so that the MUSHRA test con-
tained eight pages, and the subjects had to evaluate 48 audio files
in total. The duration of the test items was about 11 s, but the
subjects could select to repeat a shorter segment of each file by
adjusting the beginning and end points using sliders.
Altogether 18 people participated in the listening test. How-
ever, the data of 7 subjects were excluded, since they rated the hid-
den reference condition below 90 points in more than 15% of the
test items, as this was recommended in [30]. From the 11 included
listeners, three were females and nine had previous experience of
formal listening tests, and their average age was 28 years. The test
took usually about 20 min, and was not considered too tiresome by
the subjects.
5.1. Results of Subjective Evaluation
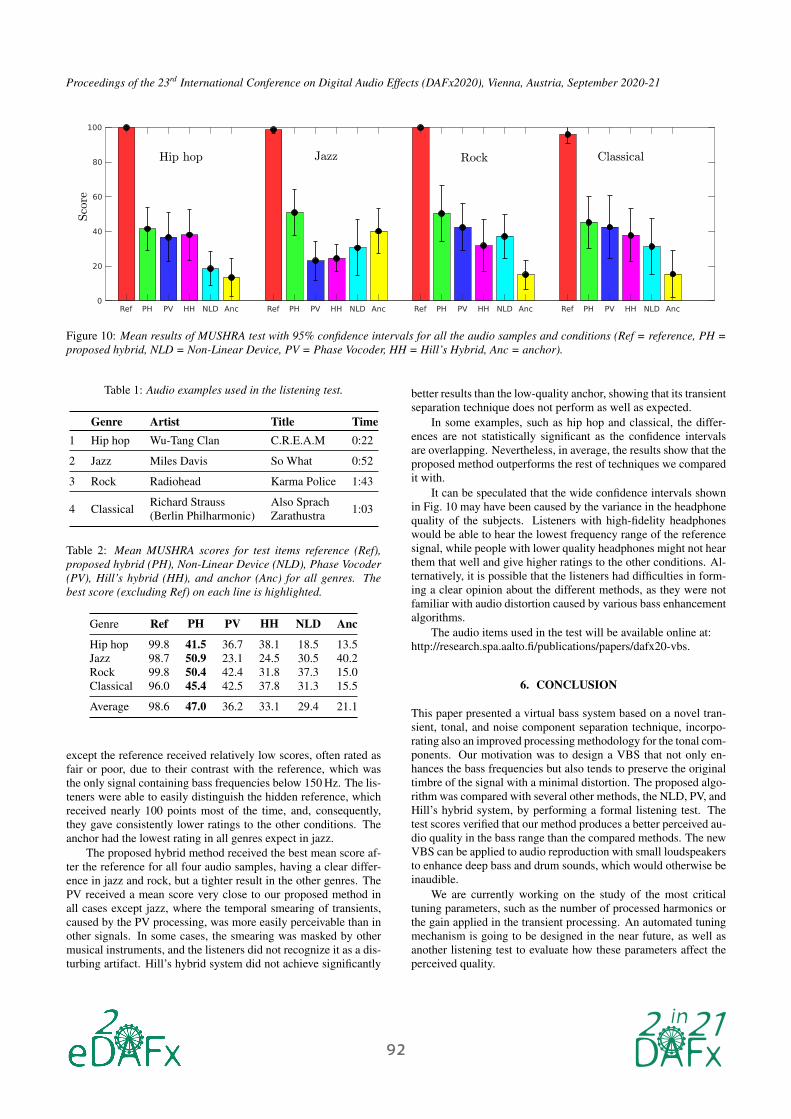
Figure 10 shows the mean results of the MUSHRA test with 95%
confidence interval for the different audio items. The mean scores
and their overall averages are also shown in Table 2. All conditions
DAFx.6
DAF2
x21in
Proceedings of the 23rd International Conference on Digital Audio Effects (DAFx2020), Vienna, Austria, September 2020-21
91
Proceedings of the 23rd International Conference on Digital Audio Effects (DAFx-20), Vienna, Austria, September 8–12, 2020
Ref PH PV HH NLD Anc Ref PH PV HH NLD Anc Ref PH PV HH NLD Anc Ref PH PV HH NLD Anc0
20
40
60
80
100
Hip hop Jazz Rock Classical
Score
Figure 10: Mean results of MUSHRA test with 95% confidence intervals for all the audio samples and conditions (Ref = reference, PH =
proposed hybrid, NLD = Non-Linear Device, PV = Phase Vocoder, HH = Hill’s Hybrid, Anc = anchor).
Table 1: Audio examples used in the listening test.
Genre Artist Title Time
1 Hip hop Wu-Tang Clan C.R.E.A.M 0:22
2 Jazz Miles Davis So What 0:52
3 Rock Radiohead Karma Police 1:43
4 ClassicalRichard Strauss
(Berlin Philharmonic)
Also Sprach
Zarathustra1:03
Table 2: Mean MUSHRA scores for test items reference (Ref),
proposed hybrid (PH), Non-Linear Device (NLD), Phase Vocoder
(PV), Hill’s hybrid (HH), and anchor (Anc) for all genres. The
best score (excluding Ref) on each line is highlighted.
Genre Ref PH PV HH NLD Anc
Hip hop 99.8 41.5 36.7 38.1 18.5 13.5
Jazz 98.7 50.9 23.1 24.5 30.5 40.2
Rock 99.8 50.4 42.4 31.8 37.3 15.0
Classical 96.0 45.4 42.5 37.8 31.3 15.5
Average 98.6 47.0 36.2 33.1 29.4 21.1
except the reference received relatively low scores, often rated as
fair or poor, due to their contrast with the reference, which was
the only signal containing bass frequencies below 150 Hz. The lis-
teners were able to easily distinguish the hidden reference, which
received nearly 100 points most of the time, and, consequently,
they gave consistently lower ratings to the other conditions. The
anchor had the lowest rating in all genres expect in jazz.
The proposed hybrid method received the best mean score af-
ter the reference for all four audio samples, having a clear differ-
ence in jazz and rock, but a tighter result in the other genres. The
PV received a mean score very close to our proposed method in
all cases except jazz, where the temporal smearing of transients,
caused by the PV processing, was more easily perceivable than in
other signals. In some cases, the smearing was masked by other
musical instruments, and the listeners did not recognize it as a dis-
turbing artifact. Hill’s hybrid system did not achieve significantly
better results than the low-quality anchor, showing that its transient
separation technique does not perform as well as expected.
In some examples, such as hip hop and classical, the differ-
ences are not statistically significant as the confidence intervals
are overlapping. Nevertheless, in average, the results show that the
proposed method outperforms the rest of techniques we compared
it with.
It can be speculated that the wide confidence intervals shown
in Fig. 10 may have been caused by the variance in the headphone
quality of the subjects. Listeners with high-fidelity headphones
would be able to hear the lowest frequency range of the reference
signal, while people with lower quality headphones might not hear
them that well and give higher ratings to the other conditions. Al-
ternatively, it is possible that the listeners had difficulties in form-
ing a clear opinion about the different methods, as they were not
familiar with audio distortion caused by various bass enhancement
algorithms.
The audio items used in the test will be available online at:
http://research.spa.aalto.fi/publications/papers/dafx20-vbs.
6. CONCLUSION
This paper presented a virtual bass system based on a novel tran-
sient, tonal, and noise component separation technique, incorpo-
rating also an improved processing methodology for the tonal com-
ponents. Our motivation was to design a VBS that not only en-
hances the bass frequencies but also tends to preserve the original
timbre of the signal with a minimal distortion. The proposed algo-
rithm was compared with several other methods, the NLD, PV, and
Hill’s hybrid system, by performing a formal listening test. The
test scores verified that our method produces a better perceived au-
dio quality in the bass range than the compared methods. The new
VBS can be applied to audio reproduction with small loudspeakers
to enhance deep bass and drum sounds, which would otherwise be
inaudible.
We are currently working on the study of the most critical
tuning parameters, such as the number of processed harmonics or
the gain applied in the transient processing. An automated tuning
mechanism is going to be designed in the near future, as well as
another listening test to evaluate how these parameters affect the
perceived quality.
DAFx.7
DAF2
x21in
Proceedings of the 23rd International Conference on Digital Audio Effects (DAFx2020), Vienna, Austria, September 2020-21
92
Proceedings of the 23rd International Conference on Digital Audio Effects (DAFx-20), Vienna, Austria, September 8–12, 2020
7. ACKNOWLEDGMENTS
This work was conducted during Eloi Moliner’s visit to Aalto Uni-
versity, where he was working on his Master’s thesis in January–
July 2020 with the support of the ERASMUS program and the
Universitat Politècnica de Catalunya, Barcelona. Many thanks to
the listeners who took part in the subjective test. The authors also
thank Adam J. Hill for publishing his Virtual Bass Toolbox.
8. REFERENCES
[1] J.F. Schouten, R.J. Ritsma, and B.L. Cardozo, “Pitch of the
residue,” J. Acoust. Soc. Am., vol. 34, no. 9, pp. 1418, 1962.
[2] B.C.J. Moore, An Introduction to the Psychology of Hearing,
Emerald, 2012.
[3] M. Oda, “Low frequency audio conversion circuit,” US
Patent 5,668,885, Sept. 16, 1997.
[4] T. Unemura, “Audio circuit,” US Patent 5,771,296, June 23,
1998.
[5] E. E. Feremans and F. De Smet, “Method and device for
processing signals,” US Patent 5,828,755, Oct. 27 1998.
[6] D. Ben-Tzur, “The effect of the MaxxBass 1 psychoacoustic
bass enhancement system on loudspeaker design,” in Proc.
AES 106th Conv., 1999.
[7] M. Shashoua and D. Glotter, “Method and system for
enhancing quality of sound signal,” US Patent 5,930,373,
July 27, 1999.
[8] W.-S. Gan, S. M. Kuo, and C. W. Toh, “Virtual bass for home
entertainment, multimedia PC, game station and portable au-
dio systems,” IEEE Trans. Consumer Electronics, vol. 47,
no. 4, pp. 787–796, Nov. 2001.
[9] E. Larsen and R. Aarts, “Reproducing low-pitched signals
through small loudspeakers,” J. Audio Eng. Soc., vol. 50, no.
3, pp. 147–164, Jan. 2002.
[10] E. Larsen and R.M. Aarts, Audio Bandwidth Extension: Ap-
plication of Psychoacoustics, Signal Processing and Loud-
speaker Design, Wiley, 2005.
[11] N. Oo and W.-S. Gan, “Harmonic analysis of nonlinear de-
vices for virtual bass system,” in Proc. Int. Conf. Audio, Lan-
guage and Image Processing, Aug. 2008, pp. 279–284.
[12] W.-S. Gan and N. Oo, “Harmonic and intermodulation anal-
ysis of nonlinear devices used in virtual bass systems,” in
Proc. AES 124th Conv., May 2008.
[13] M. Bai and C. Lin, “Synthesis and implementation of virtual
bass system with a phase-vocoder approach,” J. Audio Eng.
Soc., vol. 54, 11 2006.
[14] A. J. Hill and M. O. J. Hawksford, “A hybrid virtual bass sys-
tem for optimized steady-state and transient performance,” in
Proc. Computer Science and Electronic Engineering Conf.
(CEEC), Sep. 2010, pp. 1–6.
[15] H. Mu, W.-S. Gan, and E. Tan, “A psychoacoustic bass en-
hancement system with improved transient and steady-state
performance,” in Proc. IEEE Int. Conf. Acoustics, Speech
and Signal Processing (ICASSP), Mar. 2012, pp. 141–144.
[16] H. Mu and W.-S. Gan, “Perceptual quality improvement and
assessment for virtual bass systems,” J. Audio Eng. Soc., vol.
63, no. 11, pp. 900–913, 2015.
[17] D. Fitzgerald, “Harmonic/percussive separation using me-
dian filtering,” Proc. Int. Conf. Digital Audio Effects (DAFx-
10), Sept. 2010.
[18] H. Mu, W.-S. Gan, and E. Tan, “A timbre matching approach
to enhance audio quality of psychoacoustic bass enhance-
ment system,” in Proc. IEEE Int. Conf. Acoustics, Speech
and Signal Process., May 2013, pp. 36–40.
[19] H. Moon, G. Park, Y. Park, and D. H. Youn, “A phase-
matched exponential harmonic weighting for improved sen-
sation of virtual bass,” in Proc. AES Conv. 140, May 2016.
[20] E.-P. Damskägg and V. Välimäki, “Audio time stretching
using fuzzy classification of spectral bins,” Applied Sciences,
vol. 7, pp. 1293, Dec. 2017.
[21] W.-S. Gan and N. Oo, “Analytical and perceptual evaluation
of nonlinear devices for virtual bass system,” in Proc. AES
128th Conv., May 2010.
[22] N. Oo, W.-S. Gan, and M.O.J. Hawksford, “Perceptually-
motivated objective grading of nonlinear processing in vir-
tual bass systems,” J. Audio Eng. Soc., vol. 59, no. 11, pp.
804–824, Nov. 2011.
[23] J. O. Smith and X. Serra, “PARSHL: An analysis/synthesis
program for non-harmonic sounds based on a sinusoidal rep-
resentation,” in Proc. Int. Computer Music Conf., Urbana,
IL, USA, 1987, pp. 290–297.
[24] H. Järveläinen, V. Välimäki, and M. Karjalainen, “Audibility
of the timbral effects of inharmonicity in stringed instrument
tones,” Acoustics Research Letters Online, vol. 2, no. 3, pp.
79–84, Jul. 2001.
[25] R. Plomp and H. J. M. Steeneken, “Effect of phase on the
timbre of complex tones,” J. Acoust. Soc. Am., vol. 46, no.
2B, pp. 409–421, 1969.
[26] B. C. J. Moore, “Interference effects and phase sensitivity in
hearing,” Philosophical Transactions of the Royal Society of
London. Series A: Mathematical, Physical and Engineering
Sciences, vol. 360, pp. 833–858, 2002.
[27] M. Laitinen, S. Disch, and V. Pulkki, “Sensitivity of human
hearing to changes in phase spectrum,” J. Audio Eng. Soc.,
vol. 61, no. 11, pp. 860–877, Nov. 2013.
[28] S. Dubnov and X. Rodet, “Investigation of phase cou-
pling phenomena in sustained portion of musical instruments
sound,” J. Acoust. Soc. Am., vol. 113, no. 1, pp. 348–359,
2003.
[29] J. Laroche and M. Dolson, “New phase-vocoder techniques
for pitch-shifting, harmonizing and other exotic effects,” in
Proc. IEEE Workshop on Applications of Signal Processing
to Audio and Acoustics (WASPAA), 1999, pp. 91–94.
[30] ITU-R, “Method for the subjective assessment of inter-
mediate quality level of audio systems,” Recommenda-
tion BS.1534-3, International Telecommunication Union,
Geneva, Switzerland, Oct. 2015.
[31] “Vb toolbox,” http://adamjhill.com/vb-toolbox/,
Accessed: 2020-04-18.
[32] M. Schoeffler, S. Bartoschek, F. Stöter, M. Roess, S. West-
phal, B. Edler, and J. Herre, “webMUSHRA — A compre-
hensive framework for web-based listening tests,” J. Open
Research Software, vol. 6, Feb. 2018.
DAFx.8
DAF2
x21in
Proceedings of the 23rd International Conference on Digital Audio Effects (DAFx2020), Vienna, Austria, September 2020-21
93