Embed Size (px)
Citation preview

Virginia’s Nursing Education Programs: 2012-2013 Academic Year
Healthcare Workforce Data Center
August 2014
Virginia Department of Health Professions Healthcare Workforce Data Center
Perimeter Center 9960 Mayland Drive, Suite 300
Richmond, VA 23233 804-367-2115, 804-527-4466(fax) E-mail: [email protected]
Follow us on Tumblr: www.vahwdc.tumblr.com

Virginia Department of Health Professions
David E. Brown, D.C. Director
Jaime H. Hoyle, J.D. Chief Deputy Director
Healthcare Workforce Data Center Staff:
Dr. Elizabeth Carter, Ph.D. Director
Justin Crow, MPA Deputy Director
Laura Jackson Operations Manager
Christopher Coyle Research Assistant

Board of Nursing
President
Jane R. Ingalls, R.N., Ph.D. Fredericksburg
Vice-President
Joyce A. Hahn, Ph.D., APRN, NEA-BC
Oak Hill
Members
Trula E. Minton, M.S., R.N. Richmond
Guia Caliwagan, R.N., MAN
Virginia Beach
Joana Garcia Fairfax Station
Marie Gerardo, MS, R.N., ANP-BC
Midlothian
Louise Hershkowitz, CRNA, MSHA Reston
Jeanne E. Holmes
Prince Geroge
Evelyn Lindsay, L.P.N. Richmond
Kelly S. McDonough, DNP, R.N.
Fredericksburg
Jennifer Phelps, L.P.N.III/QMHPA Lynchburg
William Traynham, L.P.N., C.S.A.C.
Glen Allen

Contents
Results in Brief ............................................................................................................................................................................ 1
PRACTICAL NURSING EDUCATION PROGRAM ................................................................................................ 2
Program Structure ...................................................................................................................................................................... 2 Program Details .............................................................................................................................................................................. 3 Clinical Hours .................................................................................................................................................................................. 4
Student Information ................................................................................................................................................................... 6 Admissions...................................................................................................................................................................................... 6 Background of Admitted Students ................................................................................................................................................. 7 Capacity .......................................................................................................................................................................................... 8 Enrollment ...................................................................................................................................................................................... 9 Attrition ........................................................................................................................................................................................ 10 Graduates ..................................................................................................................................................................................... 11 Background of Graduates ............................................................................................................................................................. 12 Long-Term Trends ........................................................................................................................................................................ 13
Faculty Information .................................................................................................................................................................. 14 Employment ................................................................................................................................................................................. 14 Demographics ............................................................................................................................................................................... 15 Educational Background ............................................................................................................................................................... 16 Appointments and Resignations .................................................................................................................................................. 17 Future Faculty Requirements ....................................................................................................................................................... 18
REGISTERED NURSING EDUCATION PROGRAMS ......................................................................................... 19
Program Structure .................................................................................................................................................................... 19 Program Details ............................................................................................................................................................................ 20 Clinical Hours ................................................................................................................................................................................ 21
Student Information ................................................................................................................................................................. 23 Admissions.................................................................................................................................................................................... 23 Background of Admitted Students ............................................................................................................................................... 24 Capacity ........................................................................................................................................................................................ 25 Enrollment .................................................................................................................................................................................... 26 Attrition ........................................................................................................................................................................................ 27 Graduates ..................................................................................................................................................................................... 28 Background of Graduates ............................................................................................................................................................. 29 Long-Term Trends ........................................................................................................................................................................ 30
Faculty Information .................................................................................................................................................................. 31 Employment ................................................................................................................................................................................. 31 Demographics ............................................................................................................................................................................... 32 Educational Background ............................................................................................................................................................... 33 Appointments and Resignations .................................................................................................................................................. 34 Future Faculty Requirements ....................................................................................................................................................... 35

1
Results in Brief
Virginia’s Nursing Education Programs
PN Programs RN Programs
Mean Program Length 15 Months 24 Months
% with SACS Accreditation 41% 58%
% with NLNAC Accreditation 8% 34%
% offering Evening Courses 39% 52%
% offering Weekend Courses 29% 22%
% offering Online Courses 19% 29%
Median Clinical Experience Hours 426-450 576-600
Median Direct Client Care Hours 400+ 501-525
Students
Total Applicants 5,013 16,148
% Qualified Applicants 70% 61%
Total 1st Year Students Enrolled 2,376 5,739
Mean GPA of Admitted Students 2.8 3.2
Mean Age of Admitted Students 27 29
1st Year Student Capacity 3,224 5,850
% Unfilled Capacity 29% 6%
Total Enrollment 2,780 9,885
Attrition Rate 33% 17%
Total Graduates 1,371 3,845
% Male Graduates 7% 9%
Diversity Index* 61% 48%
Faculty
Total Faculty 439 1,977
% Full-Time Employees 54% 46%
Mean Student-to-Faculty Ratio 7.40 6.00
% Female 95% 96%
Diversity Index 44% 28%
Most Common Degree BSN MSN
Full-Time Turnover Rate 20% 11%
Full-Time Newly Appointed Rate 20% 19%
% with Adequate Budget for Full-Time Hiring 93% 93%
% of Full-Time Vacancies in Active Recruitment 83% 69%
% Expecting More Future Employment Disruption 14% 3%
*Diversity Index: In a random encounter between two practitioners, the likelihood that they would be of
different race or ethnicity (using the categories listed in the Demographics section of the report).
Licensed Practical Nurse
2
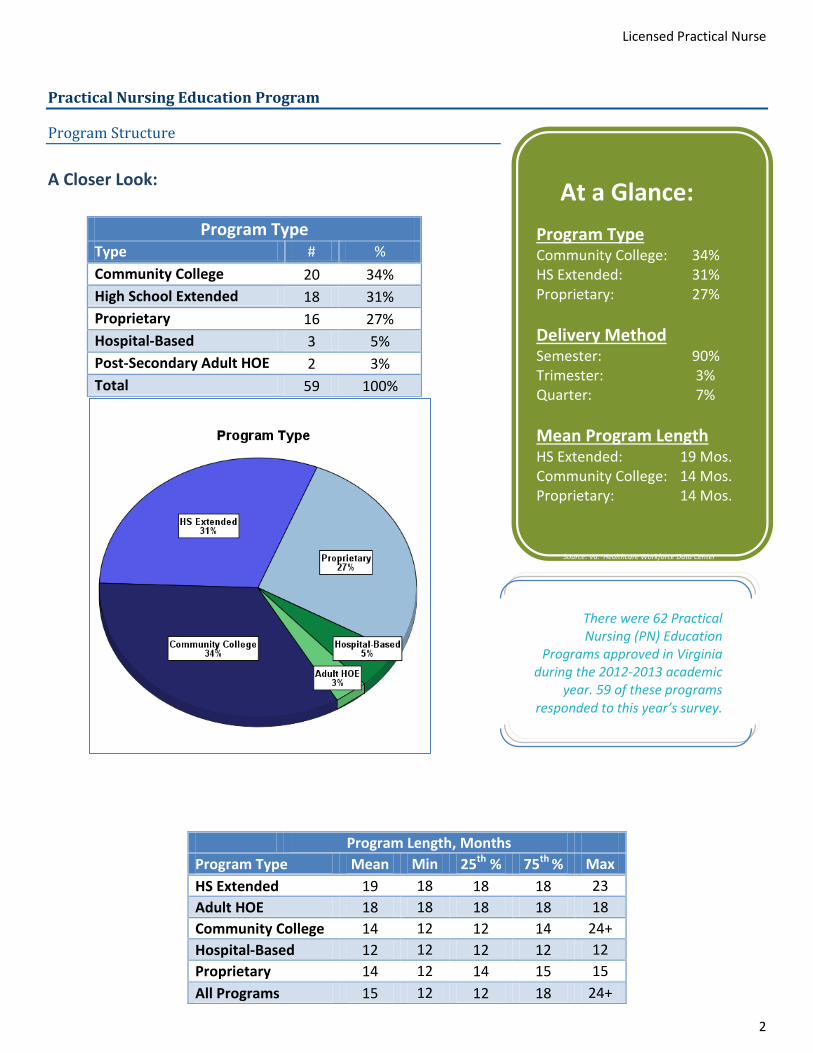
Practical Nursing Education Program
Program Structure
A Closer Look:
Program Type Type # %
Community College 20 34%
High School Extended 18 31%
Proprietary 16 27%
Hospital-Based 3 5%
Post-Secondary Adult HOE 2 3%
Total 59 100%
Program Length, Months
Program Type Mean Min 25th % 75th % Max
HS Extended 19 18 18 18 23
Adult HOE 18 18 18 18 18
Community College 14 12 12 14 24+
Hospital-Based 12 12 12 12 12
Proprietary 14 12 14 15 15
All Programs 15 12 12 18 24+
At a Glance:
Program Type Community College: 34% HS Extended: 31% Proprietary: 27%
Delivery Method Semester: 90% Trimester: 3% Quarter: 7%
Mean Program Length HS Extended: 19 Mos. Community College: 14 Mos. Proprietary: 14 Mos.
There were 62 Practical Nursing (PN) Education
Programs approved in Virginia during the 2012-2013 academic
year. 59 of these programs responded to this year’s survey.
Source: Va. Healthcare Workforce Data Center
Source: Va. Healthcare Workforce Data Center

Licensed Practical Nurse
3
Program Details
Accreditation Accrediting Agency Abbv. # %
Southern Association of Colleges and Schools SACS 24 41%
National League for Nursing Accrediting Commission NLNAC 5 8%
Accrediting Bureau of Health Education Schools ABHES 3 5%
Accrediting Comission of Career Schools and Colleges ACCSC 3 5%
Accrediting Council for Independent Colleges and Schools ACICS 3 5%
Council on Occupational Education COE 1 2%
Scheduling Option # %
Daytime Courses 56 95%
Evening AND Weekend Courses
16 27%
Online Courses 11 19%
Evening Courses 7 12%
Accelerated Courses 1 2%
Weekend Courses 1 2%
At a Glance:
Schedule Options Daytime Courses: 95% Evening Courses: 39% Weekend Courses: 29% Online Courses: 19%
Admissions Frequency (Annual) One: 67% Two: 7% Three: 9% Four or More: 17%
Source: Va. Healthcare Workforce Data Center
Nearly one-quarter of Virginia’s PN programs initiated a change to their
program within the past year. Most of these changes centered on one of three areas:
program relocations/closures, curriculum or clinic hour changes, and the addition of
weekend and/or evening classes.

Licensed Practical Nurse
4
Clinical Hours
Clinical Experiences Outside Virginia State # of Programs % of Programs
Washington, D.C. 3 5%
North Carolina 2 3%
Maryland 1 2%
Tennessee 1 2%
West Virginia 1 2%
At least one 7 12%
At a Glance:
Median Clinical Hours Clinical Experience: 426-450 Direct Client Care: 400+ Direct Client Care in Va.: 430 Clinical Simulation: 26-50 Clinical Observation: 1-25
Source: Va. Healthcare Workforce Data Center
Approximately three-quarters of all PN programs in Virginia required between 400 and 475 hours of clinical experience from their students.
Pursuant to 18VAC 90-20-120.E, Virginia’s PN programs are required to provide 400 hours of direct client care, of which 20% may be simulated.
Only 7 programs offered clinical experience hours outside of Virginia.
Washington, D.C. and North Carolina were the only two areas
where clinical experience was offered by more than one program.

Licensed Practical Nurse
5
Breakdown of Clinical Hours by Program Type
Clinical Hours Program Type
Type Amount HS
Extended Adult HOE
Community College
Hospital Based
Proprietary All
Programs % of Total
Cli
nic
al
Ex
pe
rien
ce
Ho
urs
400 or less 0 0 0 0 0 0 0%
401 to 425 4 1 4 0 7 16 27%
426 to 450 5 0 8 1 0 14 24%
451 to 475 3 1 5 0 6 15 25%
476 to 500 2 0 0 0 1 3 5%
More than 500
4 0 3 2 2 11 19%
Total 18 2 20 3 16 59 100%
Dir
ec
t C
lie
nt
Care
Ho
urs
300 or less 0 0 0 0 0 0 0%
301 to 325 0 0 0 0 1 1 2%
326 to 350 0 0 0 0 0 0 0%
351 to 375 0 0 0 0 0 0 0%
376 to 400 2 1 6 0 3 12 20%
More than 400
16 1 14 3 12 46 78%
Total 18 2 20 3 16 59 100%
Cli
nic
al
Sim
ula
tio
n
Ho
urs
25 or less 12 1 13 1 14 41 29%
26 to 50 4 1 7 1 0 13 41%
51 to 75 1 0 0 1 0 2 22%
76 to 100 1 0 0 0 0 1 3%
More than 100
0 0 0 0 2 2 3%
Total 18 2 20 3 16 59 100%
Clin
ica
l O
bs
erv
ati
on
Ho
urs
25 or less 13 1 18 1 16 49 83%
26 to 50 3 0 2 0 0 5 8%
51 to 75 2 1 0 2 0 5 8%
76 to 100 0 0 0 0 0 0 0% More than
100 0 0 0 0 0 0 0%
Total 18 2 20 3 16 59 100%

Licensed Practical Nurse
6
Student Information
Admissions
Program Type Applications
Received Applicants Qualified
% Qualified
Applicants Admitted
% of Qualified Admitted
Applicants Enrolled
% of Admitted Enrolled
% of Applicants Enrolled
HS Extended 1,273 771 61% 610 79% 557 91% 44%
Adult HOE 64 58 91% 54 93% 44 81% 69% Community College
1,257 784 62% 604 77% 528 87% 42%
Hospital 272 138 51% 105 76% 86 82% 32%
Proprietary 2,147 1,749 81% 1,241 71% 1,161 94% 54%
All Programs 5,013 3,500 70% 2,614 75% 2,376 91% 47%
At a Glance:
Program Applicants Total: 5,013 Qualified: 3,500 Admitted: 2,614 Enrolled: 2,376 Waitlisted: 138
Virginia’s PN programs received a total of 5,013 student applications during the 2012-2013 academic year. Nearly half of
these applications ultimately resulted in an enrolled student.
Source: Va. Healthcare Workforce Data Center
Out of 3,500 qualified applications, 886 did not result in an offer of admission. Lack of clinical space and the inability to expand effective program capacity were the most common reasons cited for denying
admission to qualified applicants.
Source: Va. Healthcare Workforce Data Center
Licensed Practical Nurse
7
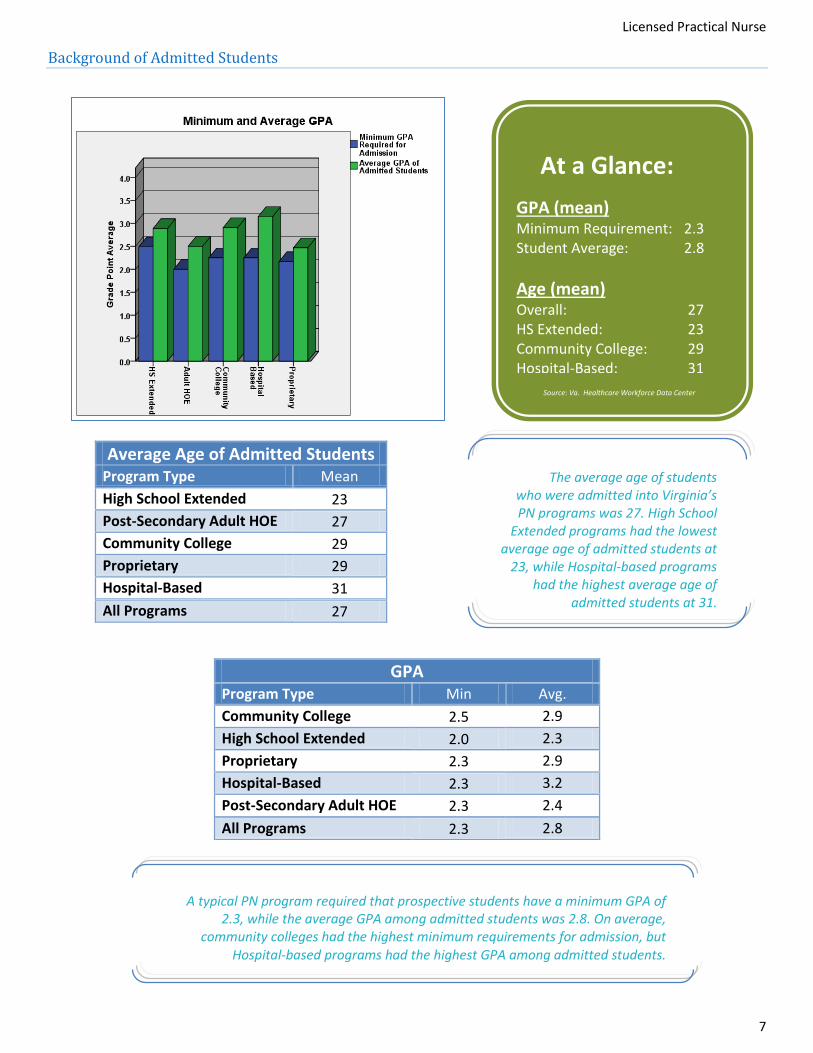
Background of Admitted Students
GPA Program Type Min Avg.
Community College 2.5 2.9
High School Extended 2.0 2.3
Proprietary 2.3 2.9
Hospital-Based 2.3 3.2
Post-Secondary Adult HOE 2.3 2.4
All Programs 2.3 2.8
Average Age of Admitted Students Program Type Mean
High School Extended 23
Post-Secondary Adult HOE 27
Community College 29
Proprietary 29
Hospital-Based 31
All Programs 27
At a Glance:
GPA (mean) Minimum Requirement: 2.3 Student Average: 2.8
Age (mean) Overall: 27 HS Extended: 23 Community College: 29 Hospital-Based: 31
The average age of students who were admitted into Virginia’s PN programs was 27. High School
Extended programs had the lowest average age of admitted students at
23, while Hospital-based programs had the highest average age of
admitted students at 31.
A typical PN program required that prospective students have a minimum GPA of 2.3, while the average GPA among admitted students was 2.8. On average,
community colleges had the highest minimum requirements for admission, but Hospital-based programs had the highest GPA among admitted students.
Source: Va. Healthcare Workforce Data Center

Licensed Practical Nurse
8
Capacity
Program Type
# of Programs with Unfilled Spaces
# of Unfilled Spaces
No Yes Unfilled Spaces
% Total
Spaces % of Total Capacity
HS Extended 8 9 48 5% 568 8%
Adult HOE 0 2 19 2% 65 29% Community College
7 13 150 16% 672 22%
Hospital 0 3 5 1% 92 5%
Proprietary 3 13 715 76% 1,827 39%
All Programs 18 40 937 100% 3,224 29%
At a Glance:
1st-Year Student Capacity Spaces Available: 3,224 Spaces Unfilled: 937
Unfilled Capacity % of Programs: 69% % of Total Capacity: 29%
Source: Va. Healthcare Workforce Data Center
Virginia’s PN programs were able to utilize 71% of its available first-year student capacity. Programs provided a variety of reasons for explaining the cause of unfilled spaces.
Many programs cited a lack of qualified applicants. In addition, many accepted students either chose not to enroll or quit soon after the program started. Some of the students who did not matriculate into a specific program had multiple admission offers, while others did not enter any program because of unspecified personal issues. Financial issues were also a
major problem for many admitted students who chose not to enroll in any program.

Licensed Practical Nurse
9
Enrollment
Program Type
Total Enrollment CNA Enrollment Male Enrollment
Count % Count % Count %
HS Extended 779 28% 237 30% 33 18%
Adult HOE 58 2% 26 3% 7 4% Community College
503 18% 164 21% 35 19%
Hospital 82 3% 20 3% 4 2%
Proprietary 1,358 49% 347 44% 104 57%
All Programs 2,780 100% 794 100% 183 100%
At a Glance:
Enrollment Total: 2,780 CNA: 794 Male: 183
Enrollment by Type Proprietary: 49% HS Extended: 28% Community College: 18%
Source: Va. Healthcare Workforce Data Center
A total of 2,780 students were enrolled in Virginia’s PN programs during the current academic year. 29% of these students were CNAs, while
7% of enrolled students were male.

Licensed Practical Nurse
10
Attrition
Attrition Statistics Program Type
HS Extended
Adult HOE
Community College
Hospital Based
Proprietary All
Programs
Scheduled to Graduate 327 33 476 85 1,362 2,283
Graduated on Time 177 12 265 77 500 1,031
On-Time Graduation Rate 54% 36% 56% 91% 37% 45%
Permanently Left Program 104 5 125 6 522 762
Attrition Rate 32% 15% 26% 7% 38% 33%
Quarter/ Semester
Number of Students
Count %
First 271 51%
Second 137 26%
Third 77 15%
Fourth 36 7%
Fifth 6 1%
Total 527 100%
At a Glance:
Graduation Rate Hospital Based: 91% Community College: 56% HS Extended: 54% Proprietary: 37%
Attrition Rate Hospital Based: 7% Adult HOE: 15% Community College: 26%
Source: Va. Healthcare Workforce Data Center
Among all students who were expected to graduate during this academic year, nearly half ultimately did graduate. Meanwhile, one-third of students
expected to graduate this year permanently left their respective program instead.
Approximately half of all students who left a PN program without
graduating did so during the first quarter or semester of the program.

Licensed Practical Nurse
11
Graduates
Program Type
Total Graduates CNA Graduates Male Graduates
Count % Count % Count %
HS Extended 188 14% 93 22% 7 7%
Adult HOE 26 2% 12 3% 2 2% Community College
296 22% 95 22% 17 18%
Hospital 74 5% 9 2% 2 2%
Proprietary 787 57% 219 51% 66 70%
All Programs 1,371 100% 428 100% 94 100%
At a Glance:
Graduates Total: 1,371 % CNA: 31% % Male: 7%
Grad. by Program Type Proprietary: 57% Community College: 22% HS Extended: 14%
Source: Va. Healthcare Workforce Data Center
A total of 1,371 students graduated from Virginia’s PN programs during the current academic year. 31% of these graduates were CNA students, while 7% were
male. More than half graduated from Proprietary PN programs.

Licensed Practical Nurse
12
Background of Graduates
Race/ Ethnicity
HS Extended Adult HOE Comm. College
Hospital Based
Proprietary All Programs
# % # % # % # % # % # %
White 139 78% 9 35% 180 81% 48 65% 244 34% 620 51%
Black 24 13% 15 58% 35 16% 19 26% 349 49% 442 36%
Hispanic 10 3% 1 4% 4 2% 2 3% 40 6% 57 5%
Asian 6 3% 0 0% 1 0% 2 3% 29 4% 38 3% American Indian
1 1% 0 0% 0 0% 1 1% 1 0% 3 0%
Pacific Islander
1 1% 0 0% 0 0% 0 0% 0 0% 1 0%
Two or More
5 3% 0 0% 1 0% 2 3% 11 2% 19 2%
Unknown 2 1% 1 4% 1 0% 0 0% 38 5% 42 3%
Total 188 100% 26 100% 222 100% 74 100% 712 100% 1,222 100%
Program Type Multi-
Degree Graduates
% % of Total Graduates
HS Extended 8 10% 4%
Adult HOE 1 1% 4%
Comm. College 25 30% 8%
Hospital Based 16 19% 22%
Proprietary 34 40% 4%
All Programs 84 100% 6%
At a Glance:
Race/Ethnicity White: 51% Black: 36% Hispanic: 5%
Multi-Degree Grads. Multi-Degree Graduates: 84 % of Total Graduates: 6%
Source: Va. Healthcare Workforce Data Center
Approximately half of all graduates from Virginia’s PN
programs are non-Hispanic White, while more than one-
third of all graduates are non-Hispanic Black.

Licensed Practical Nurse
13
Long-Term Trends
Academic Year PN Admissions PN Graduates
Count Year-over-Year Change Count Year-over-Year Change
2003-2004 3,008 - 1,254 -
2004-2005 3,759 25% 1,752 40%
2005-2006 3,847 2% 1,804 3%
2006-2007 4,206 9% 2,123 18%
2007-2008 4,376 4% 2,191 3%
2008-2009 4,358 0% 1,900 -13%
2009-2010 4,742 9% 2,072 9%
2010-2011 4,003 -16% 2,086 1%
2011-2012 3,346 -16% 1,753 -16%
2012-2013 2,614 -22% 1,371 -22%
At a Glance:
Admissions Total: 2,614 Year-over-Year Change: -22%
Graduates Total: 1,371 Year-over-Year Change: -22%
The number of new students who were admitted into Virginia’s PN programs and the number of enrolled students who graduated from these programs both declined by 22%
during the 2012-2013 academic year. This decrease is due in part to the decline in the number of PN programs that operated in the state, which fell from 72 to 59 this year.
Source: Va. Healthcare Workforce Data Center
Licensed Practical Nurse
14
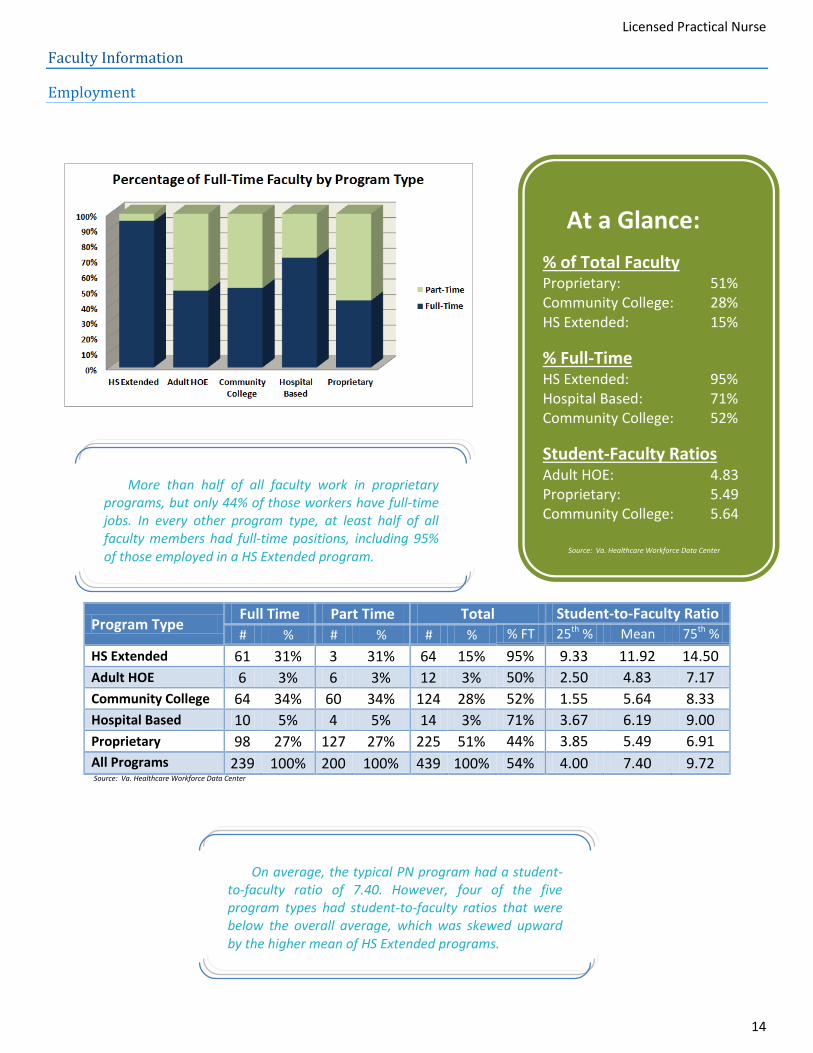
Faculty Information
Employment
Program Type Full Time Part Time Total Student-to-Faculty Ratio
# % # % # % % FT 25th % Mean 75th %
HS Extended 61 31% 3 31% 64 15% 95% 9.33 11.92 14.50
Adult HOE 6 3% 6 3% 12 3% 50% 2.50 4.83 7.17
Community College 64 34% 60 34% 124 28% 52% 1.55 5.64 8.33
Hospital Based 10 5% 4 5% 14 3% 71% 3.67 6.19 9.00
Proprietary 98 27% 127 27% 225 51% 44% 3.85 5.49 6.91
All Programs 239 100% 200 100% 439 100% 54% 4.00 7.40 9.72
At a Glance:
% of Total Faculty Proprietary: 51% Community College: 28% HS Extended: 15%
% Full-Time HS Extended: 95% Hospital Based: 71% Community College: 52%
Student-Faculty Ratios Adult HOE: 4.83 Proprietary: 5.49 Community College: 5.64
Source: Va. Healthcare Workforce Data Center
More than half of all faculty work in proprietary programs, but only 44% of those workers have full-time jobs. In every other program type, at least half of all faculty members had full-time positions, including 95% of those employed in a HS Extended program.
On average, the typical PN program had a student-to-faculty ratio of 7.40. However, four of the five program types had student-to-faculty ratios that were below the overall average, which was skewed upward by the higher mean of HS Extended programs.
Source: Va. Healthcare Workforce Data Center

Licensed Practical Nurse
15
Faculty Demographics
Age Full Time Part Time Total
# % # % # % % FT
Under 25 2 1% 1 1% 3 1% 67%
25 to 34 20 9% 19 10% 39 9% 51%
35 to 44 57 24% 48 24% 105 24% 54%
45 to 54 66 28% 66 34% 132 31% 50%
55 to 64 78 33% 42 21% 120 28% 65%
65 to 74 11 5% 20 10% 31 7% 35%
75 and Over 0 0% 1 1% 1 0% 0%
Total 234 100% 197 100% 431 100% 54%
Race/ Ethnicity Virginia* Full Time Part Time Total
% # % # % # % % FT
White 64% 174 74% 133 67% 307 71% 57%
Black 19% 52 22% 51 26% 103 24% 50%
Asian 6% 3 1% 11 6% 14 3% 21%
Other Race 0% 2 1% 3 2% 5 1% 40%
Two or more races 2% 3 1% 0 0% 3 1% 100%
Hispanic 8% 1 0% 2 1% 3 1% 33%
Total 100% 235 100% 200 100% 435 100% 54% *Population data in this chart is from the US Census, ACS 1-yr estimates, 2011 vintage.
Gender Full Time Part Time Total
# % # % # % % FT
Male 10 4% 13 7% 23 5% 43%
Female 220 96% 187 93% 407 95% 54%
Total 230 100% 200 100% 430 100% 53%
A typical faculty member would be a female between the ages of 45 and 54.
Slightly more than half of all faculty members held full-time positions.
Source: Va. Healthcare Workforce Data Center
At a Glance:
Gender % Female: 95% % Female w/ FT Job: 54%
Age % Under 35: 10% % Over 54: 35%
Diversity Diversity Index (Total): 44% Diversity Index (FT Jobs): 40%
Source: Va. Healthcare Workforce Data Center
Source: Va. Healthcare Workforce Data Center
Source: Va. Healthcare Workforce Data Center
In a chance encounter between two faculty members, there is a 44% chance that they would be of a different race/ethnicity (a measure known as the Diversity Index). For Virginia’s population as a whole, the comparable number is 54%.
Source: Va. Healthcare Workforce Data Center

Licensed Practical Nurse
16
Faculty Educational Background
A Closer Look:
Highest Degree
Full Time Part Time Total
# % # % # % % FT
RN Diploma 3 2% 6 3% 9 2% 33%
ASN 4 2% 8 4% 12 3% 33% Non-Nursing Bachelors
17 8% 33 17% 50 13% 34%
BSN 81 40% 73 38% 154 39% 53% Non-Nursing Masters
11 5% 16 8% 27 7% 41%
Masters in Nursing
81 40% 53 28% 134 34% 60%
Doctorate 4 2% 3 2% 7 2% 57%
Total 201 100% 192 100% 393 100% 51%
Source: Va. Healthcare Workforce Data Center
At a Glance:
Degree BSN: 39% Masters in Nursing: 34% Non-Nursing Bachelors: 13%
Full-Time Employment Masters in Nursing: 60% Doctorate: 57% BSN: 53%
More than 70% of all faculty members held either a BSN or a Masters in Nursing as their
highest professional degree. Of this group, 56% were employed on a full-time basis.
Source: Va. Healthcare Workforce Data Center

Licensed Practical Nurse
17
Faculty Appointments and Resignations
Full-Time Faculty Program Type
HS Extended
Adult HOE
Community College
Hospital Based
Proprietary All
Programs
Total 61 6 64 10 98 239
Newly Appointed 13 3 4 0 27 47
Resignations 14 4 1 0 29 48
Turnover Rate 23% 67% 2% 0% 30% 20%
Proportion Newly Appointed 21% 50% 6% 0% 28% 20%
At a Glance:
Full-Time Faculty Turnover Rate: 20% Newly Appointed Rate: 20%
Turnover Rate Adult HOE: 67% Proprietary: 30% HS Extended: 23%
Among full-time faculty, Virginia’s PN Programs experienced both a 20% turnover rate and a newly appointed faculty rate of 20% over
the past year.
Source: Va. Healthcare Workforce Data Center

Licensed Practical Nurse
18
Future Faculty Requirements
Adequate Faculty Budget?
Full Time Part Time
# % # %
Yes 54 93% 46 96%
No 4 7% 2 4%
Total 58 100% 48 100%
Program Type Next Year’s Expectation for Full-Time Faculty Disruption
Expect Less % Expect Same % Expect More % Total %
HS Extended 6 35% 6 35% 5 29% 17 100%
Adult HOE 2 100% 0 0% 0 0% 2 100%
Community College 5 26% 12 63% 2 11% 19 100%
Hospital 2 67% 1 33% 0 0% 3 100%
Proprietary 8 50% 7 44% 1 6% 16 100%
All Programs 23 40% 26 46% 8 14% 57 100%
At a Glance:
Budget Adequacy Full-Time Hiring: 93% Part-Time Hiring: 96%
Expected Job Disruption Less: 40% Same: 46% More: 14%
Source: Va. Healthcare Workforce Data Center
Source: Va. Healthcare Workforce Data Center
A total of 19 full-time faculty positions and 10 part-time faculty positions are currently in
active recruitment. Most of these jobs are needed in Proprietary programs.
Only 14% of Virginia’s PN programs expect more employment disruption among full-time faculty over the course of the next year. In addition, most programs currently
have a budget of sufficient size to adequately meet their faculty needs.

Registered Nurse
19
Registered Nursing Education Programs
Program Structure
A Closer Look:
Program Type Type # %
Associate 45 57%
Baccalaureate 22 28%
Diploma 4 5%
Accelerated Baccalaureate 3 4%
Associate Online 3 4%
Accelerated Masters 2 3%
Total 79 100%
Program Length, Months
Program Type Mean Min 25th % 75th % Max
Diploma 25 20 21 29 33
Associate 21 15 20 24 36+
Associate Online 25 15 15 35 35
Baccalaureate 30 16 24 36+ 36+
Accelerated Baccalaureate 16 15 15 16 16
Accelerated Masters 22 20 20 24 24
All Programs 24 15 20 27 36+
At a Glance:
Program Type Associate: 57% Baccalaureate: 28% Diploma: 5%
Delivery Method Semester: 89% Quarters: 9% Trimesters: 3%
Mean Program Length Associate: 21 Mos. Baccalaureate: 30 Mos. Diploma: 25 Mos.
There were 79 Registered Nursing (RN) Education Programs
approved in Virginia during the 2012-2013 academic year. 24 of
these programs offer a RN-to-BSN option to their students in addition
to their pre-licensure program.
Source: Va. Healthcare Workforce Data Center
Source: Va. Healthcare Workforce Data Center

Registered Nurse
20
Program Details
Scheduling Option # %
Daytime Courses 78 99%
Evening Courses 25 32%
Online Courses 23 29%
Evening & Weekend Courses 16 20%
Accelerated Courses 10 13%
Weekend Courses 1 1%
Accreditation Accrediting Agency Abbv. # %
Southern Association of Colleges and Schools SACS 46 58%
National League for Nursing Accreditation Commission NLNAC 27 34%
Commission on Collegiate Nursing Education CCNE 24 30%
Accrediting Council for Independent Colleges and Schools ACICS 11 14%
Accrediting Bureau of Health Education Schools ABHES 6 8%
Council on Occupational Education COE 2 3%
The Higher Learning Commission HLC 1 1%
Middle States Commission on Higher Education MSCHE 1 1%
At a Glance:
Schedule Options Daytime Courses: 99% Evening Courses: 52% Online Courses: 29% Weekend Courses: 22%
Admissions Frequency (Annual) One: 43% Two: 38% Three: 12% Four or More: 8%
Source: Va. Healthcare Workforce Data Center
More than one-quarter of all RN programs implemented a change to their
nursing program in the past year. Many changes relate to either the curriculum or
scheduling. In addition, five programs are in the process of closing their programs.

Registered Nurse
21
Clinical Hours
Clinical Experiences Outside Virginia State # of Programs % of Programs
Washington, D.C. 16 20%
Maryland 7 9%
North Carolina 3 8%
Tennessee 2 3%
West Virginia 2 3%
Kentucky 1 1%
Other 2 3%
All Programs 23 29%
At a Glance:
Median Clinical Hours Clinical Experience: 576-600 Direct Client Care: 501-525 Direct Client Care in Va.: 540 Clinical Simulation: 26-50 Clinical Observation: 1-25
Source: Va. Healthcare Workforce Data Center
More than half of all RN programs in Virginia required at least of 576 total hours of clinical experience from their students. Pursuant to 18VAC 90-20-120.E, Virginia’s RN programs are required to provide 500 hours of direct
client care, of which 20% may be simulated.
23 programs offered clinical experience hours outside of Virginia.
Washington, D.C. and Maryland were the two states in which clinical experience hours were most likely to
be provided.
Registered Nurse
22
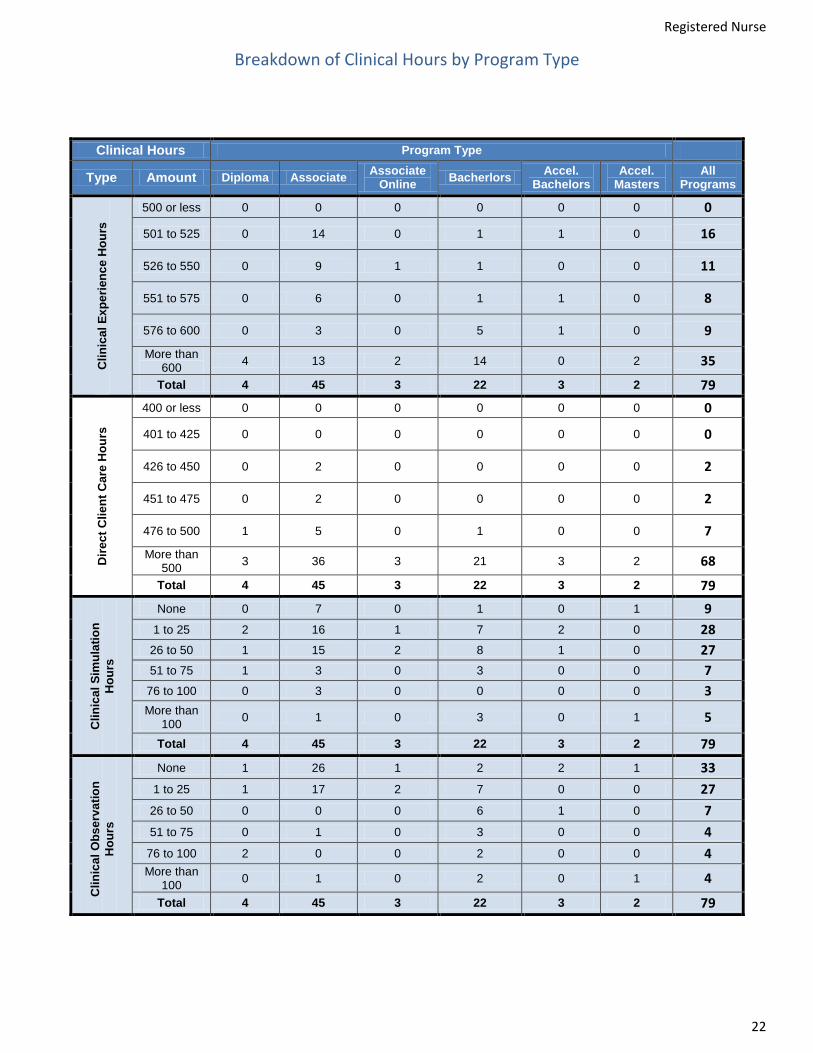
Breakdown of Clinical Hours by Program Type
Clinical Hours Program Type
Type Amount Diploma Associate Associate
Online Bacherlors
Accel. Bachelors
Accel. Masters
All Programs
Cli
nic
al
Ex
pe
rien
ce
Ho
urs
500 or less 0 0 0 0 0 0 0
501 to 525 0 14 0 1 1 0 16
526 to 550 0 9 1 1 0 0 11
551 to 575 0 6 0 1 1 0 8
576 to 600 0 3 0 5 1 0 9
More than 600
4 13 2 14 0 2 35
Total 4 45 3 22 3 2 79
Dir
ec
t C
lie
nt
Care
Ho
urs
400 or less 0 0 0 0 0 0 0
401 to 425 0 0 0 0 0 0 0
426 to 450 0 2 0 0 0 0 2
451 to 475 0 2 0 0 0 0 2
476 to 500 1 5 0 1 0 0 7
More than 500
3 36 3 21 3 2 68
Total 4 45 3 22 3 2 79
Clin
ica
l S
imu
lati
on
Ho
urs
None 0 7 0 1 0 1 9
1 to 25 2 16 1 7 2 0 28
26 to 50 1 15 2 8 1 0 27
51 to 75 1 3 0 3 0 0 7
76 to 100 0 3 0 0 0 0 3
More than 100
0 1 0 3 0 1 5
Total 4 45 3 22 3 2 79
Cli
nic
al
Ob
se
rva
tio
n
Ho
urs
None 1 26 1 2 2 1 33
1 to 25 1 17 2 7 0 0 27
26 to 50 0 0 0 6 1 0 7
51 to 75 0 1 0 3 0 0 4
76 to 100 2 0 0 2 0 0 4 More than
100 0 1 0 2 0 1 4
Total 4 45 3 22 3 2 79

Registered Nurse
23
Student Information
Admissions
Program Type Applications
Received Applicants Qualified
% Qualified
Applicants Admitted
% of Qualified Admitted
Applicants Enrolled
% of Admitted Enrolled
% of Applicants Enrolled
Diploma 160 101 63% 96 95% 87 91% 54%
Associate 8,188 4,535 55% 3,384 75% 3,108 92% 38%
Assoc. Online 250 191 76% 131 69% 130 99% 52%
Bachelors 6,745 4,519 67% 3,077 68% 2,159 70% 32%
Accel. Bachelors 682 411 60% 377 92% 219 58% 32%
Accel. Masters 123 70 57% 50 71% 36 72% 29%
All Programs 16,148 9,827 61% 7,115 72% 5,739 81% 36%
At a Glance:
Program Applicants Total: 16,148 Qualified: 9,827 Admitted: 7,115 Enrolled: 5,739 Waitlisted: 805
Virginia’s RN programs received a total of 16,148 student applications during the 2012-2013 academic year. Approximately
36% of these applications ultimately resulted in an enrolled student.
Out of 9,827 qualified applications, 2,712 were still not given an offer of admission. 15 programs cited the inability to expand effective
program capacity as the main reason for failing to admit qualified applicants, while 14 programs cited the lack of clinical space. The lack
of qualified faculty and student finances were also common reasons for failing to admit qualified applicants.
Source: Va. Healthcare Workforce Data Center
Registered Nurse
24
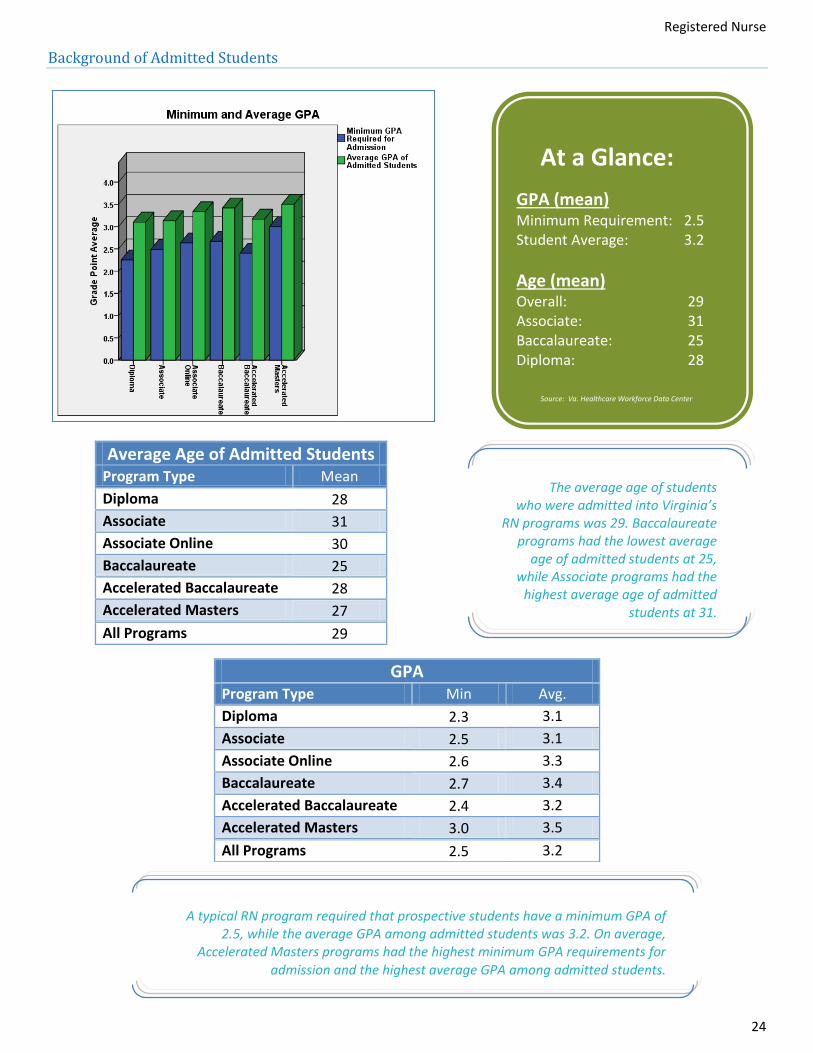
Background of Admitted Students
GPA Program Type Min Avg.
Diploma 2.3 3.1
Associate 2.5 3.1
Associate Online 2.6 3.3
Baccalaureate 2.7 3.4
Accelerated Baccalaureate 2.4 3.2
Accelerated Masters 3.0 3.5
All Programs 2.5 3.2
Average Age of Admitted Students Program Type Mean
Diploma 28
Associate 31
Associate Online 30
Baccalaureate 25
Accelerated Baccalaureate 28
Accelerated Masters 27
All Programs 29
At a Glance:
GPA (mean) Minimum Requirement: 2.5 Student Average: 3.2
Age (mean) Overall: 29 Associate: 31 Baccalaureate: 25 Diploma: 28
The average age of students who were admitted into Virginia’s
RN programs was 29. Baccalaureate programs had the lowest average
age of admitted students at 25, while Associate programs had the
highest average age of admitted students at 31.
A typical RN program required that prospective students have a minimum GPA of 2.5, while the average GPA among admitted students was 3.2. On average,
Accelerated Masters programs had the highest minimum GPA requirements for admission and the highest average GPA among admitted students.
Source: Va. Healthcare Workforce Data Center Source: Va. Healthcare Workforce Data Center

Registered Nurse
25
Capacity
Program Type
# of Programs with Unfilled Spaces
# of Unfilled Spaces
No Yes Unfilled Spaces
% Total
Spaces % of Total Capacity
Diploma 3 1 0 0% 84 0%
Associate 21 23 232 66% 3,194 7%
Associate Online 2 1 22 6% 262 8%
Baccalaureate 10 12 96 27% 2,192 4%
Accelerated Baccalaureate 2 0 0 0% 86 0%
Accelerated Masters 1 0 0 0% 32 0%
All Programs 39 37 350 100% 5,850 6%
At a Glance:
1st-Year Student Capacity Spaces Available: 5,850 Spaces Unfilled: 350
Unfilled Capacity % of Programs: 47% % of Total Capacity: 6%
Virginia’s RN programs were able to utilize 94% of its available first-year student capacity. Programs provided a variety of reasons for explaining the cause of unfilled spaces. One of the most
common explanations was the lack of qualified applicants. Many programs also had admitted students who chose not to enroll and enrolled students who either failed to show up or dropped out soon after classes started. Some of these students went to other programs, while others chose not to attend any
program because of financial or other personal difficulties.
Source: Va. Healthcare Workforce Data Center

Registered Nurse
26
Enrollment
Program Type
Total Enrollment LPN Enrollment Male Enrollment
Count % Count % Count %
Diploma 152 2% 22 3% 5 1%
Associate 4,519 46% 654 81% 495 55%
Associate Online 166 2% 4 1% 12 1%
Baccalaureate 4,612 47% 115 14% 354 39%
Accelerated Baccalaureate 323 3% 11 1% 31 3%
Accelerated Masters 83 1% 0 0% 7 1%
All Programs 9,855 100% 806 100% 904 100%
At a Glance:
Enrollment Total: 9,855 LPN: 806 Male: 904
Enrollment by Type Baccalaureate: 47% Associate: 46% Accel. Baccalaureate: 3%
Source: Va. Healthcare Workforce Data Center
Nearly 10,000 students were enrolled in Virginia’s RN programs during the current academic year. 8% of these students are LPNs, while 9% of enrolled students are male.
Registered Nurse
27
Attrition
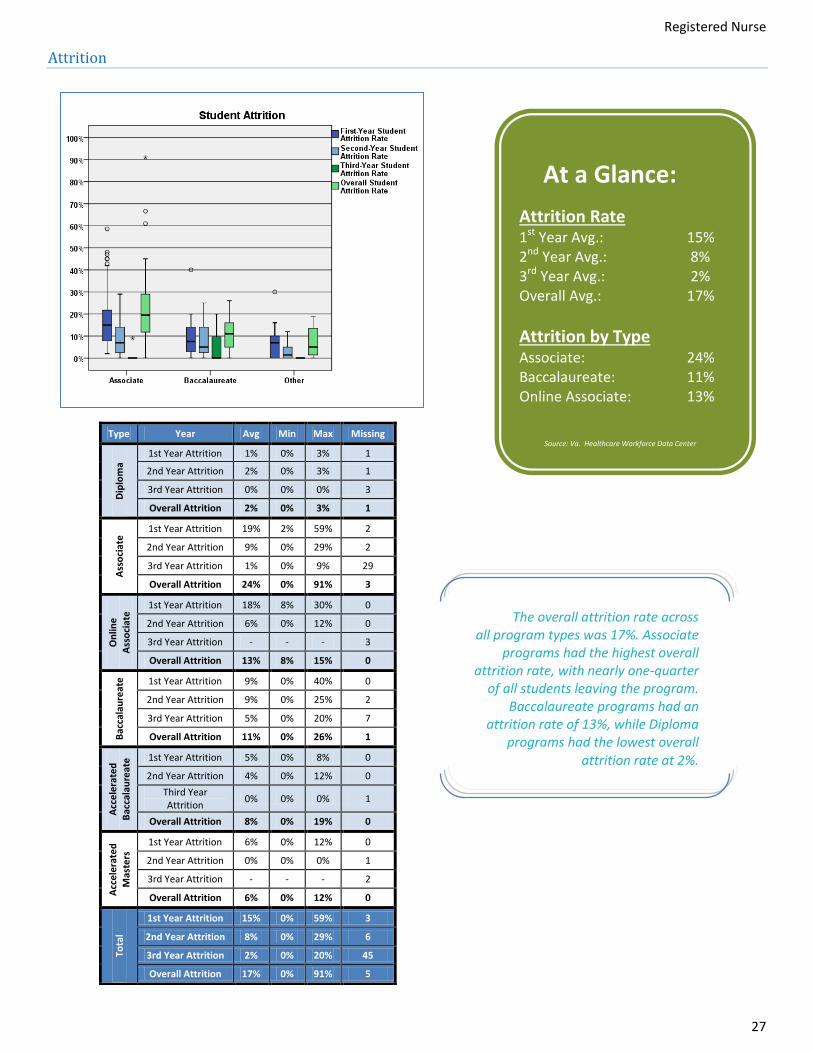
Type Year Avg Min Max Missing
Dip
lom
a
1st Year Attrition 1% 0% 3% 1
2nd Year Attrition 2% 0% 3% 1
3rd Year Attrition 0% 0% 0% 3
Overall Attrition 2% 0% 3% 1
Ass
oci
ate
1st Year Attrition 19% 2% 59% 2
2nd Year Attrition 9% 0% 29% 2
3rd Year Attrition 1% 0% 9% 29
Overall Attrition 24% 0% 91% 3
On
line
A
sso
ciat
e
1st Year Attrition 18% 8% 30% 0
2nd Year Attrition 6% 0% 12% 0
3rd Year Attrition - - - 3
Overall Attrition 13% 8% 15% 0
Bac
cala
ure
ate 1st Year Attrition 9% 0% 40% 0
2nd Year Attrition 9% 0% 25% 2
3rd Year Attrition 5% 0% 20% 7
Overall Attrition 11% 0% 26% 1
Acc
ele
rate
d
Bac
cala
ure
ate 1st Year Attrition 5% 0% 8% 0
2nd Year Attrition 4% 0% 12% 0
Third Year Attrition
0% 0% 0% 1
Overall Attrition 8% 0% 19% 0
Acc
ele
rate
d
Mas
ters
1st Year Attrition 6% 0% 12% 0
2nd Year Attrition 0% 0% 0% 1
3rd Year Attrition - - - 2
Overall Attrition 6% 0% 12% 0
Tota
l
1st Year Attrition 15% 0% 59% 3
2nd Year Attrition 8% 0% 29% 6
3rd Year Attrition 2% 0% 20% 45
Overall Attrition 17% 0% 91% 5
At a Glance:
Attrition Rate 1st Year Avg.: 15% 2nd Year Avg.: 8% 3rd Year Avg.: 2% Overall Avg.: 17%
Attrition by Type Associate: 24% Baccalaureate: 11% Online Associate: 13%
Source: Va. Healthcare Workforce Data Center
The overall attrition rate across all program types was 17%. Associate
programs had the highest overall attrition rate, with nearly one-quarter
of all students leaving the program. Baccalaureate programs had an
attrition rate of 13%, while Diploma programs had the lowest overall
attrition rate at 2%.

Registered Nurse
28
Graduates
Program Type
Total Graduates LPN Graduates Male Graduates
Count % Count % Count %
Diploma 172 5% 18 4% 14 4%
Associate 2,023 53% 403 87% 186 53%
Associate Online 104 3% 4 1% 9 3%
Baccalaureate 1,325 35% 27 6% 117 33%
Accelerated Baccalaureate 182 5% 13 3% 23 7%
Accelerated Masters 39 1% 0 0% 5 1%
All Programs 3,845 100% 465 100% 354 100%
At a Glance:
Graduates Total: 3,845 % LPN: 12% % Male: 9%
Grad. by Program Type Associate: 53% Baccalaureate: 35% Accel. Baccalaureate: 5%
Source: Va. Healthcare Workforce Data Center
A total of 3,845 students graduated from Virginia’s RN programs during the current academic year. 12% of these graduates were LPN students, while 9% were
male. More than half of all graduating students came from Associate programs.

Registered Nurse
29
Background of Graduates
Race/ Ethnicity Diploma Associate
Associate Online
BSN Accel. BSN Accel.
Masters All Programs
# % # % # % # % # % # % # %
White 98 86% 1,294 70% 48 74% 936 71% 99 54% 32 82% 2,507 70%
Black 14 12% 384 21% 9 14% 116 9% 42 23% 0 0% 565 16%
Hispanic 0 0% 58 3% 4 6% 37 3% 10 5% 1 3% 110 3%
Asian 0 0% 72 4% 3 5% 84 6% 12 7% 3 8% 174 5%
American Indian 0 0% 2 0% 0 0% 4 0% 1 1% 0 0% 7 0%
Pacific Islander 2 2% 18 1% 1 2% 7 1% 1 1% 0 0% 29 1%
Two or More 0 0% 15 1% 0 0% 21 2% 5 3% 0 0% 41 1%
Unknown 0 0% 3 0% 0 0% 110 8% 12 7% 3 8% 128 4%
Total 114 100% 1,846 100% 65 100% 1,315 100% 182 100% 39 100% 3,561 100%
Program Type Multi-
Degree Graduates
% % of Total Graduates
Diploma 61 7% 2%
Associate 294 34% 8%
Associate Online 14 2% 0%
Baccalaureate 292 34% 8%
Accel. Baccalaureate 169 19% 4%
Accel. Masters 39 5% 1%
All Programs 869 100% 23%
At a Glance:
Race/Ethnicity White: 70% Black: 16% Asian: 5% Hispanic: 3%
Multi-Degree Grads. Multi-Degree Graduates: 869 % of Total Graduates: 23%
Source: Va. Healthcare Workforce Data Center
70% of all graduates from Virginia’s RN programs are non-Hispanic White, while 16% of all
graduates are non-Hispanic Black.

Registered Nurse
30
Long-Term Trends
Academic Year RN Admissions RN Graduates
Count Year-over-Year Change Count Year-over-Year Change
2003-2004 3,695 - 2,328 -
2004-2005 4,724 28% 2,912 25%
2005-2006 4,528 -4% 2,909 0%
2006-2007 4,671 3% 3,265 12%
2007-2008 4,799 3% 3,228 -1%
2008-2009 6,526 36% 3,536 10%
2009-2010 7,338 12% 3,698 5%
2010-2011 6,898 -6% 3,788 2%
2011-2012 6,562 -5% 3,660 -3%
2012-2013 7,115 8% 3,845 5%
At a Glance:
Admissions Total: 7,115 Year-over-Year Change: 8%
Graduates Total: 3,845 Year-over-Year Change: 5%
Source: Va. Healthcare Workforce Data Center
Virginia’s RN programs increased their admissions by 8% during the academic year, while the number of graduates increased by 5%. Both the number of admissions to and graduates from Virginia’s RN programs grew at their fastest rates since the 2009-2010 academic year.

Registered Nurse
31
Faculty Information
Employment
Program Type Full Time Part Time Total
Student-to-Faculty Ratio
# % # % # % % FT 25th % Mean 75th %
Diploma 22 2% 6 1% 28 1% 79% 0.0 3.8 7.6
Associate 306 33% 361 34% 667 34% 46% 3.4 6.4 8.8
Associate Online 46 5% 49 5% 95 5% 48% 0.8 2.1 3.6
Baccalaureate 437 48% 503 48% 940 48% 46% 3.1 6.7 10.1
Accelerated Baccalaureate 63 7% 55 5% 118 6% 53% 1.7 2.5 3.7
Accelerated Masters 44 5% 85 8% 129 7% 34% 0.1 0.1 0.1
All Programs 918 100% 1,059 100% 1,977 100% 46% 3.1 6.0 8.3
At a Glance:
% of Total Faculty Baccalaureate: 48% Associate: 34% Accel. Masters: 7%
% Full-Time Overall: 46% Diploma: 79% Accel. Baccalaureate: 53%
Student-Faculty Ratios Overall: 6.0 Baccalaureate: 6.7 Associate: 6.4
Source: Va. Healthcare Workforce Data Center
Nearly half of all RN program faculty work at Baccalaureate programs, while more than one-third work for Associate programs. In total, Virginia’s RN programs employed 1,977 faculty members, 46% of whom are full-time workers.
On average, the typical RN program had a student-to-faculty ratio of 6.0. Baccalaureate programs had an average student-to-faculty ratio of 6.7, while Associate programs had an average student-to-faculty ratio of 6.4.
Source: Va. Healthcare Workforce Data Center

Registered Nurse
32
Faculty Demographics
Age Full Time Part Time Total
# % # % # % % FT
Under 25 0 0% 1 0% 1 0% 0%
25 to 34 49 7% 101 16% 150 11% 33%
35 to 44 139 20% 148 24% 287 22% 48%
45 to 54 188 28% 184 29% 372 28% 51%
55 to 64 265 39% 140 22% 405 31% 65%
65 to 74 37 5% 53 8% 90 7% 41%
75 and Over 2 0% 2 0% 4 0% 50%
All Programs 680 100% 629 100% 1,309 100% 52%
Race/ Ethnicity Virginia* Full Time Part Time Total
% # % # % # % % FT
White 64% 675 84% 654 84% 1,329 84% 51%
Black 19% 104 13% 106 14% 210 13% 50%
Asian 6% 15 2% 8 1% 23 1% 65%
Other Race 0% 2 0% 2 0% 4 0% 50%
Two or more races 2% 1 0% 2 0% 3 0% 33%
Hispanic 8% 6 1% 10 1% 16 1% 38%
Total 100% 803 100% 782 100% 1,585 100% 51% *Population data in this chart is from the US Census, ACS 1-yr estimates, 2011 vintage.
Gender Full Time Part Time Total
# % # % # % % FT
Male 24 3% 40 4% 64 4% 38%
Female 785 97% 849 96% 1,634 96% 48%
Total 809 100% 889 100% 1,698 100% 48%
96% of all faculty are female, and nearly 60% are between the ages of 45
and 64. In addition, nearly half of all faculty currently hold full-time jobs.
Source: Va. Healthcare Workforce Data Center
At a Glance:
Gender % Female: 96% % Female w/ FT Job: 48%
Age % Under 35: 12% % Over 54: 38%
Diversity Diversity Index (Total): 28% Diversity Index (FT Jobs): 28%
Source: Va. Healthcare Workforce Data Center
Source: Va. Healthcare Workforce Data Center
Source: Va. Healthcare Workforce Data Center
In a chance encounter between two faculty members, there is a 28% chance that they would be of a different race/ethnicity (a measure known as the Diversity Index). For Virginia’s population as a whole, the comparable number is 54%. Source: Va. Healthcare Workforce Data Center

Registered Nurse
33
Faculty Educational Background
A Closer Look:
Highest Degree
Full Time Part Time Total
# % # % # % % FT
RN Diploma 0 0% 1 0% 1 0% 0%
ASN 0 0% 3 0% 3 0% 0% Non-Nursing Bachelors
0 0% 3 0% 3 0% 0%
BSN 15 2% 179 24% 194 14% 8% Non-Nursing Masters
20 3% 16 2% 36 3% 56%
Masters in Nursing
416 61% 418 56% 834 58% 50%
Non-Nursing Doctorate
20 3% 14 2% 34 2% 59%
Doctorate 207 31% 115 15% 322 23% 64%
Total 678 100% 749 100% 1,427 100% 48%
At a Glance:
Degree MSN: 58% Doctorate: 23% BSN: 14%
Full-Time Employment Overall: 48% Doctorate: 64% Non-Nursing Doctorate: 59% Non-Nursing Masters: 56%
Nearly 60% of all faculty members held a MSN as their highest professional degree, while nearly one-quarter held a
doctorate. Among all faculty, approximately half were employed on a full-time basis.
Source: Va. Healthcare Workforce Data Center

Registered Nurse
34
Faculty Appointments and Resignations
Full-Time Faculty Program Type
Diploma ASN Online ASN BSN Accel. BSN Accel. Masters All Programs
Total 22 306 46 437 63 44 918
Newly Appointed 3 60 8 67 6 15 159
Resignations 4 46 5 39 5 6 105
Turnover Rate 18% 15% 11% 9% 8% 14% 11%
Proportion Newly Appointed 14% 20% 17% 15% 10% 34% 17%
At a Glance:
Full-Time Faculty Turnover Rate: 11% Newly Appointed Rate: 17%
Turnover Rate Associate: 15% Baccalaureate: 9% Accelerated BSN: 8%
Among full-time faculty, Virginia’s RN programs experienced both an 11% turnover
rate and a newly appointed faculty rate of 17% over the past year.
Source: Va. Healthcare Workforce Data Center

Registered Nurse
35
Future Faculty Requirements
Adequate Faculty Budget?
Full Time Part Time
# % # %
Yes 65 93% 64 94%
No 5 7% 4 6%
Total 70 100% 68 100%
Program Type Next Year’s Expectation for Full-Time Faculty Disruption
Expect Less % Expect Same % Expect More % Total %
RN Diploma 0 0% 2 100% 0 0% 2 100%
Associate 25 61% 15 37% 1 2% 41 100%
Associate Online 2 67% 1 33% 0 0% 3 100%
Baccalaureate 6 32% 12 63% 1 5% 19 100%
Accelerated Baccalaureate 1 33% 2 67% 0 0% 3 100%
Accelerated Masters 1 100% 0 0% 0 0% 1 100%
All Programs 35 51% 32 46% 2 3% 69 100%
At a Glance:
Active Recruitment % of FT Vacancies: 69% % of PT Vacancies: 92%
Budget Adequacy Full-Time Hiring: 93% Part-Time Hiring: 94%
Expected Job Disruption Less: 51% Same: 46% More: 3%
Source: Va. Healthcare Workforce Data Center
Source: Va. Healthcare Workforce Data Center
A total of 61 full-time faculty positions and 12 part-time faculty positions are currently in active recruitment. Most of the full-time jobs are needed in Baccalaureate programs, while most of the part-jobs are needed in Associate
Degree programs.
Only 3% of Virginia’s RN programs expect more employment disruption among full-time faculty over the course of the next year. In addition, most programs currently have a budget
of sufficient size to adequately meet both their full-time and part-time faculty needs.

Registered Nurse
36