Embed Size (px)
Citation preview
Wise County
Virginia
703 East Main Street • Richmond, Virginia 23219Tel: (804) 786-8223 • www.VirginiaLMI.com
Virginia Employment Commission
Last updated: 6/28/2018 2:48:40 AM
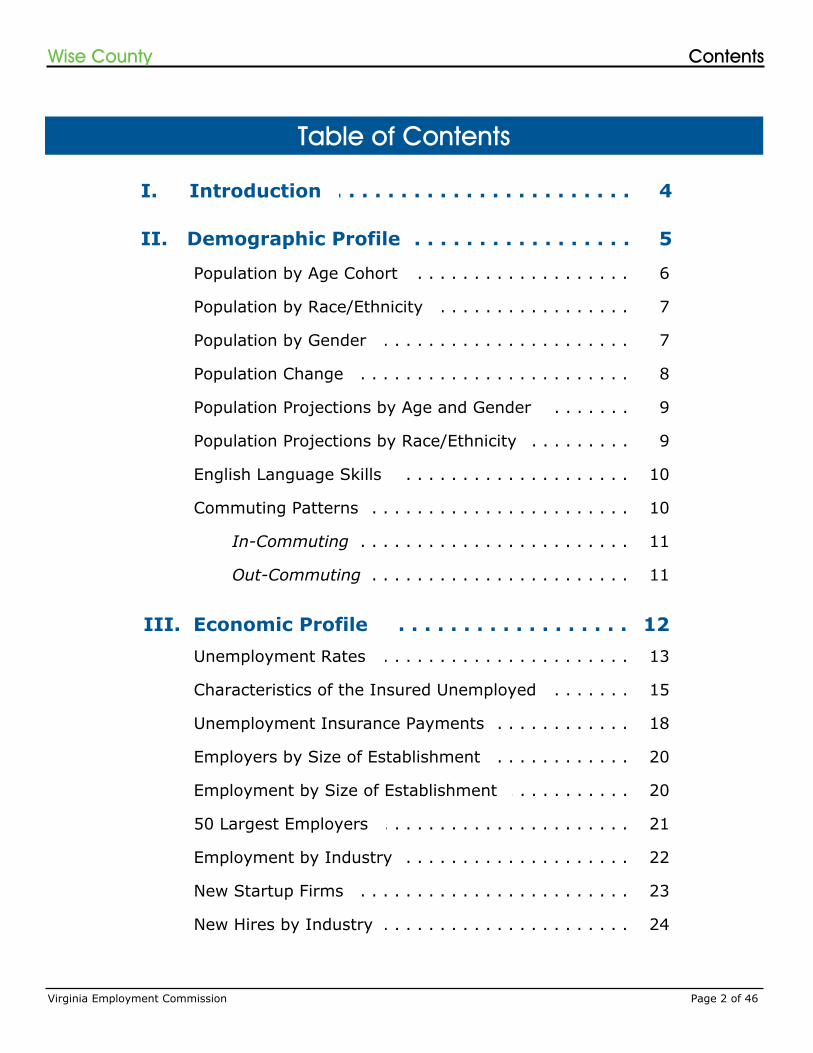
Table of Contents
I. Introduction
II. Demographic Profile
Population by Age Cohort
Population by Race/Ethnicity
Population by Gender
Population Change
Population Projections by Age and Gender
English Language Skills
Commuting Patterns
III. Economic ProfileUnemployment Rates
Employers by Size of Establishment
Employment by Size of Establishment
Employment by Industry
New Hires by Industry
Characteristics of the Insured Unemployed
50 Largest Employers
In-Commuting
Out-Commuting
Unemployment Insurance Payments
. . . . . . . . . . . . . . . . . . .
. . . . . . . . . . . . . . . . . . . . . . . . . . . . . . . . . . . . . . . . . . . . . . . . . . . . .
. . . . . . . . . . . . . . . . . . . . . . . . . . . . . . . . . . . . . . . . . . . .
. . . . . . . . . . . . . . . . . . . . . . . .
. . . . . . . . . . . . . . . . . . . . . . . . . . . . . . . . . . . . . .
. . . . . . . . . . . . . . . . . . . . . . . . . . . . . . . . . . . . . . . . . .
. . . . . . . . . . . . . . . . . . . . . . . . . . . . . . . . . . . . . . . . . . . . . .
. . . . . . . . . . . . . . . . . . . . . . . .
. . . . . . . . . . . . . . . . . . . . . . . . . . . . . . . . . . . . . . . . . . . . . . . . . . . . . . . . . . . . . . . . . . . . . .
. . . . . . . . . . . . . . . . . . . . . . . . . . . . . . . . . . . . . . . . . . . . . .
. . . . . . . . . . . . . . . . .
. . . . . . . . . . . . . . . . .
. . . . . . . . . . . . . . . . . .
. . . . . . . . . . . . . . . . . . . . . . . . . . . . . . . . . . . . . . . . . . . . . . . . . . . . . . . . . . . . . .
. . . . . . . . . . . .
. . . . . . . . . . . . . . . . . . . . . . . . . . . . . . . . . .
. . . . . . . . . . . . . . . . . . . . . . . . . . . . . . . . . . . . . . . .
. . . . . . . . . . . . . . . . . . . . . . . . . . . . . . . . . . . . . . . . . . . .
. . . . . . . . . . . . . . . . . . . . . . . . . . . . . . . . . . . . . . . . . . . .
. . . . . . . . . . . .
. . . . . . . . . . . .
. . . . . . . . . . . . . .
New Startup Firms . . . . . . . . . . . . . . . . . . . . . . . . . . . . . . . . . . . . . . . . . . . . . . . .
10
10
11
11
1213
20
20
22
24
15
21
18
23
6
7
7
8
9
4
5
Population Projections by Race/Ethnicity . . . . . . . . . . . . . . . . . .
9
Virginia Employment Commission Page 2 of 46
ContentsWise County
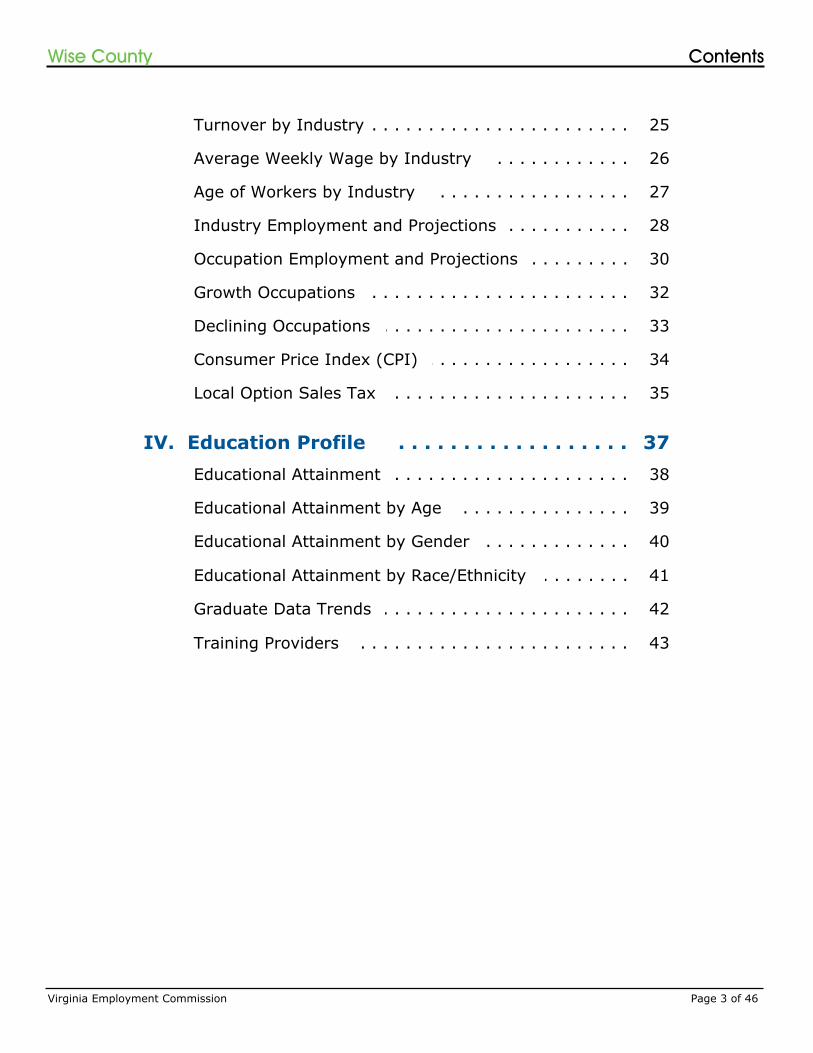
Turnover by Industry
Average Weekly Wage by Industry
Age of Workers by Industry
Industry Employment and Projections
Occupation Employment and Projections
Growth Occupations
Declining Occupations
IV. Education ProfileEducational Attainment
Educational Attainment by Age
Educational Attainment by Gender
. . . . . . . . . . . . . . . . . . . . . . . . . . . . . . . . . . . . . . . . . . . . . .
. . . . . . . . . . . .
. . . . . . . . . . . . . . . . . . . . . . . . . . . . . . . . . . . . . . . . . . . . . .
. . . . . . . . . . . . . . . . . . . . . .
. . . . . . . . . . . . . . . . . . . . . . . . . . . . . . . . . . . . . . . . . . . . . .. . . . . . . . . . . . . . . . . . . . . . . . . . . . . . . . . . . . . . . . . . . .
. . . . . . . . . . . . . . . . . .
. . . . . . . . . . . . . . . . . .
. . . . . . . . . . . . . . . . . . . . . . . . . . . . . . . . . . . . . . . . . . . . . . . . . . . . . . . . . . . .
. . . . . . . . . . . . . . . . . . . . . . . . . . . . . . . .
. . . . . . . . . . . . .
. . . . . . . . . . . . .
Consumer Price Index (CPI) . . . . . . . . . . . . . . . . . . . . . . . . . . . . . . . . . . . .
Local Option Sales Tax . . . . . . . . . . . . . . . . . . . . . . . . . . . . . . . . . . . . . . . . . .
25
26
27
28
30
32
33
38
39
40
37
34
35
Educational Attainment by Race/Ethnicity
Graduate Data Trends
. . . . . . . . . . . . . . . .
. . . . . . . . . . . . . . . . . . . . . . . . . . . . . . . . . . . . . . . . . . . .
41
42
Training Providers . . . . . . . . . . . . . . . . . . . . . . . . . . . . . . . . . . . . . . . . . . . . . . . .
43
Virginia Employment Commission Page 3 of 46
ContentsWise County
This report provides a community profile of Wise County. It is intended to complement the information found in our Virginia Workforce Connection application, which can be accessed online at:
www.VirginiaLMI.com
The report is divided into three major sections. The first contains a profile of regional demographic characteristics and trends, the second supplies similar information for the regional economy, and the third provides a profile of regional education characteristics.
I. Introduction
Virginia Employment Commission Page 4 of 46
IntroductionWise County

II. Demographic Profile
This Demographic Profile provides an in-depth analysis of the population in Wise County. Most of the data is produced by the U.S. Census Bureau, and includes demographic characteristics such as age, race/ethnicity, and gender.
Related Terms and DefinitionsOverview
Ability to speak EnglishFor people who speak a language other than English at home, the response represents the person's own perception of his or her ability to speak English. Because census questionnaires are usually completed by one household member, the responses may represent the perception of another household member.
AgeThe age classification is based on the age of the person in complete years as of April 1, 2010. The age of the person usually was derived from their date of birth information. Their reported age was used only when date of birth information was unavailable.
GenderThe data on gender were derived from answers to a question that was asked of all people. Individuals were asked to mark either "male" or "female" to indicate their gender. For most cases in which gender was not reported, it was determined by the appropriate entry from the person's given (i.e., first) name and household relationship. Otherwise, gender was imputed according to the relationship to the householder and the age of the person.
RaceThe concept of race as used by the Census Bureau reflects self-identification by people according to the race or races with which they most closely identify. The categories are sociopolitical constructs and should not be interpreted as being scientific or anthropological in nature. Furthermore, the race categories include both racial and national-origin groups.
Please note: In the past, our population by race/ethnicity data has always excluded the Hispanic ethnicity from each race category. Starting in January 2013, each race category now includes all ethnicities.
Virginia Employment Commission Page 5 of 46
Demographic ProfileWise County
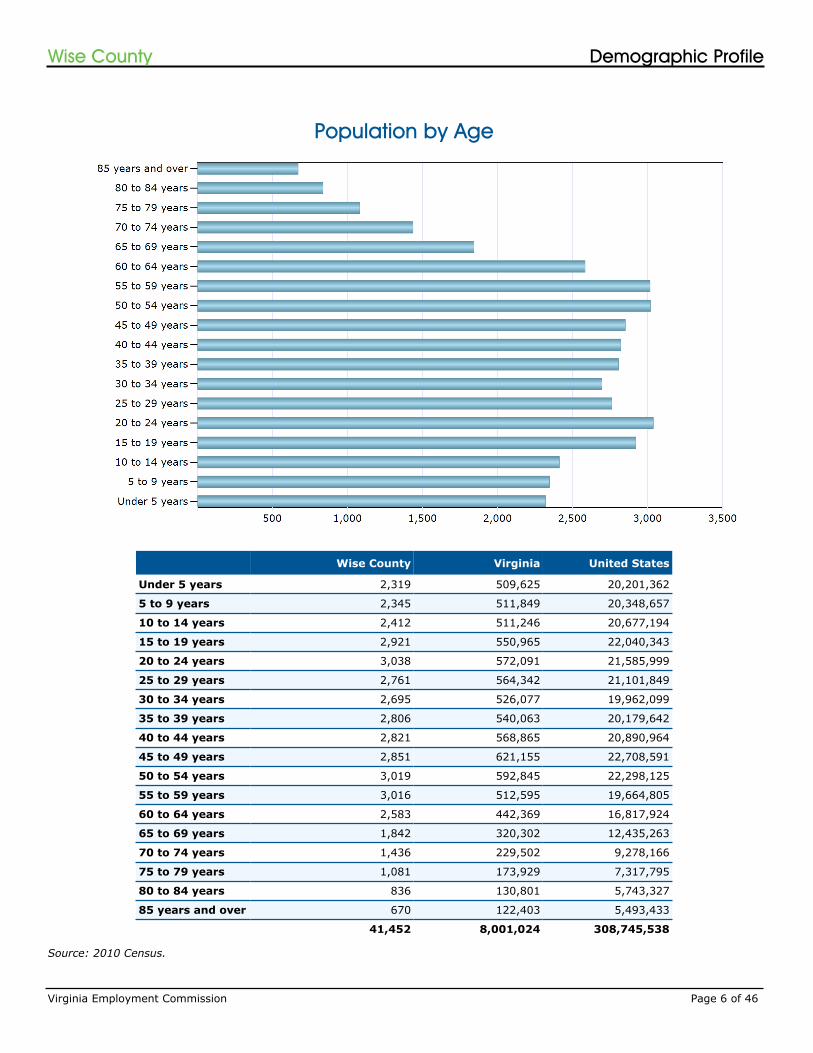
Population by Age
Wise County Virginia United States
Under 5 years 2,319 509,625 20,201,362
5 to 9 years 2,345 511,849 20,348,657
10 to 14 years 2,412 511,246 20,677,194
15 to 19 years 2,921 550,965 22,040,343
20 to 24 years 3,038 572,091 21,585,999
25 to 29 years 2,761 564,342 21,101,849
30 to 34 years 2,695 526,077 19,962,099
35 to 39 years 2,806 540,063 20,179,642
40 to 44 years 2,821 568,865 20,890,964
45 to 49 years 2,851 621,155 22,708,591
50 to 54 years 3,019 592,845 22,298,125
55 to 59 years 3,016 512,595 19,664,805
60 to 64 years 2,583 442,369 16,817,924
65 to 69 years 1,842 320,302 12,435,263
70 to 74 years 1,436 229,502 9,278,166
75 to 79 years 1,081 173,929 7,317,795
80 to 84 years 836 130,801 5,743,327
85 years and over 670 122,403 5,493,433
41,452 8,001,024 308,745,538
Source: 2010 Census.
Virginia Employment Commission Page 6 of 46
Demographic ProfileWise County
Population by Race/Ethnicity
Wise County Virginia United States
Total
Total Population 41,452 8,001,024 308,745,538
Race
White 38,561 5,486,852 223,553,265
Black or African American 2,137 1,551,399 38,929,319
American Indian or Alaska Native 53 29,225 2,932,248
Asian 141 439,890 14,674,252
Native Hawaiian/Pacific Islander 2 5,980 540,013
Other 173 254,278 19,107,368
Multiple Races 385 233,400 9,009,073
Ethnicity
Not Hispanic or Latino (of any race) 40,981 7,369,199 258,267,944
Hispanic or Latino (of any race) 471 631,825 50,477,594
Source: 2010 Census.
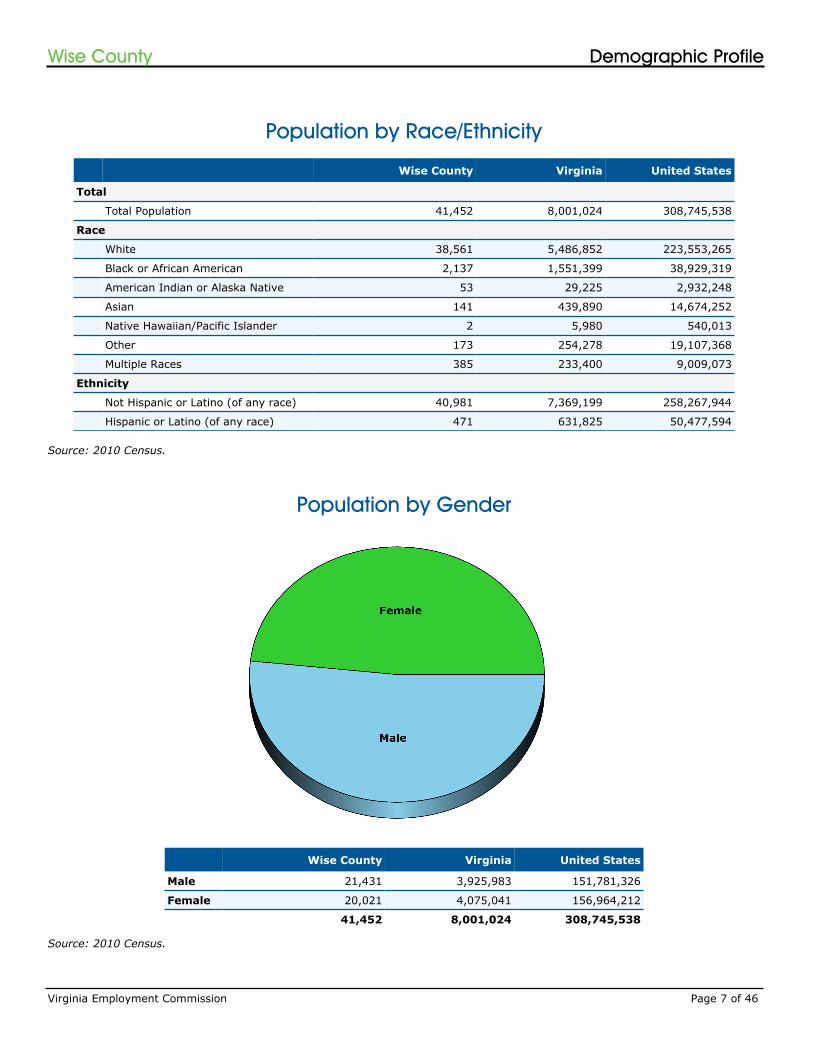
Population by Gender
Wise County Virginia United States
Male 21,431 3,925,983 151,781,326
Female 20,021 4,075,041 156,964,212
41,452 8,001,024 308,745,538
Source: 2010 Census.
Virginia Employment Commission Page 7 of 46
Demographic ProfileWise County
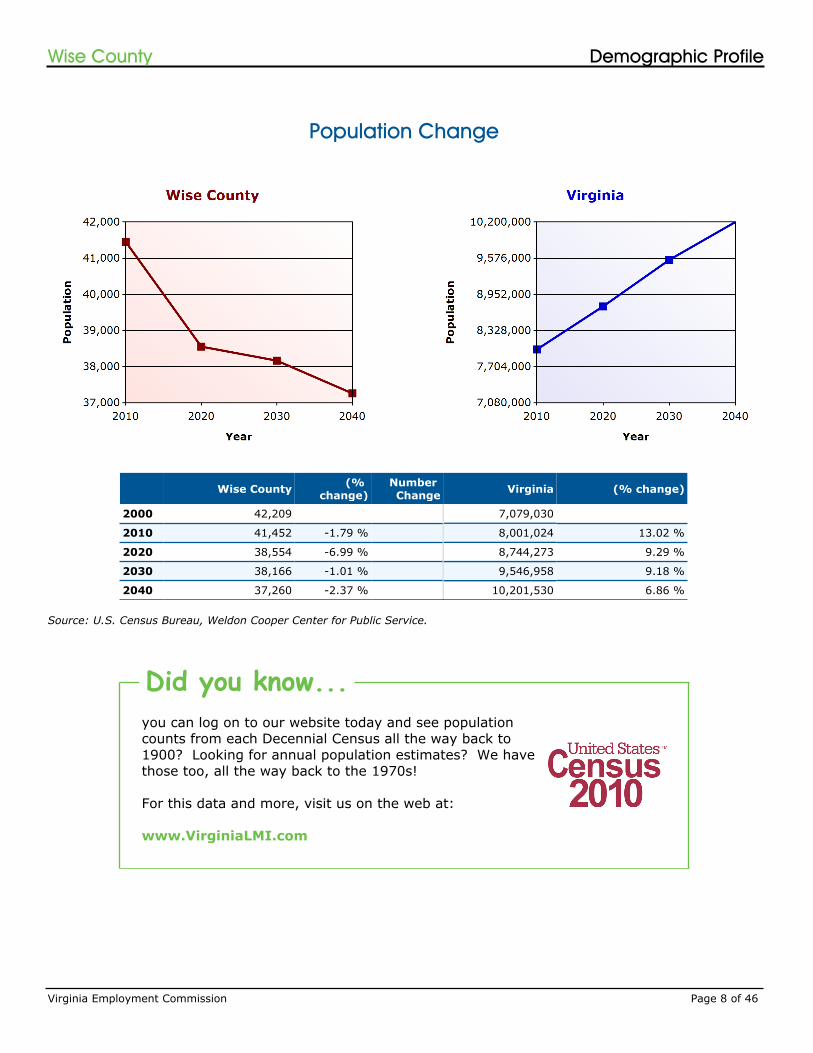
Population Change
Wise County (% change)
Number Change Virginia (% change)
2000 42,209 7,079,030
2010 41,452 -1.79 % 8,001,024 13.02 %
2020 38,554 -6.99 % 8,744,273 9.29 %
2030 38,166 -1.01 % 9,546,958 9.18 %
2040 37,260 -2.37 % 10,201,530 6.86 %
Source: U.S. Census Bureau, Weldon Cooper Center for Public Service.
you can log on to our website today and see population counts from each Decennial Census all the way back to 1900? Looking for annual population estimates? We have those too, all the way back to the 1970s!
For this data and more, visit us on the web at:
www.VirginiaLMI.com
Did you know...
Virginia Employment Commission Page 8 of 46
Demographic ProfileWise County
Number Change
Virginia Employment Commission Page 9 of 46
Demographic ProfileWise County
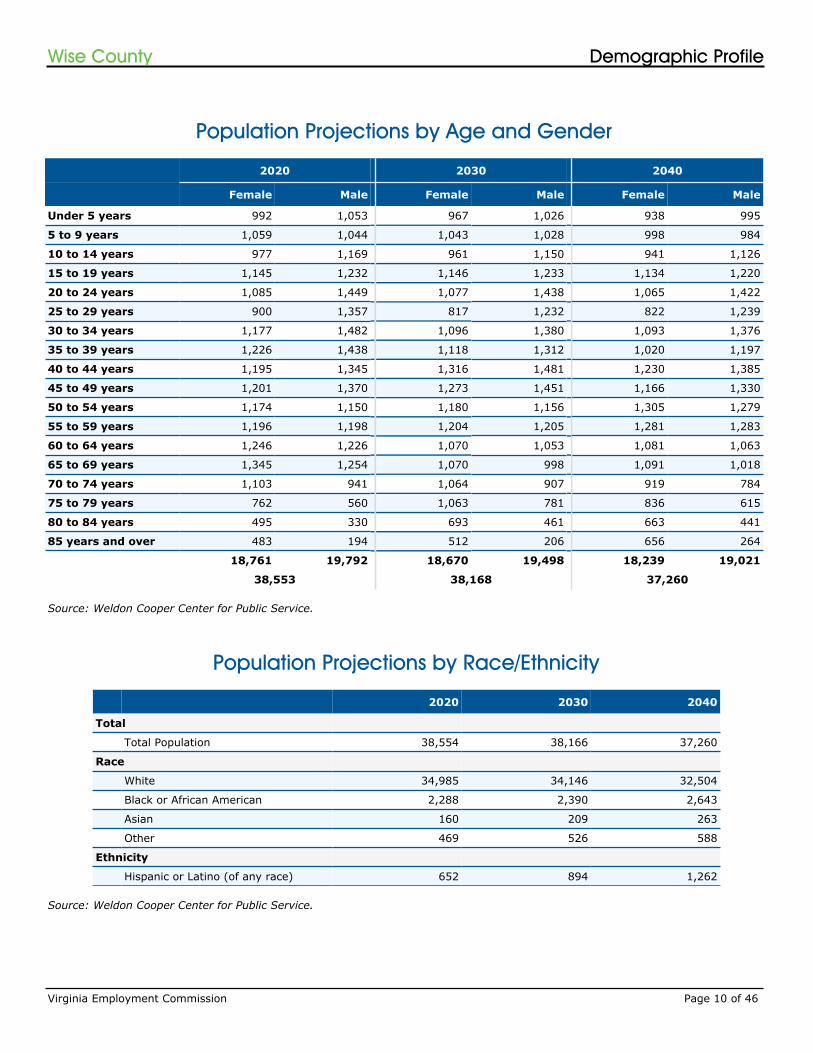
Population Projections by Age and Gender
2020 2030 2040
Female Male Female Male Female Male
Under 5 years 992 1,053 967 1,026 938 995
5 to 9 years 1,059 1,044 1,043 1,028 998 984
10 to 14 years 977 1,169 961 1,150 941 1,126
15 to 19 years 1,145 1,232 1,146 1,233 1,134 1,220
20 to 24 years 1,085 1,449 1,077 1,438 1,065 1,422
25 to 29 years 900 1,357 817 1,232 822 1,239
30 to 34 years 1,177 1,482 1,096 1,380 1,093 1,376
35 to 39 years 1,226 1,438 1,118 1,312 1,020 1,197
40 to 44 years 1,195 1,345 1,316 1,481 1,230 1,385
45 to 49 years 1,201 1,370 1,273 1,451 1,166 1,330
50 to 54 years 1,174 1,150 1,180 1,156 1,305 1,279
55 to 59 years 1,196 1,198 1,204 1,205 1,281 1,283
60 to 64 years 1,246 1,226 1,070 1,053 1,081 1,063
65 to 69 years 1,345 1,254 1,070 998 1,091 1,018
70 to 74 years 1,103 941 1,064 907 919 784
75 to 79 years 762 560 1,063 781 836 615
80 to 84 years 495 330 693 461 663 441
85 years and over 483 194 512 206 656 264
18,761 19,792 18,670 19,498 18,239 19,021
38,553 38,168 37,260
Source: Weldon Cooper Center for Public Service.
Population Projections by Race/Ethnicity
Source: Weldon Cooper Center for Public Service.
2020 2030 2040
Total
Total Population 38,554 38,166 37,260
Race
White 34,985 34,146 32,504
Black or African American 2,288 2,390 2,643
Asian 160 209 263
Other 469 526 588
Ethnicity
Hispanic or Latino (of any race) 652 894 1,262
Virginia Employment Commission Page 10 of 46
Demographic ProfileWise County
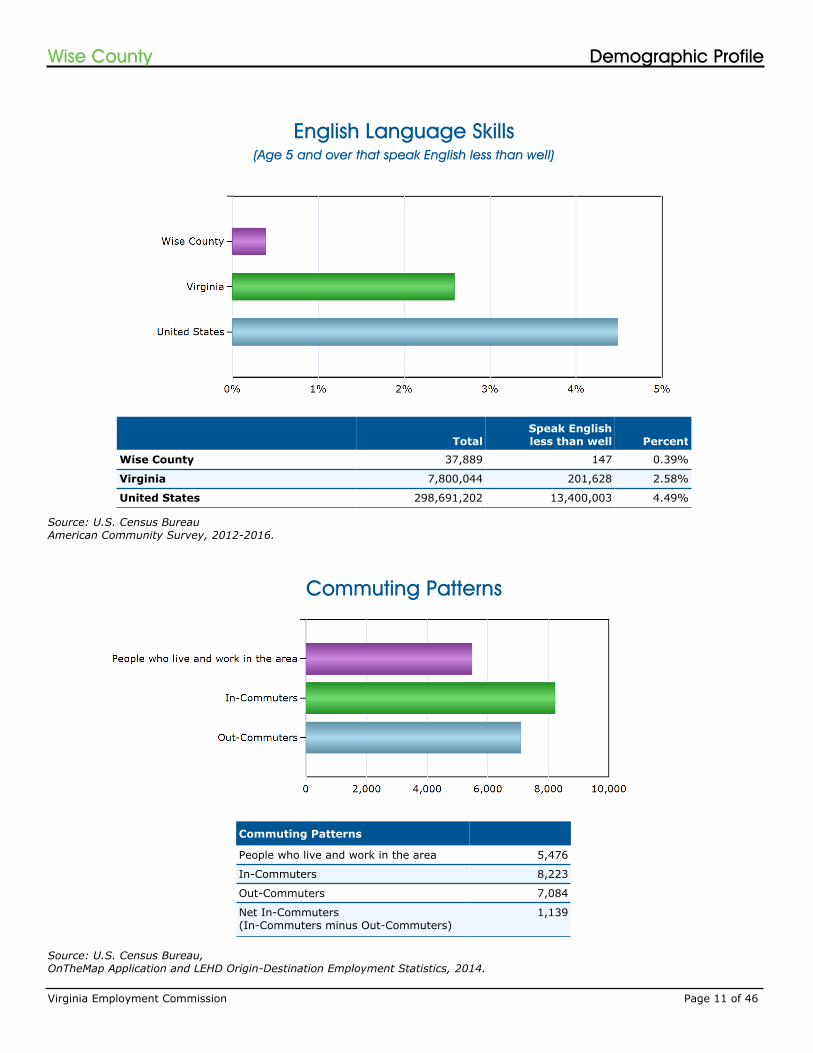
English Language Skills
TotalSpeak Englishless than well Percent
Wise County 37,889 147 0.39%
Virginia 7,800,044 201,628 2.58%
United States 298,691,202 13,400,003 4.49%
Source: U.S. Census BureauAmerican Community Survey, 2012-2016.
(Age 5 and over that speak English less than well)
Commuting Patterns
Commuting Patterns
People who live and work in the area 5,476
In-Commuters 8,223
Out-Commuters 7,084
Net In-Commuters(In-Commuters minus Out-Commuters)
1,139
Source: U.S. Census Bureau,OnTheMap Application and LEHD Origin-Destination Employment Statistics, 2014.
Virginia Employment Commission Page 11 of 46
Demographic ProfileWise County
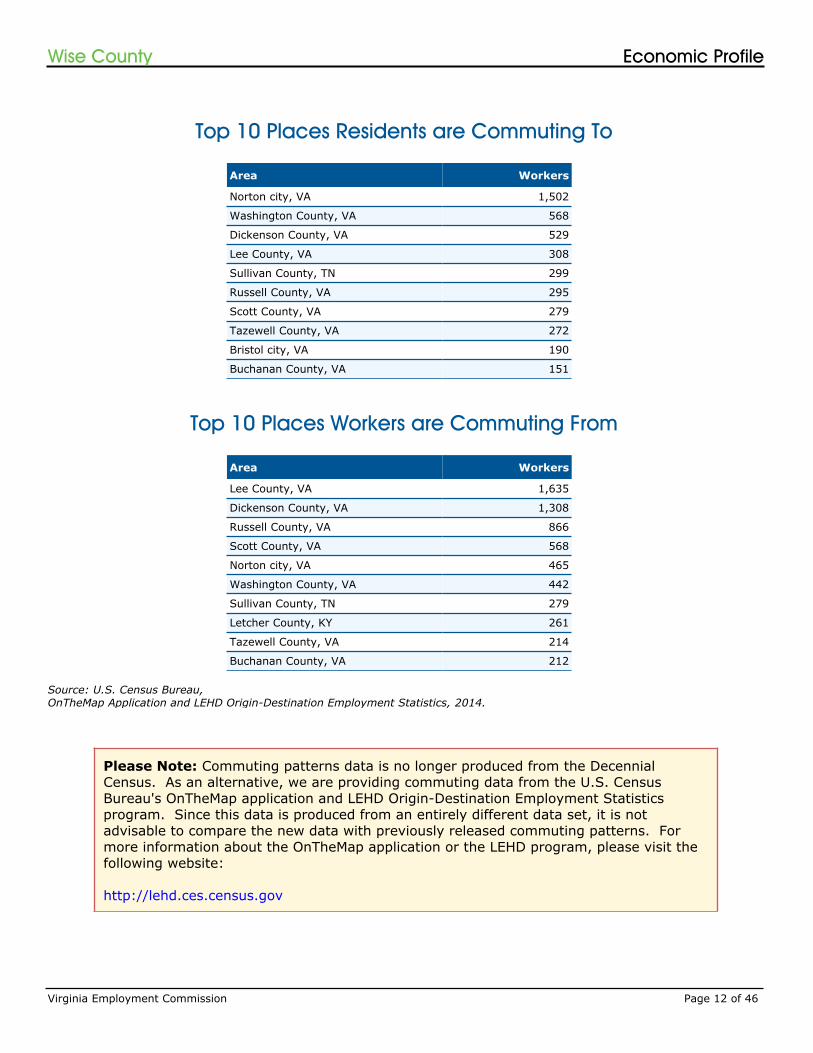
Top 10 Places Residents are Commuting To
Area Workers
Norton city, VA 1,502
Washington County, VA 568
Dickenson County, VA 529
Lee County, VA 308
Sullivan County, TN 299
Russell County, VA 295
Scott County, VA 279
Tazewell County, VA 272
Bristol city, VA 190
Buchanan County, VA 151
Top 10 Places Workers are Commuting From
Area Workers
Lee County, VA 1,635
Dickenson County, VA 1,308
Russell County, VA 866
Scott County, VA 568
Norton city, VA 465
Washington County, VA 442
Sullivan County, TN 279
Letcher County, KY 261
Tazewell County, VA 214
Buchanan County, VA 212
Source: U.S. Census Bureau,OnTheMap Application and LEHD Origin-Destination Employment Statistics, 2014.
Please Note: Commuting patterns data is no longer produced from the Decennial Census. As an alternative, we are providing commuting data from the U.S. Census Bureau's OnTheMap application and LEHD Origin-Destination Employment Statistics program. Since this data is produced from an entirely different data set, it is not advisable to compare the new data with previously released commuting patterns. For more information about the OnTheMap application or the LEHD program, please visit the following website:
http://lehd.ces.census.gov
Virginia Employment Commission Page 12 of 46
Economic ProfileWise County
III. Economic Profile
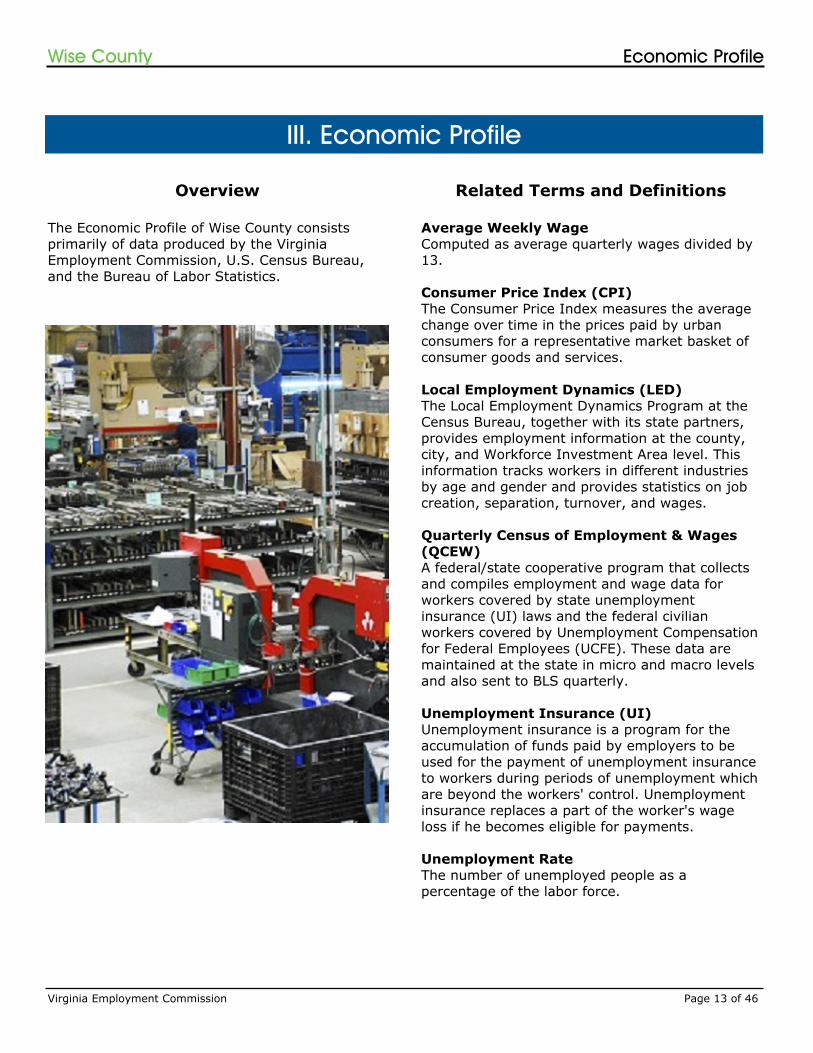
The Economic Profile of Wise County consists primarily of data produced by the Virginia Employment Commission, U.S. Census Bureau, and the Bureau of Labor Statistics.
Related Terms and DefinitionsOverview
Average Weekly WageComputed as average quarterly wages divided by 13.
Consumer Price Index (CPI)The Consumer Price Index measures the average change over time in the prices paid by urban consumers for a representative market basket of consumer goods and services.
Local Employment Dynamics (LED)The Local Employment Dynamics Program at the Census Bureau, together with its state partners, provides employment information at the county, city, and Workforce Investment Area level. This information tracks workers in different industries by age and gender and provides statistics on job creation, separation, turnover, and wages.
Quarterly Census of Employment & Wages (QCEW)A federal/state cooperative program that collects and compiles employment and wage data for workers covered by state unemployment insurance (UI) laws and the federal civilian workers covered by Unemployment Compensation for Federal Employees (UCFE). These data are maintained at the state in micro and macro levels and also sent to BLS quarterly.
Unemployment Insurance (UI)Unemployment insurance is a program for the accumulation of funds paid by employers to be used for the payment of unemployment insurance to workers during periods of unemployment which are beyond the workers' control. Unemployment insurance replaces a part of the worker's wage loss if he becomes eligible for payments.
Unemployment RateThe number of unemployed people as a percentage of the labor force.
Virginia Employment Commission Page 13 of 46
Economic ProfileWise County
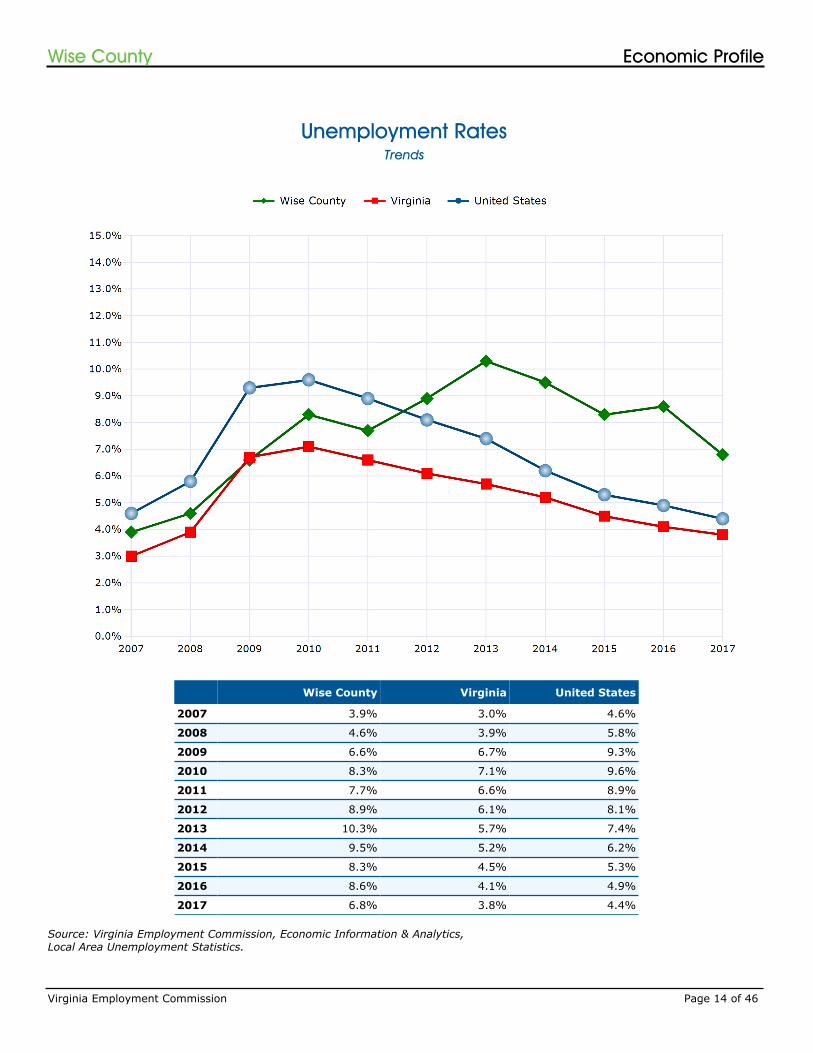
Unemployment Rates
Wise County Virginia United States
2007 3.9% 3.0% 4.6%
2008 4.6% 3.9% 5.8%
2009 6.6% 6.7% 9.3%
2010 8.3% 7.1% 9.6%
2011 7.7% 6.6% 8.9%
2012 8.9% 6.1% 8.1%
2013 10.3% 5.7% 7.4%
2014 9.5% 5.2% 6.2%
2015 8.3% 4.5% 5.3%
2016 8.6% 4.1% 4.9%
2017 6.8% 3.8% 4.4%
Source: Virginia Employment Commission, Economic Information & Analytics, Local Area Unemployment Statistics.
Trends
Virginia Employment Commission Page 14 of 46
Economic ProfileWise County
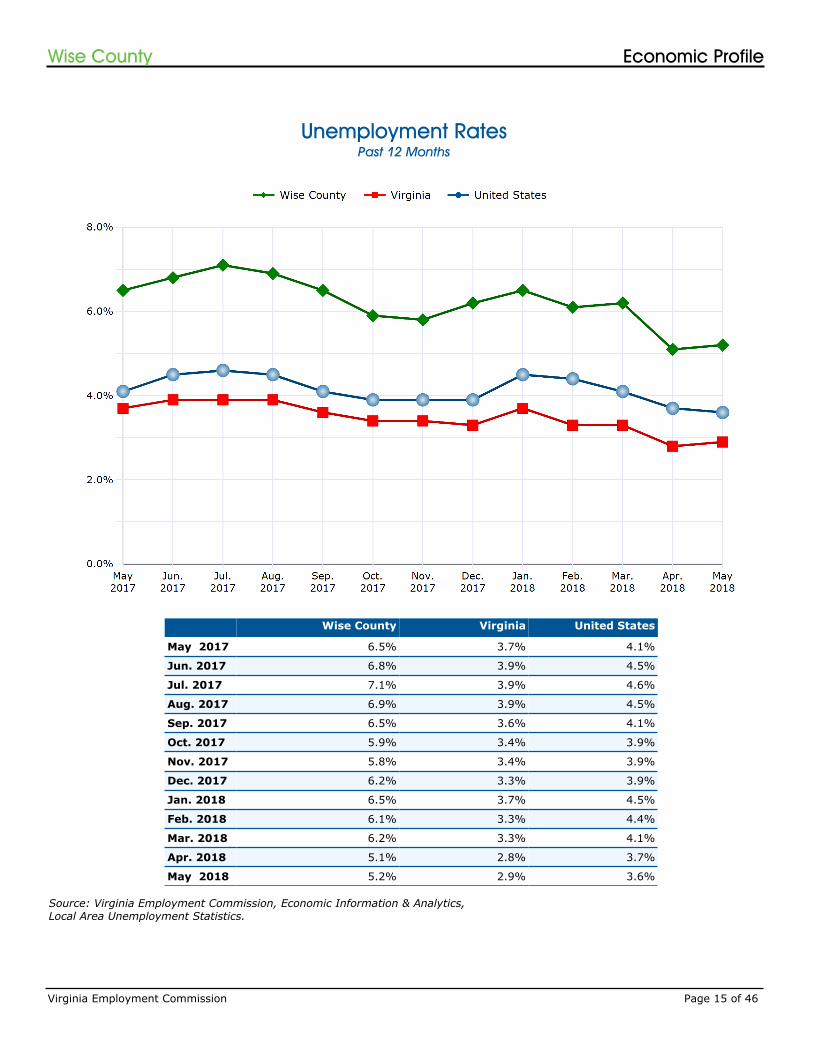
Unemployment Rates
Wise County Virginia United States
May 2017 6.5% 3.7% 4.1%
Jun. 2017 6.8% 3.9% 4.5%
Jul. 2017 7.1% 3.9% 4.6%
Aug. 2017 6.9% 3.9% 4.5%
Sep. 2017 6.5% 3.6% 4.1%
Oct. 2017 5.9% 3.4% 3.9%
Nov. 2017 5.8% 3.4% 3.9%
Dec. 2017 6.2% 3.3% 3.9%
Jan. 2018 6.5% 3.7% 4.5%
Feb. 2018 6.1% 3.3% 4.4%
Mar. 2018 6.2% 3.3% 4.1%
Apr. 2018 5.1% 2.8% 3.7%
May 2018 5.2% 2.9% 3.6%
Past 12 Months
Source: Virginia Employment Commission, Economic Information & Analytics, Local Area Unemployment Statistics.
Virginia Employment Commission Page 15 of 46
Economic ProfileWise County
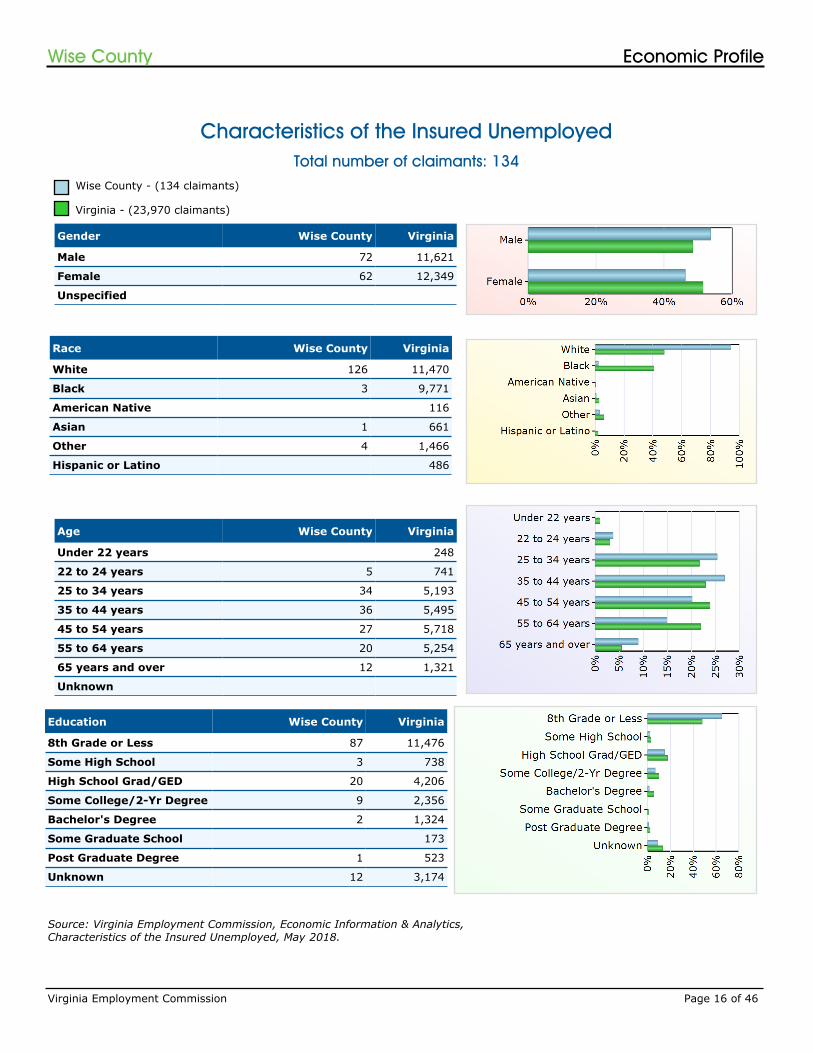
Characteristics of the Insured Unemployed
Age Wise County Virginia
Under 22 years 248
22 to 24 years 5 741
25 to 34 years 34 5,193
35 to 44 years 36 5,495
45 to 54 years 27 5,718
55 to 64 years 20 5,254
65 years and over 12 1,321
Unknown
Gender Wise County Virginia
Male 72 11,621
Female 62 12,349
Unspecified
Race Wise County Virginia
White 126 11,470
Black 3 9,771
American Native 116
Asian 1 661
Other 4 1,466
Hispanic or Latino 486
Education Wise County Virginia
8th Grade or Less 87 11,476
Some High School 3 738
High School Grad/GED 20 4,206
Some College/2-Yr Degree 9 2,356
Bachelor's Degree 2 1,324
Some Graduate School 173
Post Graduate Degree 1 523
Unknown 12 3,174
Wise County - (134 claimants)
Virginia - (23,970 claimants)
Source: Virginia Employment Commission, Economic Information & Analytics, Characteristics of the Insured Unemployed, May 2018.
Total number of claimants: 134
Virginia Employment Commission Page 16 of 46
Economic ProfileWise County
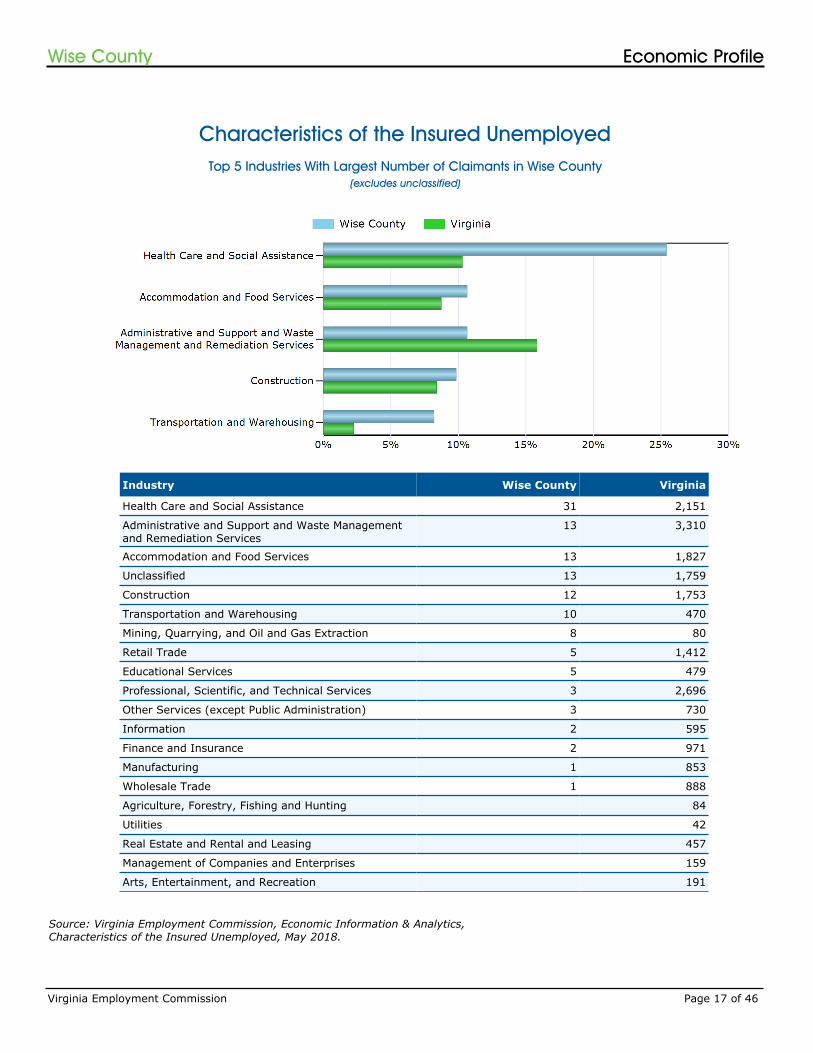
Industry Wise County Virginia
Health Care and Social Assistance 31 2,151
Administrative and Support and Waste Management and Remediation Services
13 3,310
Accommodation and Food Services 13 1,827
Unclassified 13 1,759
Construction 12 1,753
Transportation and Warehousing 10 470
Mining, Quarrying, and Oil and Gas Extraction 8 80
Retail Trade 5 1,412
Educational Services 5 479
Professional, Scientific, and Technical Services 3 2,696
Other Services (except Public Administration) 3 730
Information 2 595
Finance and Insurance 2 971
Manufacturing 1 853
Wholesale Trade 1 888
Agriculture, Forestry, Fishing and Hunting 84
Utilities 42
Real Estate and Rental and Leasing 457
Management of Companies and Enterprises 159
Arts, Entertainment, and Recreation 191
(excludes unclassified)
Top 5 Industries With Largest Number of Claimants in Wise County
Source: Virginia Employment Commission, Economic Information & Analytics, Characteristics of the Insured Unemployed, May 2018.
Characteristics of the Insured Unemployed
Virginia Employment Commission Page 17 of 46
Economic ProfileWise County
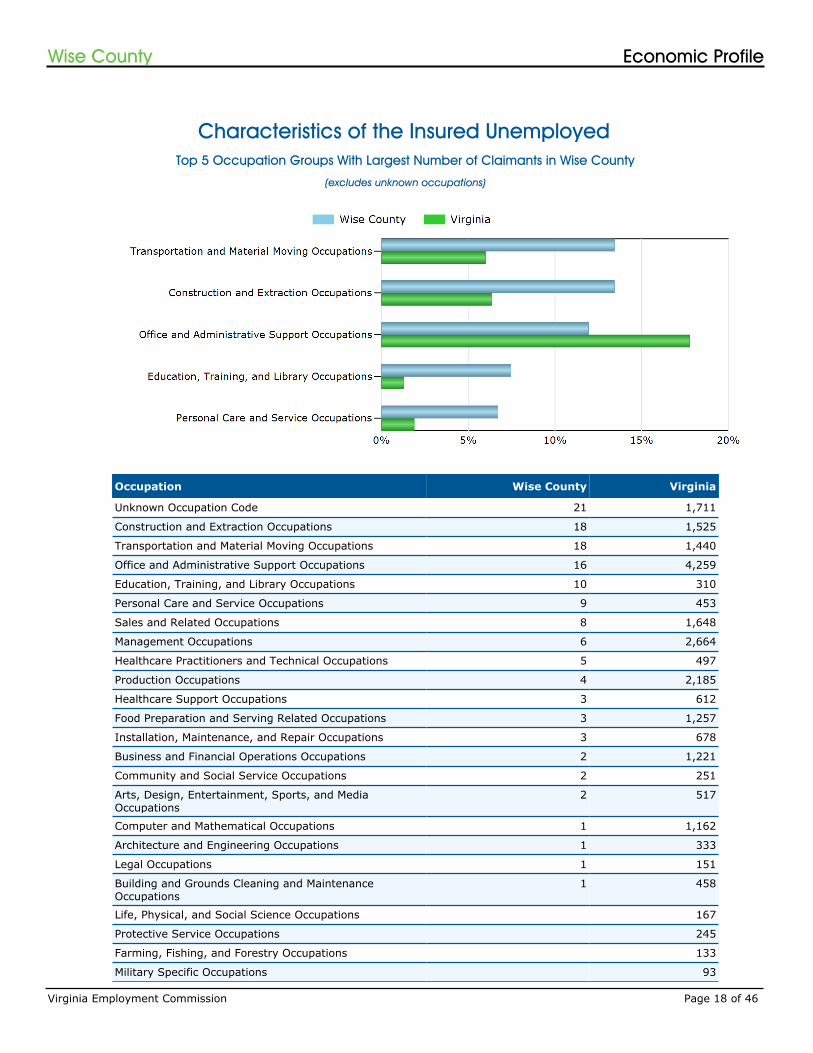
Characteristics of the Insured Unemployed
Occupation Wise County Virginia
Unknown Occupation Code 21 1,711
Construction and Extraction Occupations 18 1,525
Transportation and Material Moving Occupations 18 1,440
Office and Administrative Support Occupations 16 4,259
Education, Training, and Library Occupations 10 310
Personal Care and Service Occupations 9 453
Sales and Related Occupations 8 1,648
Management Occupations 6 2,664
Healthcare Practitioners and Technical Occupations 5 497
Production Occupations 4 2,185
Healthcare Support Occupations 3 612
Food Preparation and Serving Related Occupations 3 1,257
Installation, Maintenance, and Repair Occupations 3 678
Business and Financial Operations Occupations 2 1,221
Community and Social Service Occupations 2 251
Arts, Design, Entertainment, Sports, and Media Occupations
2 517
Computer and Mathematical Occupations 1 1,162
Architecture and Engineering Occupations 1 333
Legal Occupations 1 151
Building and Grounds Cleaning and Maintenance Occupations
1 458
Life, Physical, and Social Science Occupations 167
Protective Service Occupations 245
Farming, Fishing, and Forestry Occupations 133
Military Specific Occupations 93
(excludes unknown occupations)
Top 5 Occupation Groups With Largest Number of Claimants in Wise County
Virginia Employment Commission Page 18 of 46
Economic ProfileWise County

Source: Virginia Employment Commission, Economic Information & Analytics,Characteristics of the Insured Unemployed, May 2018.
Virginia Employment Commission Page 19 of 46
Economic ProfileWise County
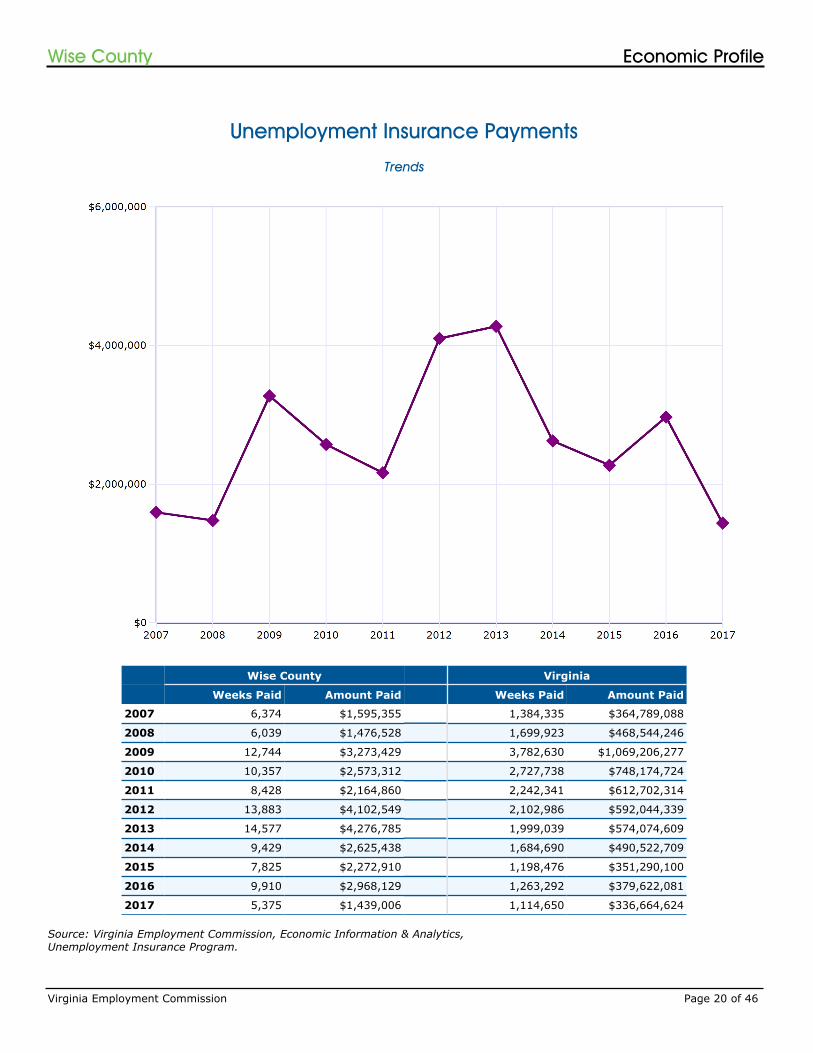
Unemployment Insurance Payments
Source: Virginia Employment Commission, Economic Information & Analytics,Unemployment Insurance Program.
Trends
Wise County Virginia
Weeks Paid Amount Paid Weeks Paid Amount Paid
2007 6,374 $1,595,355 1,384,335 $364,789,088
2008 6,039 $1,476,528 1,699,923 $468,544,246
2009 12,744 $3,273,429 3,782,630 $1,069,206,277
2010 10,357 $2,573,312 2,727,738 $748,174,724
2011 8,428 $2,164,860 2,242,341 $612,702,314
2012 13,883 $4,102,549 2,102,986 $592,044,339
2013 14,577 $4,276,785 1,999,039 $574,074,609
2014 9,429 $2,625,438 1,684,690 $490,522,709
2015 7,825 $2,272,910 1,198,476 $351,290,100
2016 9,910 $2,968,129 1,263,292 $379,622,081
2017 5,375 $1,439,006 1,114,650 $336,664,624
Virginia Employment Commission Page 20 of 46
Economic ProfileWise County
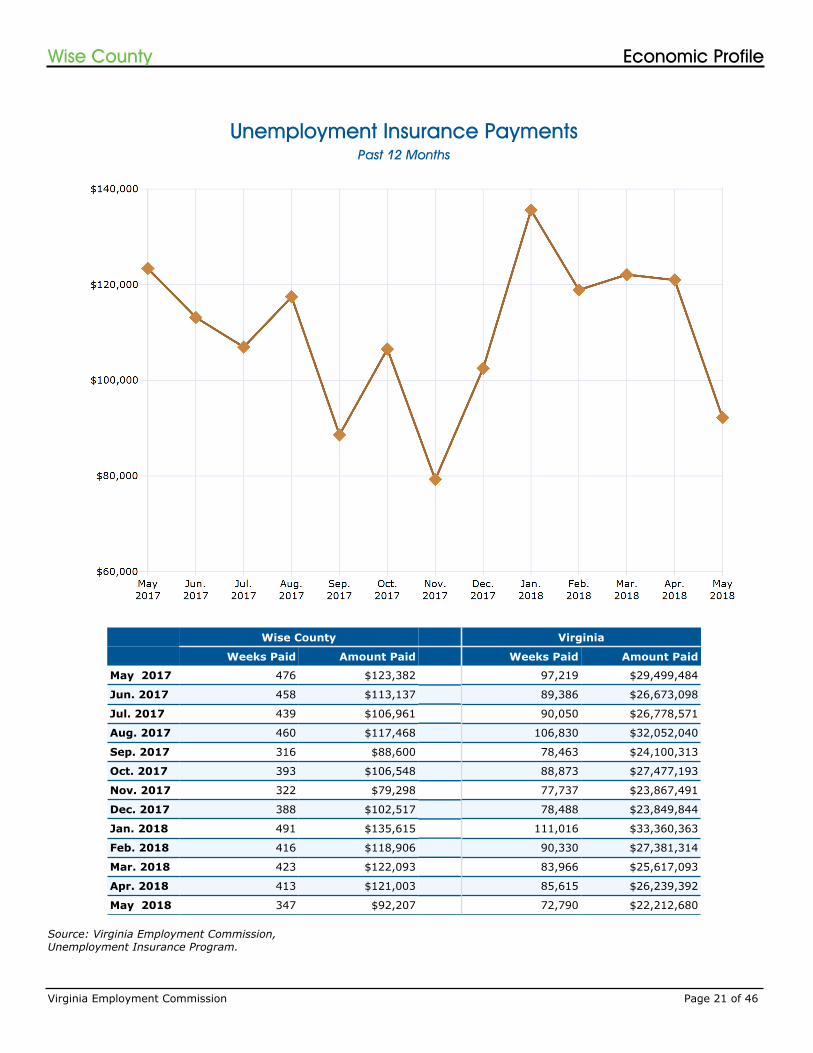
Unemployment Insurance Payments
Source: Virginia Employment Commission,Unemployment Insurance Program.
Past 12 Months
Wise County Virginia
Weeks Paid Amount Paid Weeks Paid Amount Paid
May 2017 476 $123,382 97,219 $29,499,484
Jun. 2017 458 $113,137 89,386 $26,673,098
Jul. 2017 439 $106,961 90,050 $26,778,571
Aug. 2017 460 $117,468 106,830 $32,052,040
Sep. 2017 316 $88,600 78,463 $24,100,313
Oct. 2017 393 $106,548 88,873 $27,477,193
Nov. 2017 322 $79,298 77,737 $23,867,491
Dec. 2017 388 $102,517 78,488 $23,849,844
Jan. 2018 491 $135,615 111,016 $33,360,363
Feb. 2018 416 $118,906 90,330 $27,381,314
Mar. 2018 423 $122,093 83,966 $25,617,093
Apr. 2018 413 $121,003 85,615 $26,239,392
May 2018 347 $92,207 72,790 $22,212,680
Virginia Employment Commission Page 21 of 46
Economic ProfileWise County
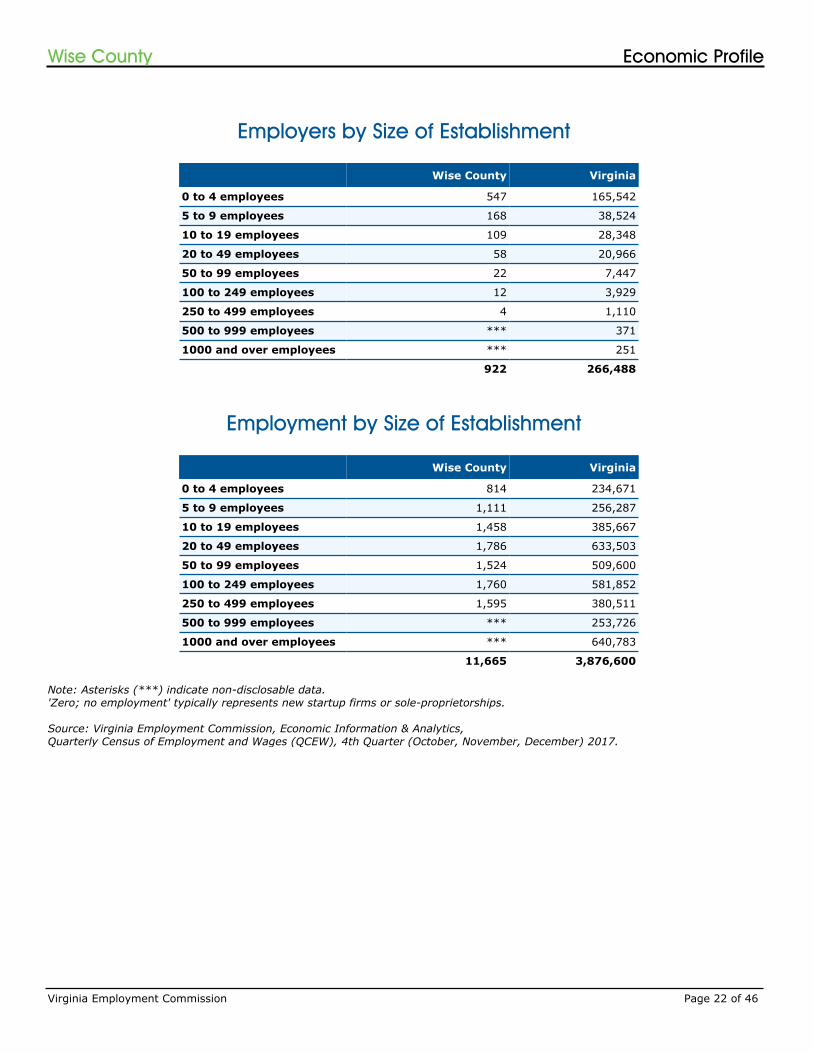
Employers by Size of Establishment
Employment by Size of Establishment
Note: Asterisks (***) indicate non-disclosable data.'Zero; no employment' typically represents new startup firms or sole-proprietorships.
Source: Virginia Employment Commission, Economic Information & Analytics,Quarterly Census of Employment and Wages (QCEW), 4th Quarter (October, November, December) 2017.
Wise County Virginia
0 to 4 employees 547 165,542
5 to 9 employees 168 38,524
10 to 19 employees 109 28,348
20 to 49 employees 58 20,966
50 to 99 employees 22 7,447
100 to 249 employees 12 3,929
250 to 499 employees 4 1,110
500 to 999 employees *** 371
1000 and over employees *** 251
922 266,488
Wise County Virginia
0 to 4 employees 814 234,671
5 to 9 employees 1,111 256,287
10 to 19 employees 1,458 385,667
20 to 49 employees 1,786 633,503
50 to 99 employees 1,524 509,600
100 to 249 employees 1,760 581,852
250 to 499 employees 1,595 380,511
500 to 999 employees *** 253,726
1000 and over employees *** 640,783
11,665 3,876,600
Virginia Employment Commission Page 22 of 46
Economic ProfileWise County

50 Largest Employers
1. Wise County School Board
2. Sykes Enterprises
3. Food City
4. Red Onion Correctional Center
5. Wallens Ridge Correctional Center
6. University of Virginia / Blue Ridge Hospital
7. Heritage Hall
8. Mount Empire Community College
9. Bristol Regional Health System
10. County of Wise
11. Mullican Flooring
12. Mount Empire Older Citizens
13. Telemed
14. Crutchfield Corporation
15. Lowes' Home Centers, Inc.
16. Dominion Virginia Power
17. Frontier Health
18. Shore Stop Store
19. In Home Care
20. Virginia Department of Mines, Mineral & Energy
21. Town of Big Stone Gap
22. VDOT
23. Wal Mart
24. A & A Enterprises Inc
25. Riggs Oil Company Black Diamond
26. Save A Lot Food Stores
27. Thompson and Litton, Inc.
28. Wise County Social Services
29. Roth LLC
30. Red River Coal Company
31. Hardee's
32. Humphrey's Enterprises
33. Southern Forest Products LLC
34. Wellmont Medical Associates Inc
35. Frontier Communications
36. Rnse Enterprises Inc
37. Freedom Ford Lincoln Mercury Inc
38. Huddle House
39. Renos Roadhouse
40. Town of Wise
41. Miner's Exchange Bank
42. Patriot Mining, LLC
43. Head Start
44. Postal Service
45. Virginia Department of Corrections, Western VA Field Office
46. Radford U
47. Pizza King
48. U.S. Department of Agriculture
49. Belk
50. Quesenberry's, Inc.
Source: Virginia Employment Commission, Economic Information & Analytics,Quarterly Census of Employment and Wages (QCEW), 4th Quarter (October, November, December) 2017.
you can search over 300,000 employer listings on our website provided by Infogroup? This easy-to-use feature lets you search for employers by keyword, industry, sales volume, size range, and more!
For this data and more, visit us on the web at:
www.VirginiaLMI.com
Did you know...
Virginia Employment Commission Page 23 of 46
Economic ProfileWise County
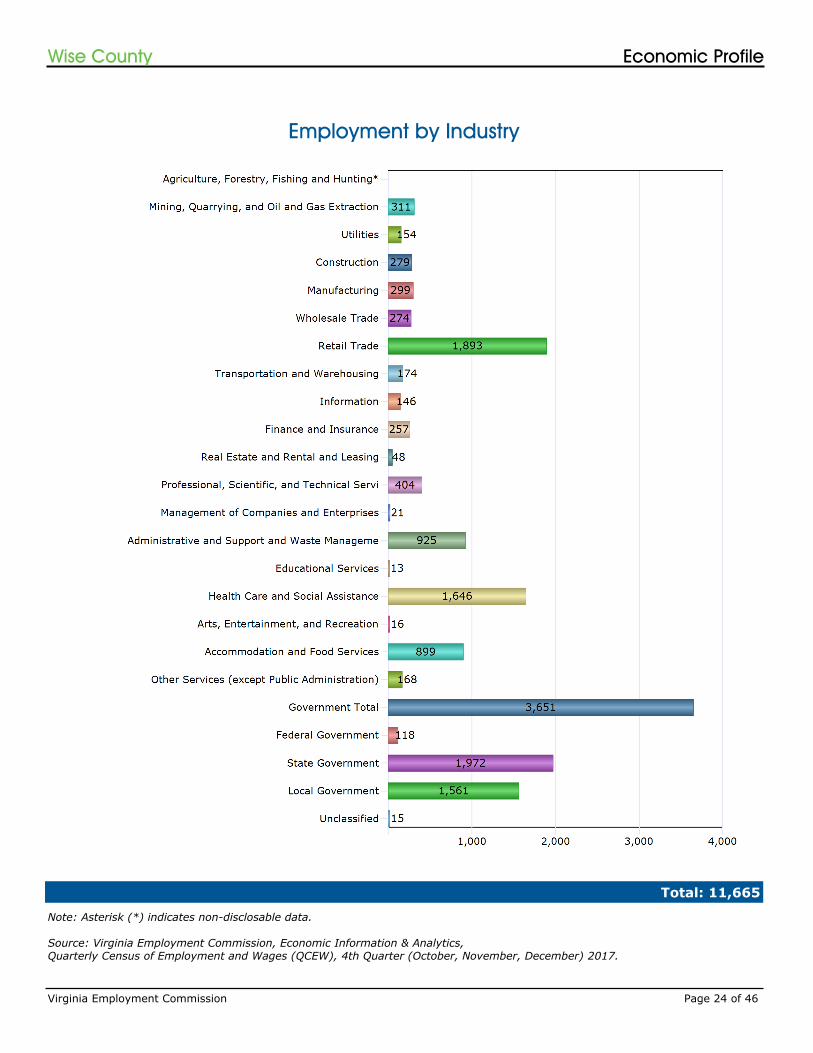
Employment by Industry
Note: Asterisk (*) indicates non-disclosable data.
Source: Virginia Employment Commission, Economic Information & Analytics,Quarterly Census of Employment and Wages (QCEW), 4th Quarter (October, November, December) 2017.
Total: 11,665
Virginia Employment Commission Page 24 of 46
Economic ProfileWise County
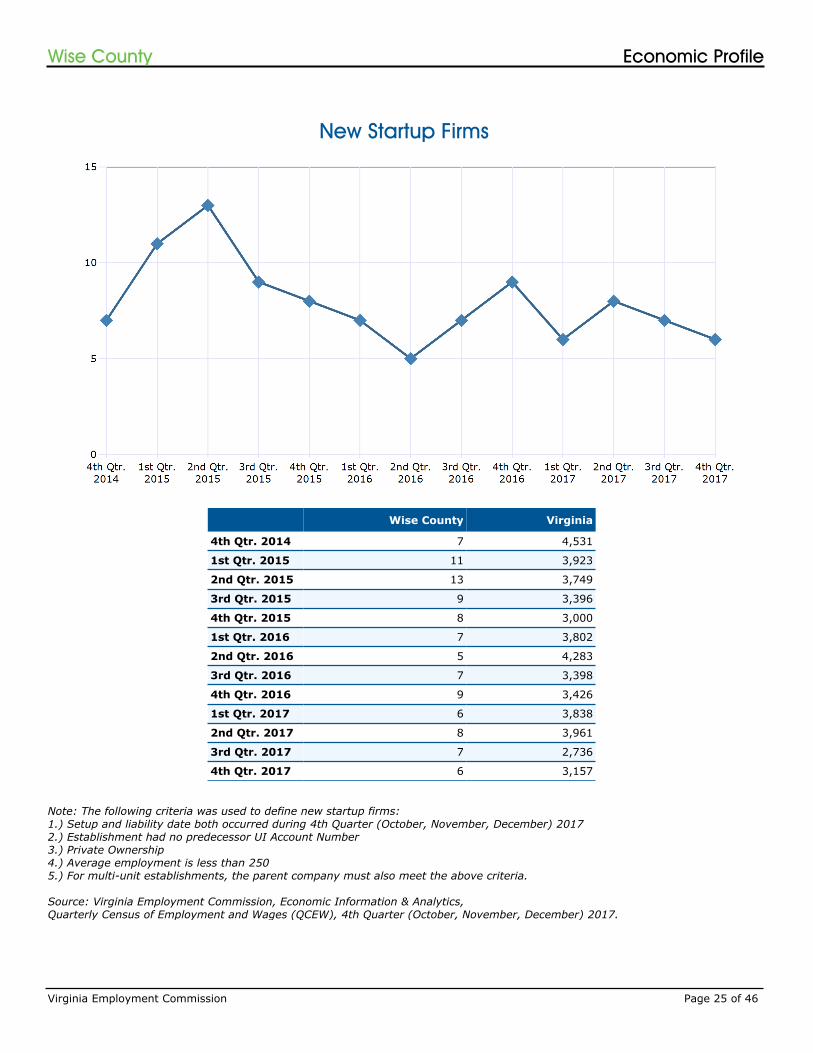
New Startup Firms
Wise County Virginia
4th Qtr. 2014 7 4,531
1st Qtr. 2015 11 3,923
2nd Qtr. 2015 13 3,749
3rd Qtr. 2015 9 3,396
4th Qtr. 2015 8 3,000
1st Qtr. 2016 7 3,802
2nd Qtr. 2016 5 4,283
3rd Qtr. 2016 7 3,398
4th Qtr. 2016 9 3,426
1st Qtr. 2017 6 3,838
2nd Qtr. 2017 8 3,961
3rd Qtr. 2017 7 2,736
4th Qtr. 2017 6 3,157
Note: The following criteria was used to define new startup firms:1.) Setup and liability date both occurred during 4th Quarter (October, November, December) 20172.) Establishment had no predecessor UI Account Number3.) Private Ownership4.) Average employment is less than 2505.) For multi-unit establishments, the parent company must also meet the above criteria.
Source: Virginia Employment Commission, Economic Information & Analytics,Quarterly Census of Employment and Wages (QCEW), 4th Quarter (October, November, December) 2017.
Virginia Employment Commission Page 25 of 46
Economic ProfileWise County
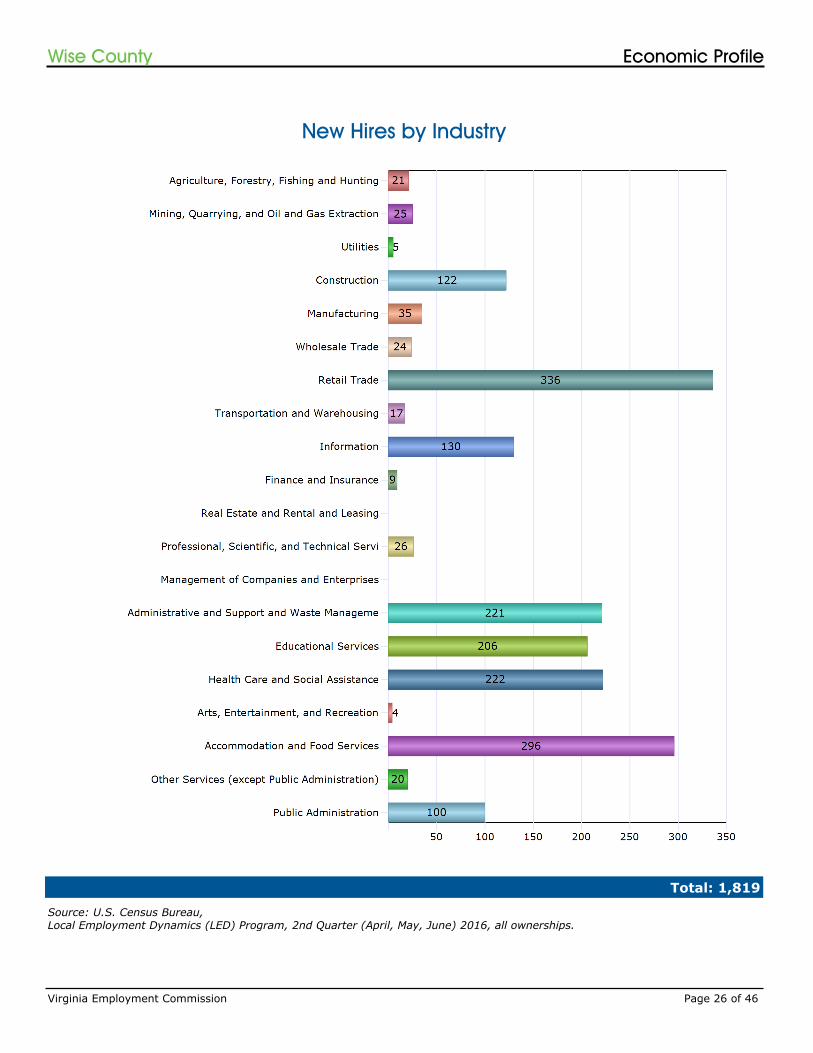
New Hires by Industry
Source: U.S. Census Bureau,Local Employment Dynamics (LED) Program, 2nd Quarter (April, May, June) 2016, all ownerships.
Total: 1,819
Virginia Employment Commission Page 26 of 46
Economic ProfileWise County
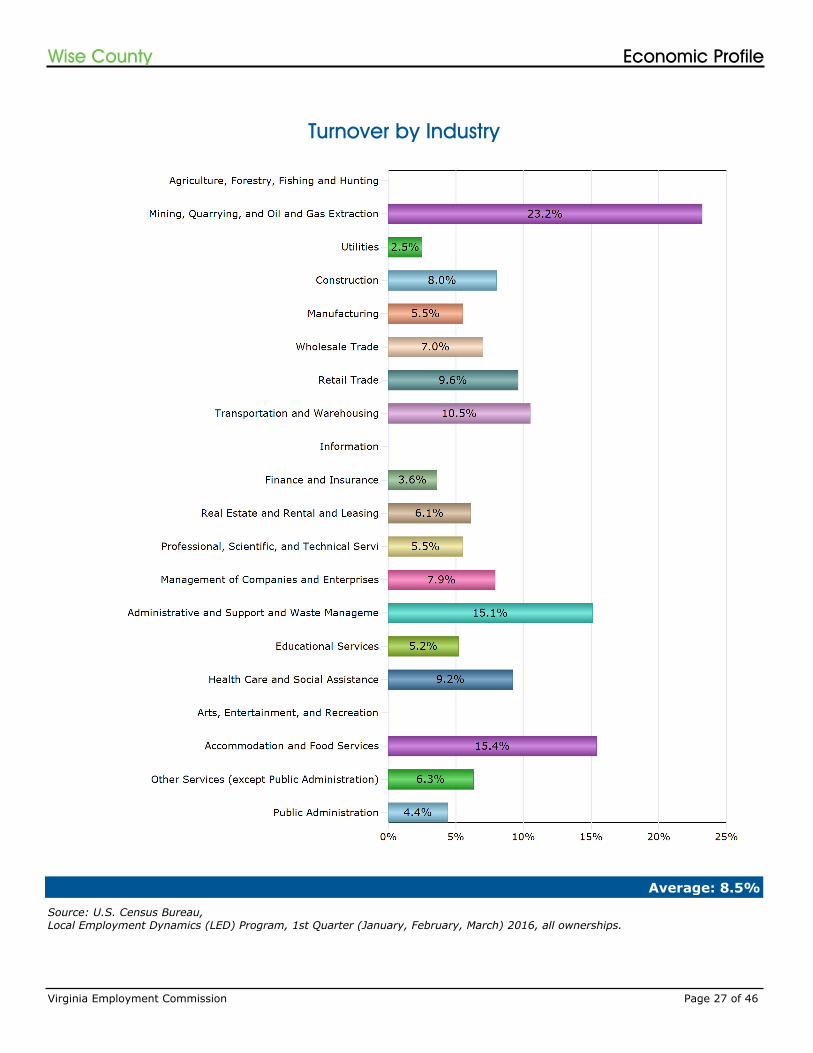
Turnover by Industry
Source: U.S. Census Bureau,Local Employment Dynamics (LED) Program, 1st Quarter (January, February, March) 2016, all ownerships.
Average: 8.5%
Virginia Employment Commission Page 27 of 46
Economic ProfileWise County
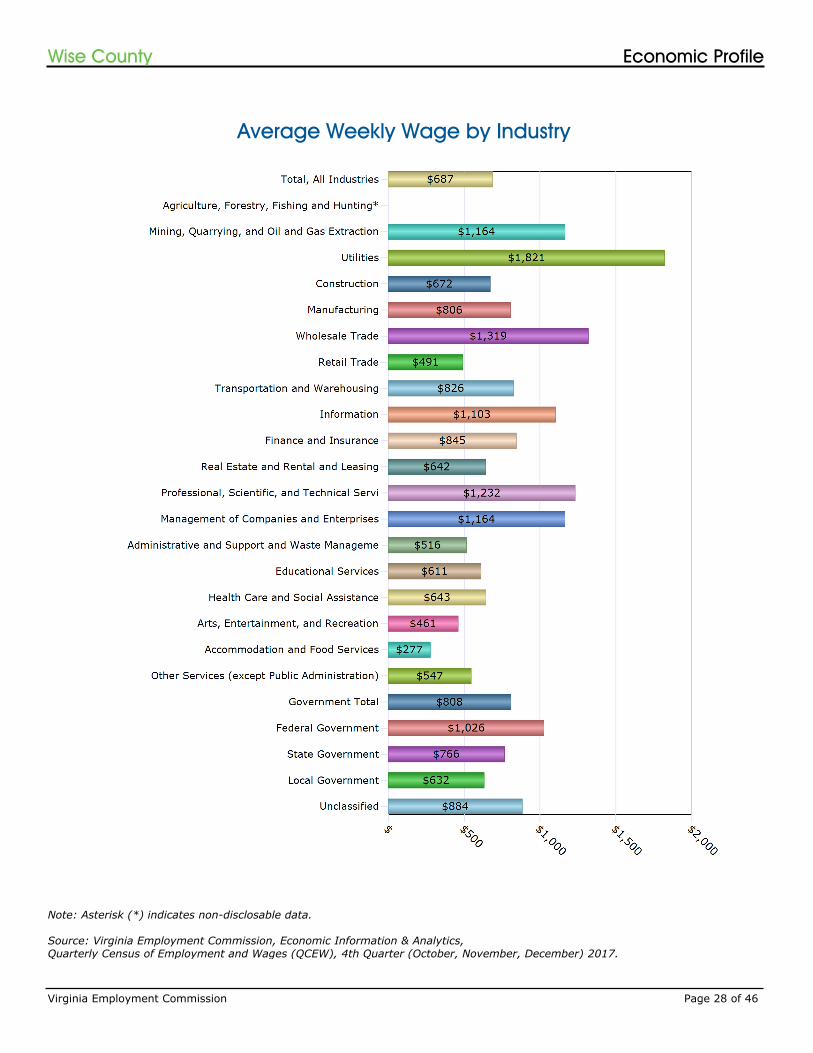
Average Weekly Wage by Industry
Note: Asterisk (*) indicates non-disclosable data.
Source: Virginia Employment Commission, Economic Information & Analytics,Quarterly Census of Employment and Wages (QCEW), 4th Quarter (October, November, December) 2017.
Virginia Employment Commission Page 28 of 46
Economic ProfileWise County
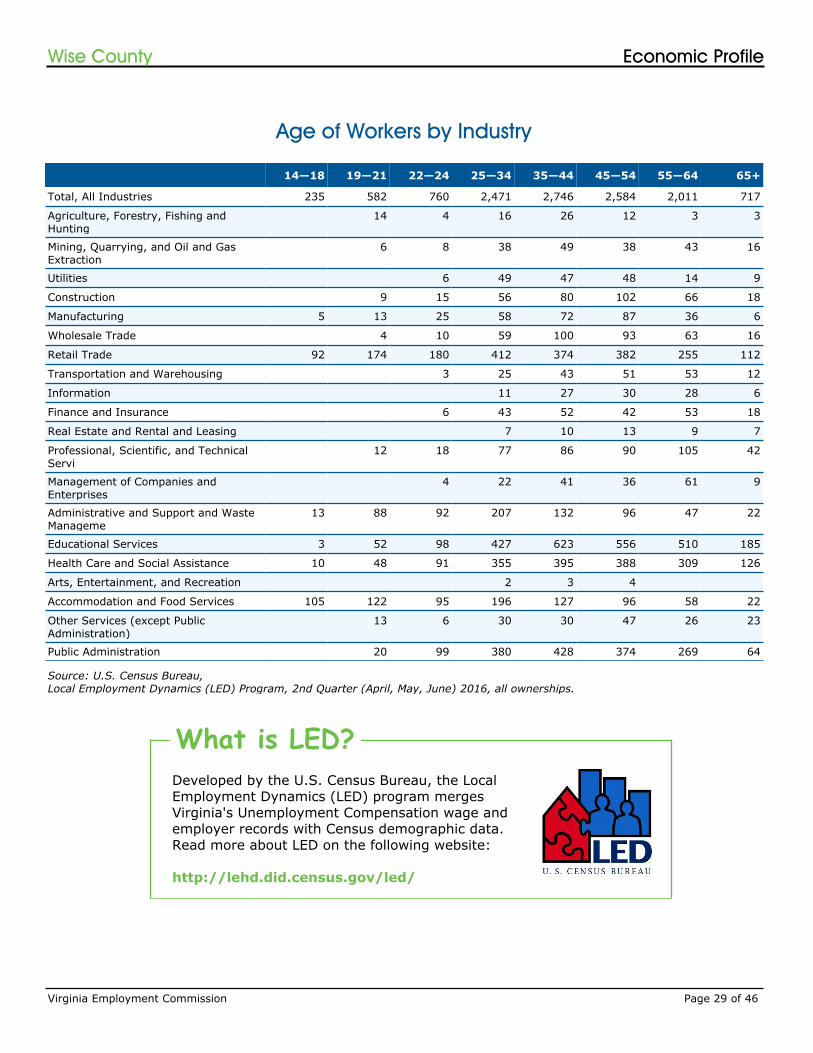
Age of Workers by Industry
14—18 19—21 22—24 25—34 35—44 45—54 55—64 65+
Total, All Industries 235 582 760 2,471 2,746 2,584 2,011 717
Agriculture, Forestry, Fishing and Hunting
14 4 16 26 12 3 3
Mining, Quarrying, and Oil and Gas Extraction
6 8 38 49 38 43 16
Utilities 6 49 47 48 14 9
Construction 9 15 56 80 102 66 18
Manufacturing 5 13 25 58 72 87 36 6
Wholesale Trade 4 10 59 100 93 63 16
Retail Trade 92 174 180 412 374 382 255 112
Transportation and Warehousing 3 25 43 51 53 12
Information 11 27 30 28 6
Finance and Insurance 6 43 52 42 53 18
Real Estate and Rental and Leasing 7 10 13 9 7
Professional, Scientific, and Technical Servi
12 18 77 86 90 105 42
Management of Companies and Enterprises
4 22 41 36 61 9
Administrative and Support and Waste Manageme
13 88 92 207 132 96 47 22
Educational Services 3 52 98 427 623 556 510 185
Health Care and Social Assistance 10 48 91 355 395 388 309 126
Arts, Entertainment, and Recreation 2 3 4
Accommodation and Food Services 105 122 95 196 127 96 58 22
Other Services (except Public Administration)
13 6 30 30 47 26 23
Public Administration 20 99 380 428 374 269 64
Source: U.S. Census Bureau,Local Employment Dynamics (LED) Program, 2nd Quarter (April, May, June) 2016, all ownerships.
Developed by the U.S. Census Bureau, the Local Employment Dynamics (LED) program merges Virginia's Unemployment Compensation wage and employer records with Census demographic data. Read more about LED on the following website:
http://lehd.did.census.gov/led/
What is LED?
Virginia Employment Commission Page 29 of 46
Economic ProfileWise County
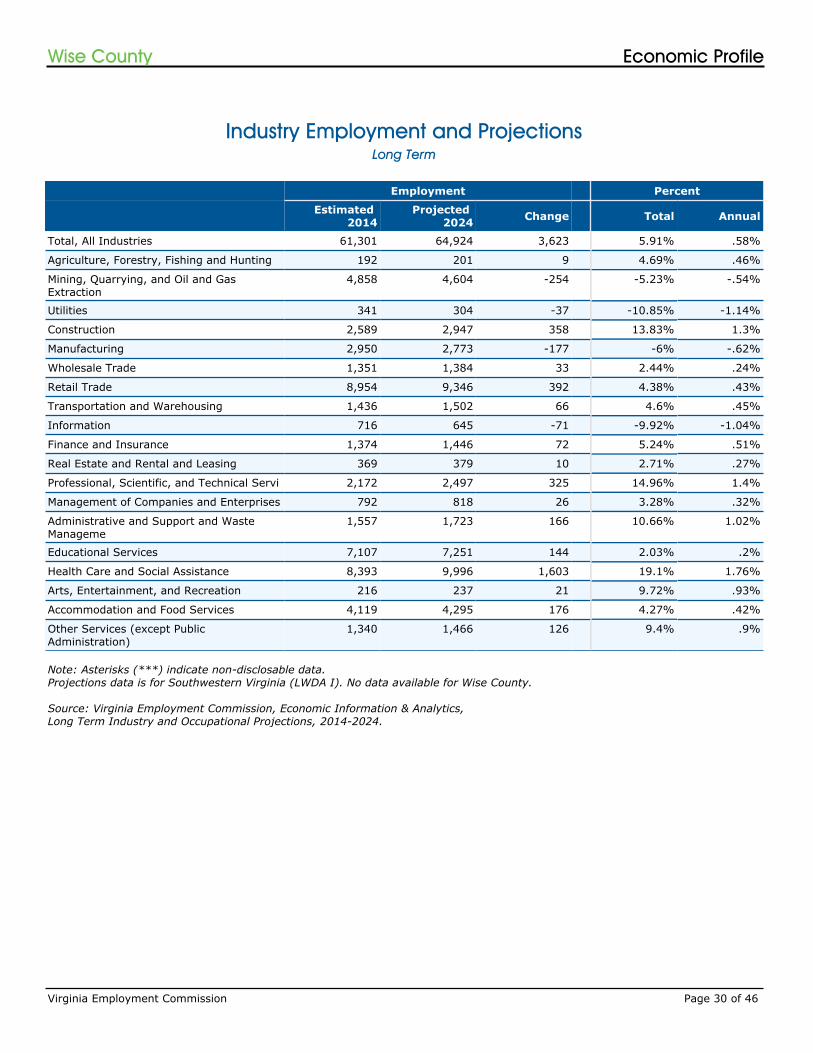
Industry Employment and Projections
Note: Asterisks (***) indicate non-disclosable data.Projections data is for Southwestern Virginia (LWDA I). No data available for Wise County.
Source: Virginia Employment Commission, Economic Information & Analytics,Long Term Industry and Occupational Projections, 2014-2024.
Employment Percent
Estimated 2014
Projected 2024 Change Total Annual
Total, All Industries 61,301 64,924 3,623 5.91% .58%
Agriculture, Forestry, Fishing and Hunting 192 201 9 4.69% .46%
Mining, Quarrying, and Oil and Gas Extraction
4,858 4,604 -254 -5.23% -.54%
Utilities 341 304 -37 -10.85% -1.14%
Construction 2,589 2,947 358 13.83% 1.3%
Manufacturing 2,950 2,773 -177 -6% -.62%
Wholesale Trade 1,351 1,384 33 2.44% .24%
Retail Trade 8,954 9,346 392 4.38% .43%
Transportation and Warehousing 1,436 1,502 66 4.6% .45%
Information 716 645 -71 -9.92% -1.04%
Finance and Insurance 1,374 1,446 72 5.24% .51%
Real Estate and Rental and Leasing 369 379 10 2.71% .27%
Professional, Scientific, and Technical Servi 2,172 2,497 325 14.96% 1.4%
Management of Companies and Enterprises 792 818 26 3.28% .32%
Administrative and Support and Waste Manageme
1,557 1,723 166 10.66% 1.02%
Educational Services 7,107 7,251 144 2.03% .2%
Health Care and Social Assistance 8,393 9,996 1,603 19.1% 1.76%
Arts, Entertainment, and Recreation 216 237 21 9.72% .93%
Accommodation and Food Services 4,119 4,295 176 4.27% .42%
Other Services (except Public Administration)
1,340 1,466 126 9.4% .9%
Long Term
Virginia Employment Commission Page 30 of 46
Economic ProfileWise County
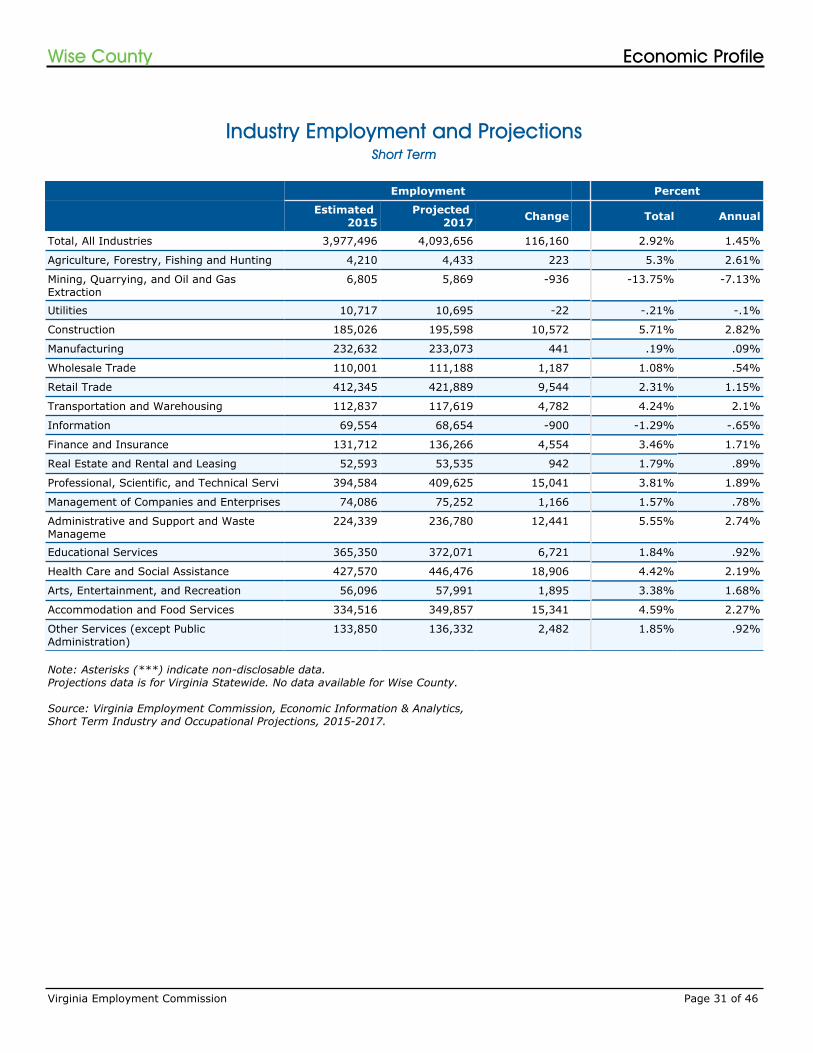
Industry Employment and Projections
Note: Asterisks (***) indicate non-disclosable data.Projections data is for Virginia Statewide. No data available for Wise County.
Source: Virginia Employment Commission, Economic Information & Analytics,Short Term Industry and Occupational Projections, 2015-2017.
Employment Percent
Estimated 2015
Projected 2017 Change Total Annual
Total, All Industries 3,977,496 4,093,656 116,160 2.92% 1.45%
Agriculture, Forestry, Fishing and Hunting 4,210 4,433 223 5.3% 2.61%
Mining, Quarrying, and Oil and Gas Extraction
6,805 5,869 -936 -13.75% -7.13%
Utilities 10,717 10,695 -22 -.21% -.1%
Construction 185,026 195,598 10,572 5.71% 2.82%
Manufacturing 232,632 233,073 441 .19% .09%
Wholesale Trade 110,001 111,188 1,187 1.08% .54%
Retail Trade 412,345 421,889 9,544 2.31% 1.15%
Transportation and Warehousing 112,837 117,619 4,782 4.24% 2.1%
Information 69,554 68,654 -900 -1.29% -.65%
Finance and Insurance 131,712 136,266 4,554 3.46% 1.71%
Real Estate and Rental and Leasing 52,593 53,535 942 1.79% .89%
Professional, Scientific, and Technical Servi 394,584 409,625 15,041 3.81% 1.89%
Management of Companies and Enterprises 74,086 75,252 1,166 1.57% .78%
Administrative and Support and Waste Manageme
224,339 236,780 12,441 5.55% 2.74%
Educational Services 365,350 372,071 6,721 1.84% .92%
Health Care and Social Assistance 427,570 446,476 18,906 4.42% 2.19%
Arts, Entertainment, and Recreation 56,096 57,991 1,895 3.38% 1.68%
Accommodation and Food Services 334,516 349,857 15,341 4.59% 2.27%
Other Services (except Public Administration)
133,850 136,332 2,482 1.85% .92%
Short Term
Virginia Employment Commission Page 31 of 46
Economic ProfileWise County
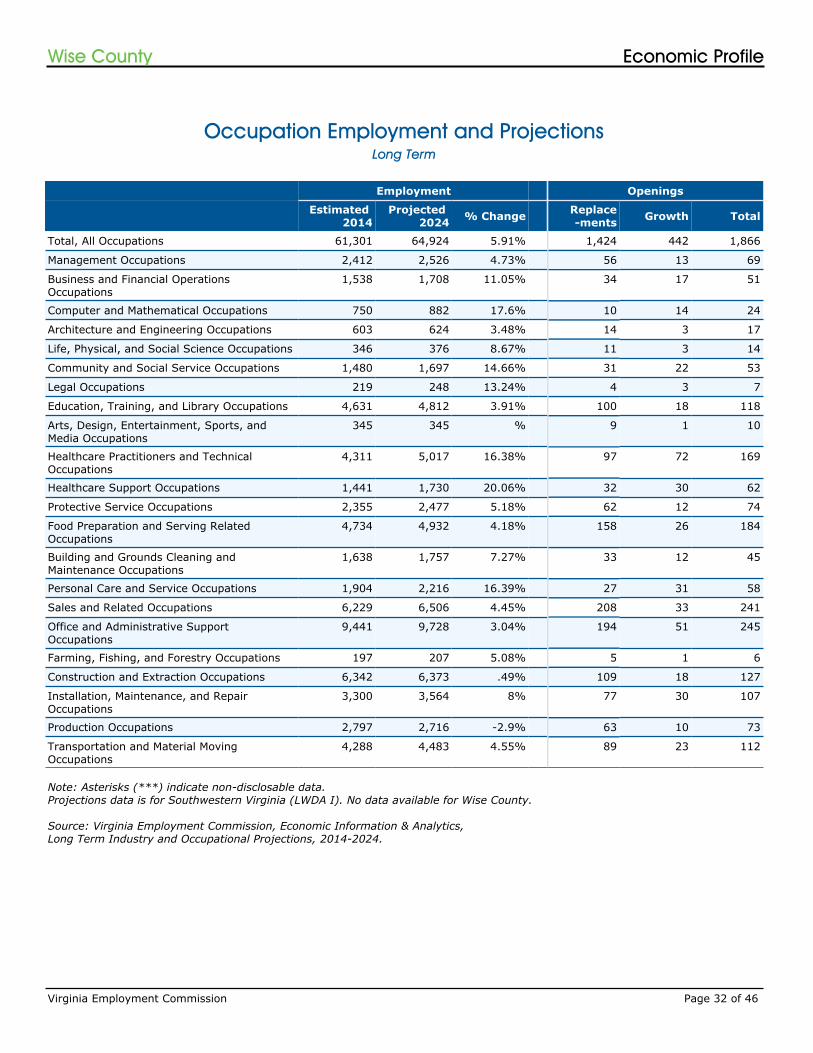
Occupation Employment and Projections
Note: Asterisks (***) indicate non-disclosable data.Projections data is for Southwestern Virginia (LWDA I). No data available for Wise County.
Source: Virginia Employment Commission, Economic Information & Analytics,Long Term Industry and Occupational Projections, 2014-2024.
Employment Openings
Estimated 2014
Projected 2024 % Change Replace
-ments Growth Total
Total, All Occupations 61,301 64,924 5.91% 1,424 442 1,866
Management Occupations 2,412 2,526 4.73% 56 13 69
Business and Financial Operations Occupations
1,538 1,708 11.05% 34 17 51
Computer and Mathematical Occupations 750 882 17.6% 10 14 24
Architecture and Engineering Occupations 603 624 3.48% 14 3 17
Life, Physical, and Social Science Occupations 346 376 8.67% 11 3 14
Community and Social Service Occupations 1,480 1,697 14.66% 31 22 53
Legal Occupations 219 248 13.24% 4 3 7
Education, Training, and Library Occupations 4,631 4,812 3.91% 100 18 118
Arts, Design, Entertainment, Sports, and Media Occupations
345 345 % 9 1 10
Healthcare Practitioners and Technical Occupations
4,311 5,017 16.38% 97 72 169
Healthcare Support Occupations 1,441 1,730 20.06% 32 30 62
Protective Service Occupations 2,355 2,477 5.18% 62 12 74
Food Preparation and Serving Related Occupations
4,734 4,932 4.18% 158 26 184
Building and Grounds Cleaning and Maintenance Occupations
1,638 1,757 7.27% 33 12 45
Personal Care and Service Occupations 1,904 2,216 16.39% 27 31 58
Sales and Related Occupations 6,229 6,506 4.45% 208 33 241
Office and Administrative Support Occupations
9,441 9,728 3.04% 194 51 245
Farming, Fishing, and Forestry Occupations 197 207 5.08% 5 1 6
Construction and Extraction Occupations 6,342 6,373 .49% 109 18 127
Installation, Maintenance, and Repair Occupations
3,300 3,564 8% 77 30 107
Production Occupations 2,797 2,716 -2.9% 63 10 73
Transportation and Material Moving Occupations
4,288 4,483 4.55% 89 23 112
Long Term
Virginia Employment Commission Page 32 of 46
Economic ProfileWise County
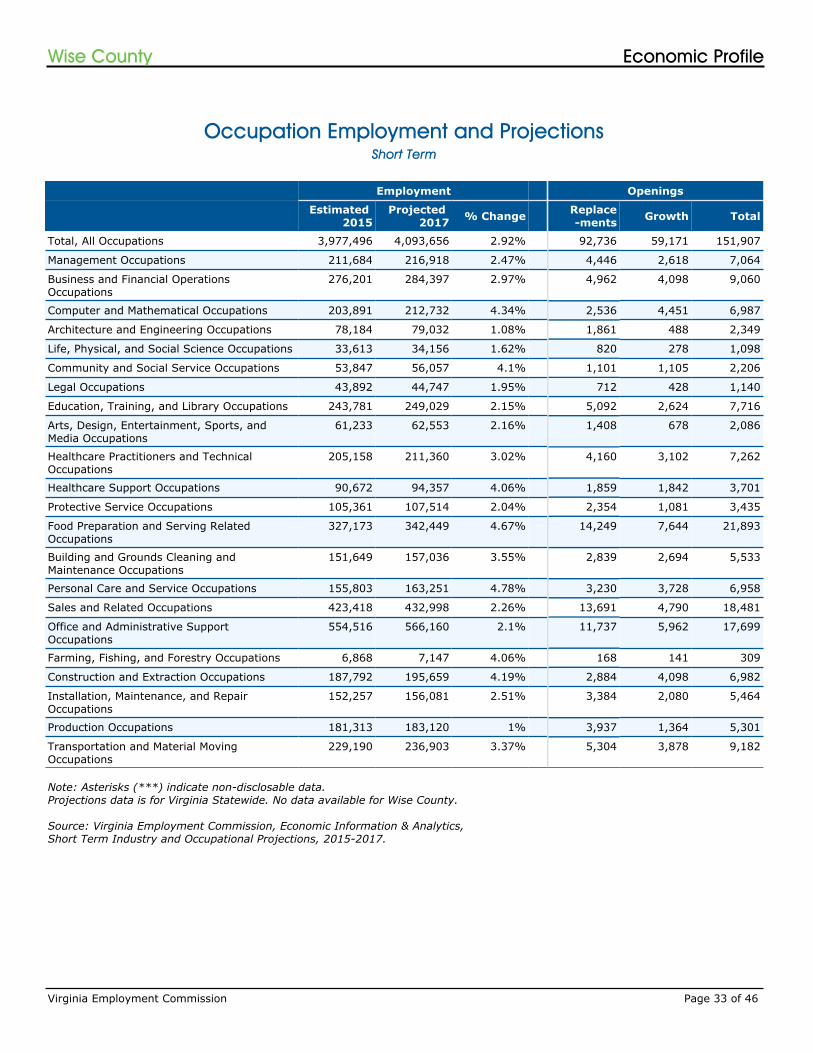
Occupation Employment and Projections
Note: Asterisks (***) indicate non-disclosable data.Projections data is for Virginia Statewide. No data available for Wise County.
Source: Virginia Employment Commission, Economic Information & Analytics,Short Term Industry and Occupational Projections, 2015-2017.
Employment Openings
Estimated 2015
Projected 2017 % Change Replace
-ments Growth Total
Total, All Occupations 3,977,496 4,093,656 2.92% 92,736 59,171 151,907
Management Occupations 211,684 216,918 2.47% 4,446 2,618 7,064
Business and Financial Operations Occupations
276,201 284,397 2.97% 4,962 4,098 9,060
Computer and Mathematical Occupations 203,891 212,732 4.34% 2,536 4,451 6,987
Architecture and Engineering Occupations 78,184 79,032 1.08% 1,861 488 2,349
Life, Physical, and Social Science Occupations 33,613 34,156 1.62% 820 278 1,098
Community and Social Service Occupations 53,847 56,057 4.1% 1,101 1,105 2,206
Legal Occupations 43,892 44,747 1.95% 712 428 1,140
Education, Training, and Library Occupations 243,781 249,029 2.15% 5,092 2,624 7,716
Arts, Design, Entertainment, Sports, and Media Occupations
61,233 62,553 2.16% 1,408 678 2,086
Healthcare Practitioners and Technical Occupations
205,158 211,360 3.02% 4,160 3,102 7,262
Healthcare Support Occupations 90,672 94,357 4.06% 1,859 1,842 3,701
Protective Service Occupations 105,361 107,514 2.04% 2,354 1,081 3,435
Food Preparation and Serving Related Occupations
327,173 342,449 4.67% 14,249 7,644 21,893
Building and Grounds Cleaning and Maintenance Occupations
151,649 157,036 3.55% 2,839 2,694 5,533
Personal Care and Service Occupations 155,803 163,251 4.78% 3,230 3,728 6,958
Sales and Related Occupations 423,418 432,998 2.26% 13,691 4,790 18,481
Office and Administrative Support Occupations
554,516 566,160 2.1% 11,737 5,962 17,699
Farming, Fishing, and Forestry Occupations 6,868 7,147 4.06% 168 141 309
Construction and Extraction Occupations 187,792 195,659 4.19% 2,884 4,098 6,982
Installation, Maintenance, and Repair Occupations
152,257 156,081 2.51% 3,384 2,080 5,464
Production Occupations 181,313 183,120 1% 3,937 1,364 5,301
Transportation and Material Moving Occupations
229,190 236,903 3.37% 5,304 3,878 9,182
Short Term
Virginia Employment Commission Page 33 of 46
Economic ProfileWise County
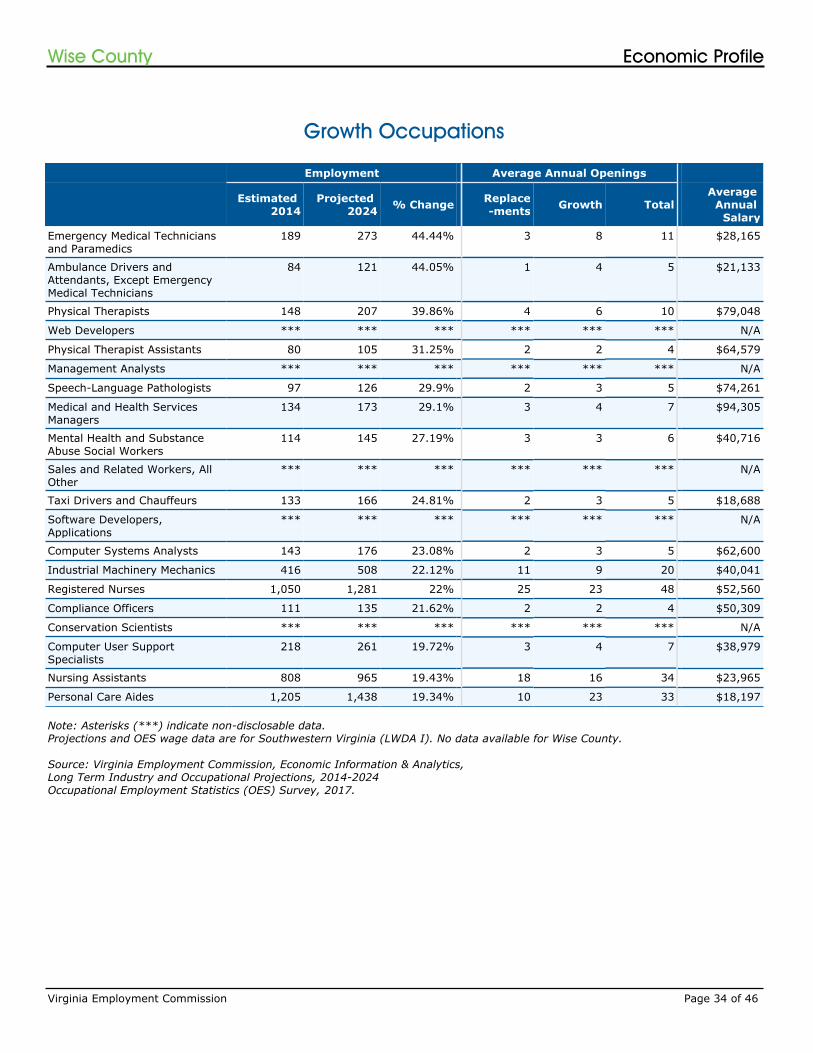
Growth Occupations
Note: Asterisks (***) indicate non-disclosable data.Projections and OES wage data are for Southwestern Virginia (LWDA I). No data available for Wise County.
Source: Virginia Employment Commission, Economic Information & Analytics,Long Term Industry and Occupational Projections, 2014-2024Occupational Employment Statistics (OES) Survey, 2017.
Employment Average Annual Openings
Estimated 2014
Projected 2024 % Change Replace
-ments Growth TotalAverage
Annual Salary
Emergency Medical Technicians and Paramedics
189 273 44.44% 3 8 11 $28,165
Ambulance Drivers and Attendants, Except Emergency Medical Technicians
84 121 44.05% 1 4 5 $21,133
Physical Therapists 148 207 39.86% 4 6 10 $79,048
Web Developers *** *** *** *** *** *** N/A
Physical Therapist Assistants 80 105 31.25% 2 2 4 $64,579
Management Analysts *** *** *** *** *** *** N/A
Speech-Language Pathologists 97 126 29.9% 2 3 5 $74,261
Medical and Health Services Managers
134 173 29.1% 3 4 7 $94,305
Mental Health and Substance Abuse Social Workers
114 145 27.19% 3 3 6 $40,716
Sales and Related Workers, All Other
*** *** *** *** *** *** N/A
Taxi Drivers and Chauffeurs 133 166 24.81% 2 3 5 $18,688
Software Developers, Applications
*** *** *** *** *** *** N/A
Computer Systems Analysts 143 176 23.08% 2 3 5 $62,600
Industrial Machinery Mechanics 416 508 22.12% 11 9 20 $40,041
Registered Nurses 1,050 1,281 22% 25 23 48 $52,560
Compliance Officers 111 135 21.62% 2 2 4 $50,309
Conservation Scientists *** *** *** *** *** *** N/A
Computer User Support Specialists
218 261 19.72% 3 4 7 $38,979
Nursing Assistants 808 965 19.43% 18 16 34 $23,965
Personal Care Aides 1,205 1,438 19.34% 10 23 33 $18,197
Virginia Employment Commission Page 34 of 46
Economic ProfileWise County
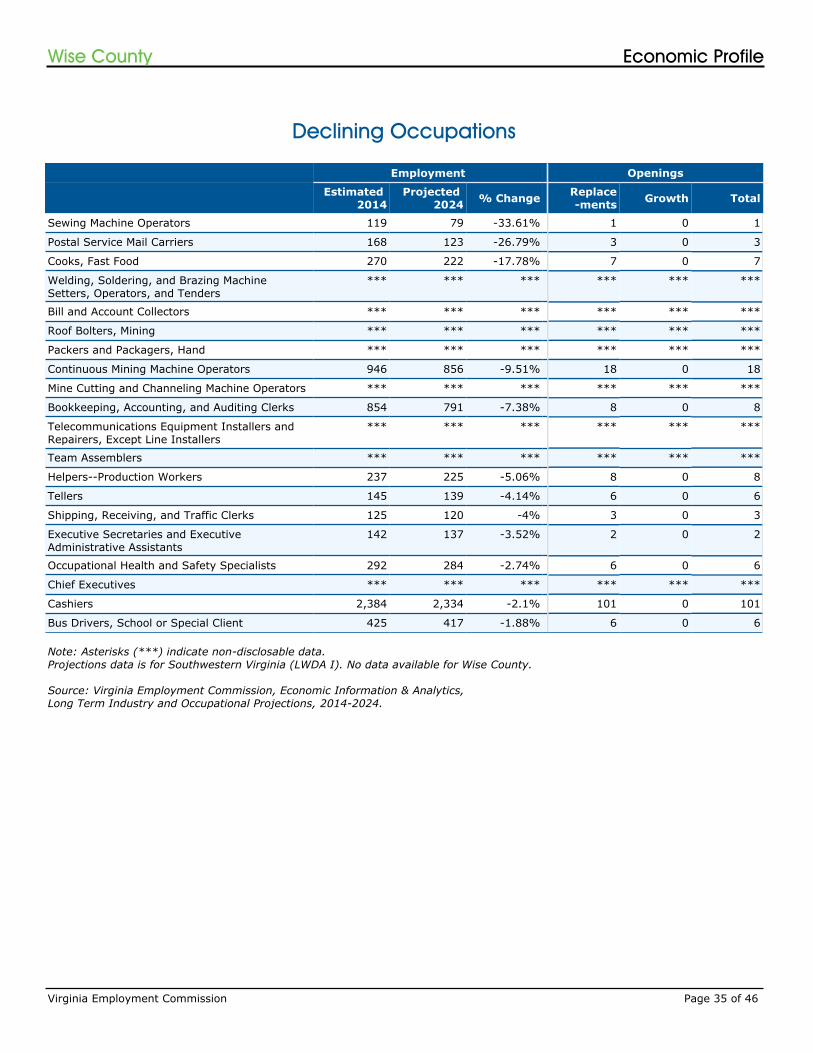
Declining Occupations
Note: Asterisks (***) indicate non-disclosable data.Projections data is for Southwestern Virginia (LWDA I). No data available for Wise County.
Source: Virginia Employment Commission, Economic Information & Analytics,Long Term Industry and Occupational Projections, 2014-2024.
Employment Openings
Estimated 2014
Projected 2024 % Change Replace
-ments Growth Total
Sewing Machine Operators 119 79 -33.61% 1 0 1
Postal Service Mail Carriers 168 123 -26.79% 3 0 3
Cooks, Fast Food 270 222 -17.78% 7 0 7
Welding, Soldering, and Brazing Machine Setters, Operators, and Tenders
*** *** *** *** *** ***
Bill and Account Collectors *** *** *** *** *** ***
Roof Bolters, Mining *** *** *** *** *** ***
Packers and Packagers, Hand *** *** *** *** *** ***
Continuous Mining Machine Operators 946 856 -9.51% 18 0 18
Mine Cutting and Channeling Machine Operators *** *** *** *** *** ***
Bookkeeping, Accounting, and Auditing Clerks 854 791 -7.38% 8 0 8
Telecommunications Equipment Installers and Repairers, Except Line Installers
*** *** *** *** *** ***
Team Assemblers *** *** *** *** *** ***
Helpers--Production Workers 237 225 -5.06% 8 0 8
Tellers 145 139 -4.14% 6 0 6
Shipping, Receiving, and Traffic Clerks 125 120 -4% 3 0 3
Executive Secretaries and Executive Administrative Assistants
142 137 -3.52% 2 0 2
Occupational Health and Safety Specialists 292 284 -2.74% 6 0 6
Chief Executives *** *** *** *** *** ***
Cashiers 2,384 2,334 -2.1% 101 0 101
Bus Drivers, School or Special Client 425 417 -1.88% 6 0 6
Virginia Employment Commission Page 35 of 46
Economic ProfileWise County
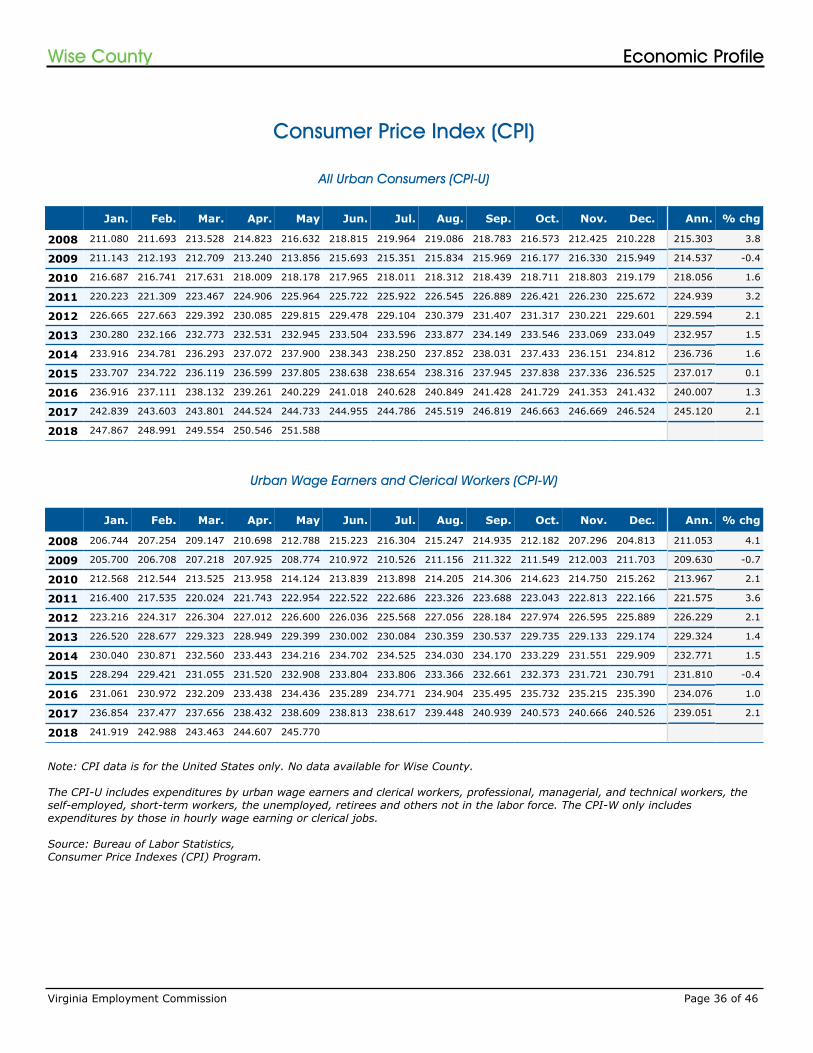
Consumer Price Index (CPI)
Note: CPI data is for the United States only. No data available for Wise County.
The CPI-U includes expenditures by urban wage earners and clerical workers, professional, managerial, and technical workers, the self-employed, short-term workers, the unemployed, retirees and others not in the labor force. The CPI-W only includes expenditures by those in hourly wage earning or clerical jobs.
Source: Bureau of Labor Statistics,Consumer Price Indexes (CPI) Program.
Jan. Feb. Mar. Apr. May Jun. Jul. Aug. Sep. Oct. Nov. Dec. Ann. % chg
2008 211.080 211.693 213.528 214.823 216.632 218.815 219.964 219.086 218.783 216.573 212.425 210.228 215.303 3.8
2009 211.143 212.193 212.709 213.240 213.856 215.693 215.351 215.834 215.969 216.177 216.330 215.949 214.537 -0.4
2010 216.687 216.741 217.631 218.009 218.178 217.965 218.011 218.312 218.439 218.711 218.803 219.179 218.056 1.6
2011 220.223 221.309 223.467 224.906 225.964 225.722 225.922 226.545 226.889 226.421 226.230 225.672 224.939 3.2
2012 226.665 227.663 229.392 230.085 229.815 229.478 229.104 230.379 231.407 231.317 230.221 229.601 229.594 2.1
2013 230.280 232.166 232.773 232.531 232.945 233.504 233.596 233.877 234.149 233.546 233.069 233.049 232.957 1.5
2014 233.916 234.781 236.293 237.072 237.900 238.343 238.250 237.852 238.031 237.433 236.151 234.812 236.736 1.6
2015 233.707 234.722 236.119 236.599 237.805 238.638 238.654 238.316 237.945 237.838 237.336 236.525 237.017 0.1
2016 236.916 237.111 238.132 239.261 240.229 241.018 240.628 240.849 241.428 241.729 241.353 241.432 240.007 1.3
2017 242.839 243.603 243.801 244.524 244.733 244.955 244.786 245.519 246.819 246.663 246.669 246.524 245.120 2.1
2018 247.867 248.991 249.554 250.546 251.588
All Urban Consumers (CPI-U)
Urban Wage Earners and Clerical Workers (CPI-W)
Jan. Feb. Mar. Apr. May Jun. Jul. Aug. Sep. Oct. Nov. Dec. Ann. % chg
2008 206.744 207.254 209.147 210.698 212.788 215.223 216.304 215.247 214.935 212.182 207.296 204.813 211.053 4.1
2009 205.700 206.708 207.218 207.925 208.774 210.972 210.526 211.156 211.322 211.549 212.003 211.703 209.630 -0.7
2010 212.568 212.544 213.525 213.958 214.124 213.839 213.898 214.205 214.306 214.623 214.750 215.262 213.967 2.1
2011 216.400 217.535 220.024 221.743 222.954 222.522 222.686 223.326 223.688 223.043 222.813 222.166 221.575 3.6
2012 223.216 224.317 226.304 227.012 226.600 226.036 225.568 227.056 228.184 227.974 226.595 225.889 226.229 2.1
2013 226.520 228.677 229.323 228.949 229.399 230.002 230.084 230.359 230.537 229.735 229.133 229.174 229.324 1.4
2014 230.040 230.871 232.560 233.443 234.216 234.702 234.525 234.030 234.170 233.229 231.551 229.909 232.771 1.5
2015 228.294 229.421 231.055 231.520 232.908 233.804 233.806 233.366 232.661 232.373 231.721 230.791 231.810 -0.4
2016 231.061 230.972 232.209 233.438 234.436 235.289 234.771 234.904 235.495 235.732 235.215 235.390 234.076 1.0
2017 236.854 237.477 237.656 238.432 238.609 238.813 238.617 239.448 240.939 240.573 240.666 240.526 239.051 2.1
2018 241.919 242.988 243.463 244.607 245.770
Virginia Employment Commission Page 36 of 46
Economic ProfileWise County
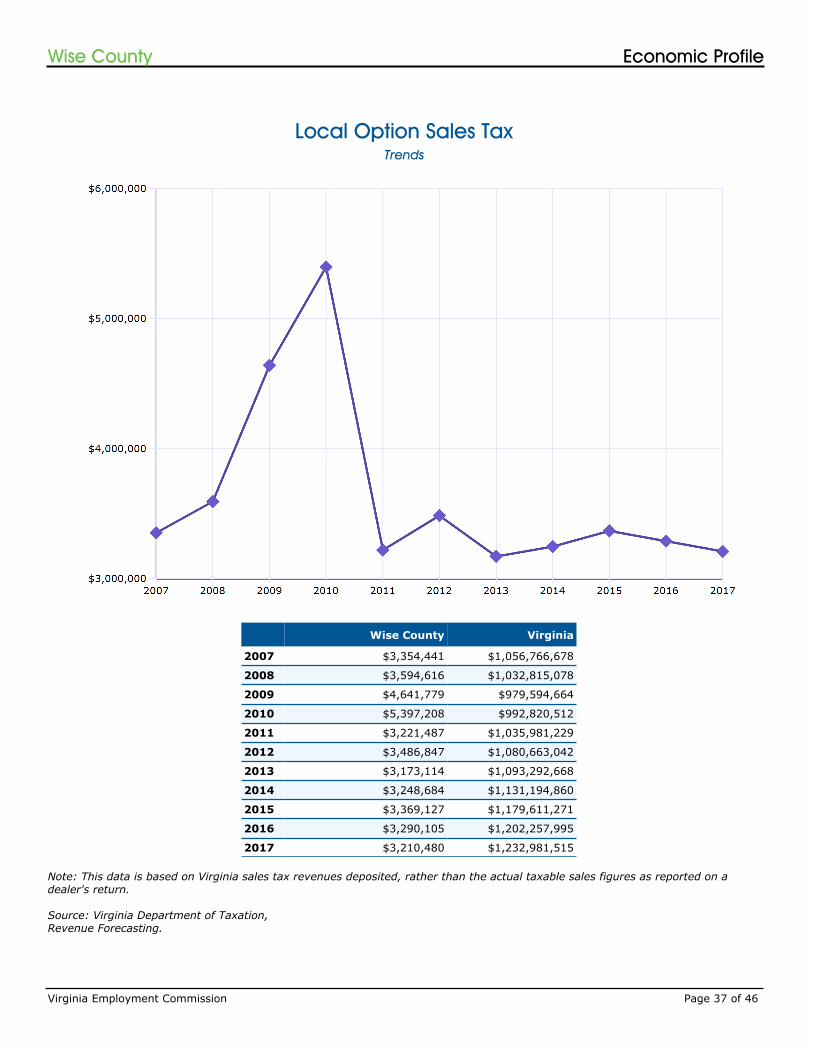
Local Option Sales Tax
Wise County Virginia
2007 $3,354,441 $1,056,766,678
2008 $3,594,616 $1,032,815,078
2009 $4,641,779 $979,594,664
2010 $5,397,208 $992,820,512
2011 $3,221,487 $1,035,981,229
2012 $3,486,847 $1,080,663,042
2013 $3,173,114 $1,093,292,668
2014 $3,248,684 $1,131,194,860
2015 $3,369,127 $1,179,611,271
2016 $3,290,105 $1,202,257,995
2017 $3,210,480 $1,232,981,515
Note: This data is based on Virginia sales tax revenues deposited, rather than the actual taxable sales figures as reported on a dealer's return.
Source: Virginia Department of Taxation,Revenue Forecasting.
Trends
Virginia Employment Commission Page 37 of 46
Economic ProfileWise County
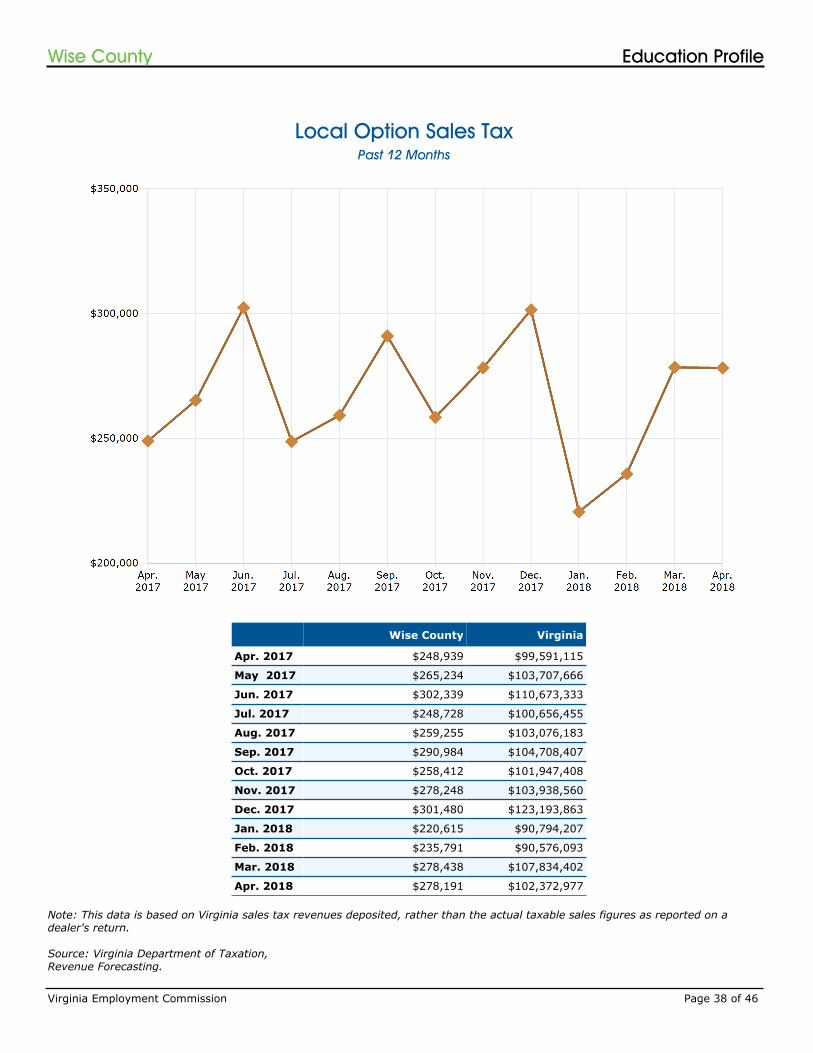
Local Option Sales Tax
Note: This data is based on Virginia sales tax revenues deposited, rather than the actual taxable sales figures as reported on a dealer's return.
Source: Virginia Department of Taxation,Revenue Forecasting.
Past 12 Months
Wise County Virginia
Apr. 2017 $248,939 $99,591,115
May 2017 $265,234 $103,707,666
Jun. 2017 $302,339 $110,673,333
Jul. 2017 $248,728 $100,656,455
Aug. 2017 $259,255 $103,076,183
Sep. 2017 $290,984 $104,708,407
Oct. 2017 $258,412 $101,947,408
Nov. 2017 $278,248 $103,938,560
Dec. 2017 $301,480 $123,193,863
Jan. 2018 $220,615 $90,794,207
Feb. 2018 $235,791 $90,576,093
Mar. 2018 $278,438 $107,834,402
Apr. 2018 $278,191 $102,372,977
Virginia Employment Commission Page 38 of 46
Education ProfileWise County

IV. Education Profile
The Education Profile for Wise County provides an assortment of data collected from the United States Census Bureau and the National Center for Education Statistics (NCES).
Related Terms and DefinitionsOverview
Associate's degreeAn award that normally requires at least two but less than four years of full-time equivalent college work.
Bachelor's degreeAn award that normally requires at least four but not more than five years of full-time equivalent college-level work.
Post-baccalaureate certificateAn award that requires completion of an organized program of study equivalent to 18 semester credit hours beyond the bachelor's. It is designed for persons who have completed a bachelor's degree, but do not meet the requirements of a master’s degree.
Master's degreeAn award that requires the successful completion of a program of study of at least the full-time equivalent of one but not more than two academic years of work beyond the bachelor's degree.
Post-master's certificateAn award that requires completion of an organized program of study equivalent to 24 semester credit hours beyond the master's degree, but does not meet the requirements of academic degrees at the doctor's level.
Doctor's degreeThe highest award a student can earn for graduate study.
First-professional degreeAn award that requires completion of a program that meets all of the following criteria: (1) completion of the academic requirements to begin practice in the profession; (2) at least two years of college work prior to entering the program; and (3) a total of at least six academic years of college work to complete the degree program, including prior required college work plus the length of the professional program itself.
Virginia Employment Commission Page 39 of 46
Education ProfileWise County
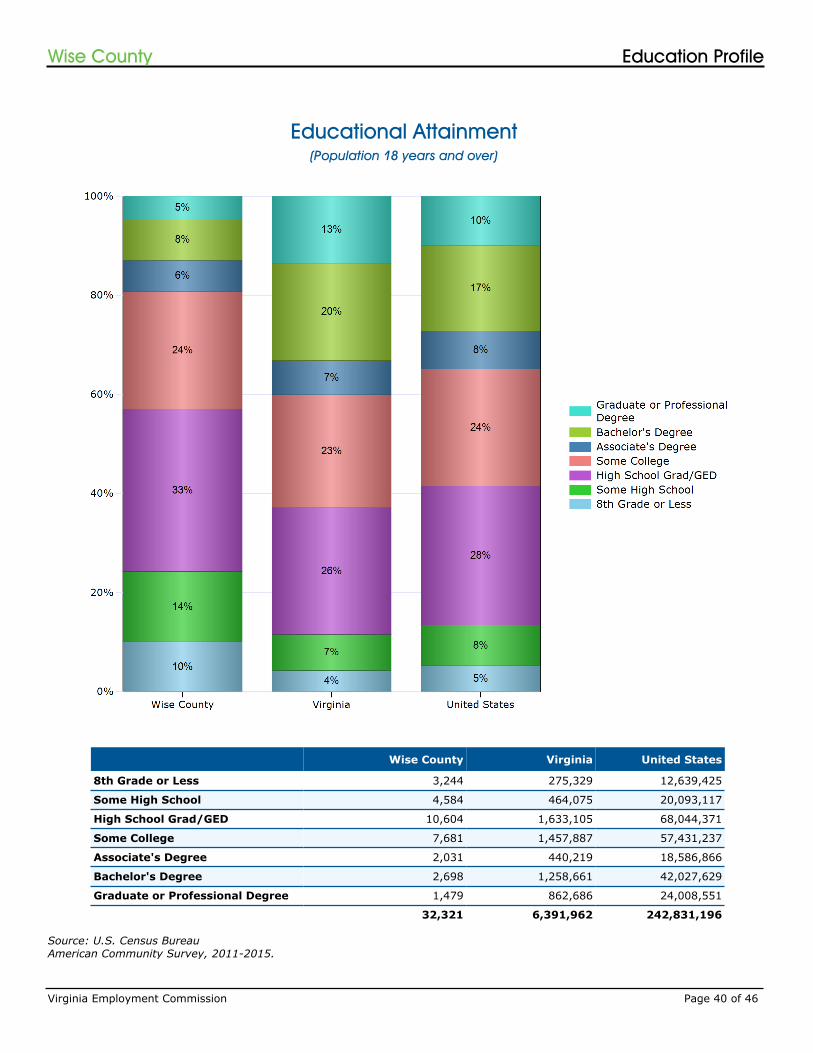
Educational Attainment
Source: U.S. Census BureauAmerican Community Survey, 2011-2015.
(Population 18 years and over)
Wise County Virginia United States
8th Grade or Less 3,244 275,329 12,639,425
Some High School 4,584 464,075 20,093,117
High School Grad/GED 10,604 1,633,105 68,044,371
Some College 7,681 1,457,887 57,431,237
Associate's Degree 2,031 440,219 18,586,866
Bachelor's Degree 2,698 1,258,661 42,027,629
Graduate or Professional Degree 1,479 862,686 24,008,551
32,321 6,391,962 242,831,196
Virginia Employment Commission Page 40 of 46
Education ProfileWise County
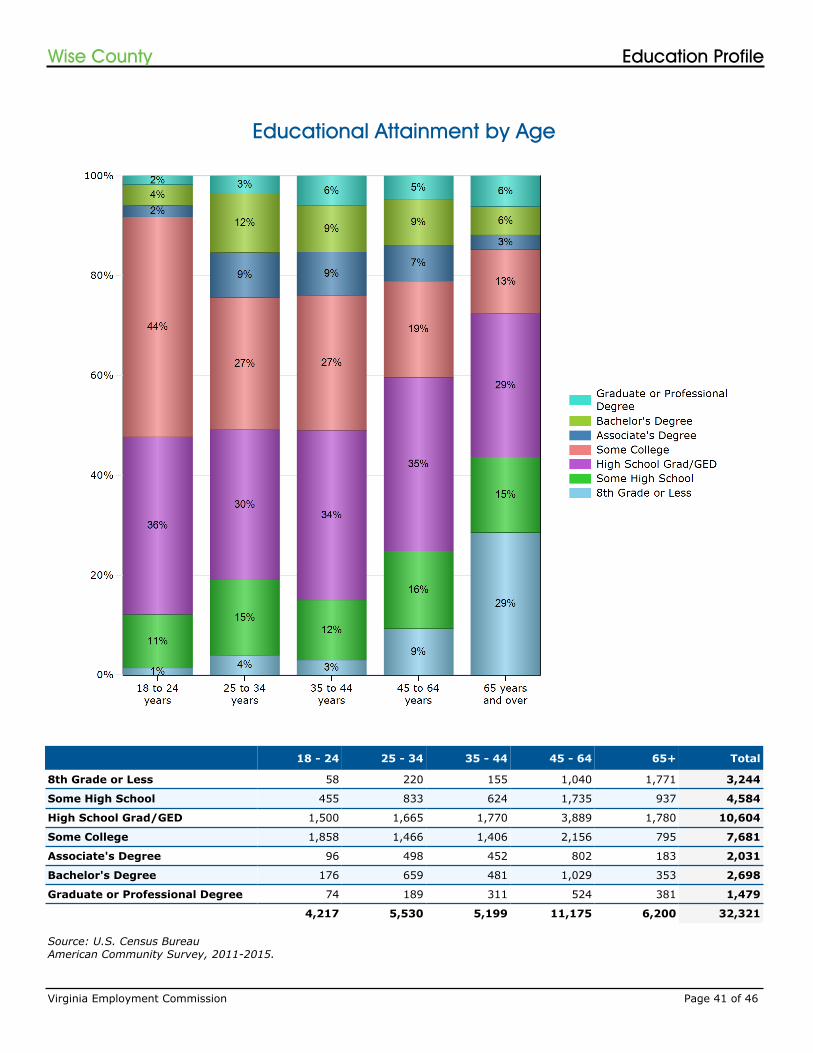
Educational Attainment by Age
18 - 24 25 - 34 35 - 44 45 - 64 65+ Total
8th Grade or Less 58 220 155 1,040 1,771 3,244
Some High School 455 833 624 1,735 937 4,584
High School Grad/GED 1,500 1,665 1,770 3,889 1,780 10,604
Some College 1,858 1,466 1,406 2,156 795 7,681
Associate's Degree 96 498 452 802 183 2,031
Bachelor's Degree 176 659 481 1,029 353 2,698
Graduate or Professional Degree 74 189 311 524 381 1,479
4,217 5,530 5,199 11,175 6,200 32,321
Source: U.S. Census BureauAmerican Community Survey, 2011-2015.
Virginia Employment Commission Page 41 of 46
Education ProfileWise County
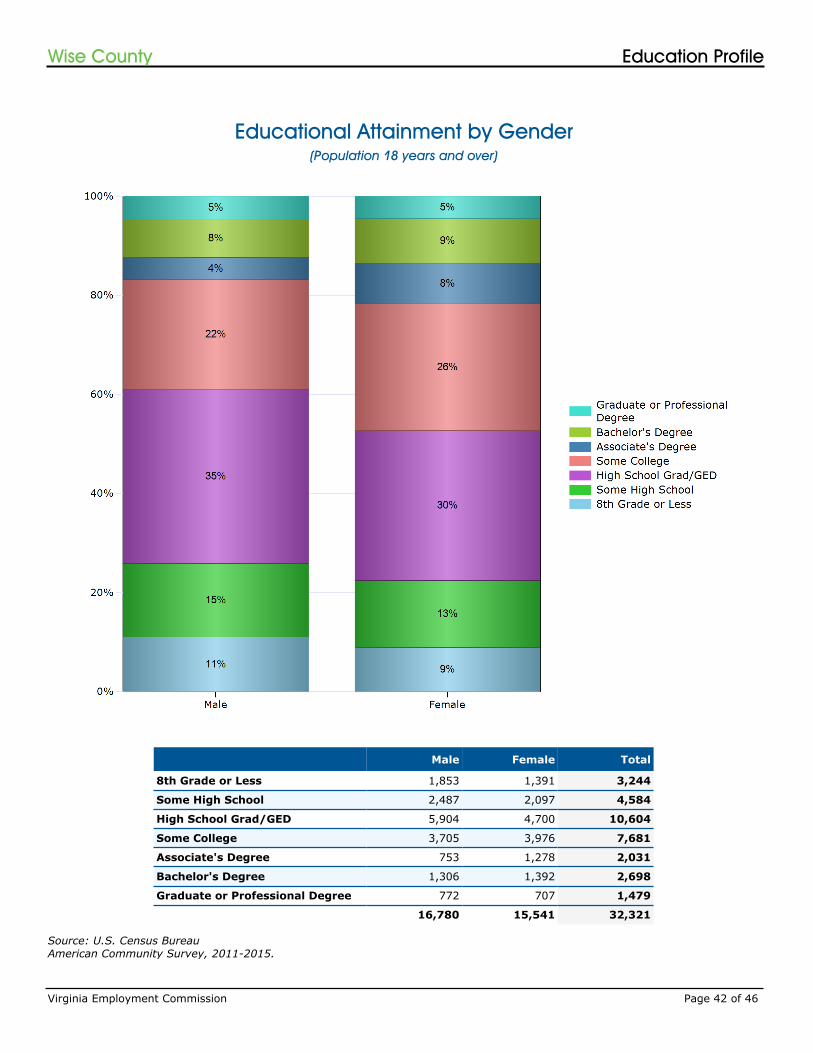
Educational Attainment by Gender
Source: U.S. Census BureauAmerican Community Survey, 2011-2015.
(Population 18 years and over)
Male Female Total
8th Grade or Less 1,853 1,391 3,244
Some High School 2,487 2,097 4,584
High School Grad/GED 5,904 4,700 10,604
Some College 3,705 3,976 7,681
Associate's Degree 753 1,278 2,031
Bachelor's Degree 1,306 1,392 2,698
Graduate or Professional Degree 772 707 1,479
16,780 15,541 32,321
Virginia Employment Commission Page 42 of 46
Education ProfileWise County

Educational Attainment by Race/Ethnicity
Less than high school diploma
High school grad, GED, or
alternative
Some college or associate's
degree
Bachelor's degree or
higherTotal
Race
White 6,438 8,436 7,484 3,762 26,120
Black or African American 698 576 204 48 1,526
American Indian or Alaska Native 15 11 0 0 26
Asian 4 15 22 76 117
Native Hawaiian/Pacific Islander 0 0 0 0 0
Other 17 16 29 6 68
Multiple Races 143 50 19 35 247
Ethnicity
Hispanic or Latino (of any race) 81 62 63 53 259
7,396 9,166 7,821 3,980 28,363
(Population 25 years and over)
Source: U.S. Census BureauAmerican Community Survey, 2011-2015.
Virginia Employment Commission Page 43 of 46
Education ProfileWise County
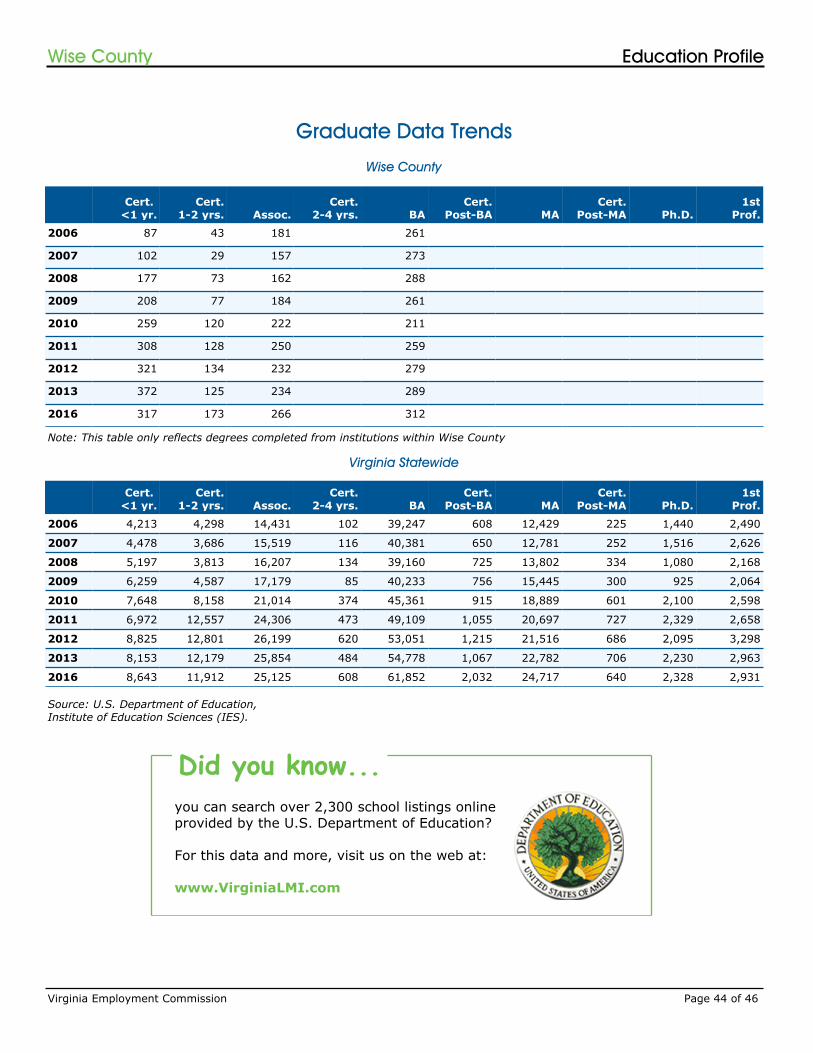
Graduate Data Trends
Cert. <1 yr.
Cert.1-2 yrs. Assoc.
Cert.2-4 yrs. BA
Cert.Post-BA MA
Cert.Post-MA Ph.D.
1stProf.
2006 87 43 181 261
2007 102 29 157 273
2008 177 73 162 288
2009 208 77 184 261
2010 259 120 222 211
2011 308 128 250 259
2012 321 134 232 279
2013 372 125 234 289
2016 317 173 266 312
Source: U.S. Department of Education,Institute of Education Sciences (IES).
Wise County
Cert. <1 yr.
Cert.1-2 yrs. Assoc.
Cert.2-4 yrs. BA
Cert.Post-BA MA
Cert.Post-MA Ph.D.
1stProf.
2006 4,213 4,298 14,431 102 39,247 608 12,429 225 1,440 2,490
2007 4,478 3,686 15,519 116 40,381 650 12,781 252 1,516 2,626
2008 5,197 3,813 16,207 134 39,160 725 13,802 334 1,080 2,168
2009 6,259 4,587 17,179 85 40,233 756 15,445 300 925 2,064
2010 7,648 8,158 21,014 374 45,361 915 18,889 601 2,100 2,598
2011 6,972 12,557 24,306 473 49,109 1,055 20,697 727 2,329 2,658
2012 8,825 12,801 26,199 620 53,051 1,215 21,516 686 2,095 3,298
2013 8,153 12,179 25,854 484 54,778 1,067 22,782 706 2,230 2,963
2016 8,643 11,912 25,125 608 61,852 2,032 24,717 640 2,328 2,931
Virginia Statewide
Note: This table only reflects degrees completed from institutions within Wise County
you can search over 2,300 school listings online provided by the U.S. Department of Education?
For this data and more, visit us on the web at:
www.VirginiaLMI.com
Did you know...
Virginia Employment Commission Page 44 of 46
Education ProfileWise County
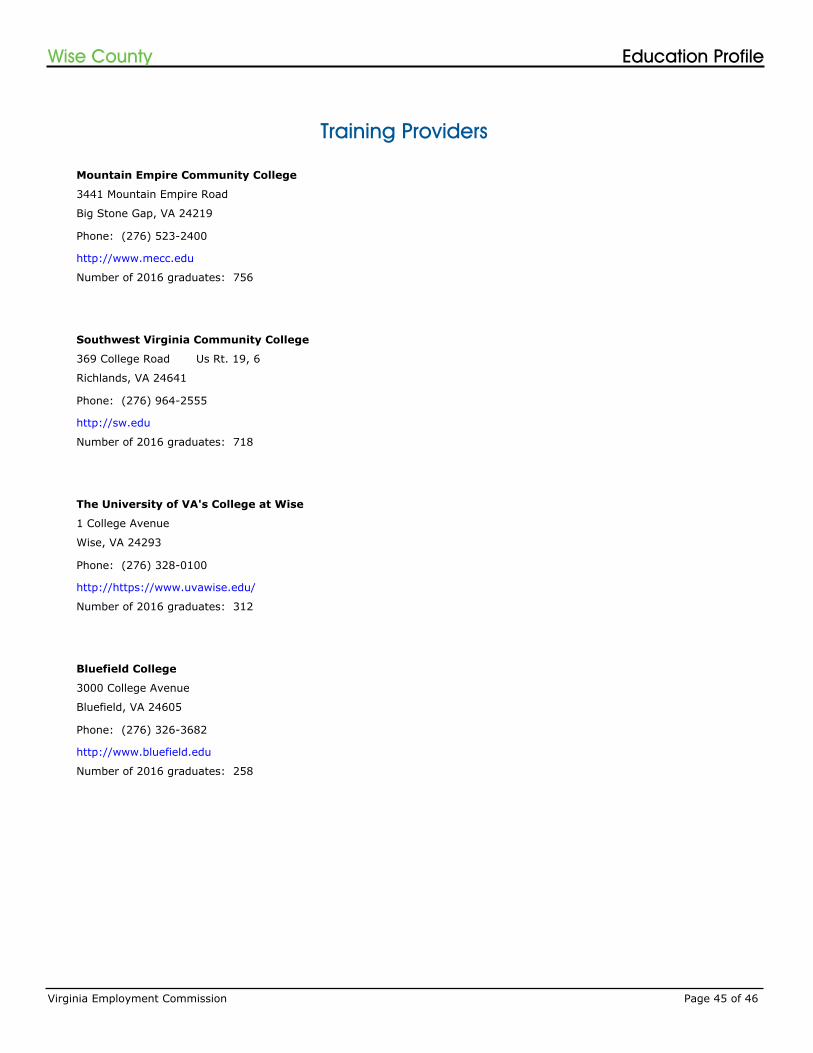
Training Providers
Mountain Empire Community College
3441 Mountain Empire Road
Big Stone Gap, VA 24219
Phone: (276) 523-2400
http://www.mecc.edu
Number of 2016 graduates: 756
Southwest Virginia Community College
369 College Road Us Rt. 19, 6
Richlands, VA 24641
Phone: (276) 964-2555
http://sw.edu
Number of 2016 graduates: 718
The University of VA's College at Wise
1 College Avenue
Wise, VA 24293
Phone: (276) 328-0100
http://https://www.uvawise.edu/
Number of 2016 graduates: 312
Bluefield College
3000 College Avenue
Bluefield, VA 24605
Phone: (276) 326-3682
http://www.bluefield.edu
Number of 2016 graduates: 258
Virginia Employment Commission Page 45 of 46
Education ProfileWise County

Source: U.S. Department of Education,Institute of Education Sciences (IES), 2016.
Appalachian School of Law
1169 Edgewater Drive
Grundy, VA 24614
Phone: (276) 935-4349 ext. 1231
http://www.asl.edu
Number of 2016 graduates: 82
Virginia Employment Commission Page 46 of 46
Education ProfileWise County