Embed Size (px)
Citation preview

Virginia Employment Commission report to
The Commission on Unemployment CompensationJames Ellenberger, Deputy CommissionerVirginia Employment CommissionJuly 27, 2005

VEC Trust Fund

Virginia’s Unemployment Rates2003 - 2005 (year to date)
Since October 2003, all unemployment rates have been at or below year-ago rates. 0
0.5
1
1.5
2
2.5
3
3.5
4
4.5
5
jan feb mar apr may jun jul aug sept oct nov dec
2003 2004 2005
Perce
nt of
Labo
r For
ce

UI Initial Claims2003 - 2005 (year to date)
Total initial claims through May this year are down 15.2% because of fewer temporary factory furloughs and generally improving economy. For the same period, initial claims are down 41.3% from 2003.
0
10,000
20,000
30,000
40,000
50,000
60,000
jan feb mar apr may jun jul aug sep oct nov dec
2003 2004 2005

UI First Payments2003 - 2005 (year to date)
A claimant can receive only one first payment in his benefit year; so first payments are a good proxy for the number of claimants receiving unemployment benefits.Through May, first payments are down 11.8% from last year and 36.5% from 2003.The average duration in May was 12.6 weeks, below last May’s 14.1 weeks.
0
5,000
10,000
15,000
20,000
25,000
30,000
35,000
jan feb mar apr may jun jul aug sep oct nov dec
2003 2004 2005

UI Final Payments2003 - 2005 (year to date)
For the first five months of 2005, final payments are down 20.9% from 2004 and 42% from 2003.The exhaustion rate in May was 33.3%, down from last May’s 36.1%.
0
1,000
2,000
3,000
4,000
5,000
6,000
7,000
8,000
jan feb mar apr may jun jul aug sep oct nov dec
2003 2004 2005

2005 Maximum Weekly BenefitFourth Circuit
$359$310 $292
$330$366
$346
$426
$0$50
$100$150$200
$250$300$350
$400$450
DC MD NC SC VA WV USAvg.

2005 Maximum Weekly Benefit Replacement RateFourth Circuit
32%40%
49% 47%
65%
44%
65%
0%
10%
20%
30%
40%
50%
60%
70%
DC MD NC SC VA WV USAvg.

Previousyear
(2003) This year (2005)Last year (2004)
JulAugSep
OctNovDec
JulAugSep
AprMayJun
JanFebMar
OctNovDec
JulAugSep
JulAugSep
AprMayJun
JanFebMar
OctNovDec
AprMayJun
OctNovDec
JanFebMar
AprMayJun
JulAugSep
AprMayJun
JanFebMar
JanFebMar
OctNovDec
JulAugSep
AprMayJun
JanFebMar
OctNovDec
Base Period4th Quarter of Alternate Base Period
If the effective date of claim is in:
Base Period Explained
UI Benefits
Benefits determined by earnings in the first 4 of last 5 completed quarters. This is called the base period.
Effective July 6, 2003, for those claimants who do not qualify under the standard base period, alternate base period, consisting of the 4 most recent quarters, is used to determine eligibility.
Otherwise eligible claimants are not paid for the first week of unemployment. This is called the waiting week.
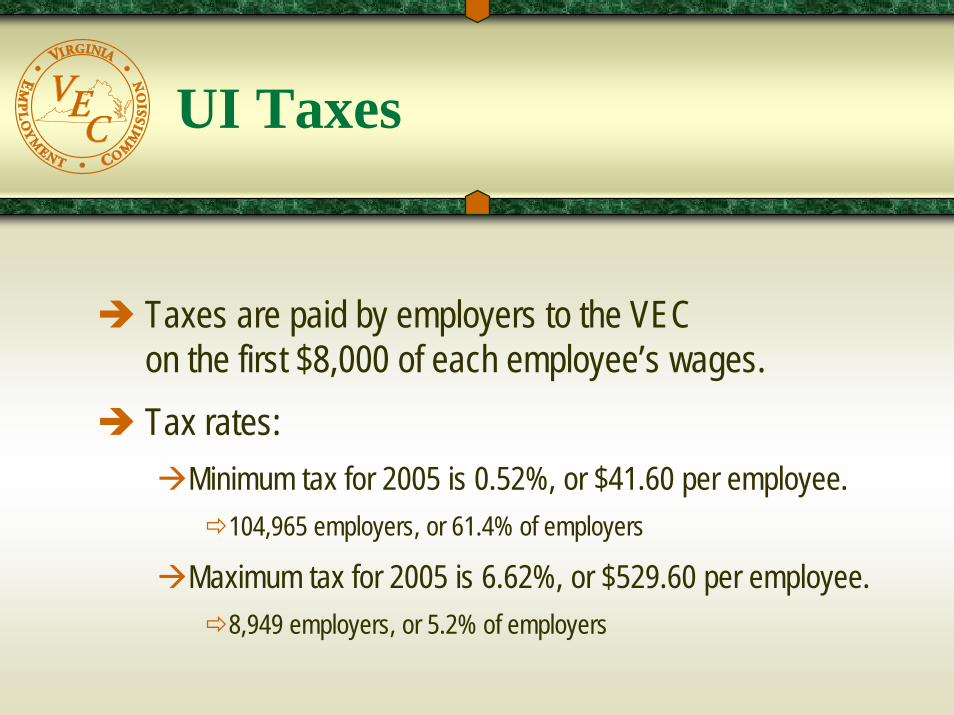
UI Taxes
Taxes are paid by employers to the VEC on the first $8,000 of each employee’s wages.Tax rates:
Minimum tax for 2005 is 0.52%, or $41.60 per employee.104,965 employers, or 61.4% of employers
Maximum tax for 2005 is 6.62%, or $529.60 per employee.8,949 employers, or 5.2% of employers

UI Taxes
Individual employer’s tax rate based on:Trust Fund solvency level that determines which of 15 tax tables is used.Employer’s experience over last 4 years.
Two surtaxes can also be levied:Pool tax used to recover benefits that cannot be charged to a specific employer.Fund-building tax used to push solvency over 50%.

Trust Fund SolvencyAdequate Fund Balance
Solvency = 1.38 × Average Cost Rate × Wages.1.38 represents 16.5 months of benefits with no revenue.Average Cost Rate is the average of 3 highest ratios of benefits to total wages in the past 20 years.Wages are total wages paid by taxable employers for the year ending June 30.
Solvency Level = June 30 balance ÷ Adequate Fund Balance.

Trust Fund Data(Millions of Dollars)
2004 2005January 1 Balance $200.3
$453.5$14.7
$385.3$274.3*
39.3%
$274.3Tax Revenue $546.0
Interest Revenue $21.4Benefits $360.3
December 31 Balance $481.4Solvency Level (6/30) 49.9%
Projected Actual
(Projections will be updated in December)
*$9 million in Reed Act money deducted from Trust Fund balance for FY05 and FY06 appropriations for JS and UI administration.

$0
$200
$400
$600
$800
$1,000
$1,200
1981
1982
1983
1984
1985
1986
1987
1988
1989
1990
1991
1992
1993
1994
1995
1996
1997
1998
1999
2000
2001
2002
2003
2004
2005
2006
2007
2008
When solvency drops below 50%, Fund Builder Tax is triggered the following year.(Projections will be updated in December)
2005 – 2008 projected.
22% 11% 5%
43%
77%
92%
97%97%
97% 99%
84%
69% 64%69%
79%
91%
123% 114% 107% 101% 100%
84%
46% 39%
49%
68%
79%79%
June 30 Balances (millions)and Solvency Level

Average Tax per Employee
$99$111
$148
$175
$134
$96
$75$62 $60 $57 $63
$79
$115 $115
$97
$74
$50 $48 $49 $49 $51
$140$131
$169
$162
$107
$82
$102
$0$20$40$60$80
$100$120$140$160$180$200
1981
1982
1983
1984
1985
1986
1987
1988
1989
1990
1991
1992
1993
1994
1995
1996
1997
1998
1999
2000
2001
2002
2003
2004
2005
2006
2007
2008
The increases from 2003 through 2008 are the result of higher benefit schedules and the recession.(Projections will be updated in December)
2005 – 2008 projected.Fund Builder Tax in effect.

Average Tax per EmployeeFourth Circuit – Year ending 9/30/04
$216 $221
$154
$232
$136
$275
$0
$50
$100
$150
$200
$250
$300
DC MD NC SC VA WV
Cost
per E
mpl
oyee

The Commission on Unemployment CompensationJames Ellenberger, Deputy CommissionerVirginia Employment CommissionJuly 27, 2005
Virginia Employment Commission report to

VEC Budget and Strategic Priorities
Report to the Commission on Unemployment CompensationDolores Esser, CommissionerVirginia Employment Commission
VEC Administrative Funding
Employers pay a FUTA tax to the Internal Revenue Service (FUTA is the Federal Unemployment Tax Act).
FUTA is a flat tax of 0.8% on first $7,000 of each employee’s wages, which costs $56 per employee per year.
VEC Administrative Funding(continued)
Revenue from the FUTA tax is used to pay for SESA (State Employment Security Agency) administration at both the state and national levels.Virginia’s employers paid $187.5 million in FUTA taxes in FY 2003.VEC received $66.8 million from U.S. DOL in FY 2003.

VEC Administrative Funding(continued)
FY 2003 grants of $66.8 million weredivided into:$46.0 million for UI;$16.0 million for Job Service;$4.8 million for Veterans’ Programs, Labor Market Information and Postage.

VEC Administrative Funding (by FUTA) 2003
$46.0$16.0
$4.8
UI Job Service Veterans Programs, Labor Market Information and Postage

8-Year Virginia FUTA History
0102030405060708090
100110120130140150160170180190200
1996 1997 1998 1999 2000 2001 2002 2003
Employer Paid $ (in millions) Returned to VA $ (in millions)

Summary UI/JS History & Projections
FY 03 FY 04 FY 05 FY 06 FY 07
UNEMPLOYMENT INSURANCE EXPENDITURES $47.6 $49.7 $48.1 $42.7 $43.8
UNEMPLOYMENT INSURANCE FUNDING $59.7 $48.1 $54.3 $40.0 $35.3
UI PROJECTED AVAILABILITY (DEFICIT)1 $6.2 $ (2.7) $(8.5)
PY 02 PY 03 PY 04 PY 05 PY 06
JOB SERVICE EXPENDITURES $17.9 $19.2 $19.9 $19.1 $19.2
JOB SERVICE FUNDING $18.6 $19.5 $21.4 $21.1 $17.6
JS PROJECTED AVAILABILITY (DEFICIT) $1.5 $2.0 $ (1.6)
All figures in millions of dollars

Additional Challenges
Although VITA and DRES initiatives are projected to save money over the long term, the short-term impact on the VEC has resulted in higher costs.VITA added costs of about $200,000.DRES
Roanoke office leaseNOVA leases to double in 2006 at estimated cost to VEC of $391,000

Strategic Priorities
Under the Commonwealth’s new strategic planning format, the VEC has five distinct service areas:
Job placement servicesUnemployment insurance servicesWorkforce development servicesWorkforce system organization servicesEconomic information services
These areas work in concert to provide a wide array of integrated workforce services to employers, workers, elected officials, and economic development professionals.

Strategic Priorities (continued)
The importance of this strategic alignment of services is as follows:
UI enforces “work search” test and requires claimants to register with Job ServiceJob Service seeks to match claimants to jobs listed by employersIf claimants are in need of core, or intensive services, they are provided or facilitated by the VEC and are coordinated with our One-Stop partners.Objective is to return claimants to work faster, thus, improvingtrust fund solvency and enhancing the strength of Virginia’s economy.

Strategic Priorities (continued)
Deliberations in the recent past, over how to best organize workforce services are shown as follows:
2003 JLARC Report on Workforce Training2003 HB 2617 (Sears)2004 HB 526 (Hogan)2005 HB 2626 (Byron)2005 HJR 713 – Study of Workforce Services
At the federal level, three different versions of WIA re-authorization before Congress.

Automated Systems
Critical automated systemsWage recordsTaxBenefits
All of these systems are 20+ years oldWithout major modernization of these systems, integrity of Virginia’s UI program is at riskPotential cost for replacing these systems could easily exceed $45-$50 million.

Automated Systems (continued)
Revenue sources for this type of modernization project are limited.
VEC has insufficient program fundsUSDOL has no plans to provide major automation grantsUSDOL offered possibility of loans from FUTA fundsReed Act appropriation not viable option as long as fund buildertax in effect
VEC will work with administration, the General Assembly and stakeholders to develop a viable strategy to address these issues.

The Commission on Unemployment CompensationDolores Esser, CommissionerVirginia Employment CommissionJuly 27, 2005
Virginia Employment Commission report to

Review of 2005 Legislation
Report to the Commission on Unemployment CompensationColeman Walsh, Chief Administrative Law JudgeVirginia Employment CommissionJuly 27, 2005

SUTA Dumping Detection Pilot
Report to the Commission on Unemployment CompensationNancy Broaddus, Chief of TaxVirginia Employment CommissionJuly 27, 2005

The VEC applied in 2004 to be a part of a U.S. Department of Labor pilot. The goal of the pilot was to develop software to detect employer attempts to artificially lower their UI Tax rate.

The software enables the VEC to detect:
Movement of employees from one company to anotherMultiple companies reported under one federal EINMultiple employers using the same addressMultiple companies owned by the same individualEmployer non-compliance with reporting requirementsSome types of potentially fraudulent transactions

Compliance
Attempts to artificially reduce taxes through tax schemes are sometimes seen as an acceptable business risk by employers and their representatives. The IRS and state government agencies do not have the staff to monitor compliance as they once did.
Potential Revenue is being lost to the states. Automated systems, such as the SUTA Dumping Detection System, allow states to leverage the compliance staff.

States have different laws but . . .
One of the goals of the pilot was to incorporate the needs of all the states into one set of programs. Each state would use appropriate “filters” to search the database.

The SUTA Dumping Database contains:
Employee payroll information and data on all employers who report information to the Virginia Employment Commission and their quarterly tax reports and/or their initial Report to Determine Liability for State Unemployment Tax are uploaded to the Detection System.

Companies that increase employees by 1,000% over a year may be doing extremely well . . . or, perhaps two companies are combined.

Tracking significant employee movement from one company to another . . .

. . . and other filters can help to insure compliance with employment law, as well as to detect intentional SUTA dumping.
SUTA dumpers shift their UI tax costs to employers who play by the rules. The SUTA Dumping Detection System will help prevent this and provide us with an additional tool to promote trust fund solvency.

Important dates for Virginia SUTA dumping:
March 20, 2005 – date legislation signed into law.October 2005 – wages for the second quarter 2005 will be available for download to the SUTA dumping software.
VEC Goals
Return funds to the trust fund to assist in the reduction of tax rates for all employers.Educate employers and their representatives about the law and the risks of noncompliance through multiple means (press releases, VEC website, presentations, and mailings). Train staff to detect SUTA dumping through regional seminars anddata sharing.

The Commission on Unemployment CompensationNancy Broaddus, Chief of TaxVirginia Employment CommissionJuly 27, 2005
Virginia Employment Commission report to