Embed Size (px)
Citation preview
VIRGIN AUSTRALIA HOLDINGS LIMITED
ACN: 100 686 226
ANNUAL FINANCIAL REPORT 2014
Virgin Australia2
Annual financial reportFor the year ended 30 June 2014
ContentsAnnual financial report
Directors’ report 1
Lead auditor’s independence declaration 43
Consolidated statement of profit or loss 44
Consolidated statement of comprehensive income 45
Consolidated statement of financial position 46
Consolidated statement of changes in equity 47
Consolidated statement of cash flows 49
Notes to the consolidated financial statements 50
Directors’ declaration 127
Independent auditor’s report 128
ASX additional information 130
Sustainabilitiy - Flying for the future 132
GRI performance indicators 134
Independent limited assurance report 139
Corporate directory 141
This financial report covers the Virgin Australia Holdings Limited Group, consisting of Virgin Australia Holdings Limited and its controlled entities. The financial report is presented in Australian dollars.
Virgin Australia Holdings Limited (VAH) is a company limited by shares, incorporated and domiciled in Australia. Details of its registered office and principal place of business are on page 141.
Through the use of the internet, we have ensured that our corporate reporting is timely, complete and available globally at minimum cost to the Company. All press releases, financial reports and other information are available at our Shareholder Information Centre on our website: www.virginaustralia.com.
annual financial report 2014 1
The directors present their report together with the consolidated financial statements of the Group comprising Virgin Australia Holdings Limited (VAH) (the Company) and its subsidiaries, and the Group’s interests in associates and joint ventures, for the financial year ended 30 June 2014 and the auditor’s report thereon.
1. DirectorsThe directors of the Company at any time during or since the end of the financial year are:
Mr Neil ChatfieldMr David BaxbyMr Joshua BaylissMr John BorghettiMs Samantha MostynMr Robert ThomasThe Hon. Mark Vaile AOMr Goh Choon Phong (appointed 4 July 2014)Mr James Hogan (appointed 4 July 2014)Mr Christopher Luxon (appointed 4 July 2014)Mr Robert McDonald (Alternate Director) (appointed 1 September 2014)Mr John Patrick (JP) Moorhead (Alternate Director) (appointed 25 August 2014)Mr James Rigney (Alternate Director) (appointed 4 July 2014)Mr Marvin Tan (Alternate Director) (appointed 4 July 2014)Mr Keith Roberts (Alternate Director) (ceased 25 August 2014)
1.1 Details of directors, their qualifications and experience
Mr Neil Chatfield - M. Bus. FCPA, FAICD, Independent Non-Executive Chairman
Mr Neil Chatfield was appointed to the VAH Board as director on 11 May 2006 and appointed Company Chairman on 14 June 2007.
Neil is an established executive and non-executive director with experience across a range of industries. He has extensive experience in general and financial management, capital markets, mergers and acquisitions and risk management. His most recent executive role was executive director and Chief Financial Officer of Toll Holdings Ltd for over ten years to 2009. Neil is currently Chairman of Seek Ltd, since 2012 having been a non-executive director since 2005. He is also a director of Transurban Group since 2009 and Recall Holdings Ltd since 2013.
Neil was also a non-executive Director of Whitehaven Coal Ltd from May 2007 to May 2012 and Grange Resources from January 2009 to April 2014.
Mr David Baxby - B.Com (Acct), LLB (Hons), Independent Non-Executive Director
Mr David Baxby was appointed to the VAH Board as director on 30 September 2004.
He is also a Director of Tiger Airways Australia Pty Ltd. David is the CEO of Global Blue SA. David was previously the Co-CEO of the Virgin Group until 30 June 2013 and his past directorships include Virgin Atlantic Ltd, Virgin Holidays Ltd, Virgin America Inc and Air Asia X. David was also an investment banker for ten years with Goldman Sachs.
Mr Joshua Bayliss - LLB (Hons), B.A, Non-Executive Director
Mr Joshua Bayliss was appointed to the VAH Board as director on 6 April 2011.
Joshua is Chief Executive Officer of the Virgin Group, based in Geneva. In his role as CEO he is responsible for managing the Group’s global investment portfolio, development and licensing of the Virgin brand and incubation of new Virgin businesses.
Josh has extensive experience as both an executive and non-executive director of a large number of companies across the Virgin Group globally in all of Virgin’s industry sectors including aviation, financial services, telecoms and media, health and wellness and entertainment.
He has been with the Group since 2005, previously serving as the Virgin Group’s General Counsel before taking on the CEO role in 2011.
Mr John Borghetti - Managing Director and Chief Executive Officer
Mr John Borghetti was appointed to the VAH Board as director on 8 May 2010.
John has more than 40 years’ experience in the aviation sector having previously held a number of senior positions at Qantas, leaving the company in May 2009. John is a director of Energy Australia, the Australian Chamber Orchestra, the New South Wales Customer Advisory Board, and Chairman of Tiger Airways Australia Pty Limited.
He was previously a director of CARE Australia (2005- 2011), The Australian Ballet (2009-2011) and Piper Aircraft (USA) (2009-2010).
Directors’ report
Virgin Australia2
Directors’ report (continued)
1. Directors (continued)1.1 Details of directors, their qualifications and experience (continued)
Ms Samantha Mostyn - B.A, LLB., Independent Non-Executive Director
Ms Samantha Mostyn was appointed to the VAH Board as director on 1 September 2010.
Samantha is a non-executive director and corporate advisor and has previously held senior executive positions at IAG, Optus and Cable & Wireless Plc. Samantha is a board member of the Australia Council for the Arts, Australian Volunteers International, the Climate Council and Carriageworks. She is President of ACFID and Deputy Chair of the Diversity Council of Australia. Samantha is an AFL Commissioner and a director of the GO foundation. Samantha became a director of the Transurban Group in December 2010, Citibank Australia in July 2011 and Cover-More Group Ltd in December 2013. She has previously served as a Commissioner with the National Mental Health Commission and served on the Review into the Treatment of Women in the Australian Defence Force.
Mr Robert Thomas - B.Econ, MSAA, SF Fin, Independent Non-Executive Director
Mr Robert Thomas was appointed to the VAH Board as director on 8 September 2006.
Robert has more than 40 years’ experience in the securities industry. He is the Chairman of TAL Ltd. Starpharma Holdings Ltd and Aus Bio Ltd. He is a director of Heartware International Inc., O’Connell Street Associates Pty Ltd, Grahger Capital Securities Pty Ltd, REVA Medical Inc., and Biotron Ltd.
Robert is the President of the Library Council of NSW and is a member of the Inteq Advisory Board.
The Hon. Mark Vaile AO - Independent Non-Executive Director
The Hon. Mark Vaile was appointed to the VAH Board on 22 September 2008.
Mark is Chairman of Whitehaven Coal Ltd, Palisade’s Regional Infrastructure Fund and Australia Korea Business Council and was previously Chairman of CBD Energy Ltd. Mark is a director of Stamford Land Corporation Ltd, HostPlus Superfund Ltd and Servcorp Ltd. In 2012 Mark was appointed an Officer in the Order of Australia in the Queen’s birthday honours list.
Mark was a Member of the Australian Parliament from 1993 to 2008. He was Deputy Prime Minister (2005-2007), Minister for Trade (1999-2006), Minister for Transport and Aviation (1997-1998, 2006-2007) and Minister for Agriculture (1998-1999).
1.2 Details of alternate directors and directors appointed after 30 June 2014
Mr Goh Choon Phong - MS (EE & CS), BS (CSE), BS (Management), BS (Cognitive Science), Non-Executive Director
Mr Goh Choon Phong was appointed to the VAH Board as director on 4 July 2014.
Choon Phong is a Director and Chief Executive Officer of Singapore Airlines Limited (Singapore Airlines). Prior to his appointment as Chief Executive Officer, Choon Phong held senior management positions in various divisions in Singapore Airlines, ranging from Marketing to Information Technology, Finance and Cargo. Choon Phong also served as President of Singapore Airlines Cargo Pte Ltd from 2006 to 2010. Choon Phong is also a director of SIA Engineering Company Limited, Mount Alvernia Hospital and is a member of the Board of Governors of the International Air Transport Association.
Choon Phong has a Master of Science in Electrical Engineering and Computer Science as well as three Bachelor of Science degrees in Computer Science & Engineering, Management Science and Cognitive Science from the Massachusetts Institute of Technology.
Mr James Hogan - Non-Executive Director
Mr James Hogan was appointed to the VAH Board as director on 4 July 2014.
James is the President and Chief Executive of Etihad Airways P.J.S.C. (Etihad Airways) and brings more than 30 years of travel industry expertise to the Board. He started his career at Ansett Holdings Ltd Group (Ansett) and subsequently held senior positions with bmi, Hertz, Forte Hotels and Gulf Air, where he served as Chief Executive for four years. James is a fellow of the Royal Aeronautical Society and a former non-executive director and audit committee member of Gallaher Plc. He currently serves as vice chairman on the Executive Committee of the World Travel and Tourism Council (WTTC) and is a member of the UBS Industrialisation Advisory Board and the International Air Transport Association (IATA) Board of Governors. He serves as vice chairman of equity partner, airberlin plc, and is a member of the Jet Airways Board.
Mr Christopher Luxon - M.Com, Non-Executive Director
Mr Christopher Luxon was appointed to the VAH Board as director on 4 July 2014.
Christopher is Chief Executive Officer of Air New Zealand Limited (Air New Zealand), which is a major shareholder of Virgin Australia. Prior to joining Air New Zealand, he was President and Chief Executive Officer at Unilever Canada. This was one of several senior leadership roles Christopher held during an 18 year career at Unilever where he worked in New Zealand, Australia, Asia, Europe and North America.
Christopher has a Master of Commerce in Business Administration from the University of Canterbury.
annual financial report 2014 3
1. Directors (continued) 1.2 Details of alternate directors and directors appointed after 30 June 2014 (continued)
Mr Robert McDonald - B.Com FCA, Alternate Director
Mr Robert McDonald was appointed as Alternate Director for Mr Christopher Luxon on 1 September 2014.
Robert started his finance career as a commerce graduate with a large building products company in 1980. He worked abroad before joining Coopers and Lybrand in the corporate advisory and valuation practice in 1985.
Robert took up the position of Group Financial Planning Manager at Air New Zealand in 1993 and was appointed Group Treasurer in 1995. In October 2004 Robert was appointed as Chief Financial Officer of Air New Zealand.
Robert graduated from Auckland University with a Bachelor of Commerce. He is a fellow of the New Zealand Institute of Chartered Accountants and a member of the Institute of Finance Professionals New Zealand Inc. In 1999, Robert completed the Program of Management Development at Harvard Business School.
Mr John Patrick (JP) Moorhead - MA, MEng, Alternate Director
Mr JP Moorhead was appointed as Alternate Director for Mr Joshua Bayliss on 25 August 2014.
JP is CFO of the Virgin Group and responsible for the Virgin Group’s overall financial and risk positions as well as accounting, financing, tax, treasury and certain portfolio matters. JP has served as a director of various Virgin Group operating companies including Virgin Atlantic and Virgin Rail, as well as a number of Virgin Group holding companies.
Prior to joining Virgin, JP spent eight years at Goldman Sachs in London and Sydney where he worked on a broad range of strategic advisory, mergers and acquisitions, and capital markets transactions.
Mr James Rigney - CA, MBA, B. Bus, Alternate Director
Mr James Rigney was appointed as Alternate Director for Mr James Hogan on 4 July 2014.
James was appointed to the position of Chief Financial Officer at Etihad Airways in 2006. He also sits on the Boards of airberlin, Air Serbia and Jet Airways and serves on the Finance Committee of IATA. James joined Etihad Airways from Gulf Air, where he held the position of Head of Corporate Strategy. He has previously held senior positions at Ansett and began his career at KPMG.
James is a chartered accountant and holds a Bachelor of Business and Masters Degree in Business Administration from RMIT University in Melbourne.
Mr Marvin Tan - B.A, Alternate Director
Mr Marvin Tan was appointed as Alternate Director for Mr Goh Choon Phong on 4 July 2014.
Marvin is the Senior Vice President, Cabin Crew at Singapore Airlines. Marvin joined Singapore Airlines in 1996 and has held various appointments both in Singapore and overseas, most recently on secondment to SilkAir, Singapore Airlines’ regional subsidiary, as the airline’s Chief Executive. Marvin currently also serves on the Board of Scoot Pte Ltd.
Marvin holds a Bachelor of Arts degree in International Relations from Stanford University.
Mr Keith Roberts - M.Com (Hons) B. Bus, Alternate Director
Mr Keith Roberts was appointed as Alternate Director for Mr David Baxby from 28 November 2008 to 20 July 2013 and appointed as Alternate Director for Mr Joshua Bayliss from 17 May 2012 to 25 August 2014.
Keith is the Global Head of Corporate Development and Strategy for the Virgin Group, based in Geneva. He is also responsible for Virgin Enterprises, Virgin’s brand licencing arm and for leading Virgin Group’s central brand team.
Prior to moving to Geneva in 2010 Keith was the Australian Country Head of Virgin Management Asia Pacific. Before joining Virgin in March 2008, he was a management consultant at Bain and Company for nine years.
Virgin Australia4
Directors’ report (continued)
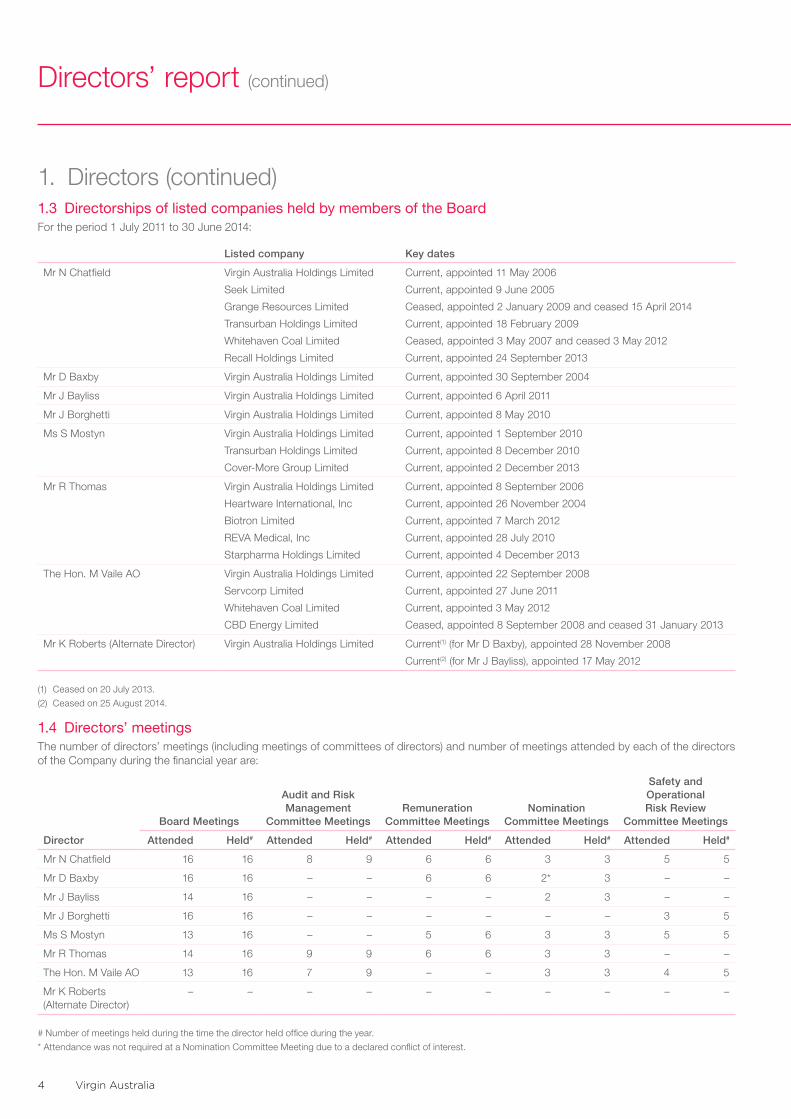
1. Directors (continued)1.3 Directorships of listed companies held by members of the BoardFor the period 1 July 2011 to 30 June 2014:
Listed company Key dates
Mr N Chatfield Virgin Australia Holdings Limited
Seek Limited
Grange Resources Limited
Transurban Holdings Limited
Whitehaven Coal Limited
Recall Holdings Limited
Current, appointed 11 May 2006
Current, appointed 9 June 2005
Ceased, appointed 2 January 2009 and ceased 15 April 2014
Current, appointed 18 February 2009
Ceased, appointed 3 May 2007 and ceased 3 May 2012
Current, appointed 24 September 2013
Mr D Baxby Virgin Australia Holdings Limited Current, appointed 30 September 2004
Mr J Bayliss Virgin Australia Holdings Limited Current, appointed 6 April 2011
Mr J Borghetti Virgin Australia Holdings Limited Current, appointed 8 May 2010
Ms S Mostyn Virgin Australia Holdings Limited
Transurban Holdings Limited
Cover-More Group Limited
Current, appointed 1 September 2010
Current, appointed 8 December 2010
Current, appointed 2 December 2013
Mr R Thomas Virgin Australia Holdings Limited
Heartware International, Inc
Biotron Limited
REVA Medical, Inc
Starpharma Holdings Limited
Current, appointed 8 September 2006
Current, appointed 26 November 2004
Current, appointed 7 March 2012
Current, appointed 28 July 2010
Current, appointed 4 December 2013
The Hon. M Vaile AO Virgin Australia Holdings Limited
Servcorp Limited
Whitehaven Coal Limited
CBD Energy Limited
Current, appointed 22 September 2008
Current, appointed 27 June 2011
Current, appointed 3 May 2012
Ceased, appointed 8 September 2008 and ceased 31 January 2013
Mr K Roberts (Alternate Director) Virgin Australia Holdings Limited Current(1) (for Mr D Baxby), appointed 28 November 2008
Current(2) (for Mr J Bayliss), appointed 17 May 2012
(1) Ceased on 20 July 2013.
(2) Ceased on 25 August 2014.
1.4 Directors’ meetings The number of directors’ meetings (including meetings of committees of directors) and number of meetings attended by each of the directors of the Company during the financial year are:
Director
Board Meetings
Audit and Risk Management
Committee MeetingsRemuneration
Committee MeetingsNomination
Committee Meetings
Safety and Operational Risk Review
Committee Meetings
Attended Held# Attended Held# Attended Held# Attended Held# Attended Held#
Mr N Chatfield 16 16 8 9 6 6 3 3 5 5
Mr D Baxby 16 16 – – 6 6 2* 3 – –
Mr J Bayliss 14 16 – – – – 2 3 – –
Mr J Borghetti 16 16 – – – – – – 3 5
Ms S Mostyn 13 16 – – 5 6 3 3 5 5
Mr R Thomas 14 16 9 9 6 6 3 3 – –
The Hon. M Vaile AO 13 16 7 9 – – 3 3 4 5
Mr K Roberts (Alternate Director)
– – – – – – – – – –
# Number of meetings held during the time the director held office during the year.
* Attendance was not required at a Nomination Committee Meeting due to a declared conflict of interest.
annual financial report 2014 5
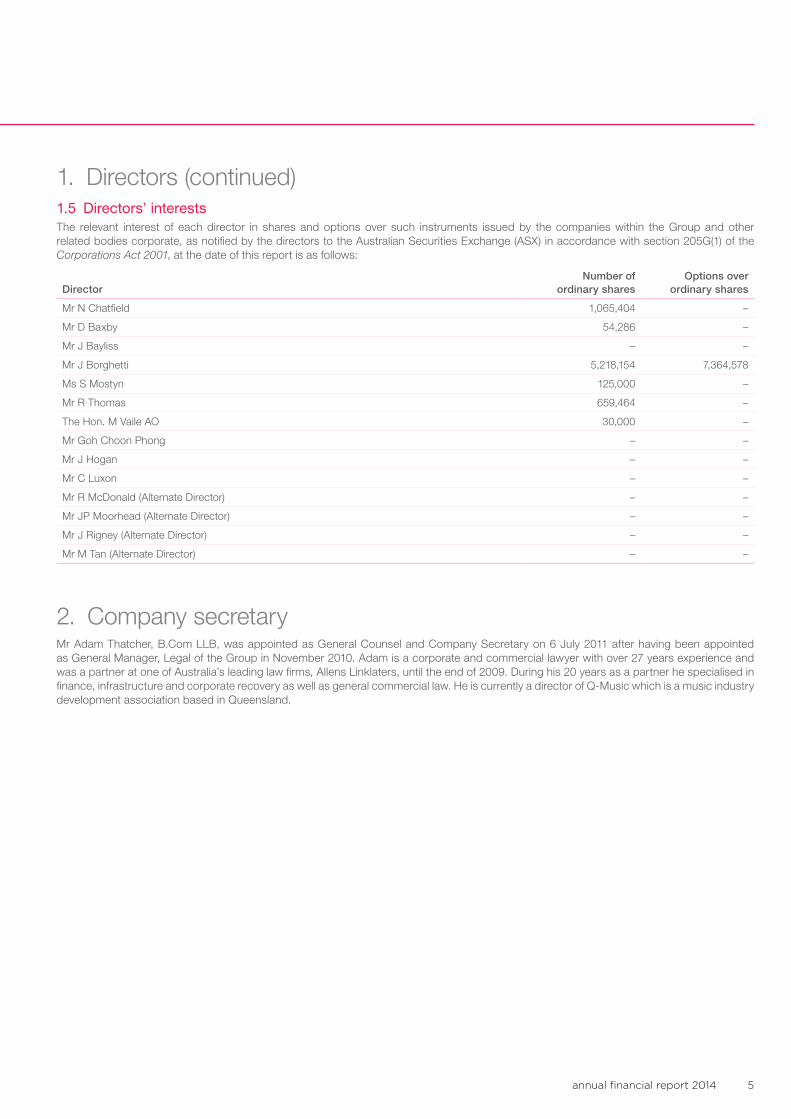
1. Directors (continued) 1.5 Directors’ interestsThe relevant interest of each director in shares and options over such instruments issued by the companies within the Group and other related bodies corporate, as notified by the directors to the Australian Securities Exchange (ASX) in accordance with section 205G(1) of the Corporations Act 2001, at the date of this report is as follows:
DirectorNumber of
ordinary shares Options over
ordinary shares
Mr N Chatfield 1,065,404 –
Mr D Baxby 54,286 –
Mr J Bayliss – –
Mr J Borghetti 5,218,154 7,364,578
Ms S Mostyn 125,000 –
Mr R Thomas 659,464 –
The Hon. M Vaile AO 30,000 –
Mr Goh Choon Phong – –
Mr J Hogan – –
Mr C Luxon – –
Mr R McDonald (Alternate Director) – –
Mr JP Moorhead (Alternate Director) – –
Mr J Rigney (Alternate Director) – –
Mr M Tan (Alternate Director) – –
2. Company secretaryMr Adam Thatcher, B.Com LLB, was appointed as General Counsel and Company Secretary on 6 July 2011 after having been appointed as General Manager, Legal of the Group in November 2010. Adam is a corporate and commercial lawyer with over 27 years experience and was a partner at one of Australia’s leading law firms, Allens Linklaters, until the end of 2009. During his 20 years as a partner he specialised in finance, infrastructure and corporate recovery as well as general commercial law. He is currently a director of Q-Music which is a music industry development association based in Queensland.
Virgin Australia6
Directors’ report (continued)
3. Corporate governance statement Virgin Australia’s Corporate Governance FrameworkThis statement outlines the main corporate governance policies and practices in place throughout the financial year ended 30 June 2014, which comply with the ASX Corporate Governance Council Principles and Recommendations (2nd Edition), unless otherwise stated.
Below is a list of the relevant governance documents. Copies of the documents referred to in this statement can be found in the Corporate Governance section of the Virgin Australia website at www.virginaustralia.com.
ASX Principles and Recommendations Relevant Governance Document
Principle 1 Lay solid foundations for management and oversight Board Charter
Principle 2 Structure the Board to add value Nomination Committee Charter
Board Charter
Principle 3 Promote ethical and responsible decision making Code of Conduct for Directors and Senior Executives
Guide to Business Conduct
Nominee Director Protocol
Diversity Policy
Principle 4 Safeguard integrity in financial reporting Audit and Risk Management Committee Charter
Risk Management Policy
Principle 5 Make timely and balanced disclosure Continuous Disclosure Policy
Principle 6 Respect the rights of shareholders Shareholder Communication Policy
Principle 7 Recognise and manage risk Audit and Risk Management Committee Charter
Safety and Operational Risk Review Committee Charter
Risk Management Policy
Principle 8 Remunerate fairly and responsibly Remuneration Committee Charter
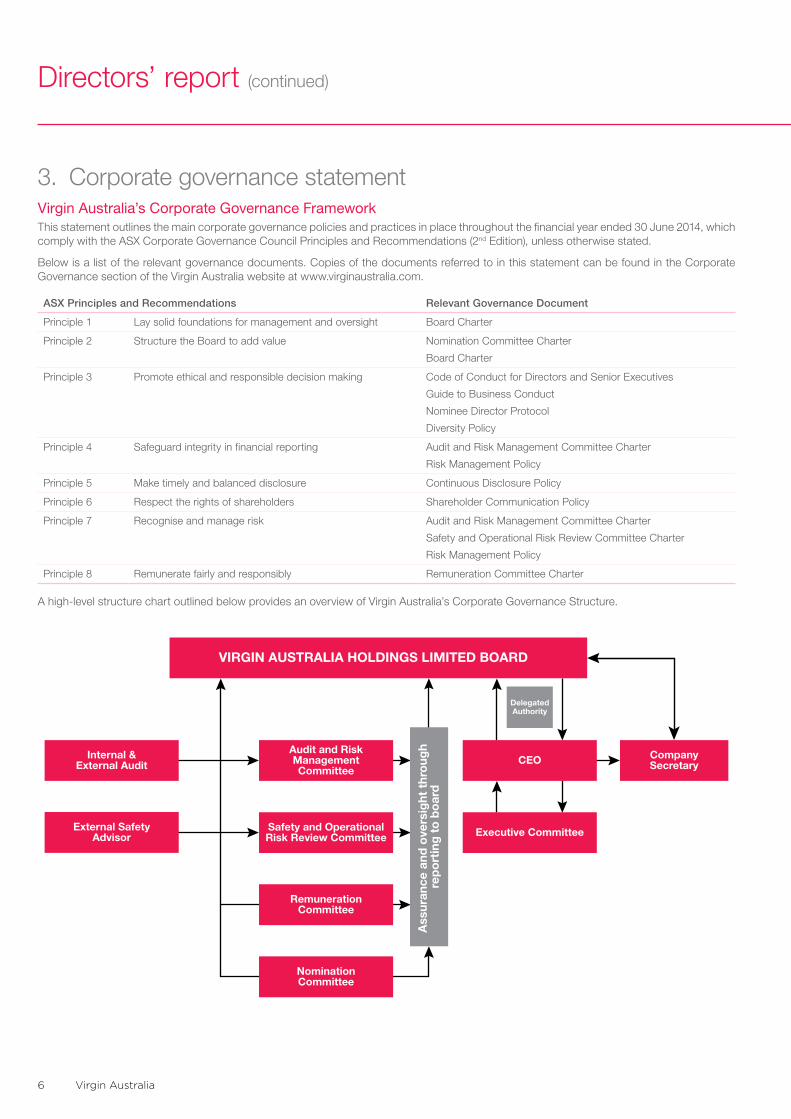
A high-level structure chart outlined below provides an overview of Virgin Australia’s Corporate Governance Structure.
Internal &External Audit
Audit and RiskManagementCommittee
VIRGIN AUSTRALIA HOLDINGS LIMITED BOARD
RemunerationCommittee
NominationCommittee
External SafetyAdvisor
Safety and OperationalRisk Review Committee Executive Committee
CEO
DelegatedAuthority
Ass
uran
ce a
nd o
vers
ight
thr
oug
h re
po
rtin
g t
o b
oar
d
CompanySecretary
annual financial report 2014 7
3. Corporate governance statement (continued)Virgin Australia’s Corporate Governance Framework (continued)
Principle 1 – Lay solid foundations for management and oversight
Board CharterThe Board has a Charter which clearly establishes its role and responsibilities and also sets out the responsibilities which have been delegated to senior management.
The primary role of the Board is to provide strategic guidance for the Group and effective oversight of management. To assist in the performance of its role, the Board has established a number of Committees which have specific roles and responsibilities in key areas.
The Board has delegated to the Chief Executive Officer (CEO) authority over the day to day management of the Group. Specific areas of responsibility which have been delegated to the CEO are set out in the Board Charter. The CEO is authorised to delegate the powers conferred on him as he deems appropriate.
Board meetings are held on a regular basis, with briefing material being provided to each director at least seven days prior to each meeting. The Company Secretary is responsible for coordinating the timely completion and despatch of Board meeting agendas and briefing material. Senior executives are invited to make presentations at Board meetings which provide the ability for directors to engage in discussions and request additional information on relevant topics.
Subject to prior consultation with the Chairman, directors may seek independent professional advice (including legal advice) from a suitably qualified advisor at the Company’s expense. Except in extraordinary cases (where the director will have notified the other Board members in writing), a copy of any such advice received is to be made available to other directors.
The Board has written agreements with each director and senior executive which set out the terms of their appointment.
Board CommitteesDuring the 2014 financial year, the Board had four committees of directors: the Audit and Risk Management Committee, the Remuneration Committee, the Nomination Committee and the Safety and Operational Risk Review Committee. Each committee has a documented Charter approved by the Board, copies of which can be found on the Company’s website.
Committee composition as at the date of this report is as follows:
Committee Members Composition Key Roles and Responsibilities
Audit and Risk Management Committee
Mr R Thomas (Chair)
Mr N Chatfield
The Hon. M Vaile AO
Mr C Luxon
Has a majority of independent directors.
Has an independent chair who is not chair of the Board.
Has at least three members.
All members are financially literate. Two members have relevant qualifications and experience.
Review and assessment of the integrity of financial reporting.
Monitoring the performance of internal and external audit, including oversight of qualifications, independence and fees of the external auditor.
Review of risk management policies, processes and profile, including the adequacy of insurance cover.
Review of the compliance framework and financial information required by regulators.
Remuneration Committee
Ms S Mostyn (Chair)
Mr N Chatfield
Mr D Baxby
Mr R Thomas
Consists only of non-executive directors.
Has a majority of independent directors.
Has an independent chair.
Has at least three members.
Remuneration of non-executive directors, the CEO and Group Executives.
Review of performance assessment processes and results for the CEO and Group Executives.
Agree policies for the recruitment, retention and termination of Group Executives.
Agree policies for employee incentive schemes and superannuation.
Recommend to the Board diversity objectives.
Nomination Committee
Mr N Chatfield (Chair)
Mr D Baxby
Mr J Bayliss
Ms S Mostyn
Mr R Thomas
The Hon. M Vaile AO
Has a majority of independent directors.
Has an independent chair.
Has at least three members.
Composition of the Board.
Director and CEO succession planning.
Induction and ongoing development of directors.
Performance appraisal of the Board, its Committees, each director and the CEO.
Virgin Australia8
Directors’ report (continued)
3. Corporate governance statement (continued)Virgin Australia’s Corporate Governance Framework (continued)
Principle 1 – Lay solid foundations for management and oversight (continued)
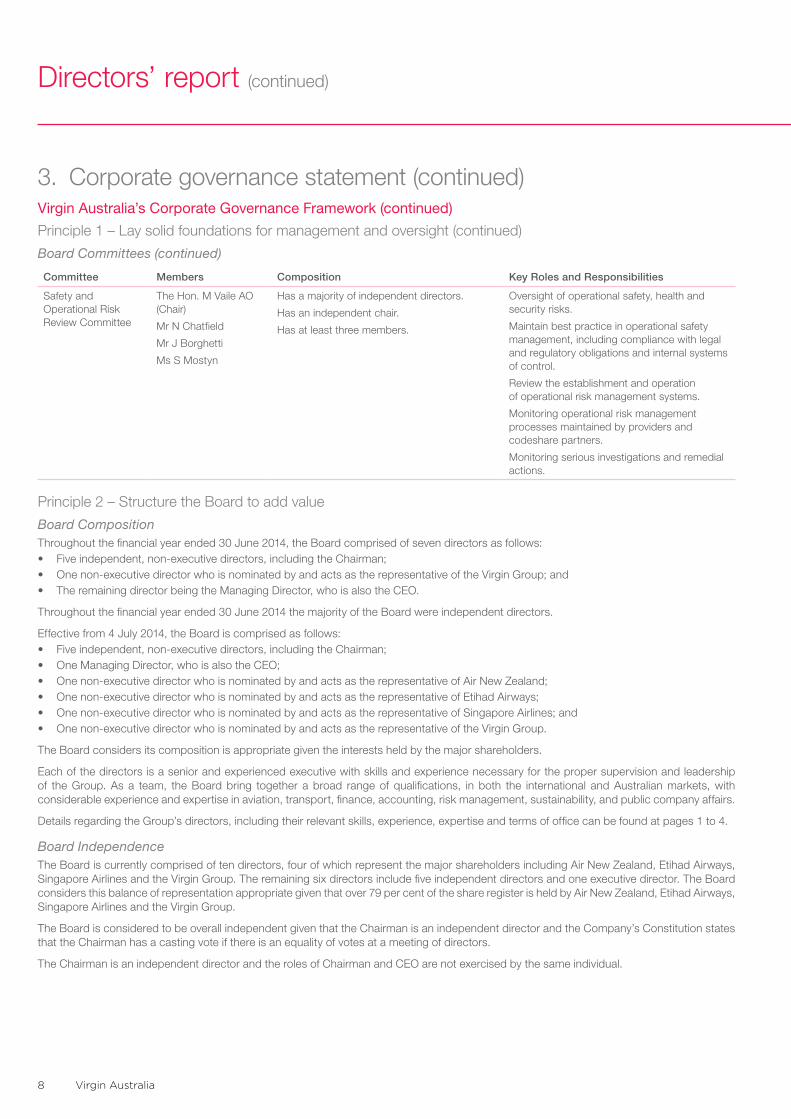
Board Committees (continued)
Committee Members Composition Key Roles and Responsibilities
Safety and Operational Risk Review Committee
The Hon. M Vaile AO (Chair)
Mr N Chatfield
Mr J Borghetti
Ms S Mostyn
Has a majority of independent directors.
Has an independent chair.
Has at least three members.
Oversight of operational safety, health and security risks.
Maintain best practice in operational safety management, including compliance with legal and regulatory obligations and internal systems of control.
Review the establishment and operation of operational risk management systems.
Monitoring operational risk management processes maintained by providers and codeshare partners.
Monitoring serious investigations and remedial actions.
Principle 2 – Structure the Board to add value
Board Composition Throughout the financial year ended 30 June 2014, the Board comprised of seven directors as follows:• Five independent, non-executive directors, including the Chairman; • One non-executive director who is nominated by and acts as the representative of the Virgin Group; and• The remaining director being the Managing Director, who is also the CEO.
Throughout the financial year ended 30 June 2014 the majority of the Board were independent directors.
Effective from 4 July 2014, the Board is comprised as follows: • Five independent, non-executive directors, including the Chairman;• One Managing Director, who is also the CEO; • One non-executive director who is nominated by and acts as the representative of Air New Zealand; • One non-executive director who is nominated by and acts as the representative of Etihad Airways; • One non-executive director who is nominated by and acts as the representative of Singapore Airlines; and • One non-executive director who is nominated by and acts as the representative of the Virgin Group.
The Board considers its composition is appropriate given the interests held by the major shareholders.
Each of the directors is a senior and experienced executive with skills and experience necessary for the proper supervision and leadership of the Group. As a team, the Board bring together a broad range of qualifications, in both the international and Australian markets, with considerable experience and expertise in aviation, transport, finance, accounting, risk management, sustainability, and public company affairs.
Details regarding the Group’s directors, including their relevant skills, experience, expertise and terms of office can be found at pages 1 to 4.
Board Independence The Board is currently comprised of ten directors, four of which represent the major shareholders including Air New Zealand, Etihad Airways, Singapore Airlines and the Virgin Group. The remaining six directors include five independent directors and one executive director. The Board considers this balance of representation appropriate given that over 79 per cent of the share register is held by Air New Zealand, Etihad Airways, Singapore Airlines and the Virgin Group.
The Board is considered to be overall independent given that the Chairman is an independent director and the Company’s Constitution states that the Chairman has a casting vote if there is an equality of votes at a meeting of directors.
The Chairman is an independent director and the roles of Chairman and CEO are not exercised by the same individual.
annual financial report 2014 9
3. Corporate governance statement (continued)Virgin Australia’s Corporate Governance Framework (continued)
Principle 2 – Structure the Board to add value (continued)
Board Independence (continued)All directors, whether independent or not, are required to bring independent judgement to bear on Board decisions. The Board considers that, fundamentally, the independence of directors is based on their capacity to put the best interests of the Company and its shareholders ahead of all other interests, so that directors are capable of exercising objective independent judgement. Capacity to act independently and the skill sets and experience of individual directors to complement the skills and experience of the Board overall are critical criteria in candidate selection. The capacity for individual directors to add value to the Board is very important.
When evaluating candidates, the Board has regard to the potential for conflicts of interest, whether actual or perceived, and the extent or materiality of these in the ongoing assessment of director independence. In this respect, the Board has regard to the definition of independence in the ASX Corporate Governance Principles and Recommendations. The Board does not believe that the existence of one or more of the relationships in the definition will necessarily result in the relevant director not being classified as independent, particularly given the criteria outlined above, and that the Company will seek to implement additional safeguards to ensure independence. An overall review of these considerations is conducted by the Board to determine whether individual directors are independent.
Additional policies, such as directors not being present during discussions or decision making on matters in which they have or could be seen to potentially have a material conflict of interest, in addition to directors being excluded from taking part in the appointment of third party service providers where the director has an interest, provide further separation and safeguards to independence. The Board has considered materiality thresholds in relation to independence, but has determined not to establish fixed thresholds, believing that, if taken in isolation and out of context, these can be misleading and inconclusive.
Nomination Committee The Board has established a Nomination Committee which makes recommendations to the Board regarding the size and composition of the Board and the appointment and re-election of directors. The Nomination Committee has a charter which clearly states its role and responsibilities. The Nomination Committee is chaired by an independent director and currently has six members. The names of the members of the Nomination Committee and their attendance at meetings are disclosed at pages 4, 7 and 8.
The Nomination Committee is responsible for developing plans to identify the necessary and desirable competencies and skills of directors and succession plans to ensure there is an appropriate mix of skills, experience, expertise and diversity on the Board.
The Company believes that the current size and composition of the Board is conducive to making appropriate decisions and incorporates a variety of perspectives and skills in order to represent the best interests of the Company as a whole.
Where necessary, the Company utilises the services of professional advisors to identify and assess potential Board candidates.
The Nomination Committee makes appropriate checks prior to electing a director to the Board, these include checks as to the person’s character, experience, education, criminal record and bankruptcy history.
The Nomination Committee has responsibility for developing systems for induction procedures and the ongoing training and development of directors.
The Company has in place induction procedures which allow new directors to participate fully and actively in decision-making at the earliest opportunity. Directors are able to access continuing education to update and enhance their skills and knowledge and have the right of access to all relevant Company information and senior executives, including the Company Secretary, to provide them with information regarding key developments in the Company and the industry.
Performance EvaluationThe Board conducts an annual self-assessment of the performance of the Board, its committees and individual directors. In addition, externally facilitated performance evaluations are undertaken on a regular basis, with the most recent externally facilitated performance evaluation being conducted during the 2010 financial year.
Company Secretary The Company Secretary is accountable directly to the Board, through the Chairman, on all matters to do with proper functioning of the Board. Each director has the ability to communicate with the Company Secretary. Decisions to appoint or remove the Company Secretary are made or approved by the Board.
Virgin Australia10
Directors’ report (continued)
3. Corporate governance statement (continued)Virgin Australia’s Corporate Governance Framework (continued)
Principle 3 – Promote ethical and responsible decision making The Group has adopted a number of policies which promote ethical and responsible decision making.
Code of Conduct The Company has a Code of Conduct which applies to all directors, employees and contractors working for the Group and formalises the Group’s belief that business objectives are best achieved through acting at all times fairly, honestly and with integrity. The Code of Conduct clearly articulates what the Company regards as acceptable business practices for its directors, senior executives and employees.
The Code of Conduct applies to directors and senior executives and further reflects the commitment of the Group to ethical standards and practices. A copy of the Code of Conduct for Directors and Senior Executives and Guide to Business Conduct is available on the Company’s website. In addition to the Code of Conduct the Company also has the following policies: • The Equal Employment Opportunity (EEO) Policy makes team members accountable for creating an environment in which all people
(including team members, guests, customers and suppliers) are treated fairly and equitably and with dignity, courtesy and respect. This policy ensures that complaints and concerns of discrimination, sexual harassment, workplace bullying or victimisation are treated seriously, investigated and resolved as quickly and effectively as possible. The policy also outlines the support mechanisms that are available to assist team members to understand and, if necessary, make a complaint under the policy.
• For matters that do not fall within the scope of the EEO Policy, the Group has the A Fair Go Policy which aims to ensure that concerns within the workplace are resolved as quickly and effectively as possible.
• The Group has a Gifts Policy which clearly defines and communicates the parameters for accepting gifts. The policy outlines prohibited gifts and the approval process for accepting gifts.
• The Group has an Ethics Hotline which can be used by employees to report any conduct which may be unethical or improper. All reports to the Ethics Hotline, which is provided by an external independent provider, are able to be made confidentially and anonymously and are thoroughly investigated.
• The Group has also established a Whistle-blower Policy to ensure that employees who make a report are protected from adverse behaviour as a result of making a report.
Securities Trading PolicyThe Company has implemented a policy on securities trading which binds all directors and employees of the Group. The policy ensures that all directors and employees are aware of the legal restrictions on trading in the Company’s securities while in possession of unpublished price-sensitive information. Directors and senior executives are required to obtain consent prior to dealing in the Company’s securities.
Trading is not permitted in nominated blackout periods, which apply in the six weeks before, and one trading day after, the release of the Company’s half-year and full year results. Short-term trading and hedging economic exposure to unvested options issued pursuant to an employee option plan is prohibited. Directors and the CEO are prohibited from obtaining margin loans using the Company’s securities as security for loans. A copy of the Securities Trading Policy is available on the Company’s website.
Nominee Director Protocol The Nominee Director Protocol (the Protocol) sets out the principles to be followed by the Board and each director of the Company who represents, is nominated by, or is employed by, a shareholder with an interest in the Company of at least 5%. Consultation on the Protocol was undertaken with the Australian Competition and Consumer Commission and the Department of Infrastructure and Regional Development prior to its finalisation.
All major shareholders and their nominated representatives have provided their agreement in writing to the Protocol. A full copy of the Protocol is available on the Company’s website.
Diversity and InclusionThe Group’s Diversity and Inclusion Strategy (the Strategy) underpins the inclusive culture in which people treat each other with mutual respect and are recruited, developed and promoted on the basis of merit. Under the Strategy, the Board is responsible for establishing measurable gender diversity objectives and reviewing progress towards achieving the objectives on an annual basis.
annual financial report 2014 11
3. Corporate governance statement (continued)Virgin Australia’s Corporate Governance Framework (continued)
Principle 3 – Promote ethical and responsible decision making (continued)
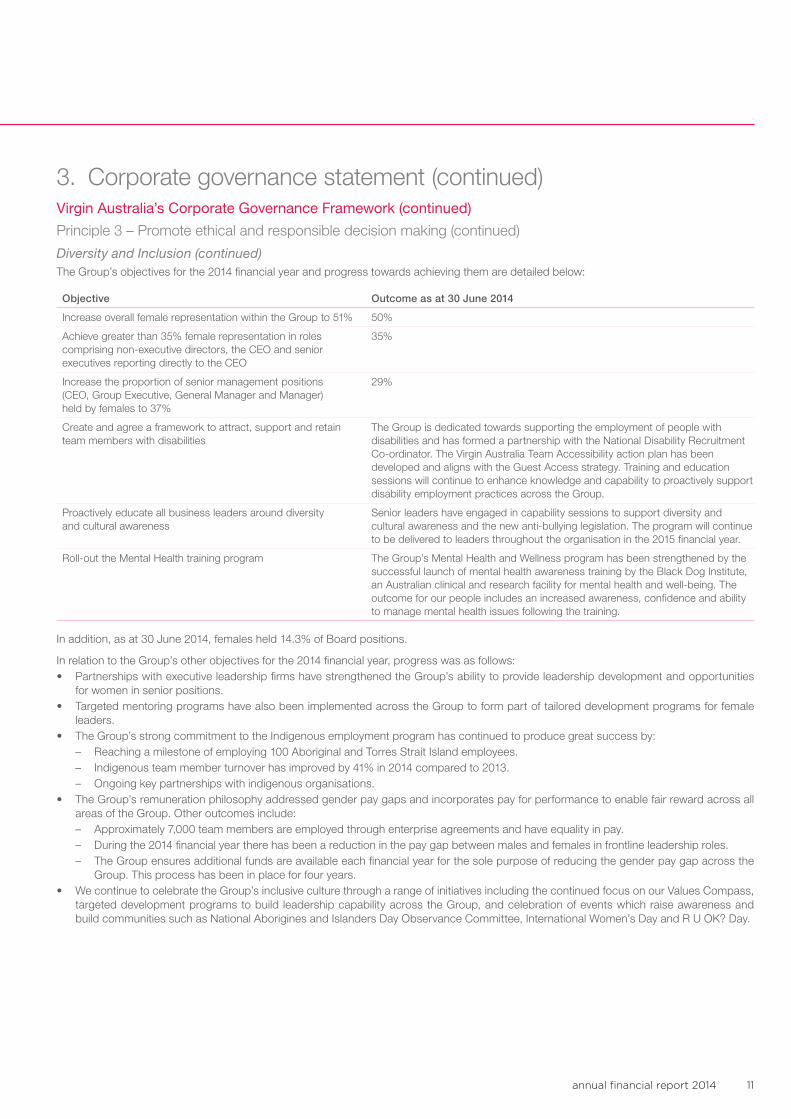
Diversity and Inclusion (continued)The Group’s objectives for the 2014 financial year and progress towards achieving them are detailed below:
Objective Outcome as at 30 June 2014
Increase overall female representation within the Group to 51% 50%
Achieve greater than 35% female representation in roles comprising non-executive directors, the CEO and senior executives reporting directly to the CEO
35%
Increase the proportion of senior management positions (CEO, Group Executive, General Manager and Manager) held by females to 37%
29%
Create and agree a framework to attract, support and retain team members with disabilities
The Group is dedicated towards supporting the employment of people with disabilities and has formed a partnership with the National Disability Recruitment Co-ordinator. The Virgin Australia Team Accessibility action plan has been developed and aligns with the Guest Access strategy. Training and education sessions will continue to enhance knowledge and capability to proactively support disability employment practices across the Group.
Proactively educate all business leaders around diversity and cultural awareness
Senior leaders have engaged in capability sessions to support diversity and cultural awareness and the new anti-bullying legislation. The program will continue to be delivered to leaders throughout the organisation in the 2015 financial year.
Roll-out the Mental Health training program The Group’s Mental Health and Wellness program has been strengthened by the successful launch of mental health awareness training by the Black Dog Institute, an Australian clinical and research facility for mental health and well-being. The outcome for our people includes an increased awareness, confidence and ability to manage mental health issues following the training.
In addition, as at 30 June 2014, females held 14.3% of Board positions.
In relation to the Group’s other objectives for the 2014 financial year, progress was as follows: • Partnerships with executive leadership firms have strengthened the Group’s ability to provide leadership development and opportunities
for women in senior positions. • Targeted mentoring programs have also been implemented across the Group to form part of tailored development programs for female
leaders. • The Group’s strong commitment to the Indigenous employment program has continued to produce great success by:
– Reaching a milestone of employing 100 Aboriginal and Torres Strait Island employees. – Indigenous team member turnover has improved by 41% in 2014 compared to 2013. – Ongoing key partnerships with indigenous organisations.
• The Group’s remuneration philosophy addressed gender pay gaps and incorporates pay for performance to enable fair reward across all areas of the Group. Other outcomes include: – Approximately 7,000 team members are employed through enterprise agreements and have equality in pay. – During the 2014 financial year there has been a reduction in the pay gap between males and females in frontline leadership roles. – The Group ensures additional funds are available each financial year for the sole purpose of reducing the gender pay gap across the
Group. This process has been in place for four years. • We continue to celebrate the Group’s inclusive culture through a range of initiatives including the continued focus on our Values Compass,
targeted development programs to build leadership capability across the Group, and celebration of events which raise awareness and build communities such as National Aborigines and Islanders Day Observance Committee, International Women’s Day and R U OK? Day.
Virgin Australia12
Directors’ report (continued)
3. Corporate governance statement (continued)Virgin Australia’s Corporate Governance Framework (continued)
Principle 3 – Promote ethical and responsible decision making (continued)
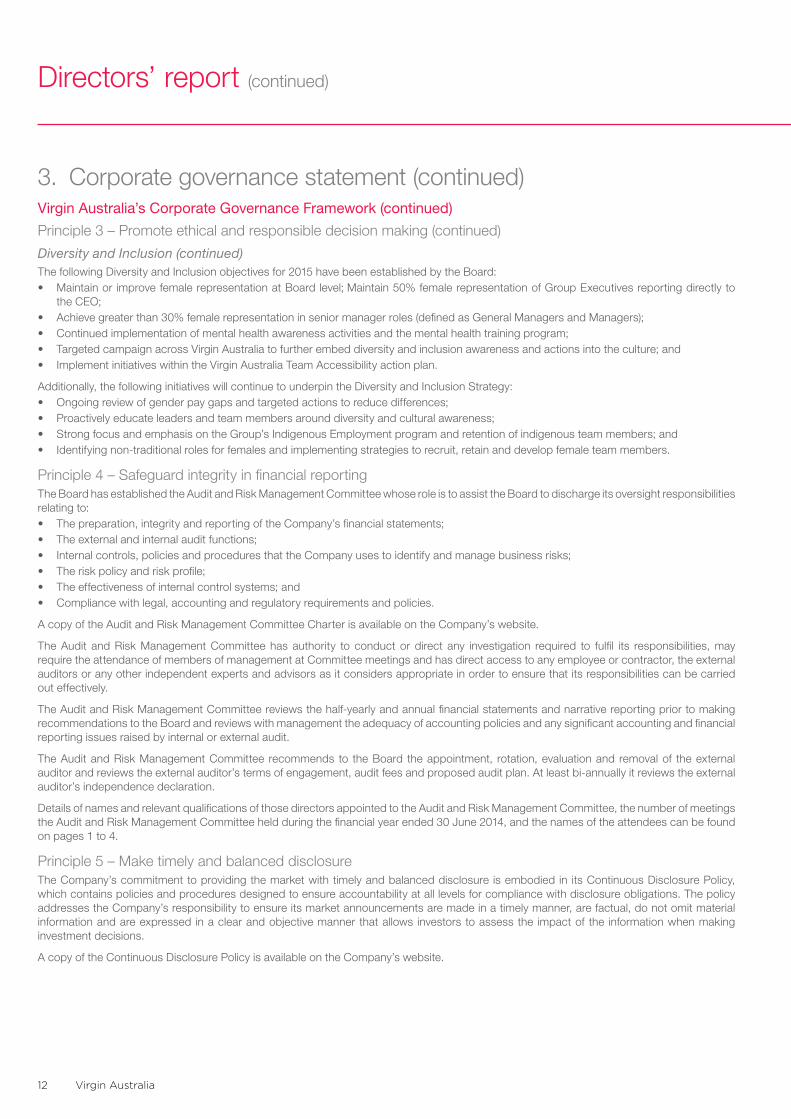
Diversity and Inclusion (continued)The following Diversity and Inclusion objectives for 2015 have been established by the Board: • Maintain or improve female representation at Board level; Maintain 50% female representation of Group Executives reporting directly to
the CEO;• Achieve greater than 30% female representation in senior manager roles (defined as General Managers and Managers);• Continued implementation of mental health awareness activities and the mental health training program; • Targeted campaign across Virgin Australia to further embed diversity and inclusion awareness and actions into the culture; and• Implement initiatives within the Virgin Australia Team Accessibility action plan.
Additionally, the following initiatives will continue to underpin the Diversity and Inclusion Strategy: • Ongoing review of gender pay gaps and targeted actions to reduce differences; • Proactively educate leaders and team members around diversity and cultural awareness; • Strong focus and emphasis on the Group’s Indigenous Employment program and retention of indigenous team members; and • Identifying non-traditional roles for females and implementing strategies to recruit, retain and develop female team members.
Principle 4 – Safeguard integrity in financial reportingThe Board has established the Audit and Risk Management Committee whose role is to assist the Board to discharge its oversight responsibilities relating to:• The preparation, integrity and reporting of the Company’s financial statements; • The external and internal audit functions; • Internal controls, policies and procedures that the Company uses to identify and manage business risks; • The risk policy and risk profile; • The effectiveness of internal control systems; and • Compliance with legal, accounting and regulatory requirements and policies.
A copy of the Audit and Risk Management Committee Charter is available on the Company’s website.
The Audit and Risk Management Committee has authority to conduct or direct any investigation required to fulfil its responsibilities, may require the attendance of members of management at Committee meetings and has direct access to any employee or contractor, the external auditors or any other independent experts and advisors as it considers appropriate in order to ensure that its responsibilities can be carried out effectively.
The Audit and Risk Management Committee reviews the half-yearly and annual financial statements and narrative reporting prior to making recommendations to the Board and reviews with management the adequacy of accounting policies and any significant accounting and financial reporting issues raised by internal or external audit.
The Audit and Risk Management Committee recommends to the Board the appointment, rotation, evaluation and removal of the external auditor and reviews the external auditor’s terms of engagement, audit fees and proposed audit plan. At least bi-annually it reviews the external auditor’s independence declaration.
Details of names and relevant qualifications of those directors appointed to the Audit and Risk Management Committee, the number of meetings the Audit and Risk Management Committee held during the financial year ended 30 June 2014, and the names of the attendees can be found on pages 1 to 4.
Principle 5 – Make timely and balanced disclosureThe Company’s commitment to providing the market with timely and balanced disclosure is embodied in its Continuous Disclosure Policy, which contains policies and procedures designed to ensure accountability at all levels for compliance with disclosure obligations. The policy addresses the Company’s responsibility to ensure its market announcements are made in a timely manner, are factual, do not omit material information and are expressed in a clear and objective manner that allows investors to assess the impact of the information when making investment decisions.
A copy of the Continuous Disclosure Policy is available on the Company’s website.
annual financial report 2014 13
3. Corporate governance statement (continued)Virgin Australia’s Corporate Governance Framework (continued)
Principle 6 – Respect the rights of shareholdersVirgin Australia has an internal Investor Relations (IR) function and its objectives are to:• Ensure the market is kept informed (as required under ASX Listing Rules) about VAH’s position, operations, strategy and outlook;• Maintain communications and credibility with investors, analysts, shareholders, regulatory bodies and business partners;• Inform management and the Board about developments in financial markets, perceptions of investors and analysts;• Enhance management’s understanding of market and peers performance, strengths and strategies; and• Ensure consistency and relevance of market communications.
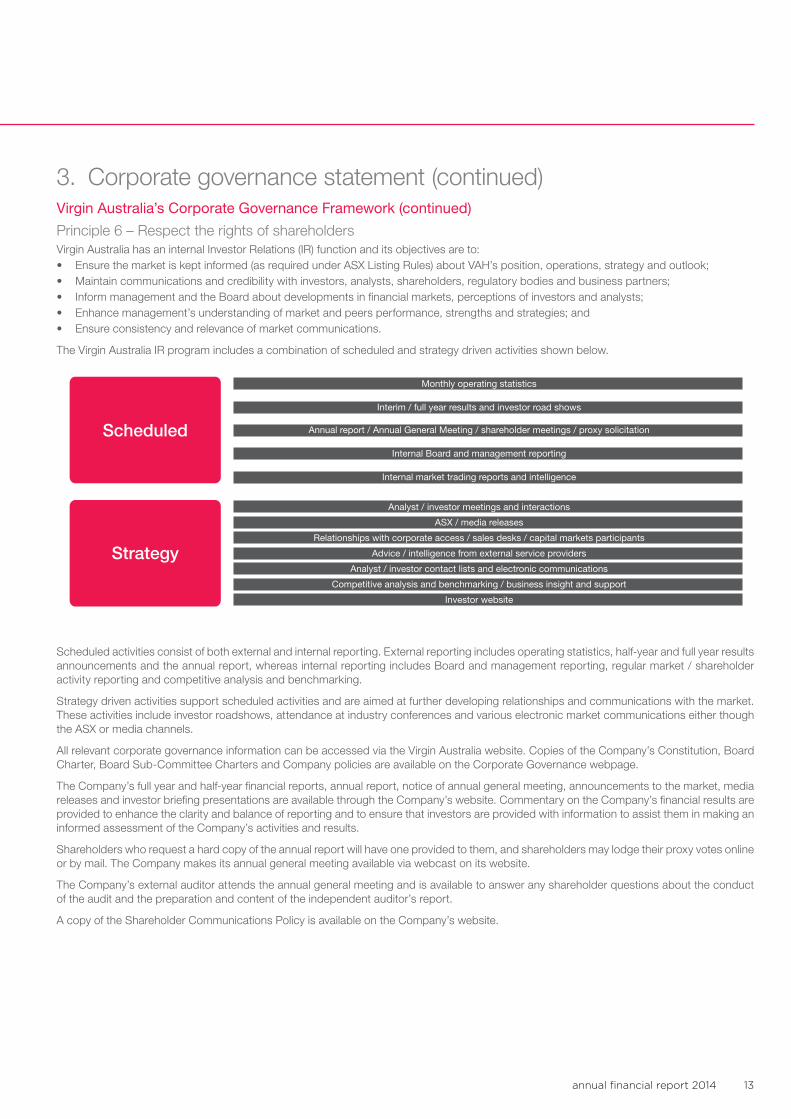
The Virgin Australia IR program includes a combination of scheduled and strategy driven activities shown below.
Monthly operating statistics
Scheduled
Strategy
Interim / full year results and investor road shows
Annual report / Annual General Meeting / shareholder meetings / proxy solicitation
Internal Board and management reporting
Internal market trading reports and intelligence
Analyst / investor meetings and interactions
ASX / media releases
Relationships with corporate access / sales desks / capital markets participants
Advice / intelligence from external service providers
Analyst / investor contact lists and electronic communications
Competitive analysis and benchmarking / business insight and support
Investor website
Scheduled activities consist of both external and internal reporting. External reporting includes operating statistics, half-year and full year results announcements and the annual report, whereas internal reporting includes Board and management reporting, regular market / shareholder activity reporting and competitive analysis and benchmarking.
Strategy driven activities support scheduled activities and are aimed at further developing relationships and communications with the market. These activities include investor roadshows, attendance at industry conferences and various electronic market communications either though the ASX or media channels.
All relevant corporate governance information can be accessed via the Virgin Australia website. Copies of the Company’s Constitution, Board Charter, Board Sub-Committee Charters and Company policies are available on the Corporate Governance webpage.
The Company’s full year and half-year financial reports, annual report, notice of annual general meeting, announcements to the market, media releases and investor briefing presentations are available through the Company’s website. Commentary on the Company’s financial results are provided to enhance the clarity and balance of reporting and to ensure that investors are provided with information to assist them in making an informed assessment of the Company’s activities and results.
Shareholders who request a hard copy of the annual report will have one provided to them, and shareholders may lodge their proxy votes online or by mail. The Company makes its annual general meeting available via webcast on its website.
The Company’s external auditor attends the annual general meeting and is available to answer any shareholder questions about the conduct of the audit and the preparation and content of the independent auditor’s report.
A copy of the Shareholder Communications Policy is available on the Company’s website.
Virgin Australia14
Directors’ report (continued)
3. Corporate governance statement (continued)Virgin Australia’s Corporate Governance Framework (continued)
Principle 7 – Recognise and manage risk
Risk management systemThe Board believes that it has ultimate responsibility to ensure that the Company’s risk management systems are both in place and effective. To discharge that responsibility, the Board through its Audit and Risk Management Committee and Safety and Operational Risk Review Committee continues to review and enhance the systems of risk management and oversight that cover the key strategic, financial, commercial, safety, security, operational and compliance risks of the Group.
The Risk Management Framework has been developed and implemented to guide the identification and management of risks to support the achievement of business objectives and the fulfilment of corporate governance obligations. The Framework which is aligned to the Australian/New Zealand Standard on Risk Management (AS/NZS ISO 31000:2009 Risk Management – Principles and Guidelines) is reviewed annually to ensure it continues to be sound. The Risk Management Policy, Standard and Matrix which are contained in the Framework are dynamic documents that evolve with the changes in strategic direction of the Company. A copy of the Risk Management Policy is available on the Company’s website.
Risk management forms an integral part of all decision making and as such, is embedded into the Company’s existing processes. Awareness of, and compliance with, safety, security and other regulation and legislation is also critical to the ongoing sustainability of the business. To this end, teams have been established to coordinate risk management within the Group and to assist each department in undertaking its own risk assessments, tracking and monitoring progress on the implementation of risk action plans, and the facilitation of risk reporting to the Executive Committee and the Board.
Declarations under s295A of the Corporations Act 2001The CEO and the Chief Financial Officer (CFO) have declared, in writing to the Board, that the financial reporting risk management and associated compliance and controls have been assessed and found to be operating efficiently and effectively. The operational and other risk management compliance and controls have also been assessed and found to be operating efficiently and effectively. All assessments covered the whole financial period up to the signing of the annual financial report for all material operations of the Group.
The CEO and the CFO declare in writing to the Board that the financial records of the Company for the financial year have been properly maintained, that the Company’s financial reports for the financial year comply with Australian Accounting Standards and International Financial Reporting Standards and present a true and fair view of the Company’s consolidated financial position and performance. This statement is required annually and is made in accordance with section 295A of the Corporations Act 2001.
The CEO and the CFO also declare, in writing to the Board, that the Company’s financial reports are founded on a sound system of risk management and internal compliance and control which implements the policies adopted by the Board.
Monthly actual results are reported against budgets approved by the Board and revised forecasts for the year are prepared periodically.
Internal auditThe Group’s internal audit function assists the Board by providing independent and objective assurance and consulting services that are designed to improve the effectiveness of the Company’s risk management, control and governance processes. It also partners with management to add value by assisting in the achievement of both strategic and operational objectives.
The Audit and Risk Management Committee is responsible for recommending to the Board the appointment and dismissal of the General Manager Internal Audit who has a direct reporting line to the Chair of the Committee to bring the requisite degree of independence and objectivity to the role.
Via the Internal Audit Charter, which is approved by the Committee, authority is granted to internal audit for full, free and unrestricted access to any and all records, physical properties and personnel relevant to any function under review.
The audit plan details the program of audits to be conducted each financial year, is risk-based to align the assurance activities to the key business risks and is approved by the Audit and Risk Management Committee. Audit findings and the implementation of internal audit recommendations by management are reported to the Audit and Risk Management Committee who also periodically assess the performance of the internal audit function.
The Audit and Risk Management Committee also conducts a periodic assessment of the performance and independence of the internal audit function and reviews management action plans in response to internal audit findings.
Environmental regulationThe Group’s operations are subject to noise pollution and other similar environmental regulations. The directors believe that the Group has adequate systems in place for the management of its environmental requirements and are not aware of any breach of those environmental requirements as they apply to the Group.
annual financial report 2014 15
3. Corporate governance statement (continued)Virgin Australia’s Corporate Governance Framework (continued)
Principle 8 – Remunerate fairly and responsibly
Remuneration CommitteeThe Board has established a Remuneration Committee consisting of four non-executive directors which is responsible for determining and agreeing with the Board a framework and broad policy for remuneration. It advises the Board on remuneration policies and practices generally, and makes specific recommendations on remuneration packages, incentives and other terms of employment for non-executive and executive directors, the CEO and senior executives. A copy of the Remuneration Committee Charter is available on the Company’s website.
The Remuneration Committee on behalf of the Board may independently seek any information it requires from any employee in order to perform its duties and may appoint remuneration consultants or other advisors as appropriate at the Company’s expense. The Committee ensures, through strong governance procedures, that no employee is directly involved in determining their own remuneration mix and quantum.
The names of the members of the Remuneration Committee and their attendance at meetings are disclosed at pages 4 and 7.
Remuneration structureThe Group aims to set executive remuneration competitively against the peer group, considering the size and nature of an individual’s role as well as performance in the role. The mix of remuneration, between fixed and variable components, aligns to Group strategy, business imperatives and regulatory requirements.
Non-executive directors are remunerated by way of fees and do not participate in schemes designed for the compensation of executives. They do not receive options or bonus payments and are not provided with retirement benefits other than statutory superannuation.
Further details of compensation of directors and key management personnel can be found in the Remuneration report at pages 32 and 33.
4. Review and results of operations4.1 Overview of the GroupThe Group is a for-profit entity and is primarily involved in the airline industry, both domestic and international. Launched in 2000, it has since established itself as a contemporary, full service airline, with a reputation for exceptional customer service.
The airline employs more than 9,400 people in Australia, New Zealand and the United States of America (USA). Virgin Australia has strategic alliances with four key airline partners: Air New Zealand Limited, Etihad Airways P.J.S.C., Singapore Airlines Limited and Delta Air Lines Inc., providing customers with access to over 450 destinations worldwide. Its domestic and international operations are complemented by Virgin Samoa Limited, an arrangement with the Government of Samoa.
Virgin Australia operates a modern fleet of aircraft that includes Boeing B737 and Boeing B777 aircraft, Airbus A320 and Airbus A330 aircraft, ATR aircraft, Embraer E190 aircraft, and Fokker F50 and Fokker F100 aircraft that fly to a range of Australian domestic ports, including regional network operations and international destinations comprising of Trans-Pacific, Abu Dhabi, Trans-Tasman, Pacific Island and South East Asian routes. The airline offers a variety of airfares and products to suit the leisure, corporate, government and regional markets.
Game Change Program StrategyVirgin Australia introduced the Game Change Program Strategy in the 2011 financial year, designed to position the Group as the airline of choice in all market segments and ensure delivery of sustainable earnings benefits to the business in the future. The program utilised Virgin Australia’s competitive cost base and its strong operational excellence to achieve these goals.
The first phase of the Game Change Program Strategy was based on five pillars: • Ensure Virgin Australia’s capacity is closely aligned to profitability;• Establish a virtual global network through strategic airline alliances; • Grow Virgin Australia’s share of the Australian corporate business from 10% to 20%; • Maintain Virgin Australia’s strong presence in the leisure market; and • Enhance Virgin Australia’s already strong brand in Australia and in overseas markets.
Having achieved the goals of the first phase of the Game Change Program Strategy ahead of schedule, the Group commenced the Game On phase during the 2013 financial year, which revolved around driving new growth opportunities for the business, while retaining a cost-efficient, flexible business model.
Virgin Australia16
Directors’ report (continued)
4. Review and results of operations (continued)4.1 Overview of the Group (continued)
Game Change Program Strategy (continued)This Game On phase was formed around five key strategic pillars: • Implementing a business efficiency project;• Building a transformational loyalty business;• Increasing access to global markets;• Further enhancing the guest experience through in-flight and on-the-ground innovation; and• Continuing to develop our people and service excellence.
Two key acquisitions were completed as part of the Game On phase.
On 19 April 2013, Virgin Australia completed its acquisition of a 100% interest in Skywest Airlines Pte Ltd (formerly known as Skywest Airlines Ltd) (Skywest) and its subsidiaries (Skywest Group), a regional carrier based in Western Australia. Now operating as Virgin Australia Regional Airlines, it provides Virgin Australia with the assets and capabilities to fast-track its advancement in the fly-in-fly-out and regional markets in Western Australia.
In addition, Virgin Australia acquired a 60% interest in Tiger Airways Australia Pty Limited (Tiger) on 8 July 2013 as disclosed in section 4.3(e). The acquisition has enabled Virgin Australia to re-enter the budget travel market segment with an aim of working with Tiger Airways Holdings Limited (Tiger Holdings) to establish Tiger as the airline of choice in the budget market segment. During the second phase of the Game Change Program, the Group focused on ensuring a leadership position is maintained in the leisure, corporate and government market segments, as well as increasing its presence in the regional market segment through the Virgin Australia brand and in the budget market segment through its investment in Tiger.
At the end of the 2014 financial year, Virgin Australia confirmed that the Game Change Program Strategy had been completed ahead of schedule and introduced a new three-year strategy, Virgin Vision 2017.
Significant risks and uncertaintiesVirgin Australia is exposed to a range of risks associated with operating in the domestic and international airline industry. These include:• Aviation fuel price trends, which can significantly affect fuel costs;• Increases in airport, transit and landing fees, and the costs of ensuring air traffic security; • Competition from other airlines and from alternative means of transportation;• Governmental policy changes or decisions which could have an adverse impact on its business, results of operations and financial condition; • Industrial action by unionised employees, which can adversely impact operations and staff engagement; • Stability of critical systems, including technology and communication services, which can disrupt operations;• Global economic and geopolitical conditions, as well as pandemics, terrorism, severe weather conditions, natural disasters or other Acts of
God, which can materially adversely affect operations and demand for air travel; • Losses associated with major safety or security incidents; • Ability to obtain sufficient funds on acceptable terms, or at all, to provide adequate liquidity and to finance necessary operating and capital
expenditures; • Currency risk, as the denominated currency for a significant portion of the Group’s asset base, being aircraft, and also a signficant portion
of the Group’s aircraft funding, is USD. Further significant revenue and expenditure transactions are completed in various world currencies;• Liquidity risk, inability to meet financial obligations as they fall due; and• Credit risk, failure of counterparties and dependency on third party service and facility providers.
The Group’s exposure to these risks has the potential to affect liquidity, and/or result in impairment of the Group’s cash-generating units (CGUs). Impairment testing is performed on an annual basis, or more frequently if required, to determine if the impact of key risks has generated impairment losses during the financial year and considers the potential impacts, through sensitivity testing, for future financial years. Refer to note 23(b) to the consolidated financial statements.
Virgin Australia aims to ensure that all activities are undertaken with the Board of Directors (the Board) approved risk appetite and management guidelines and with sufficient independent oversight to protect the safe operations, profitability, financial position and reputation of the Group.
The identification and management of risk reduces the uncertainty associated with the execution of Virgin Australia’s business strategies and allows the Group to maximise opportunities that may arise. All staff are accountable for identifying, assessing and managing risks in a proactive manner. Virgin Australia has established the Audit and Risk Management Committee which is responsible for the internal controls, policies and procedures that the Group uses to identify and manage business risks. The risk management system implemented by the committee is described in further detail in section 3, Principle 7 of the Corporate governance statement on page 14.
Virgin Australia is committed to managing risks in a proactive and effective manner to provide assurance to the Board of Directors and stakeholders. This commitment is supported by Virgin Australia’s philosophy and approach in effective risk management and is in line with the principles outlined in the Mission Statement, Safety Policy, Just Culture Policy and Risk Management Policy of the Group.
annual financial report 2014 17
4. Review and results of operations (continued)4.1 Overview of the Group (continued)
Significant risks and uncertainties (continued)Virgin Australia actively and systematically manages risks related to its operations. This management includes: • Operating a comprehensive risk management framework through the business that sets out Virgin Australia’s objectives regarding
risk management and outlines Virgin Australia’s Risk Management Standards and specific accountabilities and responsibilities for risk management;
• Managing safety-related risks across our business, and striving for continuous improvement in safety practices. Virgin Australia is audited every two years against a global standard, by an accredited IATA Operations Safety Audit (IOSA) Audit Organisation;
• Conducting a thorough business planning process throughout the organisation; and• Maintaining a comprehensive hedging program. The tiered hedging policy introduced late in the 2011 financial year has positioned the
Group well to operate in a continuing high fuel cost environment. The policy has provided the Group with a large degree of certainty in the short-term, while maintaining flexibility in the longer term.
The Group’s 60% investment in Tiger is subject to the same risks as the Group from operating in the domestic airline industry. In addition, as Tiger is based on the low cost airline model its exposure is skewed to this market share and therefore is more susceptible to changes in consumer sentiment. The Group monitors its exposure in Tiger through its membership on the Tiger Board.
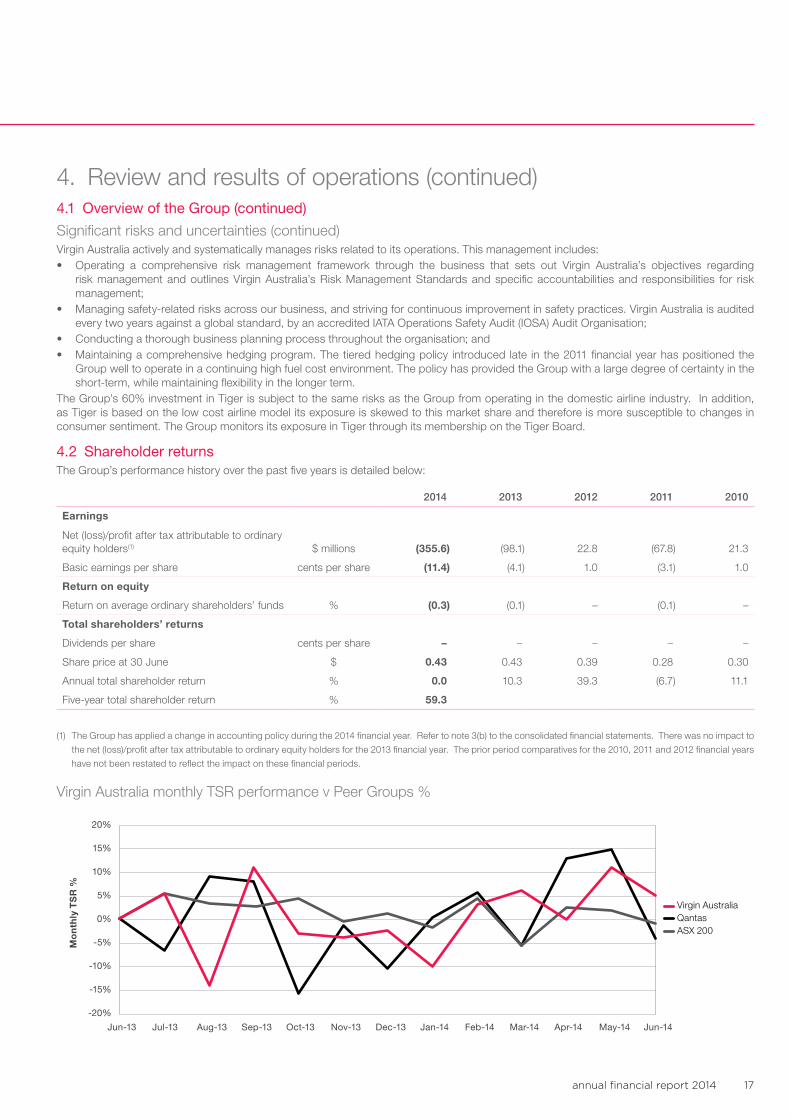
4.2 Shareholder returnsThe Group’s performance history over the past five years is detailed below:
2014 2013 2012 2011 2010
Earnings
Net (loss)/profit after tax attributable to ordinary equity holders(1) $ millions (355.6) (98.1) 22.8 (67.8) 21.3
Basic earnings per share cents per share (11.4) (4.1) 1.0 (3.1) 1.0
Return on equity
Return on average ordinary shareholders’ funds % (0.3) (0.1) – (0.1) –
Total shareholders’ returns
Dividends per share cents per share – – – – –
Share price at 30 June $ 0.43 0.43 0.39 0.28 0.30
Annual total shareholder return % 0.0 10.3 39.3 (6.7) 11.1
Five-year total shareholder return % 59.3
(1) The Group has applied a change in accounting policy during the 2014 financial year. Refer to note 3(b) to the consolidated financial statements. There was no impact to
the net (loss)/profit after tax attributable to ordinary equity holders for the 2013 financial year. The prior period comparatives for the 2010, 2011 and 2012 financial years
have not been restated to reflect the impact on these financial periods.
Virgin Australia monthly TSR performance v Peer Groups %
Mo
nth
ly T
SR
%
Virgin Australia TSR performance v Peer Groups %
Virgin AustraliaQantasASX 200
20%
15%
10%
5%
0%
-5%
-10%
-15%
-20%
Jun-14May-14Apr-14Mar-14Feb-14Jan-14Dec-13Nov-13Oct-13Sep-13Aug-13Jul-13Jun-13
Virgin Australia18
Directors’ report (continued)
4. Review and results of operations (continued)4.3 Review of financial condition
(a) Statement of profit or lossThe Group recognised revenue and income of $4,306.6 million for the financial year ended 30 June 2014, including the additional revenue associated with the acquisition of Skywest. While revenue growth in the leisure and regional businesses was subdued, this was partially offset by revenue growth in the Corporate, Government, Charter and Interline and Codeshare businesses. This revenue growth was a continuation of the trend noted throughout the strategic five year Game Change Program, which concluded with multiple successes at the end of the 2014 financial year.
As part of the final phase of the Game Change Program the Group continued its program of repositioning strategies and cost saving initiatives aimed at driving further growth opportunities for the Group and improvements in future results. The impact of these key business transformation initiatives on the overall increase in operating expenses was $117.3 million in restructuring costs(1) as net operating expenses increased by $516.2 million, from $4,119.4 million to $4,635.6 million. The Group also recognised asset impairment of $51.2 million following a review of its International CGU, due to a deterioration of performance on its short haul international market segment, in particular on the Bali route, as a result of increased capacity and competition. Refer to note 23(b) to the consolidated financial statements.
Statement of profit or loss summary2014
$m
Restated 2013(2)
$mMovement
$mMovement
%
Revenue 4,286.8 3,987.8 299.0 7.5
Other income 19.8 32.5 (12.7) (39.1)
Revenue and income 4,306.6 4,020.3 286.3 7.1
Net operating expenses (4,635.6) (4,119.4) (516.2) 12.5
Share of net (losses)/profits of equity accounted investees (48.7) 0.1 (48.8) –
Loss before related income tax benefit and net finance costs (377.7) (99.0) (278.7) 281.5
Net finance costs (106.4) (50.7) (55.7) 109.9
Loss before related income tax benefit (484.1) (149.7) (334.4) 223.4
Income tax benefit 128.5 51.6 76.9 149.0
Net loss (355.6) (98.1) (257.5) 262.5
(i) Revenue and incomeRevenue and income increased 7.1% to $4,306.6 million for the financial year ended 30 June 2014 from $4,020.3 million in the prior corresponding period. This increase was mainly due to the acquistion of the Skywest business and resultant growth in the Group’s charter operations, coupled with increased yields on domestic routes stemming from higher prices and ticket sale volumes. Following the integration of the Skywest business, positive performance from the Charter business has also contributed to a 30% increase on its comparative revenue during the 2014 financial year.
Revenue load factor(3) increased by 2.8 points to 75.6% from 78.4% in the prior corresponding period. Group yield(4) increased by 2.6% compared with the prior corresponding period comparable yield, driven by a change in customer mix and improved access to global distribution channels following the introduction of the SabreSonic booking system in January 2013.
(1) Restructuring Costs (Business restructuring and other expenses) is a non-statutory measure that includes the following items outlined in note 6 to the consolidated
financial statements: business and capital restructure costs ($101.9 million), accelerated amortisation resulting from capital restructure ($12.3 million) and accelerated
depreciation due to changes in useful life of assets and net gain/ (loss) on sale of assets ($3.1 million).
(2) The Group has applied a change in accounting policy during the 2014 financial year. Refer to note 3(b) to the consolidated financial statements. There was no impact
to the net (loss)/profit after tax attributable to ordinary equity holders for the 2013 financial year.
(3) Revenue Load Factor is a non-statutory measure which refers to Revenue Passenger Kilometres (RPKs) as a percentage of available seat kilometers (ASKs). International
and Total Network Revenue Load Factor metrics include Virgin Australia and International Alliance Partner ASK and RPK data on the Group’s revenue-share routes with
International Alliance Partners Air New Zealand Limited and Delta Air Lines Inc. This non-IFRS information has not been audited or reviewed by KPMG.
(4) Group yield is a non-statutory measure of revenue divided by RPKs. Revenue excludes charter, freight and loyalty related revenue. This non-IFRS information has not
been audited or reviewed by KPMG.
annual financial report 2014 19
4. Review and results of operations (continued)4.3 Review of financial condition (continued)
(a) Statement of profit or loss (continued)
(ii) Net operating expensesThe Group’s net operating expenses increased 12.5% to $4,635.6 million for the financial year ended 30 June 2014 from $4,119.4 million in the prior corresponding period. Underlying CASK(1) (excl. fuel) increased 3.4% during the 2014 financial year. Despite the increase in costs, this growth was well contained over the year, with a particularly strong performance in 6 months ended 30 June 2014, following the implementation of a number of major cost reduction initiatives during this period.
Key drivers of this year on year movement are largely due to implementation of key Game Change Program strategies of the Group and the competitive aviation industry as noted below:• Increased fuel consumption driven by the route expansion in line with the Group’s Game Change Program strategies, in particular as
a consequence of the integration of the Skywest regional and charter operations. • Increased airport charges, navigation and station operations passenger charges of $82.3 million as a result of port rate changes to reflect
additional occupancy and greater services provided in several key ports, coupled with an increase in guests travelling during the 2014 financial year.
• Increased commissions and other marketing and reservations expenses as a consequence of the Group’s revenue growth strategy through all sales channels.
• Increased labour and staff related expenses of $65.3 million, largely due to the integration of the Skywest operations and its associated labour costs.
• Increased aircraft operating lease expenses of $27.9 million following an expansion of the leased aircraft fleet, with the integration of the Skywest regional and charter operations, in addition to fleet optimisation with the aim of generating long-term cost efficiencies while providing and enhanced travel experience for guests.
• A net ineffective cash flow hedges and non-designated derivatives loss of $41.1 million was recorded for the financial year ended 30 June 2014 comparing unfavourably to the net gain of $49.1 million recorded in the prior corresponding period. The 2013 financial year benefited from both a return of jet fuel prices exceeding hedged levels and also unrealised gains generated from ineffective hedge relationships. The 2014 loss was largely attributed to the realisation of the prior year unrealised gains from ineffective hedge relationships maturing in the current financial year. This was offset partially by oil prices continuing to climb above hedged levels on non-designated derivatives.
• Increase in net finance costs due to the refinancing of a collateralised pool of aircraft in the Group’s existing fleet through the use of an Enhanced Equipment Notes (EEN) facility. Refer to section 4.3(c).
(iii) Segment resultsDomestic EBIT(2) was a loss of $59.2 million, excluding the impact of unrealised ineffectiveness on cash flow hedges and non-designated derivatives and time value movement on cash flow hedges compared to a loss of $34.6 million in the prior comparative period. While total revenue and income increased by 8.4%, largely due to the acquisition of the Skywest business and resultant growth in the Group’s charter operations, overall performance was impacted by the competitive operating environment and increased cost base as noted above.
International EBIT(3) was a loss of $66.8 million, excluding the impact of unrealised ineffectiveness on cash flow hedges and non-designated derivatives and time value movement on cash flow hedges, an increase in loss from a loss of $8.5 million in the prior comparative period, due to increased capacity and competition in particular in the South East Asian market.
(iv) Net loss after taxStatutory net loss after tax (NLAT) was $355.6 million, an increase in loss of $257.5 million on the prior corresponding period loss of $98.1 million. The Group’s underlying loss before tax excluding impact of hedging and financial instruments(4) was $211.7 million.
(1) Underlying CASK is a non-statutory measure derived from consolidated segment revenue less consolidated segment EBIT excluding time value movement and
unrealised ineffectiveness on cash flow hedges and non-designated derivatives, charter business and non-Regular Passenger Transport costs divided by Available Seat
Kilometres of the Regular Passenger Transport business. This non-IFRS information has not been audited or reviewed by KPMG.
(2) Domestic EBIT is a non-statutory measure per note 6 to the consolidated financial statements.
(3) International EBIT is a non-statutory measure per note 6 to the consolidated financial statements.
(4) Underlying (loss)/profit before tax excluding impact of hedging and financial instruments (Underlying loss) is a non-statutory measure that represents statutory
loss before tax excluding the impact of impairment losses, restructuring costs, share of equity accounted losses and the impact of hedging and financial instruments.
This is a non-statutory measure used by Management and the Board as to assess the financial performance of Virgin Australia. This non-IFRS information has not been
audited or reviewed by KPMG.
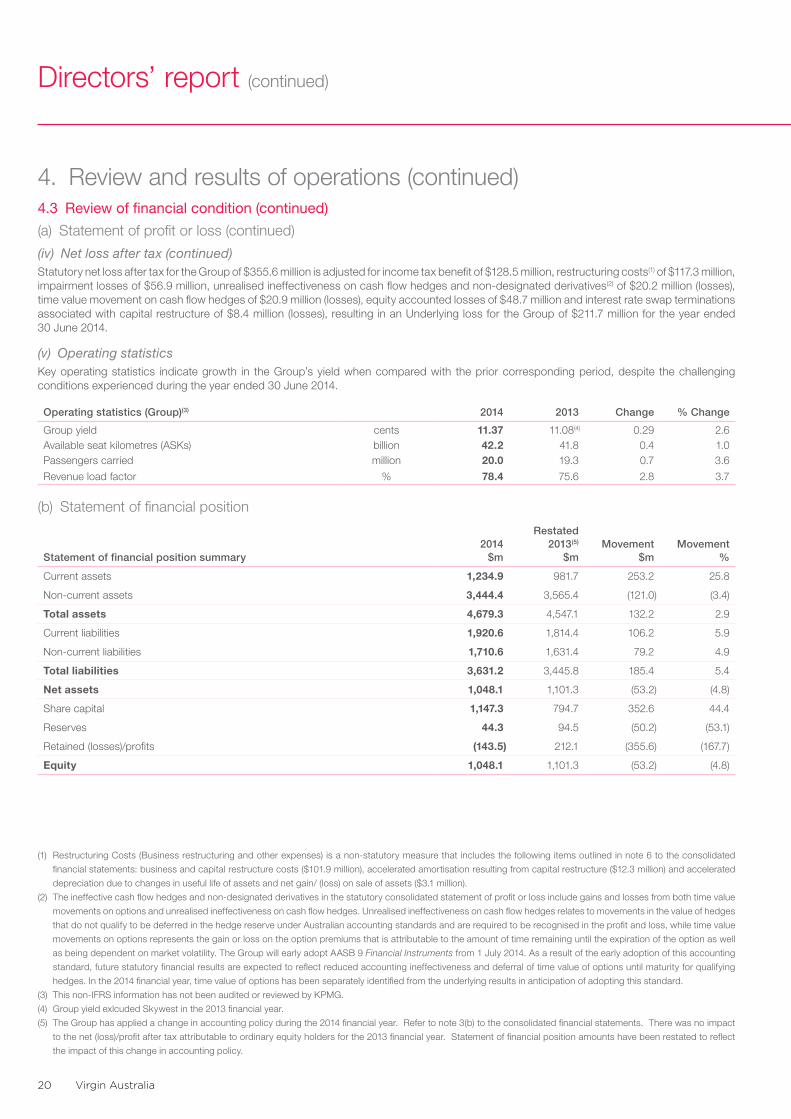
Virgin Australia20
Directors’ report (continued)
4. Review and results of operations (continued)4.3 Review of financial condition (continued)
(a) Statement of profit or loss (continued)
(iv) Net loss after tax (continued)Statutory net loss after tax for the Group of $355.6 million is adjusted for income tax benefit of $128.5 million, restructuring costs(1) of $117.3 million, impairment losses of $56.9 million, unrealised ineffectiveness on cash flow hedges and non-designated derivatives(2) of $20.2 million (losses), time value movement on cash flow hedges of $20.9 million (losses), equity accounted losses of $48.7 million and interest rate swap terminations associated with capital restructure of $8.4 million (losses), resulting in an Underlying loss for the Group of $211.7 million for the year ended 30 June 2014.
(v) Operating statisticsKey operating statistics indicate growth in the Group’s yield when compared with the prior corresponding period, despite the challenging conditions experienced during the year ended 30 June 2014.
Operating statistics (Group)(3) 2014 2013 Change % Change
Group yield cents 11.37 11.08(4) 0.29 2.6Available seat kilometres (ASKs) billion 42.2 41.8 0.4 1.0Passengers carried million 20.0 19.3 0.7 3.6
Revenue load factor % 78.4 75.6 2.8 3.7
(b) Statement of financial position
Statement of financial position summary2014
$m
Restated 2013(5)
$mMovement
$mMovement
%
Current assets 1,234.9 981.7 253.2 25.8
Non-current assets 3,444.4 3,565.4 (121.0) (3.4)
Total assets 4,679.3 4,547.1 132.2 2.9
Current liabilities 1,920.6 1,814.4 106.2 5.9
Non-current liabilities 1,710.6 1,631.4 79.2 4.9
Total liabilities 3,631.2 3,445.8 185.4 5.4
Net assets 1,048.1 1,101.3 (53.2) (4.8)
Share capital 1,147.3 794.7 352.6 44.4
Reserves 44.3 94.5 (50.2) (53.1)
Retained (losses)/profits (143.5) 212.1 (355.6) (167.7)
Equity 1,048.1 1,101.3 (53.2) (4.8)
(1) Restructuring Costs (Business restructuring and other expenses) is a non-statutory measure that includes the following items outlined in note 6 to the consolidated
financial statements: business and capital restructure costs ($101.9 million), accelerated amortisation resulting from capital restructure ($12.3 million) and accelerated
depreciation due to changes in useful life of assets and net gain/ (loss) on sale of assets ($3.1 million).
(2) The ineffective cash flow hedges and non-designated derivatives in the statutory consolidated statement of profit or loss include gains and losses from both time value
movements on options and unrealised ineffectiveness on cash flow hedges. Unrealised ineffectiveness on cash flow hedges relates to movements in the value of hedges
that do not qualify to be deferred in the hedge reserve under Australian accounting standards and are required to be recognised in the profit and loss, while time value
movements on options represents the gain or loss on the option premiums that is attributable to the amount of time remaining until the expiration of the option as well
as being dependent on market volatility. The Group will early adopt AASB 9 Financial Instruments from 1 July 2014. As a result of the early adoption of this accounting
standard, future statutory financial results are expected to reflect reduced accounting ineffectiveness and deferral of time value of options until maturity for qualifying
hedges. In the 2014 financial year, time value of options has been separately identified from the underlying results in anticipation of adopting this standard.
(3) This non-IFRS information has not been audited or reviewed by KPMG.
(4) Group yield exlcuded Skywest in the 2013 financial year.
(5) The Group has applied a change in accounting policy during the 2014 financial year. Refer to note 3(b) to the consolidated financial statements. There was no impact
to the net (loss)/profit after tax attributable to ordinary equity holders for the 2013 financial year. Statement of financial position amounts have been restated to reflect
the impact of this change in accounting policy.
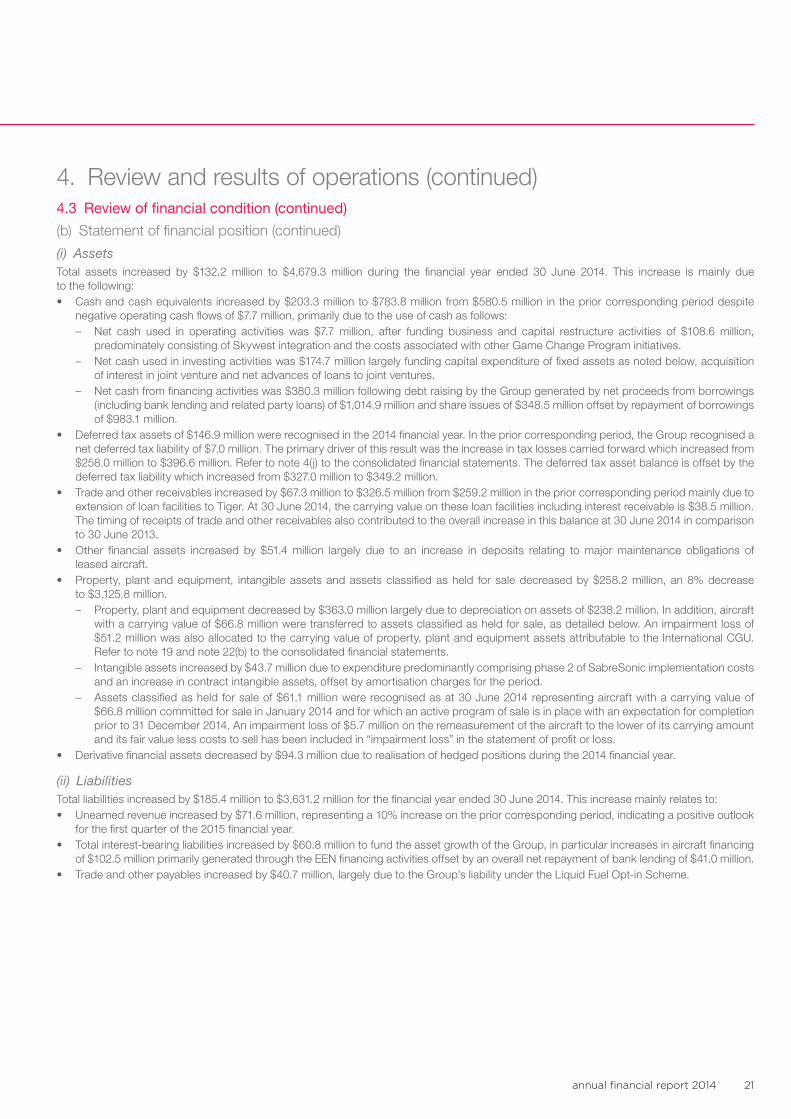
annual financial report 2014 21
4. Review and results of operations (continued)4.3 Review of financial condition (continued)
(b) Statement of financial position (continued)
(i) AssetsTotal assets increased by $132.2 million to $4,679.3 million during the financial year ended 30 June 2014. This increase is mainly due to the following:• Cash and cash equivalents increased by $203.3 million to $783.8 million from $580.5 million in the prior corresponding period despite
negative operating cash flows of $7.7 million, primarily due to the use of cash as follows: – Net cash used in operating activities was $7.7 million, after funding business and capital restructure activities of $108.6 million,
predominately consisting of Skywest integration and the costs associated with other Game Change Program initiatives. – Net cash used in investing activities was $174.7 million largely funding capital expenditure of fixed assets as noted below, acquisition
of interest in joint venture and net advances of loans to joint ventures. – Net cash from financing activities was $380.3 million following debt raising by the Group generated by net proceeds from borrowings
(including bank lending and related party loans) of $1,014.9 million and share issues of $348.5 million offset by repayment of borrowings of $983.1 million.
• Deferred tax assets of $146.9 million were recognised in the 2014 financial year. In the prior corresponding period, the Group recognised a net deferred tax liability of $7.0 million. The primary driver of this result was the increase in tax losses carried forward which increased from $258.0 million to $396.6 million. Refer to note 4(j) to the consolidated financial statements. The deferred tax asset balance is offset by the deferred tax liability which increased from $327.0 million to $349.2 million.
• Trade and other receivables increased by $67.3 million to $326.5 million from $259.2 million in the prior corresponding period mainly due to extension of loan facilities to Tiger. At 30 June 2014, the carrying value on these loan facilities including interest receivable is $38.5 million. The timing of receipts of trade and other receivables also contributed to the overall increase in this balance at 30 June 2014 in comparison to 30 June 2013.
• Other financial assets increased by $51.4 million largely due to an increase in deposits relating to major maintenance obligations of leased aircraft.
• Property, plant and equipment, intangible assets and assets classified as held for sale decreased by $258.2 million, an 8% decrease to $3,125.8 million. – Property, plant and equipment decreased by $363.0 million largely due to depreciation on assets of $238.2 million. In addition, aircraft
with a carrying value of $66.8 million were transferred to assets classified as held for sale, as detailed below. An impairment loss of $51.2 million was also allocated to the carrying value of property, plant and equipment assets attributable to the International CGU. Refer to note 19 and note 22(b) to the consolidated financial statements.
– Intangible assets increased by $43.7 million due to expenditure predominantly comprising phase 2 of SabreSonic implementation costs and an increase in contract intangible assets, offset by amortisation charges for the period.
– Assets classified as held for sale of $61.1 million were recognised as at 30 June 2014 representing aircraft with a carrying value of $66.8 million committed for sale in January 2014 and for which an active program of sale is in place with an expectation for completion prior to 31 December 2014. An impairment loss of $5.7 million on the remeasurement of the aircraft to the lower of its carrying amount and its fair value less costs to sell has been included in “impairment loss” in the statement of profit or loss.
• Derivative financial assets decreased by $94.3 million due to realisation of hedged positions during the 2014 financial year.
(ii) LiabilitiesTotal liabilities increased by $185.4 million to $3,631.2 million for the financial year ended 30 June 2014. This increase mainly relates to:• Unearned revenue increased by $71.6 million, representing a 10% increase on the prior corresponding period, indicating a positive outlook
for the first quarter of the 2015 financial year.• Total interest-bearing liabilities increased by $60.8 million to fund the asset growth of the Group, in particular increases in aircraft financing
of $102.5 million primarily generated through the EEN financing activities offset by an overall net repayment of bank lending of $41.0 million.• Trade and other payables increased by $40.7 million, largely due to the Group’s liability under the Liquid Fuel Opt-in Scheme.
Virgin Australia22
Directors’ report (continued)
4. Review and results of operations (continued)4.3 Review of financial condition (continued)
(b) Statement of financial position (continued)
(iii) EquityEquity decreased by $53.2 million to $1,048.1 million for the financial year ended 30 June 2014 primarily due to the loss after tax of $355.6 million, decrease in the reserves balances of $50.2 million (predominantly the decrease in the hedging reserve of $52.7 million) offset by the issue of ordinary shares of $352.6 million.
Shares issued included 925.0 million new shares pursuant to the terms of the fully underwritten pro-rata, non-renounceable entitlement offer, comprising an institutional component (Institutional Entitlement Offer) and retail component (Retail Entitlement Offer), announced on 14 November 2013. On 29 November 2013, 740.6 million shares were issued under the Institutional Entitlement Offer at a price of $0.38 per share resulting in an increase in share capital of $281.4 million. On 17 December 2013, 184.4 million shares were issued under the Retail Entitlement Offer at a price of $0.38 per share, resulting in an increase in share capital of $70.1 million. Transaction costs associated with the capital raising were capitalised and offset against share capital.
In addition shares were issued under Group share-based payment senior executive option plans and employee share plans which vested on 30 June 2013 and 1 July 2013 with a value of $2.9 million.
(iv) Net current liability positionThe Group’s current liabilities exceed its current assets for the year ended 30 June 2014 by $685.7 million including a current liability for unearned revenue of $807.7 million. The consolidated financial statements have been prepared on a going concern basis, which contemplates the return to profitable trading and retention of a strong cash position. A net improvement of $147.0 million in net current liabilities was achieved in the year ended 30 June 2014, mainly due to an increase in cash and cash equivalents primarily due to debt and equity funding raised during the year. The Group has a cash and cash equivalents balance at 30 June 2014 of $783.8 million and has an unrestricted cash balance at 30 June 2014 of $541.0 million.
(v) DividendsNo dividends were declared and paid by the Company since the end of the previous financial period. No final dividend has been declared or paid for the 2014 financial year.
(c) Capital structureCapital management is a key focus of the Board and senior management and it is the Group’s policy to maintain a strong capital base that will ensure continuing investor, creditor and market support for the future development of the business.
The Board monitors the liquidity of the Group including unrestricted cash balances. Future financing requirements including those relating to aircraft purchases are monitored with determination of financing being based on competitively priced financing alternatives available at the time of the financing transaction. Compliance with debt covenants is monitored.
The Group’s mix of interest-bearing liabilities as at 30 June 2013 consisted of aeronautic finance facilities, secured bank loans, loans from associates and finance lease liabilities, of which 19.8% were current facilities and 80.2% were non-current facilities. As at 30 June 2014, this mix was extended to include unsecured bank loans, of which 18.5% were current facilities and 81.5% were non-current facilities.
During the year, the Group refinanced a collateralised pool of aircraft within the Group’s existing fleet through the use of an EEN facility. The EEN’s were issued in four classes (Class A to D), backed by an underlying collateral pool of Boeing B737 and B777 aircraft. Proceeds from the EEN issue were allocated to repay existing aeronautic financing facilities and for general financing purposes. In addition, the Group entered into a subordinated loan arrangement with a carrying amount of $63.8 million at 30 June 2014, secured on a subordinated basis by interests in 34 aircraft. The Group also entered into a number of new bank loan facilities during the year and repaid a $99.0 million secured loan during the 2014 financial year. There were no other significant changes in the Group’s approach to capital management during the year.
(d) Treasury policyThe Group recognises the importance of hedging against volatility in cost of debt, foreign exchange and commodity prices, with particular reference to:• Interest rates;• USD, the denominated currency of a significant portion of the Group’s asset base, being aircraft, and also a significant portion of the
Group’s aircraft funding; and • Jet fuel, a key commodity used by the Group.
The Group enters into derivative financial instruments to hedge its foreign currency, fuel price, interest rate risk exposures and specific asset purchases denominated in foreign currencies.
annual financial report 2014 23
4. Review and results of operations (continued)4.3 Review of financial condition (continued)
(e) Significant changes in the state of affairs
(i) Acquisition of shareholding in Tiger Airways Australia Pty LimitedOn 8 July 2013, the Group acquired 60% of the shareholding in Tiger. Since then, the Tiger business has undergone the first year of its transformation program, which sets out a clear path to profitability. Over the last 12 months Virgin Australia has worked with Tiger Holdings and Tiger to overhaul revenue and accounting systems, develop the management team, improve asset utilisation and enhance the operational platform. The focus over the next three years will be on successfully executing this program, to achieve profitability in financial year 2017. The Group is committed to working with Tiger Holdings and Tiger to ensure the airline has the right network footprint, service standards and cost leadership, to deliver improved financial performance.
(ii) Virgin Australia Regional AirlinesThe recently acquired Skywest business has now been fully integrated into the Virgin Australia platform and the Group has noted positive performance from the Charter business which has increased its comparative revenue contribution by 30% this financial year. The Charter business continues to represent a strong growth opportunity for the Group going forward.
(iii) Board representationIn December 2013, Virgin Australia completed a fully underwritten 5 for 14 pro rata accelerated non-renounceable entitlement offer, raising gross proceeds of approximately $350 million. Virgin Australia’s major shareholders and strategic partners were supportive of the Entitlement Offer and took up their full entitlements.
At the time, Virgin Australia also announced that the Virgin Australia Board intended to work with the major airline shareholders for board representation with appropriate protocols. Representatives of three major airline shareholders, Air New Zealand, Etihad Airways and Singapore Airlines were appointed to the Board in July 2014.
(iv) Velocity Frequent Flyer programSubsequent to 30 June 2014, the Group has executed documents for the sale of a 35% minority interest in the Velocity Frequent Flyer program for total consideration of $336.0 million. Completion of the transaction is subject to customary conditions and regulatory approvals, including Foreign Investment Review Board approval, finalisation of due diligence items and completion of final transaction documents.
(f) Likely developments and future prospectsNow that Virgin Australia has completed the Game Change Program, the Group has commenced Virgin Vision 2017, a strategy to maximise the Group’s potential by extracting value from the business. Over the next three years, the Virgin Australia Group will focus on six key areas: • Capitalising on growth business opportunities;• Driving yield enhancement;• Implementing a new cost program;• Optimising the balance sheet;• Setting a new standard in customer experience; and• Developing our people to their full potential.
This comprehensive plan of initiatives is designed to deliver a sustainable, profitable business over the long-term.
Key challenges for the Group include the ongoing difficult economic environment, high fuel prices, strong competition in the airline industry and consolidating recent business acquisitions.
Virgin Australia24
Directors’ report (continued)
5. Remuneration report – auditedDear Shareholder
I am pleased to present our remuneration report for the 2014 financial year.
The Group has continued to execute on the Game Change Program strategy during the 2014 financial year, completing the five-year strategy one year ahead of schedule and delivering the Group’s targets around the Velocity Frequent Flyer program, global market access and customer experience.
The work completed this year is critical to our goal of creating a business that can deliver sustainable performance for the long-term, through the positioning of the Virgin Australia Group as an effective competitor in all key market segments.
Several major strategic initiatives, essential to ensuring a successful and sustainable business model, were executed during the year. The Group significantly improved the balance sheet and transformed the loyalty business. The Group also continued to consolidate our positioning across all key market segments, including further expanding our regional network and enhancing our strong partnerships with leading global airlines, bringing significant benefits to the Australian consumer.
The Group also progressed with the integration of Skywest, delivering revenue growth while continuing to align resources, systems and processes, and has worked closely with joint venture partner Tiger Airways Holdings Limited (Tiger Holdings) to improve the performance of Tiger Airways Australia Pty Limited (Tiger).
Despite the achievements, the Australian aviation market continued to be impacted by the significant capacity growth which occurred during the 2013 financial year, compounded by weak economic conditions and the inability to recover the cost of the Carbon Tax. This has impacted financial performance across the industry, and the Group has delivered a loss for the 2014 financial year.
As outlined last year, during the 2014 financial year the Board has taken the opportunity to undertake a further review of the Group’s reward strategy. This review has been conducted in a completely independent manner, free from undue influence from the CEO or executives. The Board is satisfied with the agreed outcomes. The review appraised several areas including changes to the Group’s corporate structure, market relativities and greater alignment of the CEO and executive remuneration.
The resulting changes to the structure of the CEO and executive short and long term incentives have been made to ensure the Group can continue to attract develop and retain senior executives through a competitive reward strategy. The Board views this as extremely important to ensure alignment to long term shareholder interests and improved performance. The Board sees this as critical to achieving the next phase of the strategy and delivering sustainable profitability to shareholders.
In line with the Group’s remuneration philosophy and the guiding principles, in the Board’s view, it is not appropriate to undertake an annual review of the fixed remuneration of the CEO and senior executives as we move into the 2015 financial year, other than for significant changes in responsibilities. This will be the second year that the Board has agreed to not undertake a CPI review of fixed remuneration for this group.
The Board carefully considered the appropriate incentive payments for the CEO and senior executives, given their success in completing the Game Change Program and positioning the business for long term sustainable performance in a tough environment for the aviation industry. It was agreed to make payments based on the corporate scorecard performance and the achievement of individual performance objectives.
To ensure continued alignment between remuneration, performance and shareholder value, the Board will, as appropriate, review CEO and executive remuneration during the 2015 financial year. Any future changes to the philosophy will continue to ensure that we have the appropriate mix of remuneration to attract, develop and retain the best people in the Group who strive passionately to create an airline that delivers unrivalled safety, exceptional customer service and shareholder value.
We are pleased to be providing this important information to shareholders and welcome your feedback. Thank you for taking the time to read this report.
Sam MostynChair, Remuneration Committee
annual financial report 2014 25
5. Remuneration report – audited (continued)The report is structured as follows:5.1 Key management personnel5.2 Remuneration governance5.3 Remuneration philosophy5.4 Market review5.5 Remuneration alignment to strategy5.6 Link to 2014 financial year performance5.7 2014 remuneration outcome5.8 Non-executive directors’ fees5.9 Remuneration consultant5.10 Remuneration disclosures for the year ended 30 June 20145.11 Service agreements5.12 Additional information
5.1 Key management personnelThis report covers the key management personnel (KMP) of the Group.
KMP are those people with authority and responsibility for planning, directing and controlling the activities of the Group, directly or indirectly.
For the Group, the KMP are defined to be:• Chief Executive Officer (CEO); • Senior executives in Group Management Committee positions; and• Non-executive directors.
For the year ended 30 June 2014, the CEO and senior executives were:• Chief Executive Officer – Mr J Borghetti• Chief Financial Officer – Mr S Narayan • Chief Customer Officer – Mr M Hassell • Chief Commercial Officer – Ms J Crompton• Chief Executive Officer Velocity – Mr N Thompson • Group Executive, Virgin Australia Regional Airlines – Ms M McArthur• Chief Operating Officer – Mr G Hammes (Commenced as KMP on 11 February 2014)• Chief Operating Officer – Mr S Donohue (Ceased as KMP on 18 October 2013)
5.2 Remuneration governanceThe Remuneration Committee is responsible for making recommendations to the Board on remuneration policies, structure and performance of the CEO, senior executives and non-executive directors.
Executive remuneration is set with reference to a comparator group of organisations. This peer group comprises organisations of a similar size to the Group in terms of market capitalisation and revenue. The Group aims to set executive remuneration competitively against the peer group, considering the size and nature of an individual’s role as well as performance in the role. The mix of remuneration, between fixed and variable components, takes into account that the CEO and senior executives are expected to drive both the short term objectives for the Group as well as create long term value for the shareholder. Remuneration structure and quantum are assessed annually to regularly align Group strategy and business imperatives.
This annual assessment by the Remuneration Committee is through a process that links individual and Group key performance indicators (KPIs) to the overall performance of each of the CEO and senior executives.
The Board’s Remuneration Committee, consisting of four non-executive directors, is responsible for determining and agreeing with the Board a framework and broad policy for remuneration. It advises the Board on remuneration policies and practices generally, and makes specific recommendations on remuneration packages, incentives and other terms of employment for non-executive and executive directors, and the CEO and senior executives.
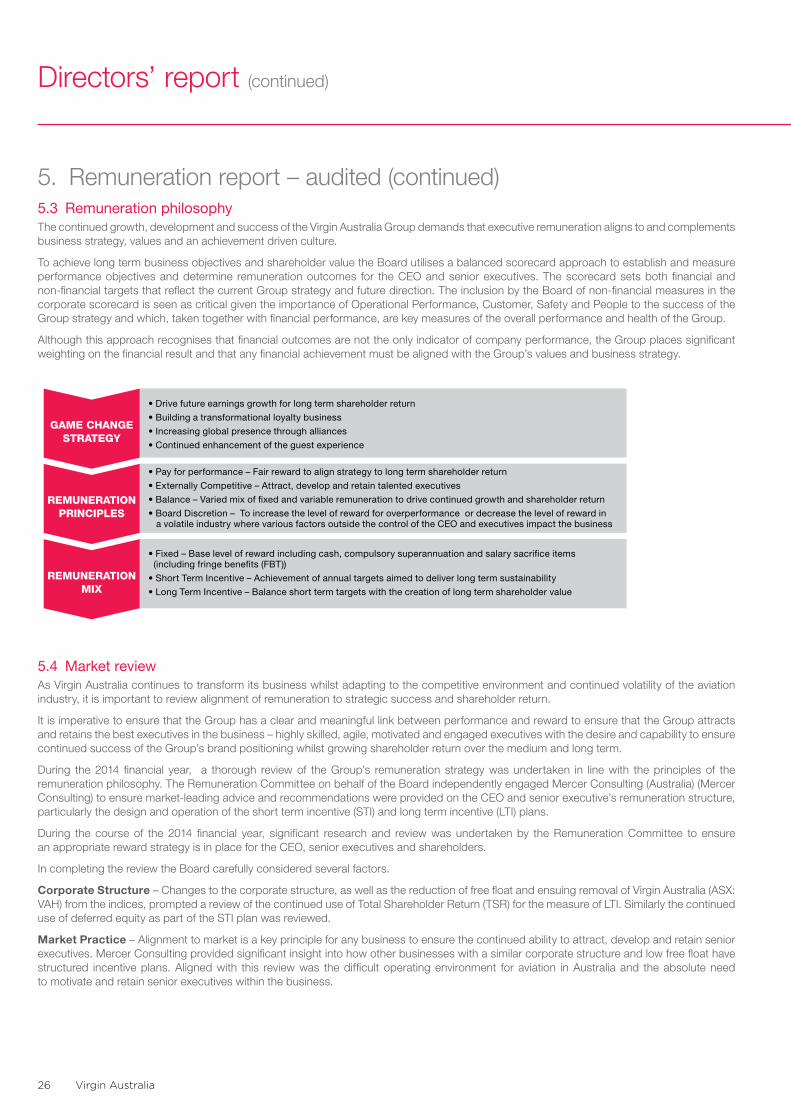
Virgin Australia26
Directors’ report (continued)
5. Remuneration report – audited (continued)5.3 Remuneration philosophy The continued growth, development and success of the Virgin Australia Group demands that executive remuneration aligns to and complements business strategy, values and an achievement driven culture.
To achieve long term business objectives and shareholder value the Board utilises a balanced scorecard approach to establish and measure performance objectives and determine remuneration outcomes for the CEO and senior executives. The scorecard sets both financial and non-financial targets that reflect the current Group strategy and future direction. The inclusion by the Board of non-financial measures in the corporate scorecard is seen as critical given the importance of Operational Performance, Customer, Safety and People to the success of the Group strategy and which, taken together with financial performance, are key measures of the overall performance and health of the Group.
Although this approach recognises that financial outcomes are not the only indicator of company performance, the Group places significant weighting on the financial result and that any financial achievement must be aligned with the Group’s values and business strategy.
• Drive future earnings growth for long term shareholder return
• Building a transformational loyalty business
• Increasing global presence through alliances
• Continued enhancement of the guest experience
GAME CHANGESTRATEGY
REMUNERATIONPRINCIPLES
REMUNERATIONMIX
• Pay for performance – Fair reward to align strategy to long term shareholder return
• Externally Competitive – Attract, develop and retain talented executives
• Balance – Varied mix of �xed and variable remuneration to drive continued growth and shareholder return
• Board Discretion – To increase the level of reward for overperformance or decrease the level of reward in a volatile industry where various factors outside the control of the CEO and executives impact the business
• Fixed – Base level of reward including cash, compulsory superannuation and salary sacri�ce items (including fringe bene�ts (FBT))
• Short Term Incentive – Achievement of annual targets aimed to deliver long term sustainability
• Long Term Incentive – Balance short term targets with the creation of long term shareholder value
5.4 Market reviewAs Virgin Australia continues to transform its business whilst adapting to the competitive environment and continued volatility of the aviation industry, it is important to review alignment of remuneration to strategic success and shareholder return.
It is imperative to ensure that the Group has a clear and meaningful link between performance and reward to ensure that the Group attracts and retains the best executives in the business – highly skilled, agile, motivated and engaged executives with the desire and capability to ensure continued success of the Group’s brand positioning whilst growing shareholder return over the medium and long term.
During the 2014 financial year, a thorough review of the Group’s remuneration strategy was undertaken in line with the principles of the remuneration philosophy. The Remuneration Committee on behalf of the Board independently engaged Mercer Consulting (Australia) (Mercer Consulting) to ensure market-leading advice and recommendations were provided on the CEO and senior executive’s remuneration structure, particularly the design and operation of the short term incentive (STI) and long term incentive (LTI) plans.
During the course of the 2014 financial year, significant research and review was undertaken by the Remuneration Committee to ensure an appropriate reward strategy is in place for the CEO, senior executives and shareholders.
In completing the review the Board carefully considered several factors.
Corporate Structure – Changes to the corporate structure, as well as the reduction of free float and ensuing removal of Virgin Australia (ASX: VAH) from the indices, prompted a review of the continued use of Total Shareholder Return (TSR) for the measure of LTI. Similarly the continued use of deferred equity as part of the STI plan was reviewed.
Market Practice – Alignment to market is a key principle for any business to ensure the continued ability to attract, develop and retain senior executives. Mercer Consulting provided significant insight into how other businesses with a similar corporate structure and low free float have structured incentive plans. Aligned with this review was the difficult operating environment for aviation in Australia and the absolute need to motivate and retain senior executives within the business.
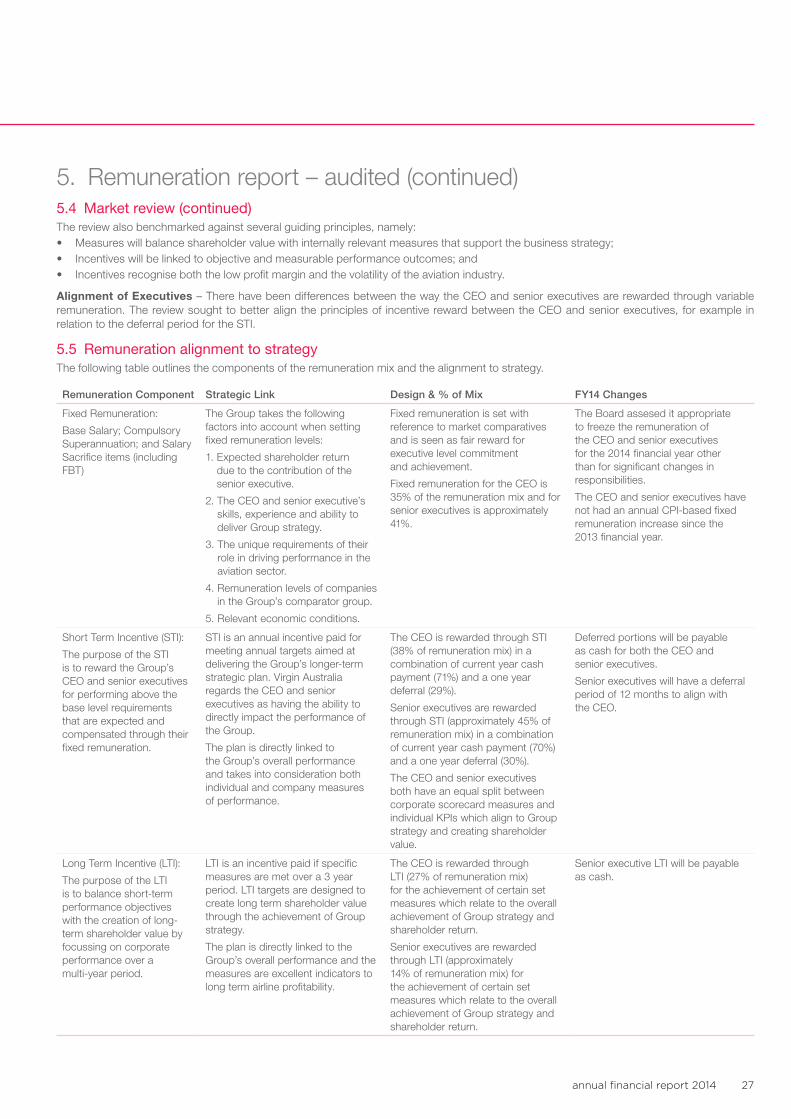
annual financial report 2014 27
5. Remuneration report – audited (continued)5.4 Market review (continued)The review also benchmarked against several guiding principles, namely:• Measures will balance shareholder value with internally relevant measures that support the business strategy;• Incentives will be linked to objective and measurable performance outcomes; and• Incentives recognise both the low profit margin and the volatility of the aviation industry.
Alignment of Executives – There have been differences between the way the CEO and senior executives are rewarded through variable remuneration. The review sought to better align the principles of incentive reward between the CEO and senior executives, for example in relation to the deferral period for the STI.
5.5 Remuneration alignment to strategy The following table outlines the components of the remuneration mix and the alignment to strategy.
Remuneration Component Strategic Link Design & % of Mix FY14 Changes
Fixed Remuneration:
Base Salary; Compulsory Superannuation; and Salary Sacrifice items (including FBT)
The Group takes the following factors into account when setting fixed remuneration levels:
1. Expected shareholder return due to the contribution of the senior executive.
2. The CEO and senior executive’s skills, experience and ability to deliver Group strategy.
3. The unique requirements of their role in driving performance in the aviation sector.
4. Remuneration levels of companies in the Group’s comparator group.
5. Relevant economic conditions.
Fixed remuneration is set with reference to market comparatives and is seen as fair reward for executive level commitment and achievement.
Fixed remuneration for the CEO is 35% of the remuneration mix and for senior executives is approximately 41%.
The Board assesed it appropriate to freeze the remuneration of the CEO and senior executives for the 2014 financial year other than for significant changes in responsibilities.
The CEO and senior executives have not had an annual CPI-based fixed remuneration increase since the 2013 financial year.
Short Term Incentive (STI):
The purpose of the STI is to reward the Group’s CEO and senior executives for performing above the base level requirements that are expected and compensated through their fixed remuneration.
STI is an annual incentive paid for meeting annual targets aimed at delivering the Group’s longer-term strategic plan. Virgin Australia regards the CEO and senior executives as having the ability to directly impact the performance of the Group.
The plan is directly linked to the Group’s overall performance and takes into consideration both individual and company measures of performance.
The CEO is rewarded through STI (38% of remuneration mix) in a combination of current year cash payment (71%) and a one year deferral (29%).
Senior executives are rewarded through STI (approximately 45% of remuneration mix) in a combination of current year cash payment (70%) and a one year deferral (30%).
The CEO and senior executives both have an equal split between corporate scorecard measures and individual KPIs which align to Group strategy and creating shareholder value.
Deferred portions will be payable as cash for both the CEO and senior executives.
Senior executives will have a deferral period of 12 months to align with the CEO.
Long Term Incentive (LTI):
The purpose of the LTI is to balance short-term performance objectives with the creation of long-term shareholder value by focussing on corporate performance over a multi-year period.
LTI is an incentive paid if specific measures are met over a 3 year period. LTI targets are designed to create long term shareholder value through the achievement of Group strategy.
The plan is directly linked to the Group’s overall performance and the measures are excellent indicators to long term airline profitability.
The CEO is rewarded through LTI (27% of remuneration mix) for the achievement of certain set measures which relate to the overall achievement of Group strategy and shareholder return.
Senior executives are rewarded through LTI (approximately 14% of remuneration mix) for the achievement of certain set measures which relate to the overall achievement of Group strategy and shareholder return.
Senior executive LTI will be payable as cash.
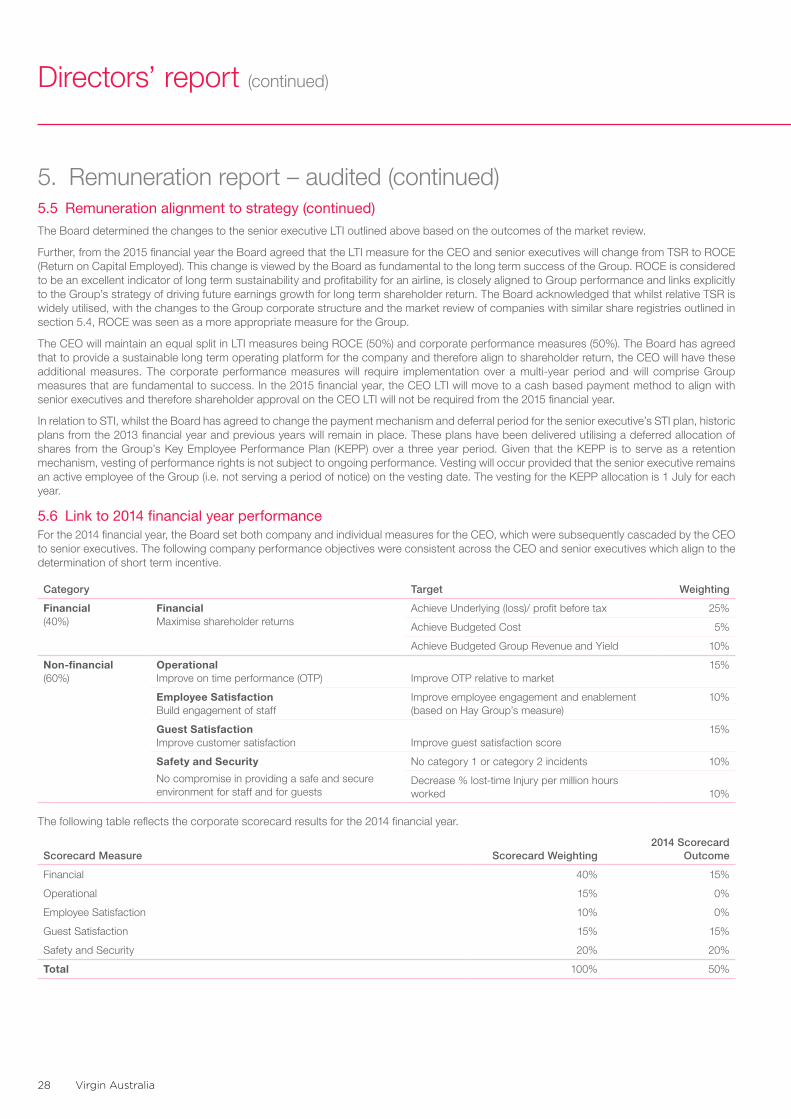
Virgin Australia28
Directors’ report (continued)
5. Remuneration report – audited (continued)5.5 Remuneration alignment to strategy (continued)
The Board determined the changes to the senior executive LTI outlined above based on the outcomes of the market review.
Further, from the 2015 financial year the Board agreed that the LTI measure for the CEO and senior executives will change from TSR to ROCE (Return on Capital Employed). This change is viewed by the Board as fundamental to the long term success of the Group. ROCE is considered to be an excellent indicator of long term sustainability and profitability for an airline, is closely aligned to Group performance and links explicitly to the Group’s strategy of driving future earnings growth for long term shareholder return. The Board acknowledged that whilst relative TSR is widely utilised, with the changes to the Group corporate structure and the market review of companies with similar share registries outlined in section 5.4, ROCE was seen as a more appropriate measure for the Group.
The CEO will maintain an equal split in LTI measures being ROCE (50%) and corporate performance measures (50%). The Board has agreed that to provide a sustainable long term operating platform for the company and therefore align to shareholder return, the CEO will have these additional measures. The corporate performance measures will require implementation over a multi-year period and will comprise Group measures that are fundamental to success. In the 2015 financial year, the CEO LTI will move to a cash based payment method to align with senior executives and therefore shareholder approval on the CEO LTI will not be required from the 2015 financial year.
In relation to STI, whilst the Board has agreed to change the payment mechanism and deferral period for the senior executive’s STI plan, historic plans from the 2013 financial year and previous years will remain in place. These plans have been delivered utilising a deferred allocation of shares from the Group’s Key Employee Performance Plan (KEPP) over a three year period. Given that the KEPP is to serve as a retention mechanism, vesting of performance rights is not subject to ongoing performance. Vesting will occur provided that the senior executive remains an active employee of the Group (i.e. not serving a period of notice) on the vesting date. The vesting for the KEPP allocation is 1 July for each year.
5.6 Link to 2014 financial year performance For the 2014 financial year, the Board set both company and individual measures for the CEO, which were subsequently cascaded by the CEO to senior executives. The following company performance objectives were consistent across the CEO and senior executives which align to the determination of short term incentive.
Category Target Weighting
Financial (40%)
Financial Maximise shareholder returns
Achieve Underlying (loss)/ profit before tax 25%
Achieve Budgeted Cost 5%
Achieve Budgeted Group Revenue and Yield 10%
Non-financial (60%)
Operational Improve on time performance (OTP)
Improve OTP relative to market
15%
Employee Satisfaction Build engagement of staff
Improve employee engagement and enablement (based on Hay Group’s measure)
10%
Guest Satisfaction Improve customer satisfaction
Improve guest satisfaction score
15%
Safety and Security
No compromise in providing a safe and secure environment for staff and for guests
No category 1 or category 2 incidents 10%
Decrease % lost-time Injury per million hours worked 10%
The following table reflects the corporate scorecard results for the 2014 financial year.
Scorecard Measure Scorecard Weighting2014 Scorecard
Outcome
Financial 40% 15%
Operational 15% 0%
Employee Satisfaction 10% 0%
Guest Satisfaction 15% 15%
Safety and Security 20% 20%
Total 100% 50%
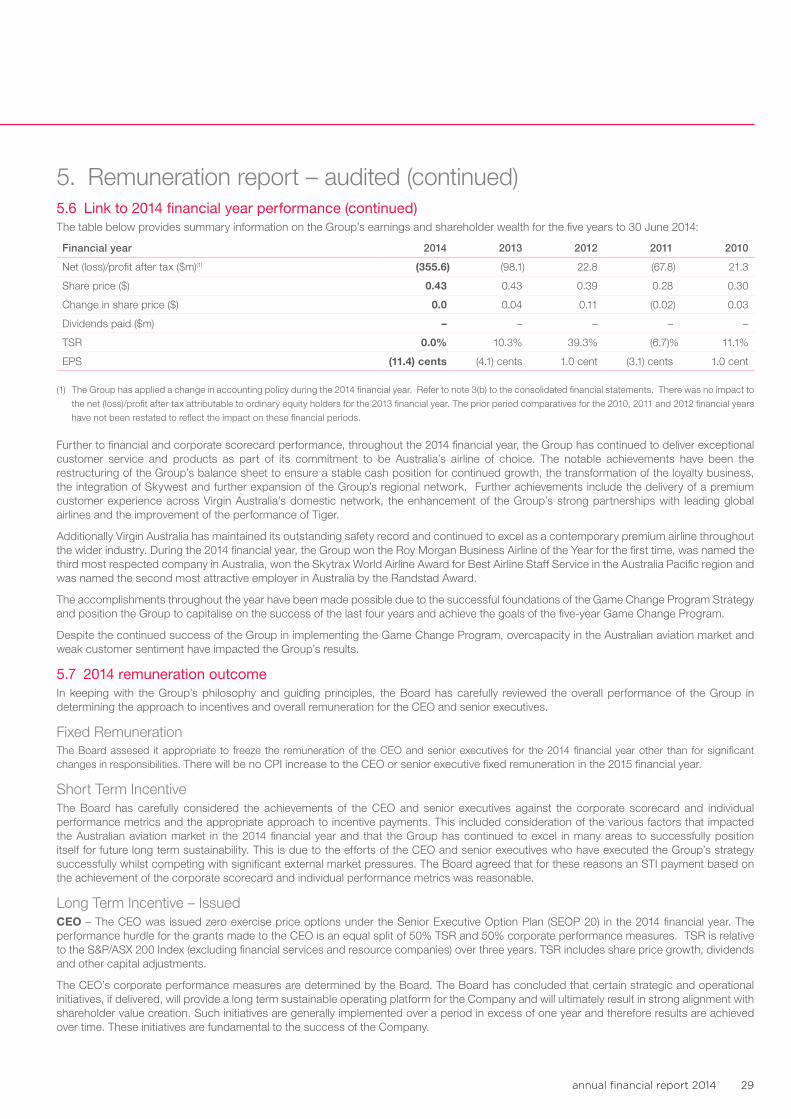
annual financial report 2014 29
5. Remuneration report – audited (continued)5.6 Link to 2014 financial year performance (continued)The table below provides summary information on the Group’s earnings and shareholder wealth for the five years to 30 June 2014:
Financial year 2014 2013 2012 2011 2010
Net (loss)/profit after tax ($m)(1) (355.6) (98.1) 22.8 (67.8) 21.3
Share price ($) 0.43 0.43 0.39 0.28 0.30
Change in share price ($) 0.0 0.04 0.11 (0.02) 0.03
Dividends paid ($m) – – – – –
TSR 0.0% 10.3% 39.3% (6.7)% 11.1%
EPS (11.4) cents (4.1) cents 1.0 cent (3.1) cents 1.0 cent
(1) The Group has applied a change in accounting policy during the 2014 financial year. Refer to note 3(b) to the consolidated financial statements. There was no impact to
the net (loss)/profit after tax attributable to ordinary equity holders for the 2013 financial year. The prior period comparatives for the 2010, 2011 and 2012 financial years
have not been restated to reflect the impact on these financial periods.
Further to financial and corporate scorecard performance, throughout the 2014 financial year, the Group has continued to deliver exceptional customer service and products as part of its commitment to be Australia’s airline of choice. The notable achievements have been the restructuring of the Group’s balance sheet to ensure a stable cash position for continued growth, the transformation of the loyalty business, the integration of Skywest and further expansion of the Group’s regional network. Further achievements include the delivery of a premium customer experience across Virgin Australia’s domestic network, the enhancement of the Group’s strong partnerships with leading global airlines and the improvement of the performance of Tiger.
Additionally Virgin Australia has maintained its outstanding safety record and continued to excel as a contemporary premium airline throughout the wider industry. During the 2014 financial year, the Group won the Roy Morgan Business Airline of the Year for the first time, was named the third most respected company in Australia, won the Skytrax World Airline Award for Best Airline Staff Service in the Australia Pacific region and was named the second most attractive employer in Australia by the Randstad Award.
The accomplishments throughout the year have been made possible due to the successful foundations of the Game Change Program Strategy and position the Group to capitalise on the success of the last four years and achieve the goals of the five-year Game Change Program.
Despite the continued success of the Group in implementing the Game Change Program, overcapacity in the Australian aviation market and weak customer sentiment have impacted the Group’s results.
5.7 2014 remuneration outcomeIn keeping with the Group’s philosophy and guiding principles, the Board has carefully reviewed the overall performance of the Group in determining the approach to incentives and overall remuneration for the CEO and senior executives.
Fixed RemunerationThe Board assesed it appropriate to freeze the remuneration of the CEO and senior executives for the 2014 financial year other than for significant changes in responsibilities. There will be no CPI increase to the CEO or senior executive fixed remuneration in the 2015 financial year.
Short Term IncentiveThe Board has carefully considered the achievements of the CEO and senior executives against the corporate scorecard and individual performance metrics and the appropriate approach to incentive payments. This included consideration of the various factors that impacted the Australian aviation market in the 2014 financial year and that the Group has continued to excel in many areas to successfully position itself for future long term sustainability. This is due to the efforts of the CEO and senior executives who have executed the Group’s strategy successfully whilst competing with significant external market pressures. The Board agreed that for these reasons an STI payment based on the achievement of the corporate scorecard and individual performance metrics was reasonable.
Long Term Incentive – IssuedCEO – The CEO was issued zero exercise price options under the Senior Executive Option Plan (SEOP 20) in the 2014 financial year. The performance hurdle for the grants made to the CEO is an equal split of 50% TSR and 50% corporate performance measures. TSR is relative to the S&P/ASX 200 Index (excluding financial services and resource companies) over three years. TSR includes share price growth, dividends and other capital adjustments.
The CEO’s corporate performance measures are determined by the Board. The Board has concluded that certain strategic and operational initiatives, if delivered, will provide a long term sustainable operating platform for the Company and will ultimately result in strong alignment with shareholder value creation. Such initiatives are generally implemented over a period in excess of one year and therefore results are achieved over time. These initiatives are fundamental to the success of the Company.
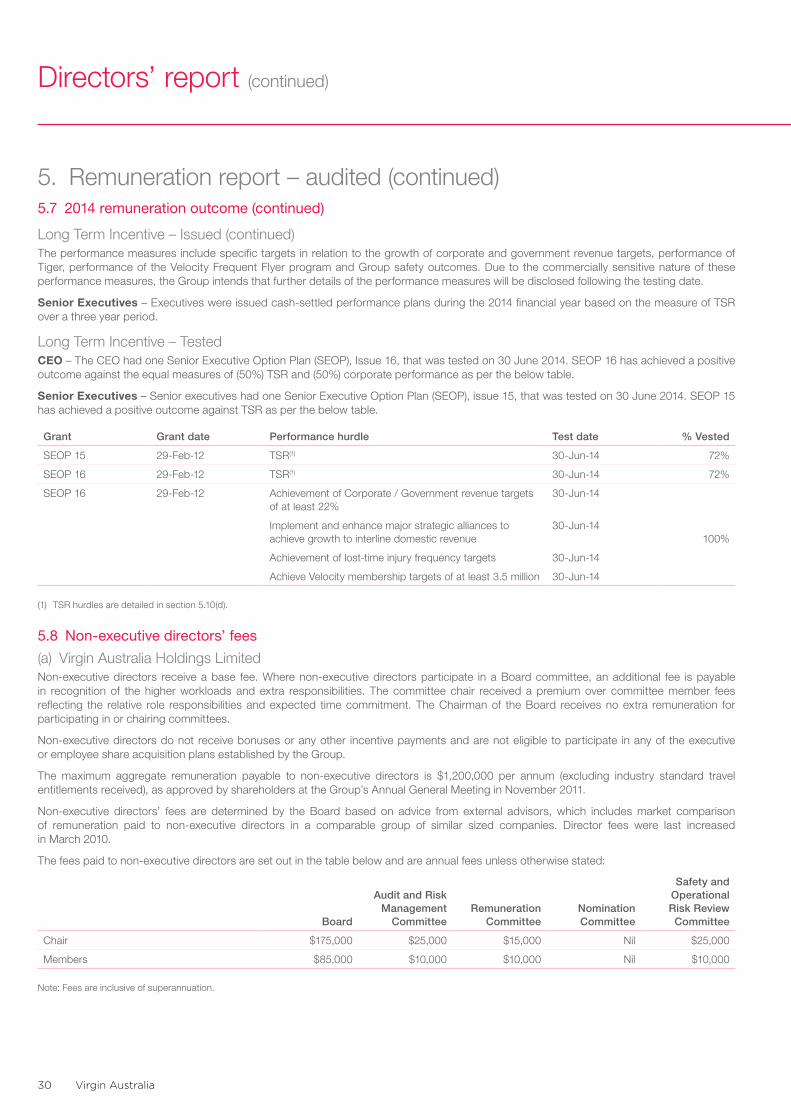
Virgin Australia30
Directors’ report (continued)
5. Remuneration report – audited (continued)5.7 2014 remuneration outcome (continued)
Long Term Incentive – Issued (continued)The performance measures include specific targets in relation to the growth of corporate and government revenue targets, performance of Tiger, performance of the Velocity Frequent Flyer program and Group safety outcomes. Due to the commercially sensitive nature of these performance measures, the Group intends that further details of the performance measures will be disclosed following the testing date.
Senior Executives – Executives were issued cash-settled performance plans during the 2014 financial year based on the measure of TSR over a three year period.
Long Term Incentive – TestedCEO – The CEO had one Senior Executive Option Plan (SEOP), Issue 16, that was tested on 30 June 2014. SEOP 16 has achieved a positive outcome against the equal measures of (50%) TSR and (50%) corporate performance as per the below table.
Senior Executives – Senior executives had one Senior Executive Option Plan (SEOP), issue 15, that was tested on 30 June 2014. SEOP 15 has achieved a positive outcome against TSR as per the below table.
Grant Grant date Performance hurdle Test date % Vested
SEOP 15 29-Feb-12 TSR(1) 30-Jun-14 72%
SEOP 16 29-Feb-12 TSR(1) 30-Jun-14 72%
SEOP 16 29-Feb-12 Achievement of Corporate / Government revenue targets of at least 22%
30-Jun-14
Implement and enhance major strategic alliances to achieve growth to interline domestic revenue
30-Jun-14100%
Achievement of lost-time injury frequency targets 30-Jun-14
Achieve Velocity membership targets of at least 3.5 million 30-Jun-14
(1) TSR hurdles are detailed in section 5.10(d).
5.8 Non-executive directors’ fees
(a) Virgin Australia Holdings LimitedNon-executive directors receive a base fee. Where non-executive directors participate in a Board committee, an additional fee is payable in recognition of the higher workloads and extra responsibilities. The committee chair received a premium over committee member fees reflecting the relative role responsibilities and expected time commitment. The Chairman of the Board receives no extra remuneration for participating in or chairing committees.
Non-executive directors do not receive bonuses or any other incentive payments and are not eligible to participate in any of the executive or employee share acquisition plans established by the Group.
The maximum aggregate remuneration payable to non-executive directors is $1,200,000 per annum (excluding industry standard travel entitlements received), as approved by shareholders at the Group’s Annual General Meeting in November 2011.
Non-executive directors’ fees are determined by the Board based on advice from external advisors, which includes market comparison of remuneration paid to non-executive directors in a comparable group of similar sized companies. Director fees were last increased in March 2010.
The fees paid to non-executive directors are set out in the table below and are annual fees unless otherwise stated:
Board
Audit and Risk Management
CommitteeRemuneration
CommitteeNomination Committee
Safety and Operational Risk Review Committee
Chair $175,000 $25,000 $15,000 Nil $25,000
Members $85,000 $10,000 $10,000 Nil $10,000
Note: Fees are inclusive of superannuation.
annual financial report 2014 31
5. Remuneration report – audited (continued)5.8 Non-executive directors’ fees (continued)
(b) Virgin Australia International Holdings Pty LtdMembers of the Board of Directors of Virgin Australia International Holdings Pty Ltd (VAIH), a controlled entity of the Company, receive an annual fee of $75,000, while the Chairman receives an annual fee of $140,000. In their capacity as directors of this Board, Mr N Chatfield and Mr J Borghetti have elected to receive 50% of the annual director fee, $37,500. Mr J Borghetti has elected to donate his annual director fee to charity.
(c) Travel entitlements All non-executive directors and their eligible beneficiaries receive travel entitlements. These include two return international business class flights and four return domestic business class flights, per financial year, per person, for travel on flights operated by the Virgin Australia Group of Airlines. These flights are not cumulative and will lapse if they are not used during the financial year in which the entitlement exists. The entitlement will remain in place for the remainder of the financial year in which the participant ceases to be a non-executive director of the Group and will then cease. The accounting value of the travel benefit is captured in the remuneration table (as a non-monetary benefit) for travel during the relevant financial year.
5.9 Remuneration consultantIn the 2014 financial year, the Board engaged Mercer Consulting to provide advice and recommendations on the STI and LTI strategy and plan design, including the deferral mechanisms and performance measures, for the CEO and senior executives (including KMP). The total fee for this engagement was $36,300. Consistent with good governance, the following arrangements were made to ensure Mercer Consulting’s advice was free from undue influence:• Mercer Consulting was engaged by, and reported to, the Remuneration Committee Chair;• The agreement for the provision of services was executed by the Remuneration Committee Chair on behalf of the Board;• The reports containing remuneration advice or market data were provided by Mercer Consulting directly to the Remuneration Committee
Chair; and• Mercer Consulting has declared that they have not been influenced by the KMP in carrying out their duties for the Remuneration Committee.
As a consequence, the Board is satisfied that advice and market data provided by Mercer Consulting was provided free of undue influence from KMP.
Separately in the 2014 financial year, Mercer Consulting was engaged to assist the Group in reviewing and building a more effective rewards system for all levels of individually contracted management employees. The total fee for this engagement was $180,070. The Board was fully informed of this engagement and Mercer Consulting and Virgin Australia adopted a protocol to ensure that any remuneration recommendation relating to KMP that might arise in the course of the engagement would:• Only be done so following a separate and direct engagement by the Board; and• That in the course of providing any such recommendation, Mercer Consulting would ensure it was made free from undue influence of KMP.
In the course of this engagement Mercer Consulting did not make a recommendation regarding KMP remuneration, as defined under the Corporations Act 2001. Mercer Consulting was also engaged to provide assistance with 2013 financial year Remuneration Report for a fee of $9,600.
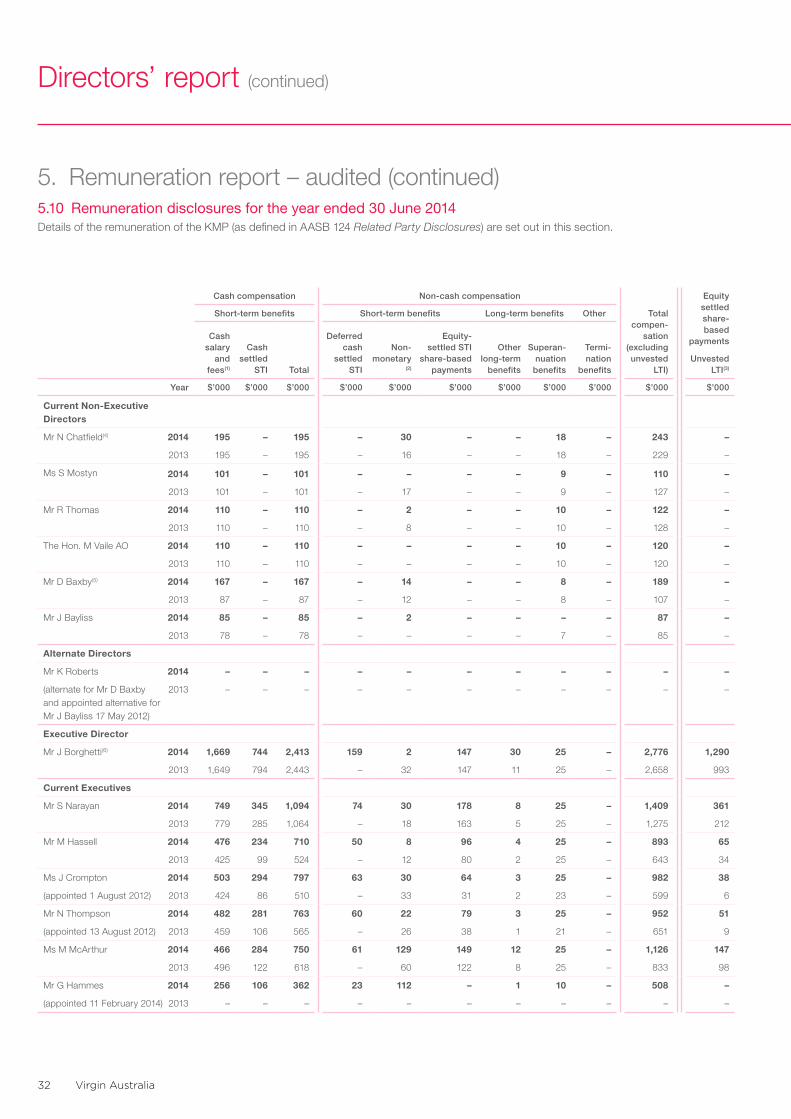
Virgin Australia32
Directors’ report (continued)
5. Remuneration report – audited (continued) 5.10 Remuneration disclosures for the year ended 30 June 2014Details of the remuneration of the KMP (as defined in AASB 124 Related Party Disclosures) are set out in this section.
Cash compensation Non-cash compensation
Total compen-
sation (excluding unvested
LTI)
Equity settled share-based
payments
Short-term benefits Short-term benefits Long-term benefits Other
Cash salary
and fees(1)
Cash settled
STI Total
Deferred cash
settled STI
Non- monetary
(2)
Equity-settled STI
share-based payments
Other long-term
benefits
Superan-nuation
benefits
Termi-nation
benefitsUnvested
LTI(3)
Year $’000 $’000 $’000 $’000 $’000 $’000 $’000 $’000 $’000 $’000 $’000
Current Non-Executive Directors
Mr N Chatfield(4) 2014 195 – 195 – 30 – – 18 – 243 –
2013 195 – 195 – 16 – – 18 – 229 –
Ms S Mostyn 2014 101 – 101 – – – – 9 – 110 –
2013 101 – 101 – 17 – – 9 – 127 –
Mr R Thomas 2014 110 – 110 – 2 – – 10 – 122 –
2013 110 – 110 – 8 – – 10 – 128 –
The Hon. M Vaile AO 2014 110 – 110 – – – – 10 – 120 –
2013 110 – 110 – – – – 10 – 120 –
Mr D Baxby(5) 2014 167 – 167 – 14 – – 8 – 189 –
2013 87 – 87 – 12 – – 8 – 107 –
Mr J Bayliss 2014 85 – 85 – 2 – – – – 87 –
2013 78 – 78 – – – – 7 – 85 –
Alternate Directors
Mr K Roberts 2014 – – – – – – – – – – –
(alternate for Mr D Baxby and appointed alternative for Mr J Bayliss 17 May 2012)
2013 – – – – – – – – – – –
Executive Director
Mr J Borghetti(6) 2014 1,669 744 2,413 159 2 147 30 25 – 2,776 1,290
2013 1,649 794 2,443 – 32 147 11 25 – 2,658 993
Current Executives
Mr S Narayan 2014 749 345 1,094 74 30 178 8 25 – 1,409 361
2013 779 285 1,064 – 18 163 5 25 – 1,275 212
Mr M Hassell 2014 476 234 710 50 8 96 4 25 – 893 65
2013 425 99 524 – 12 80 2 25 – 643 34
Ms J Crompton 2014 503 294 797 63 30 64 3 25 – 982 38
(appointed 1 August 2012) 2013 424 86 510 – 33 31 2 23 – 599 6
Mr N Thompson 2014 482 281 763 60 22 79 3 25 – 952 51
(appointed 13 August 2012) 2013 459 106 565 – 26 38 1 21 – 651 9
Ms M McArthur 2014 466 284 750 61 129 149 12 25 – 1,126 147
2013 496 122 618 – 60 122 8 25 – 833 98
Mr G Hammes 2014 256 106 362 23 112 – 1 10 – 508 –
(appointed 11 February 2014) 2013 – – – – – – – – – – –
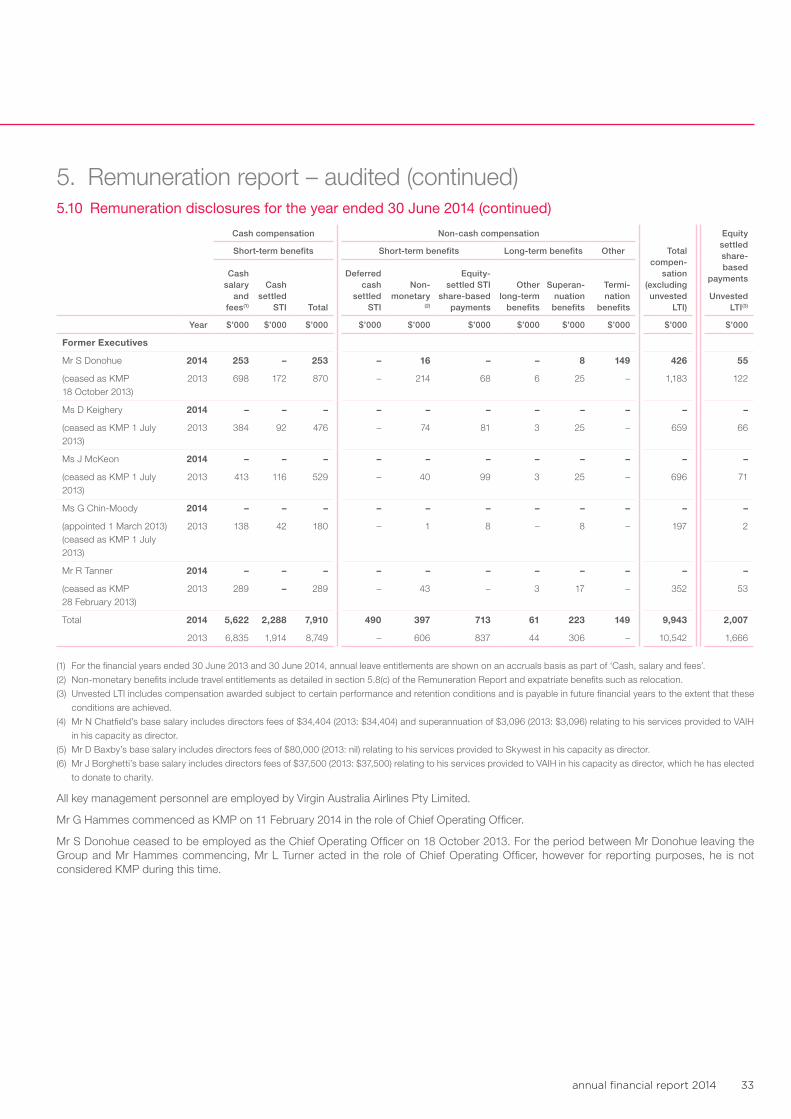
annual financial report 2014 33
Cash compensation Non-cash compensation
Total compen-
sation (excluding unvested
LTI)
Equity settled share-based
payments
Short-term benefits Short-term benefits Long-term benefits Other
Cash salary
and fees(1)
Cash settled
STI Total
Deferred cash
settled STI
Non- monetary
(2)
Equity-settled STI
share-based payments
Other long-term
benefits
Superan-nuation
benefits
Termi-nation
benefitsUnvested
LTI(3)
Year $’000 $’000 $’000 $’000 $’000 $’000 $’000 $’000 $’000 $’000 $’000
Former Executives
Mr S Donohue 2014 253 – 253 – 16 – – 8 149 426 55
(ceased as KMP 18 October 2013)
2013 698 172 870 – 214 68 6 25 – 1,183 122
Ms D Keighery 2014 – – – – – – – – – – –
(ceased as KMP 1 July 2013)
2013 384 92 476 – 74 81 3 25 – 659 66
Ms J McKeon 2014 – – – – – – – – – – –
(ceased as KMP 1 July 2013)
2013 413 116 529 – 40 99 3 25 – 696 71
Ms G Chin-Moody 2014 – – – – – – – – – – –
(appointed 1 March 2013) (ceased as KMP 1 July 2013)
2013 138 42 180 – 1 8 – 8 – 197 2
Mr R Tanner 2014 – – – – – – – – – – –
(ceased as KMP 28 February 2013)
2013 289 – 289 – 43 – 3 17 – 352 53
Total 2014 5,622 2,288 7,910 490 397 713 61 223 149 9,943 2,007
2013 6,835 1,914 8,749 – 606 837 44 306 – 10,542 1,666
(1) For the financial years ended 30 June 2013 and 30 June 2014, annual leave entitlements are shown on an accruals basis as part of ‘Cash, salary and fees’.
(2) Non-monetary benefits include travel entitlements as detailed in section 5.8(c) of the Remuneration Report and expatriate benefits such as relocation.
(3) Unvested LTI includes compensation awarded subject to certain performance and retention conditions and is payable in future financial years to the extent that these
conditions are achieved.
(4) Mr N Chatfield’s base salary includes directors fees of $34,404 (2013: $34,404) and superannuation of $3,096 (2013: $3,096) relating to his services provided to VAIH
in his capacity as director.
(5) Mr D Baxby’s base salary includes directors fees of $80,000 (2013: nil) relating to his services provided to Skywest in his capacity as director.
(6) Mr J Borghetti’s base salary includes directors fees of $37,500 (2013: $37,500) relating to his services provided to VAIH in his capacity as director, which he has elected
to donate to charity.
All key management personnel are employed by Virgin Australia Airlines Pty Limited.
Mr G Hammes commenced as KMP on 11 February 2014 in the role of Chief Operating Officer.
Mr S Donohue ceased to be employed as the Chief Operating Officer on 18 October 2013. For the period between Mr Donohue leaving the Group and Mr Hammes commencing, Mr L Turner acted in the role of Chief Operating Officer, however for reporting purposes, he is not considered KMP during this time.
5. Remuneration report – audited (continued)5.10 Remuneration disclosures for the year ended 30 June 2014 (continued)
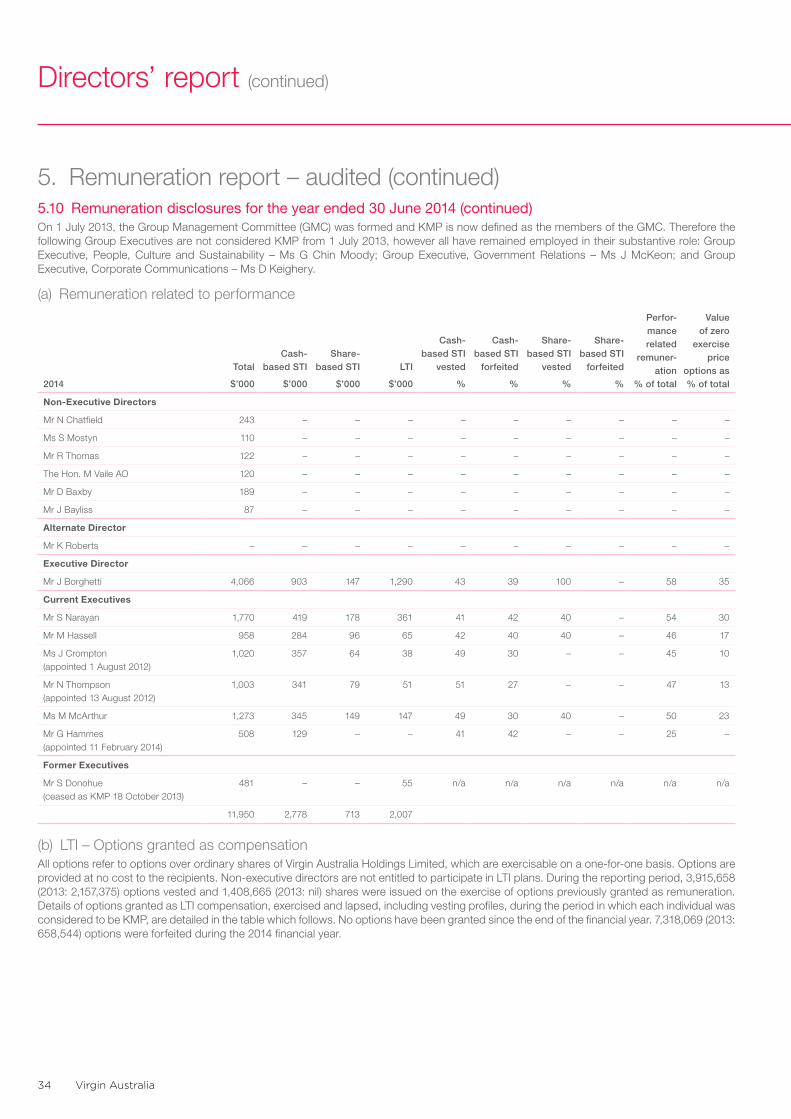
Virgin Australia34
Directors’ report (continued)
5. Remuneration report – audited (continued)5.10 Remuneration disclosures for the year ended 30 June 2014 (continued) On 1 July 2013, the Group Management Committee (GMC) was formed and KMP is now defined as the members of the GMC. Therefore the following Group Executives are not considered KMP from 1 July 2013, however all have remained employed in their substantive role: Group Executive, People, Culture and Sustainability – Ms G Chin Moody; Group Executive, Government Relations – Ms J McKeon; and Group Executive, Corporate Communications – Ms D Keighery.
(a) Remuneration related to performance
2014
Total
$’000
Cash-based STI
$’000
Share-based STI
$’000
LTI
$’000
Cash-based STI
vested
%
Cash-based STI
forfeited
%
Share-based STI
vested
%
Share-based STI
for feit ed
%
Perfor-mance related
remuner-ation
% of total
Value of zero
exercise price
options as % of total
Non-Executive Directors
Mr N Chatfield 243 – – – – – – – – –
Ms S Mostyn 110 – – – – – – – – –
Mr R Thomas 122 – – – – – – – – –
The Hon. M Vaile AO 120 – – – – – – – – –
Mr D Baxby 189 – – – – – – – – –
Mr J Bayliss 87 – – – – – – – – –
Alternate Director
Mr K Roberts – – – – – – – – – –
Executive Director
Mr J Borghetti 4,066 903 147 1,290 43 39 100 – 58 35
Current Executives
Mr S Narayan 1,770 419 178 361 41 42 40 – 54 30
Mr M Hassell 958 284 96 65 42 40 40 – 46 17
Ms J Crompton (appointed 1 August 2012)
1,020 357 64 38 49 30 – – 45 10
Mr N Thompson (appointed 13 August 2012)
1,003 341 79 51 51 27 – – 47 13
Ms M McArthur 1,273 345 149 147 49 30 40 – 50 23
Mr G Hammes (appointed 11 February 2014)
508 129 – – 41 42 – – 25 –
Former Executives
Mr S Donohue (ceased as KMP 18 October 2013)
481 – – 55 n/a n/a n/a n/a n/a n/a
11,950 2,778 713 2,007
(b) LTI – Options granted as compensationAll options refer to options over ordinary shares of Virgin Australia Holdings Limited, which are exercisable on a one-for-one basis. Options are provided at no cost to the recipients. Non-executive directors are not entitled to participate in LTI plans. During the reporting period, 3,915,658 (2013: 2,157,375) options vested and 1,408,665 (2013: nil) shares were issued on the exercise of options previously granted as remuneration. Details of options granted as LTI compensation, exercised and lapsed, including vesting profiles, during the period in which each individual was considered to be KMP, are detailed in the table which follows. No options have been granted since the end of the financial year. 7,318,069 (2013: 658,544) options were forfeited during the 2014 financial year.
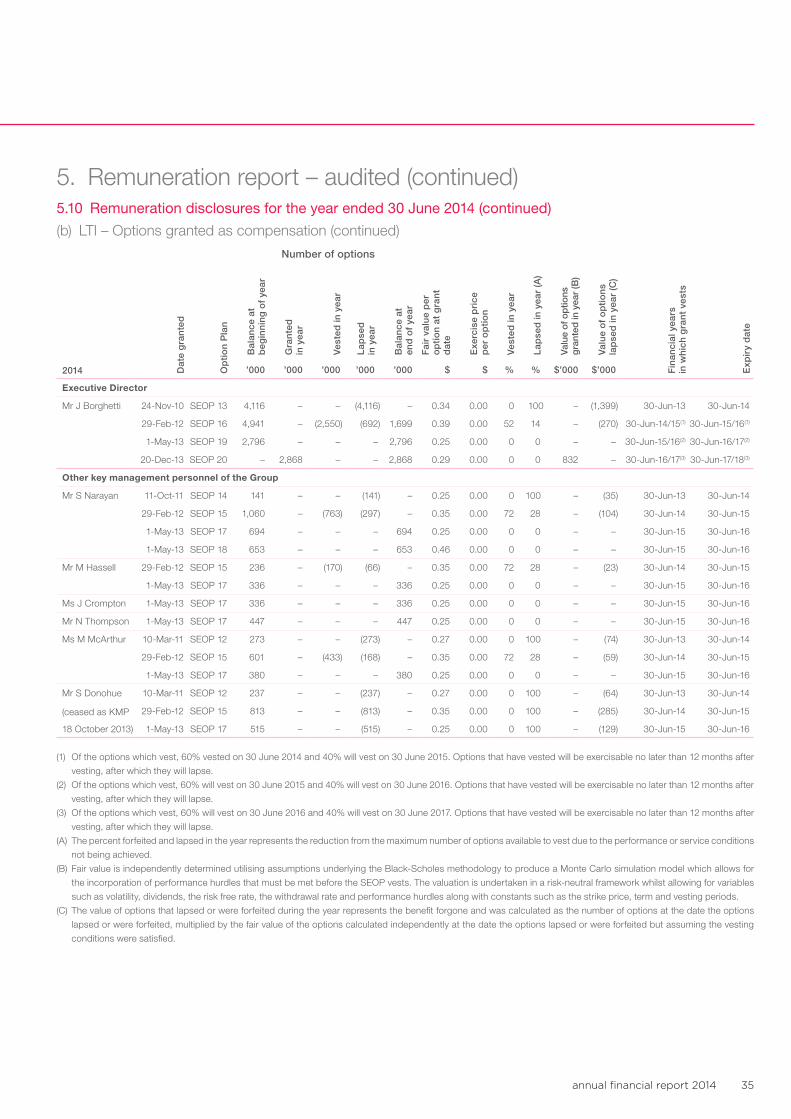
annual financial report 2014 35
5. Remuneration report – audited (continued)5.10 Remuneration disclosures for the year ended 30 June 2014 (continued)
(b) LTI – Options granted as compensation (continued)
Number of options
2014 Dat
e g
ran
ted
Op
tio
n P
lan
Bal
ance
at
beg
inn
ing
of
year
Gra
nte
d
in y
ear
Ves
ted
in y
ear
Lap
sed
in
yea
r
Bal
ance
at
end
of
year
Fai
r va
lue
per
o
pti
on
at g
ran
t d
ate
Exe
rcis
e p
rice
p
er o
pti
on
Ves
ted
in y
ear
Lap
sed
in y
ear
(A)
Valu
e of
op
tions
g
rant
ed in
yea
r (B
)
Val
ue
of
op
tio
ns
lap
sed
in y
ear
(C)
Fin
anci
al y
ears
in
wh
ich
gra
nt
vest
s
Exp
iry
dat
e
’000 ’000 ’000 ’000 ’000 $ $ % % $’000 $’000
Executive Director
Mr J Borghetti 24-Nov-10 SEOP 13 4,116 – – (4,116) – 0.34 0.00 0 100 – (1,399) 30-Jun-13 30-Jun-14
29-Feb-12 SEOP 16 4,941 – (2,550) (692) 1,699 0.39 0.00 52 14 – (270) 30-Jun-14/15(1) 30-Jun-15/16(1)
1-May-13 SEOP 19 2,796 – – – 2,796 0.25 0.00 0 0 – – 30-Jun-15/16(2) 30-Jun-16/17(2)
20-Dec-13 SEOP 20 – 2,868 – – 2,868 0.29 0.00 0 0 832 – 30-Jun-16/17(3) 30-Jun-17/18(3)
Other key management personnel of the Group
Mr S Narayan 11-Oct-11 SEOP 14 141 – – (141) – 0.25 0.00 0 100 – (35) 30-Jun-13 30-Jun-14
29-Feb-12 SEOP 15 1,060 – (763) (297) – 0.35 0.00 72 28 – (104) 30-Jun-14 30-Jun-15
1-May-13 SEOP 17 694 – – – 694 0.25 0.00 0 0 – – 30-Jun-15 30-Jun-16
1-May-13 SEOP 18 653 – – – 653 0.46 0.00 0 0 – – 30-Jun-15 30-Jun-16
Mr M Hassell 29-Feb-12 SEOP 15 236 – (170) (66) – 0.35 0.00 72 28 – (23) 30-Jun-14 30-Jun-15
1-May-13 SEOP 17 336 – – – 336 0.25 0.00 0 0 – – 30-Jun-15 30-Jun-16
Ms J Crompton 1-May-13 SEOP 17 336 – – – 336 0.25 0.00 0 0 – – 30-Jun-15 30-Jun-16
Mr N Thompson 1-May-13 SEOP 17 447 – – – 447 0.25 0.00 0 0 – – 30-Jun-15 30-Jun-16
Ms M McArthur 10-Mar-11 SEOP 12 273 – – (273) – 0.27 0.00 0 100 – (74) 30-Jun-13 30-Jun-14
29-Feb-12 SEOP 15 601 – (433) (168) – 0.35 0.00 72 28 – (59) 30-Jun-14 30-Jun-15
1-May-13 SEOP 17 380 – – – 380 0.25 0.00 0 0 – – 30-Jun-15 30-Jun-16
Mr S Donohue 10-Mar-11 SEOP 12 237 – – (237) – 0.27 0.00 0 100 – (64) 30-Jun-13 30-Jun-14
(ceased as KMP
18 October 2013)
29-Feb-12 SEOP 15 813 – – (813) – 0.35 0.00 0 100 – (285) 30-Jun-14 30-Jun-15
1-May-13 SEOP 17 515 – – (515) – 0.25 0.00 0 100 – (129) 30-Jun-15 30-Jun-16
(1) Of the options which vest, 60% vested on 30 June 2014 and 40% will vest on 30 June 2015. Options that have vested will be exercisable no later than 12 months after
vesting, after which they will lapse.
(2) Of the options which vest, 60% will vest on 30 June 2015 and 40% will vest on 30 June 2016. Options that have vested will be exercisable no later than 12 months after
vesting, after which they will lapse.
(3) Of the options which vest, 60% will vest on 30 June 2016 and 40% will vest on 30 June 2017. Options that have vested will be exercisable no later than 12 months after
vesting, after which they will lapse.
(A) The percent forfeited and lapsed in the year represents the reduction from the maximum number of options available to vest due to the performance or service conditions
not being achieved.
(B) Fair value is independently determined utilising assumptions underlying the Black-Scholes methodology to produce a Monte Carlo simulation model which allows for
the incorporation of performance hurdles that must be met before the SEOP vests. The valuation is undertaken in a risk-neutral framework whilst allowing for variables
such as volatility, dividends, the risk free rate, the withdrawal rate and performance hurdles along with constants such as the strike price, term and vesting periods.
(C) The value of options that lapsed or were forfeited during the year represents the benefit forgone and was calculated as the number of options at the date the options
lapsed or were forfeited, multiplied by the fair value of the options calculated independently at the date the options lapsed or were forfeited but assuming the vesting
conditions were satisfied.
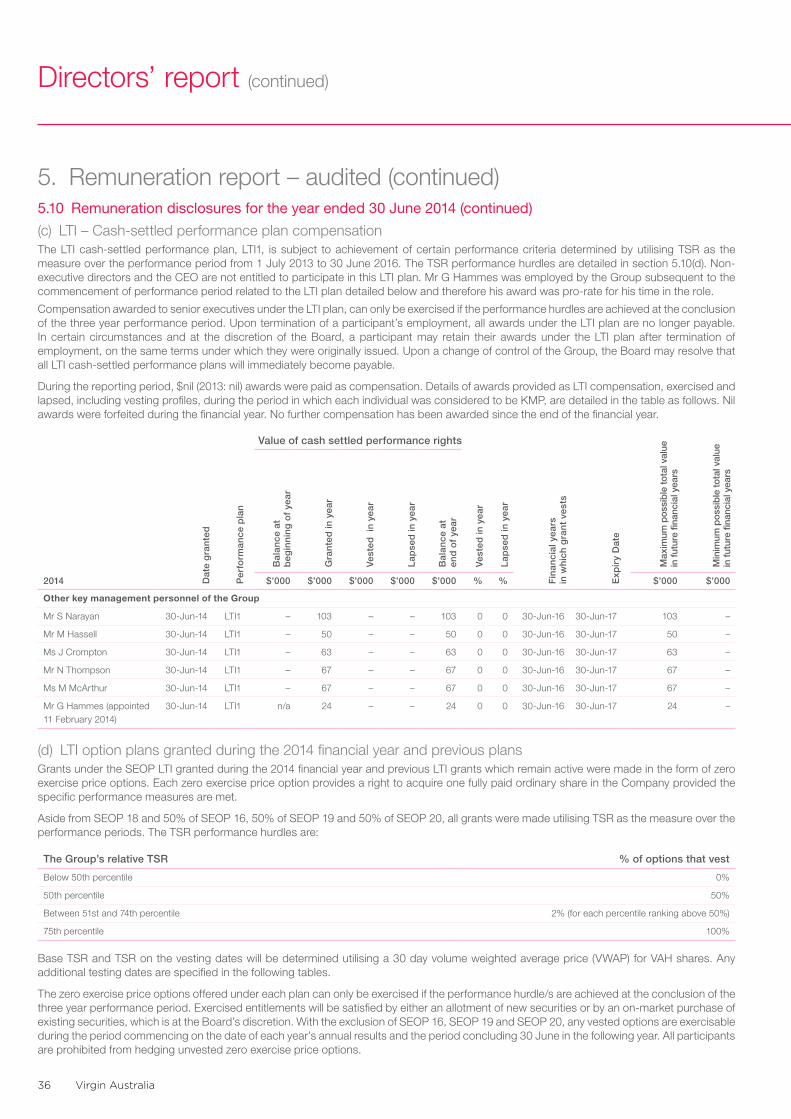
Virgin Australia36
Directors’ report (continued)
5. Remuneration report – audited (continued)5.10 Remuneration disclosures for the year ended 30 June 2014 (continued)
(c) LTI – Cash-settled performance plan compensation The LTI cash-settled performance plan, LTI1, is subject to achievement of certain performance criteria determined by utilising TSR as the measure over the performance period from 1 July 2013 to 30 June 2016. The TSR performance hurdles are detailed in section 5.10(d). Non-executive directors and the CEO are not entitled to participate in this LTI plan. Mr G Hammes was employed by the Group subsequent to the commencement of performance period related to the LTI plan detailed below and therefore his award was pro-rate for his time in the role.
Compensation awarded to senior executives under the LTI plan, can only be exercised if the performance hurdles are achieved at the conclusion of the three year performance period. Upon termination of a participant’s employment, all awards under the LTI plan are no longer payable. In certain circumstances and at the discretion of the Board, a participant may retain their awards under the LTI plan after termination of employment, on the same terms under which they were originally issued. Upon a change of control of the Group, the Board may resolve that all LTI cash-settled performance plans will immediately become payable.
During the reporting period, $nil (2013: nil) awards were paid as compensation. Details of awards provided as LTI compensation, exercised and lapsed, including vesting profiles, during the period in which each individual was considered to be KMP, are detailed in the table as follows. Nil awards were forfeited during the financial year. No further compensation has been awarded since the end of the financial year.
Value of cash settled performance rights
Max
imum
pos
sib
le t
otal
val
ue
in f
utur
e fin
anci
al y
ears
Min
imum
pos
sib
le t
otal
val
ue
in f
utur
e fin
anci
al y
ears
2014 Dat
e g
ran
ted
Per
form
ance
pla
n
Bal
ance
at
beg
inn
ing
of
year
Gra
nte
d in
yea
r
Ves
ted
in
yea
r
Lap
sed
in y
ear
Bal
ance
at
end
of
year
Ves
ted
in y
ear
Lap
sed
in y
ear
Fin
anci
al y
ears
in
wh
ich
gra
nt
vest
s
Exp
iry
Dat
e
$’000 $’000 $’000 $’000 $’000 % % $’000 $’000
Other key management personnel of the Group
Mr S Narayan 30-Jun-14 LTI1 – 103 – – 103 0 0 30-Jun-16 30-Jun-17 103 –
Mr M Hassell 30-Jun-14 LTI1 – 50 – – 50 0 0 30-Jun-16 30-Jun-17 50 –
Ms J Crompton 30-Jun-14 LTI1 – 63 – – 63 0 0 30-Jun-16 30-Jun-17 63 –
Mr N Thompson 30-Jun-14 LTI1 – 67 – – 67 0 0 30-Jun-16 30-Jun-17 67 –
Ms M McArthur 30-Jun-14 LTI1 – 67 – – 67 0 0 30-Jun-16 30-Jun-17 67 –
Mr G Hammes (appointed 11 February 2014)
30-Jun-14 LTI1 n/a 24 – – 24 0 0 30-Jun-16 30-Jun-17 24 –
(d) LTI option plans granted during the 2014 financial year and previous plansGrants under the SEOP LTI granted during the 2014 financial year and previous LTI grants which remain active were made in the form of zero exercise price options. Each zero exercise price option provides a right to acquire one fully paid ordinary share in the Company provided the specific performance measures are met.
Aside from SEOP 18 and 50% of SEOP 16, 50% of SEOP 19 and 50% of SEOP 20, all grants were made utilising TSR as the measure over the performance periods. The TSR performance hurdles are:
The Group’s relative TSR % of options that vest
Below 50th percentile 0%
50th percentile 50%
Between 51st and 74th percentile 2% (for each percentile ranking above 50%)
75th percentile 100%
Base TSR and TSR on the vesting dates will be determined utilising a 30 day volume weighted average price (VWAP) for VAH shares. Any additional testing dates are specified in the following tables.
The zero exercise price options offered under each plan can only be exercised if the performance hurdle/s are achieved at the conclusion of the three year performance period. Exercised entitlements will be satisfied by either an allotment of new securities or by an on-market purchase of existing securities, which is at the Board’s discretion. With the exclusion of SEOP 16, SEOP 19 and SEOP 20, any vested options are exercisable during the period commencing on the date of each year’s annual results and the period concluding 30 June in the following year. All participants are prohibited from hedging unvested zero exercise price options.
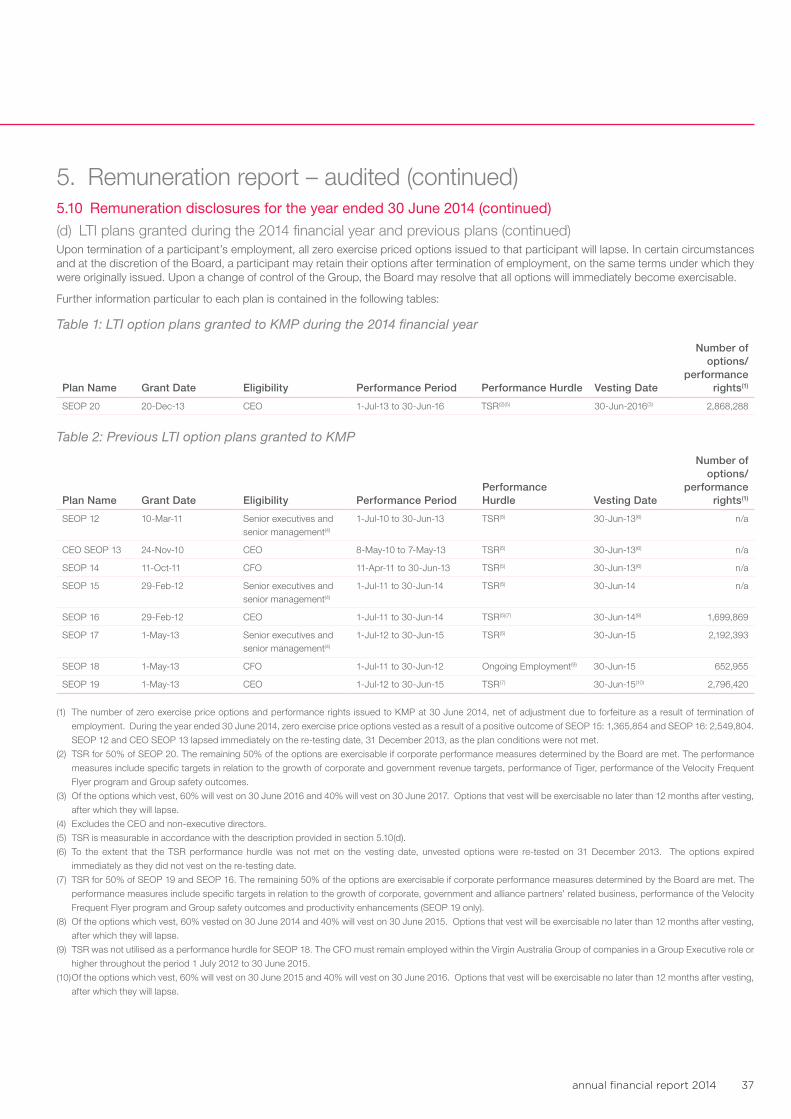
annual financial report 2014 37
5. Remuneration report – audited (continued)5.10 Remuneration disclosures for the year ended 30 June 2014 (continued)
(d) LTI plans granted during the 2014 financial year and previous plans (continued)Upon termination of a participant’s employment, all zero exercise priced options issued to that participant will lapse. In certain circumstances and at the discretion of the Board, a participant may retain their options after termination of employment, on the same terms under which they were originally issued. Upon a change of control of the Group, the Board may resolve that all options will immediately become exercisable.
Further information particular to each plan is contained in the following tables:
Table 1: LTI option plans granted to KMP during the 2014 financial year
Plan Name Grant Date Eligibility Performance Period Performance Hurdle Vesting Date
Number of options/
performance rights(1)
SEOP 20 20-Dec-13 CEO 1-Jul-13 to 30-Jun-16 TSR(2)(5) 30-Jun-2016(3) 2,868,288
Table 2: Previous LTI option plans granted to KMP
Plan Name Grant Date Eligibility Performance Period Performance Hurdle Vesting Date
Number of options/
performance rights(1)
SEOP 12 10-Mar-11 Senior executives and senior management(4)
1-Jul-10 to 30-Jun-13 TSR(5) 30-Jun-13(6) n/a
CEO SEOP 13 24-Nov-10 CEO 8-May-10 to 7-May-13 TSR(5) 30-Jun-13(6) n/a
SEOP 14 11-Oct-11 CFO 11-Apr-11 to 30-Jun-13 TSR(5) 30-Jun-13(6) n/a
SEOP 15 29-Feb-12 Senior executives and senior management(4)
1-Jul-11 to 30-Jun-14 TSR(5) 30-Jun-14 n/a
SEOP 16 29-Feb-12 CEO 1-Jul-11 to 30-Jun-14 TSR(5)(7) 30-Jun-14(8) 1,699,869
SEOP 17 1-May-13 Senior executives and senior management(4)
1-Jul-12 to 30-Jun-15 TSR(5) 30-Jun-15 2,192,393
SEOP 18 1-May-13 CFO 1-Jul-11 to 30-Jun-12 Ongoing Employment(9) 30-Jun-15 652,955
SEOP 19 1-May-13 CEO 1-Jul-12 to 30-Jun-15 TSR(7) 30-Jun-15(10) 2,796,420
(1) The number of zero exercise price options and performance rights issued to KMP at 30 June 2014, net of adjustment due to forfeiture as a result of termination of
employment. During the year ended 30 June 2014, zero exercise price options vested as a result of a positive outcome of SEOP 15: 1,365,854 and SEOP 16: 2,549,804.
SEOP 12 and CEO SEOP 13 lapsed immediately on the re-testing date, 31 December 2013, as the plan conditions were not met.
(2) TSR for 50% of SEOP 20. The remaining 50% of the options are exercisable if corporate performance measures determined by the Board are met. The performance
measures include specific targets in relation to the growth of corporate and government revenue targets, performance of Tiger, performance of the Velocity Frequent
Flyer program and Group safety outcomes.
(3) Of the options which vest, 60% will vest on 30 June 2016 and 40% will vest on 30 June 2017. Options that vest will be exercisable no later than 12 months after vesting,
after which they will lapse.
(4) Excludes the CEO and non-executive directors.
(5) TSR is measurable in accordance with the description provided in section 5.10(d).
(6) To the extent that the TSR performance hurdle was not met on the vesting date, unvested options were re-tested on 31 December 2013. The options expired
immediately as they did not vest on the re-testing date.
(7) TSR for 50% of SEOP 19 and SEOP 16. The remaining 50% of the options are exercisable if corporate performance measures determined by the Board are met. The
performance measures include specific targets in relation to the growth of corporate, government and alliance partners’ related business, performance of the Velocity
Frequent Flyer program and Group safety outcomes and productivity enhancements (SEOP 19 only).
(8) Of the options which vest, 60% vested on 30 June 2014 and 40% will vest on 30 June 2015. Options that vest will be exercisable no later than 12 months after vesting,
after which they will lapse.
(9) TSR was not utilised as a performance hurdle for SEOP 18. The CFO must remain employed within the Virgin Australia Group of companies in a Group Executive role or
higher throughout the period 1 July 2012 to 30 June 2015.
(10) Of the options which vest, 60% will vest on 30 June 2015 and 40% will vest on 30 June 2016. Options that vest will be exercisable no later than 12 months after vesting,
after which they will lapse.
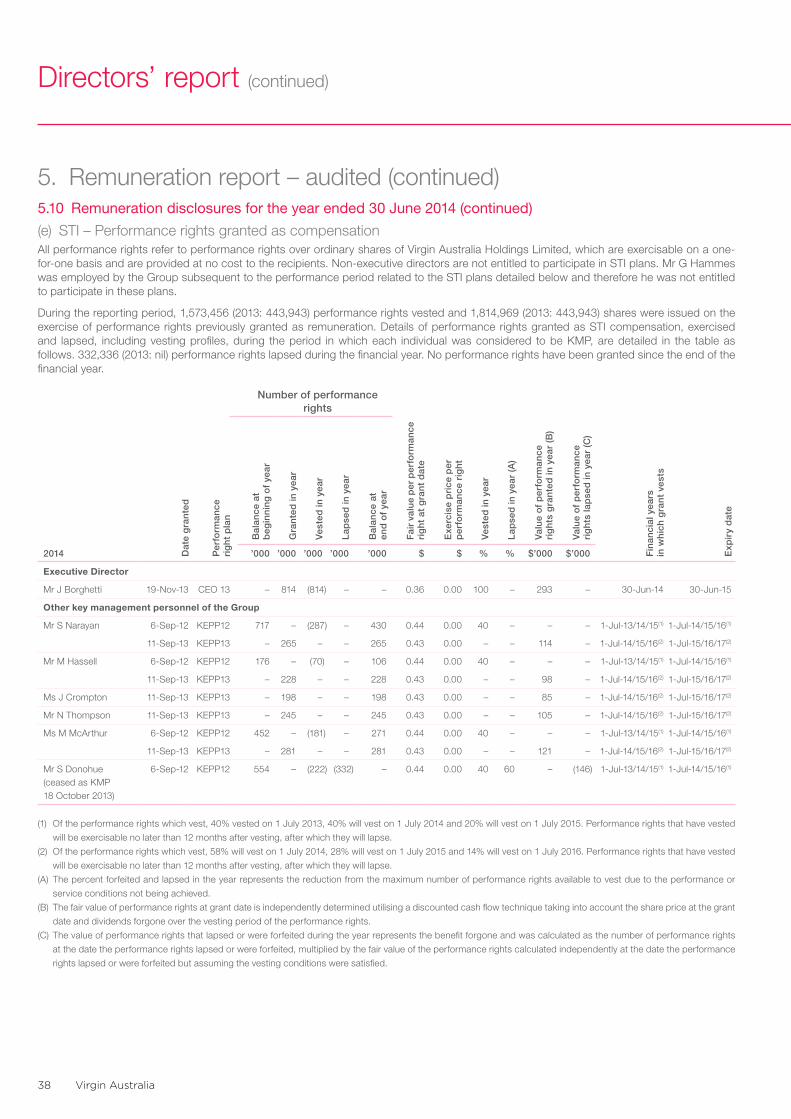
Virgin Australia38
Directors’ report (continued)
5. Remuneration report – audited (continued)5.10 Remuneration disclosures for the year ended 30 June 2014 (continued)
(e) STI – Performance rights granted as compensation All performance rights refer to performance rights over ordinary shares of Virgin Australia Holdings Limited, which are exercisable on a one-for-one basis and are provided at no cost to the recipients. Non-executive directors are not entitled to participate in STI plans. Mr G Hammes was employed by the Group subsequent to the performance period related to the STI plans detailed below and therefore he was not entitled to participate in these plans.
During the reporting period, 1,573,456 (2013: 443,943) performance rights vested and 1,814,969 (2013: 443,943) shares were issued on the exercise of performance rights previously granted as remuneration. Details of performance rights granted as STI compensation, exercised and lapsed, including vesting profiles, during the period in which each individual was considered to be KMP, are detailed in the table as follows. 332,336 (2013: nil) performance rights lapsed during the financial year. No performance rights have been granted since the end of the financial year.
Number of performance rights
2014 Dat
e g
ran
ted
Per
form
ance
ri
gh
t p
lan
Bal
ance
at
beg
inn
ing
of
year
Gra
nte
d in
yea
r
Ves
ted
in y
ear
Lap
sed
in y
ear
Bal
ance
at
end
of
year
Fai
r va
lue
per
per
form
ance
ri
gh
t at
gra
nt
dat
e
Exe
rcis
e p
rice
per
p
erfo
rman
ce r
igh
t
Ves
ted
in y
ear
Lap
sed
in y
ear
(A)
Val
ue
of
per
form
ance
ri
gh
ts g
ran
ted
in y
ear
(B)
Val
ue
of
per
form
ance
ri
gh
ts la
pse
d in
yea
r (C
)
Fin
anci
al y
ears
in
wh
ich
gra
nt
vest
s
Exp
iry
dat
e
’000 ’000 ’000 ’000 ’000 $ $ % % $’000 $’000
Executive Director
Mr J Borghetti 19-Nov-13 CEO 13 – 814 (814) – – 0.36 0.00 100 – 293 – 30-Jun-14 30-Jun-15
Other key management personnel of the Group
Mr S Narayan 6-Sep-12 KEPP12 717 – (287) – 430 0.44 0.00 40 – – – 1-Jul-13/14/15(1) 1-Jul-14/15/16(1)
11-Sep-13 KEPP13 – 265 – – 265 0.43 0.00 – – 114 – 1-Jul-14/15/16(2) 1-Jul-15/16/17(2)
Mr M Hassell 6-Sep-12 KEPP12 176 – (70) – 106 0.44 0.00 40 – – – 1-Jul-13/14/15(1) 1-Jul-14/15/16(1)
11-Sep-13 KEPP13 – 228 – – 228 0.43 0.00 – – 98 – 1-Jul-14/15/16(2) 1-Jul-15/16/17(2)
Ms J Crompton 11-Sep-13 KEPP13 – 198 – – 198 0.43 0.00 – – 85 – 1-Jul-14/15/16(2) 1-Jul-15/16/17(2)
Mr N Thompson 11-Sep-13 KEPP13 – 245 – – 245 0.43 0.00 – – 105 – 1-Jul-14/15/16(2) 1-Jul-15/16/17(2)
Ms M McArthur 6-Sep-12 KEPP12 452 – (181) – 271 0.44 0.00 40 – – – 1-Jul-13/14/15(1) 1-Jul-14/15/16(1)
11-Sep-13 KEPP13 – 281 – – 281 0.43 0.00 – – 121 – 1-Jul-14/15/16(2) 1-Jul-15/16/17(2)
Mr S Donohue (ceased as KMP 18 October 2013)
6-Sep-12 KEPP12 554 – (222) (332) – 0.44 0.00 40 60 – (146) 1-Jul-13/14/15(1) 1-Jul-14/15/16(1)
(1) Of the performance rights which vest, 40% vested on 1 July 2013, 40% will vest on 1 July 2014 and 20% will vest on 1 July 2015. Performance rights that have vested
will be exercisable no later than 12 months after vesting, after which they will lapse.
(2) Of the performance rights which vest, 58% will vest on 1 July 2014, 28% will vest on 1 July 2015 and 14% will vest on 1 July 2016. Performance rights that have vested
will be exercisable no later than 12 months after vesting, after which they will lapse.
(A) The percent forfeited and lapsed in the year represents the reduction from the maximum number of performance rights available to vest due to the performance or
service conditions not being achieved.
(B) The fair value of performance rights at grant date is independently determined utilising a discounted cash flow technique taking into account the share price at the grant
date and dividends forgone over the vesting period of the performance rights.
(C) The value of performance rights that lapsed or were forfeited during the year represents the benefit forgone and was calculated as the number of performance rights
at the date the performance rights lapsed or were forfeited, multiplied by the fair value of the performance rights calculated independently at the date the performance
rights lapsed or were forfeited but assuming the vesting conditions were satisfied.
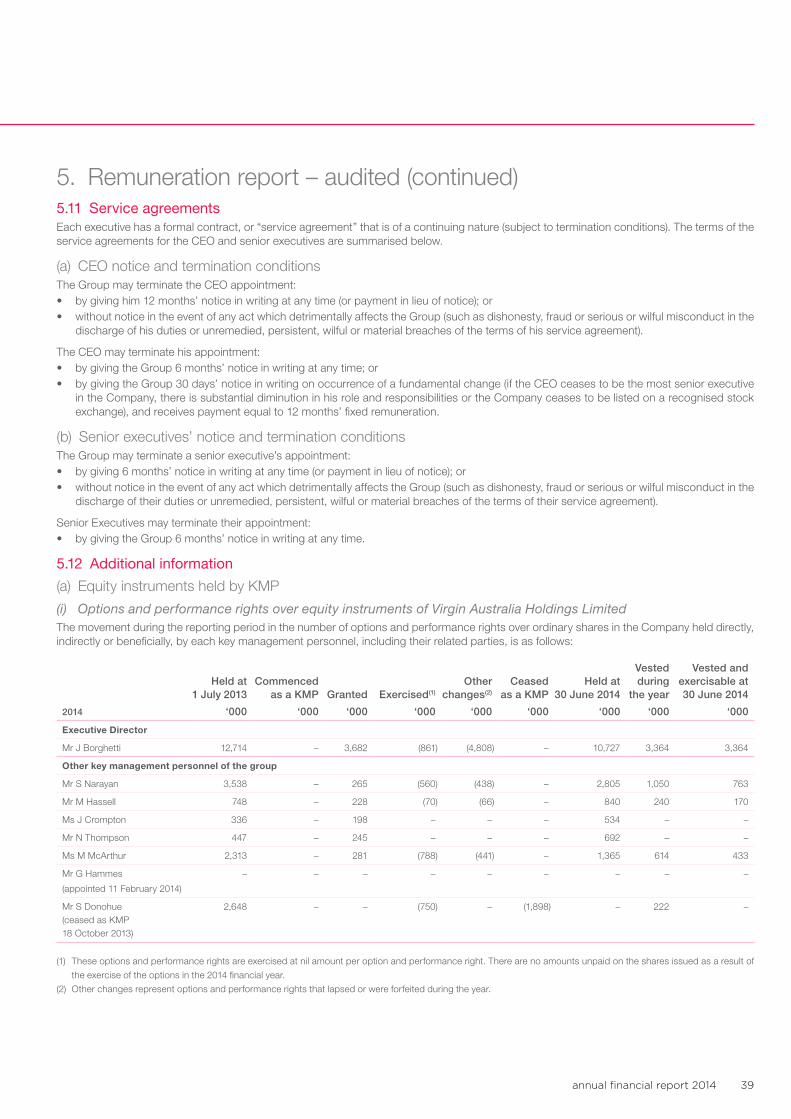
annual financial report 2014 39
5. Remuneration report – audited (continued)5.11 Service agreementsEach executive has a formal contract, or “service agreement” that is of a continuing nature (subject to termination conditions). The terms of the service agreements for the CEO and senior executives are summarised below.
(a) CEO notice and termination conditions The Group may terminate the CEO appointment:• by giving him 12 months’ notice in writing at any time (or payment in lieu of notice); or• without notice in the event of any act which detrimentally affects the Group (such as dishonesty, fraud or serious or wilful misconduct in the
discharge of his duties or unremedied, persistent, wilful or material breaches of the terms of his service agreement).
The CEO may terminate his appointment:• by giving the Group 6 months’ notice in writing at any time; or• by giving the Group 30 days’ notice in writing on occurrence of a fundamental change (if the CEO ceases to be the most senior executive
in the Company, there is substantial diminution in his role and responsibilities or the Company ceases to be listed on a recognised stock exchange), and receives payment equal to 12 months’ fixed remuneration.
(b) Senior executives’ notice and termination conditionsThe Group may terminate a senior executive’s appointment:• by giving 6 months’ notice in writing at any time (or payment in lieu of notice); or• without notice in the event of any act which detrimentally affects the Group (such as dishonesty, fraud or serious or wilful misconduct in the
discharge of their duties or unremedied, persistent, wilful or material breaches of the terms of their service agreement).
Senior Executives may terminate their appointment:• by giving the Group 6 months’ notice in writing at any time.
5.12 Additional information
(a) Equity instruments held by KMP
(i) Options and performance rights over equity instruments of Virgin Australia Holdings LimitedThe movement during the reporting period in the number of options and performance rights over ordinary shares in the Company held directly, indirectly or beneficially, by each key management personnel, including their related parties, is as follows:
2014
Held at 1 July 2013
‘000
Commenced as a KMP
‘000
Granted
‘000
Exercised(1)
‘000
Other changes(2)
‘000
Ceased as a KMP
‘000
Held at 30 June 2014
‘000
Vested during
the year
‘000
Vested and exercisable at 30 June 2014
‘000
Executive Director
Mr J Borghetti 12,714 – 3,682 (861) (4,808) – 10,727 3,364 3,364
Other key management personnel of the group
Mr S Narayan 3,538 – 265 (560) (438) – 2,805 1,050 763
Mr M Hassell 748 – 228 (70) (66) – 840 240 170
Ms J Crompton 336 – 198 – – – 534 – –
Mr N Thompson 447 – 245 – – – 692 – –
Ms M McArthur 2,313 – 281 (788) (441) – 1,365 614 433
Mr G Hammes
(appointed 11 February 2014)
– – – – – – – – –
Mr S Donohue (ceased as KMP 18 October 2013)
2,648 – – (750) – (1,898) – 222 –
(1) These options and performance rights are exercised at nil amount per option and performance right. There are no amounts unpaid on the shares issued as a result of
the exercise of the options in the 2014 financial year.
(2) Other changes represent options and performance rights that lapsed or were forfeited during the year.
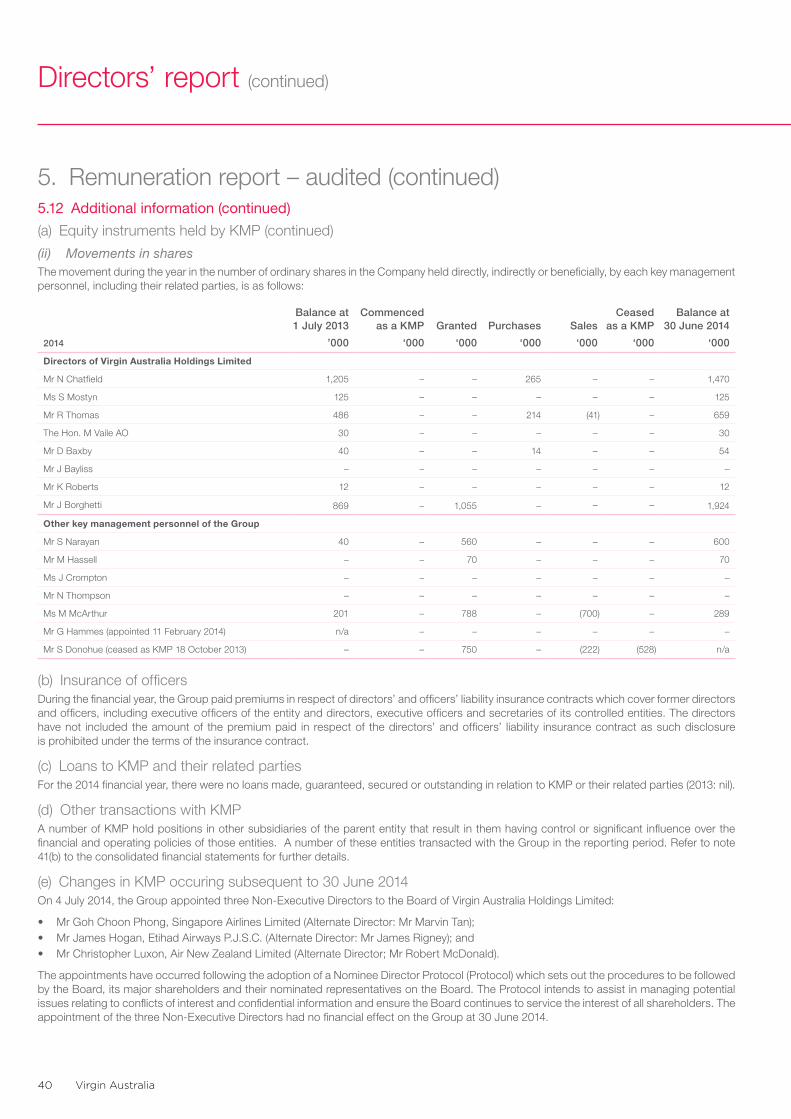
Virgin Australia40
Directors’ report (continued)
5. Remuneration report – audited (continued)5.12 Additional information (continued)
(a) Equity instruments held by KMP (continued)
(ii) Movements in sharesThe movement during the year in the number of ordinary shares in the Company held directly, indirectly or beneficially, by each key management personnel, including their related parties, is as follows:
2014
Balance at 1 July 2013
’000
Commenced as a KMP
‘000
Granted
‘000
Purchases
‘000
Sales
‘000
Ceased as a KMP
‘000
Balance at 30 June 2014
‘000
Directors of Virgin Australia Holdings Limited
Mr N Chatfield 1,205 – – 265 – – 1,470
Ms S Mostyn 125 – – – – – 125
Mr R Thomas 486 – – 214 (41) – 659
The Hon. M Vaile AO 30 – – – – – 30
Mr D Baxby 40 – – 14 – – 54
Mr J Bayliss – – – – – – –
Mr K Roberts 12 – – – – – 12
Mr J Borghetti 869 – 1,055 – – – 1,924
Other key management personnel of the Group
Mr S Narayan 40 – 560 – – – 600
Mr M Hassell – – 70 – – – 70
Ms J Crompton – – – – – – –
Mr N Thompson – – – – – – –
Ms M McArthur 201 – 788 – (700) – 289
Mr G Hammes (appointed 11 February 2014) n/a – – – – – –
Mr S Donohue (ceased as KMP 18 October 2013) – – 750 – (222) (528) n/a
(b) Insurance of officersDuring the financial year, the Group paid premiums in respect of directors’ and officers’ liability insurance contracts which cover former directors and officers, including executive officers of the entity and directors, executive officers and secretaries of its controlled entities. The directors have not included the amount of the premium paid in respect of the directors’ and officers’ liability insurance contract as such disclosure is prohibited under the terms of the insurance contract.
(c) Loans to KMP and their related partiesFor the 2014 financial year, there were no loans made, guaranteed, secured or outstanding in relation to KMP or their related parties (2013: nil).
(d) Other transactions with KMPA number of KMP hold positions in other subsidiaries of the parent entity that result in them having control or significant influence over the financial and operating policies of those entities. A number of these entities transacted with the Group in the reporting period. Refer to note 41(b) to the consolidated financial statements for further details.
(e) Changes in KMP occuring subsequent to 30 June 2014On 4 July 2014, the Group appointed three Non-Executive Directors to the Board of Virgin Australia Holdings Limited:
• Mr Goh Choon Phong, Singapore Airlines Limited (Alternate Director: Mr Marvin Tan);• Mr James Hogan, Etihad Airways P.J.S.C. (Alternate Director: Mr James Rigney); and• Mr Christopher Luxon, Air New Zealand Limited (Alternate Director; Mr Robert McDonald).
The appointments have occurred following the adoption of a Nominee Director Protocol (Protocol) which sets out the procedures to be followed by the Board, its major shareholders and their nominated representatives on the Board. The Protocol intends to assist in managing potential issues relating to conflicts of interest and confidential information and ensure the Board continues to service the interest of all shareholders. The appointment of the three Non-Executive Directors had no financial effect on the Group at 30 June 2014.
annual financial report 2014 41
6. Share options6.1 Unissued shares under optionAt the date of this report, unissued ordinary shares of the Company under option are:
Option plan Number of shares Exercise price Expiry date
Senior Executive Option Plan (SEOP)
– Issue 16 1,699,870 $0.00 30 June 2015/2016(1)
– Issue 17 5,264,491 $0.00 30 June 2016
– Issue 18 652,955 $0.00 30 June 2016
– Issue 19 2,796,420 $0.00 30 June 2016/2017(2)
– Issue 20 2,868,288 $0.00 30 June 2017/2018(3)
Total unissued ordinary shares under option 13,282,024
(1) Of the options which vest, 60% vested on 30 June 2014 and 40% will vest on 30 June 2015. Options that have vested will be exercisable no later than 12 months after
vesting, after which they will lapse.
(2) Of the options which vest, 60% will vest on 30 June 2015 and 40% will vest on 30 June 2016. Options that have vested will be exercisable no later than 12 months after
vesting, after which they will lapse.
(3) Of the options which vest, 60% will vest on 30 June 2016 and 40% will vest on 30 June 2017. Options that have vested will be exercisable no later than 12 months after
vesting, after which they will lapse.
7. Shares issued on exercise of options and performance rightsDuring or since the end of the 2014 financial year 8.6 million options and 2.2 million performance rights were issued resulting in an increase in share capital of $2.9 million.
In addition, 1.8 million shares with a value of $0.8 million were purchased through an on market buy-back arrangement to fulfil issuances under vested and exercised option plans.
8. Indemnification and insurance of officers and auditorsThe Company has agreed to indemnify the directors and officers of the Company against all liabilities to another person (other than the Company or a related body corporate) that may arise from their position as a director or an officer of the Company and its controlled entities, except where the liability arises out of conduct involving a lack of good faith.
The Company has directors’ and officers’ liability insurance contracts in place, for all current and former officers of the Company (including directors and the company secretary). The directors have not included the details of the nature of the liabilities covered or the amount of the premium paid in respect of the directors’ and officers’ liability insurance contracts, as such disclosure is prohibited under the terms of the insurance contract.
9. Non-audit servicesDuring the year KPMG, the Group’s auditor, has performed certain other services in addition to its statutory duties.
The Board has considered the non-audit services provided during the year and is satisfied that the provision of those non-audit services during the year by the auditor is compatible with, and did not compromise, the auditor’s independence requirements of the Corporations Act 2001 for the following reasons:• All non-audit services were subject to the corporate governance procedures adopted by the Company and have been reviewed by the Audit
and Risk Management Committee to ensure they do not impact the integrity and objectivity of the auditor; and• The non-audit services provided do not undermine the general principles relating to auditor independence as set out in APES 110 Code
of Ethics for Professional Accountants, as they did not involve reviewing or auditing the auditor’s own work, acting in a management or decision making capacity for the Company, acting as an advocate for the Company or jointly sharing risks and rewards.
Virgin Australia42
Directors’ report (continued)
9. Non-audit services (continued)Details of amounts paid to the auditor of the Group, KPMG, and its related practices for audit and non-audit services provided during the year are set out below:
2014 $’000
Audit services:
KPMG:
Statutory audits and reviews 1,632
Services other than statutory audit:
KPMG:
Other assurance services(1) 482
Other services:
– Taxation services 95
– Other 157
734
(1) Other assurance services relate to assurance services rendered in relation to sustainability, compliance with service level agreements, and other non-financial statement
assurance procedures.
10. Lead auditor’s independence declaration under section 307C of the Corporations Act 2001
The lead auditor’s independence declaration is set out on page 43 and forms part of the directors’ report for the financial year ended 30 June 2014.
11. Rounding offThe Group is of a kind referred to in ASIC Class Order 98/100 dated 10 July 1998 and in accordance with that Class Order, amounts in the consolidated financial statements and directors’ report have been rounded off to the nearest one hundred thousand dollars, unless otherwise stated.
This report is made in accordance with a resolution of the directors:
Neil ChatfieldDirector
John BorghettiDirector
Dated at Sydney, 29 September 2014
annual financial report 2014 43
Lead Auditor’s Independence Declaration under Section 307C of the Corporations Act 2001
To: The directors of Virgin Australia Holdings Limited
I declare that, to the best of my knowledge and belief, in relation to the audit for the financial year ended 30 June 2014 there have been:(i) no contraventions of the auditor independence requirements as set out in the Corporations Act 2001 in relation to the audit; and
(ii) no contraventions of any applicable code of professional conduct in relation to the audit.
KPMG
A W YoungPartner
Sydney, 29 September 2014
KPMG, an Australian partnership and a member firm of the KPMG network of independent member firms affiliated with KPMG International Cooperative (“KPMG International”), a Swiss entity.
Liability limited by a scheme approved under Professional Standards Legislation.
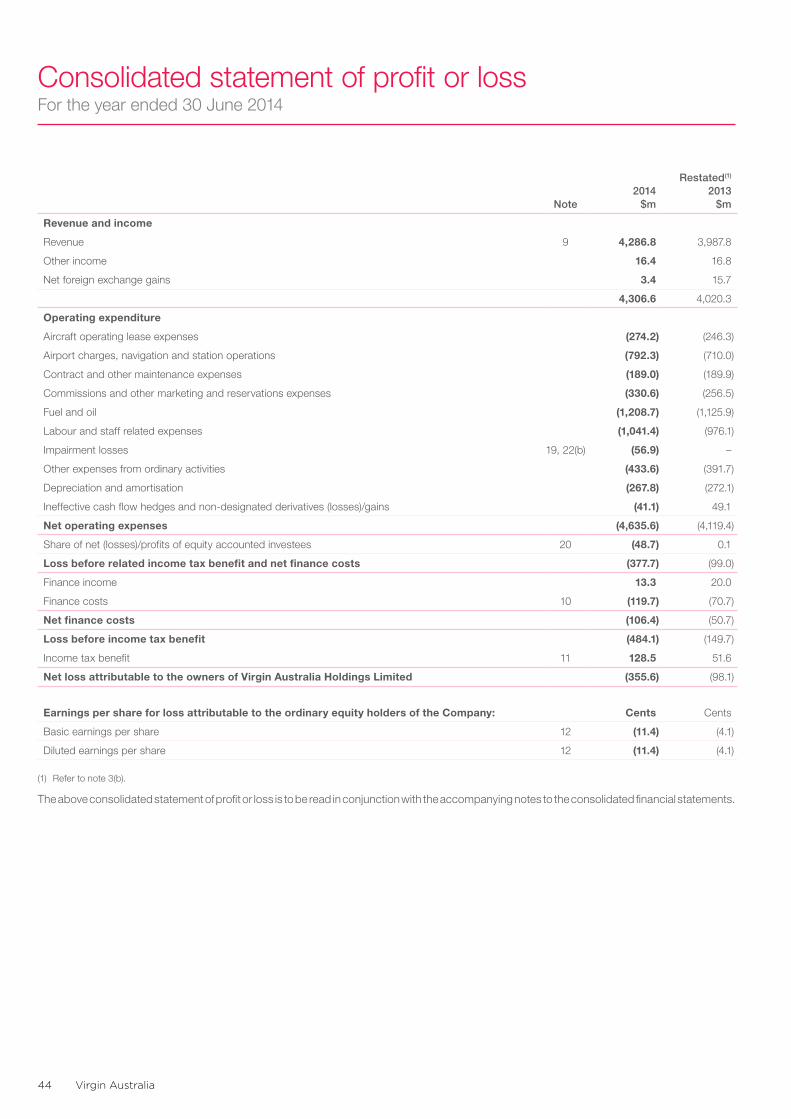
Virgin Australia44
Consolidated statement of profit or lossFor the year ended 30 June 2014
Note2014
$m
Restated(1) 2013
$m
Revenue and income
Revenue 9 4,286.8 3,987.8
Other income 16.4 16.8
Net foreign exchange gains 3.4 15.7
4,306.6 4,020.3
Operating expenditure
Aircraft operating lease expenses (274.2) (246.3)
Airport charges, navigation and station operations (792.3) (710.0)
Contract and other maintenance expenses (189.0) (189.9)
Commissions and other marketing and reservations expenses (330.6) (256.5)
Fuel and oil (1,208.7) (1,125.9)
Labour and staff related expenses (1,041.4) (976.1)
Impairment losses 19, 22(b) (56.9) –
Other expenses from ordinary activities (433.6) (391.7)
Depreciation and amortisation (267.8) (272.1)
Ineffective cash flow hedges and non-designated derivatives (losses)/gains (41.1) 49.1
Net operating expenses (4,635.6) (4,119.4)
Share of net (losses)/profits of equity accounted investees 20 (48.7) 0.1
Loss before related income tax benefit and net finance costs (377.7) (99.0)
Finance income 13.3 20.0
Finance costs 10 (119.7) (70.7)
Net finance costs (106.4) (50.7)
Loss before income tax benefit (484.1) (149.7)
Income tax benefit 11 128.5 51.6
Net loss attributable to the owners of Virgin Australia Holdings Limited (355.6) (98.1)
Earnings per share for loss attributable to the ordinary equity holders of the Company: Cents Cents
Basic earnings per share 12 (11.4) (4.1)
Diluted earnings per share 12 (11.4) (4.1)
(1) Refer to note 3(b).
The above consolidated statement of profit or loss is to be read in conjunction with the accompanying notes to the consolidated financial statements.
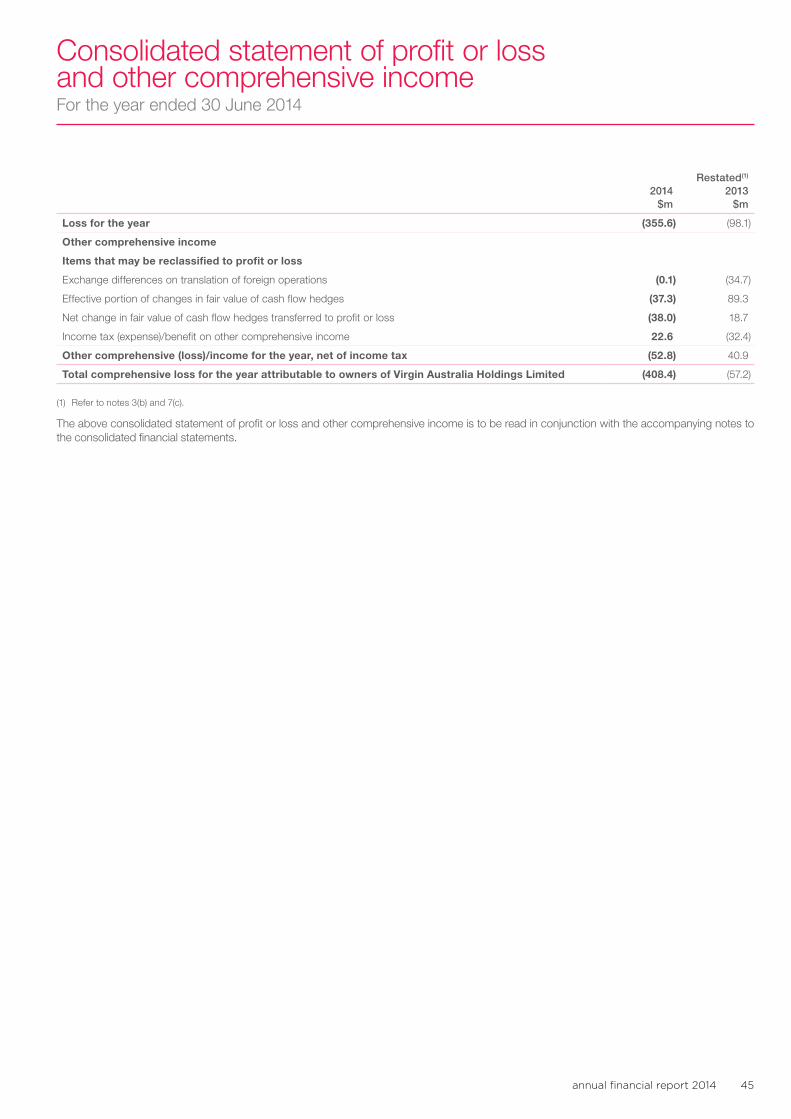
annual financial report 2014 45
Consolidated statement of profit or loss and other comprehensive incomeFor the year ended 30 June 2014
2014 $m
Restated(1) 2013
$m
Loss for the year (355.6) (98.1)
Other comprehensive income
Items that may be reclassified to profit or loss
Exchange differences on translation of foreign operations (0.1) (34.7)
Effective portion of changes in fair value of cash flow hedges (37.3) 89.3
Net change in fair value of cash flow hedges transferred to profit or loss (38.0) 18.7
Income tax (expense)/benefit on other comprehensive income 22.6 (32.4)
Other comprehensive (loss)/income for the year, net of income tax (52.8) 40.9
Total comprehensive loss for the year attributable to owners of Virgin Australia Holdings Limited (408.4) (57.2)
(1) Refer to notes 3(b) and 7(c).
The above consolidated statement of profit or loss and other comprehensive income is to be read in conjunction with the accompanying notes to the consolidated financial statements.
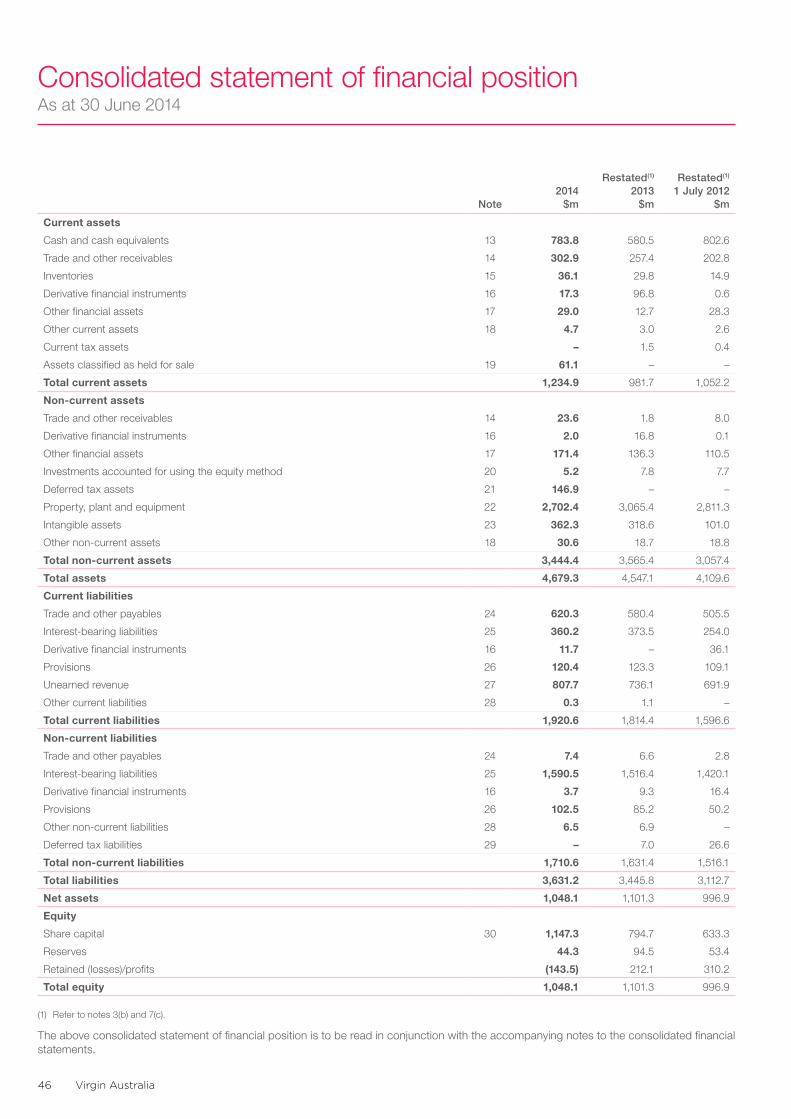
Virgin Australia46
Consolidated statement of financial positionAs at 30 June 2014
Note2014
$m
Restated(1) 2013
$m
Restated(1) 1 July 2012
$m
Current assets
Cash and cash equivalents 13 783.8 580.5 802.6
Trade and other receivables 14 302.9 257.4 202.8
Inventories 15 36.1 29.8 14.9
Derivative financial instruments 16 17.3 96.8 0.6
Other financial assets 17 29.0 12.7 28.3
Other current assets 18 4.7 3.0 2.6
Current tax assets – 1.5 0.4
Assets classified as held for sale 19 61.1 – –
Total current assets 1,234.9 981.7 1,052.2
Non-current assets
Trade and other receivables 14 23.6 1.8 8.0
Derivative financial instruments 16 2.0 16.8 0.1
Other financial assets 17 171.4 136.3 110.5
Investments accounted for using the equity method 20 5.2 7.8 7.7
Deferred tax assets 21 146.9 – –
Property, plant and equipment 22 2,702.4 3,065.4 2,811.3
Intangible assets 23 362.3 318.6 101.0
Other non-current assets 18 30.6 18.7 18.8
Total non-current assets 3,444.4 3,565.4 3,057.4
Total assets 4,679.3 4,547.1 4,109.6
Current liabilities
Trade and other payables 24 620.3 580.4 505.5
Interest-bearing liabilities 25 360.2 373.5 254.0
Derivative financial instruments 16 11.7 – 36.1
Provisions 26 120.4 123.3 109.1
Unearned revenue 27 807.7 736.1 691.9
Other current liabilities 28 0.3 1.1 –
Total current liabilities 1,920.6 1,814.4 1,596.6
Non-current liabilities
Trade and other payables 24 7.4 6.6 2.8
Interest-bearing liabilities 25 1,590.5 1,516.4 1,420.1
Derivative financial instruments 16 3.7 9.3 16.4
Provisions 26 102.5 85.2 50.2
Other non-current liabilities 28 6.5 6.9 –
Deferred tax liabilities 29 – 7.0 26.6
Total non-current liabilities 1,710.6 1,631.4 1,516.1
Total liabilities 3,631.2 3,445.8 3,112.7
Net assets 1,048.1 1,101.3 996.9
Equity
Share capital 30 1,147.3 794.7 633.3
Reserves 44.3 94.5 53.4
Retained (losses)/profits (143.5) 212.1 310.2
Total equity 1,048.1 1,101.3 996.9
(1) Refer to notes 3(b) and 7(c).
The above consolidated statement of financial position is to be read in conjunction with the accompanying notes to the consolidated financial statements.
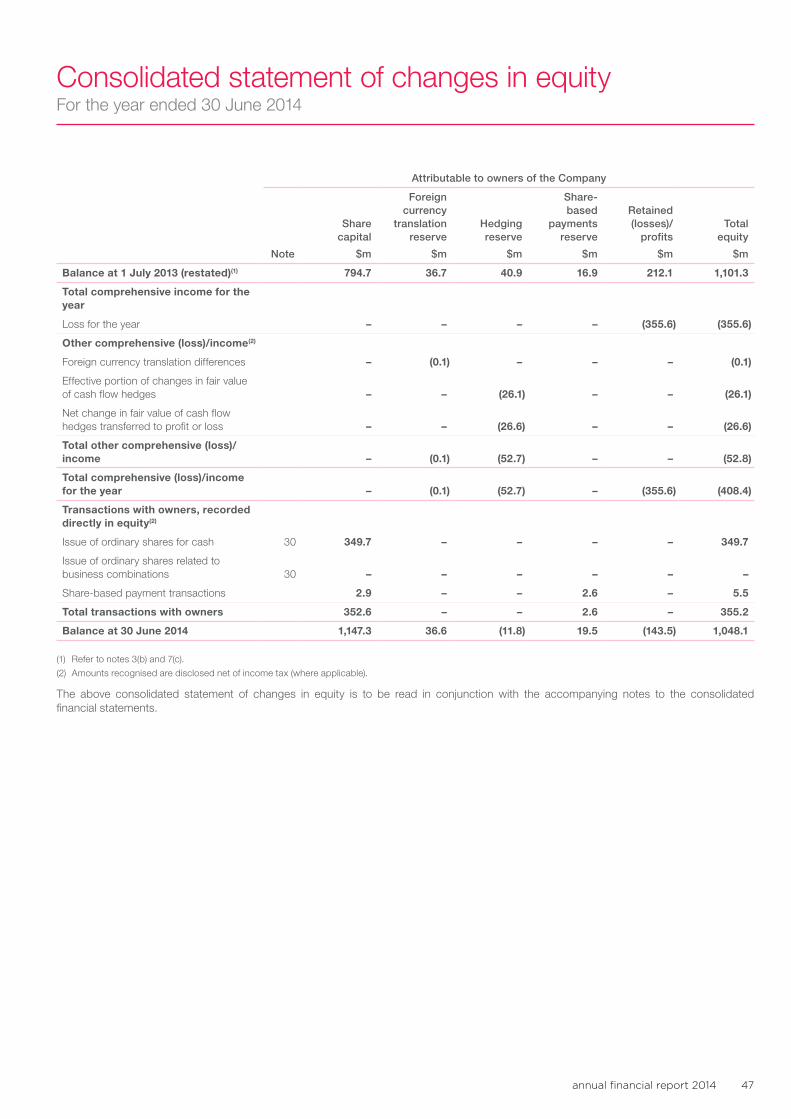
annual financial report 2014 47
Consolidated statement of changes in equityFor the year ended 30 June 2014
Attributable to owners of the Company
Note
Share capital
$m
Foreign currency
translation reserve
$m
Hedging reserve
$m
Share-based
payments reserve
$m
Retained (losses)/
profits
$m
Total equity
$m
Balance at 1 July 2013 (restated)(1) 794.7 36.7 40.9 16.9 212.1 1,101.3
Total comprehensive income for the year
Loss for the year – – – – (355.6) (355.6)
Other comprehensive (loss)/income(2)
Foreign currency translation differences – (0.1) – – – (0.1)
Effective portion of changes in fair value of cash flow hedges – – (26.1) – – (26.1)
Net change in fair value of cash flow hedges transferred to profit or loss – – (26.6) – – (26.6)
Total other comprehensive (loss)/income – (0.1) (52.7) – – (52.8)
Total comprehensive (loss)/income for the year – (0.1) (52.7) – (355.6) (408.4)
Transactions with owners, recorded directly in equity(2)
Issue of ordinary shares for cash 30 349.7 – – – – 349.7
Issue of ordinary shares related to business combinations 30 – – – – – –
Share-based payment transactions 2.9 – – 2.6 – 5.5
Total transactions with owners 352.6 – – 2.6 – 355.2
Balance at 30 June 2014 1,147.3 36.6 (11.8) 19.5 (143.5) 1,048.1
(1) Refer to notes 3(b) and 7(c).
(2) Amounts recognised are disclosed net of income tax (where applicable).
The above consolidated statement of changes in equity is to be read in conjunction with the accompanying notes to the consolidated financial statements.
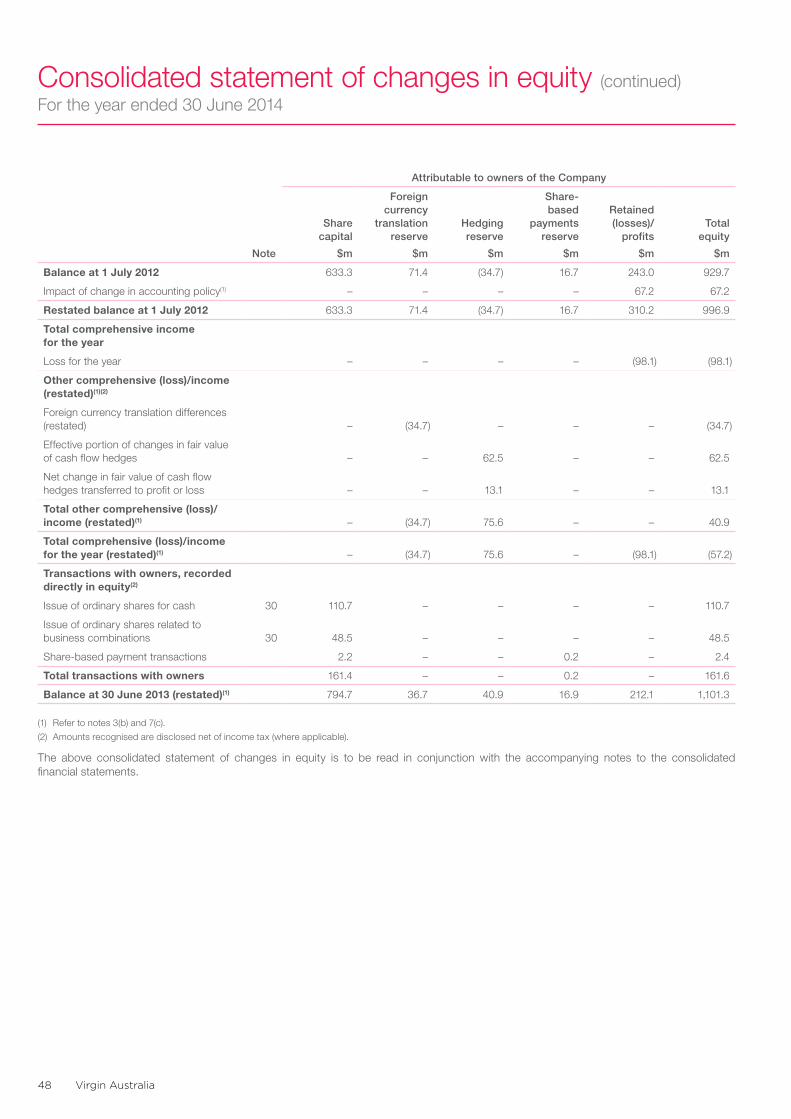
Virgin Australia48
Consolidated statement of changes in equity (continued)For the year ended 30 June 2014
Attributable to owners of the Company
Note
Share capital
$m
Foreign currency
translation reserve
$m
Hedging reserve
$m
Share-based
payments reserve
$m
Retained (losses)/
profits
$m
Total equity
$m
Balance at 1 July 2012 633.3 71.4 (34.7) 16.7 243.0 929.7
Impact of change in accounting policy(1) – – – – 67.2 67.2
Restated balance at 1 July 2012 633.3 71.4 (34.7) 16.7 310.2 996.9
Total comprehensive income for the year
Loss for the year – – – – (98.1) (98.1)
Other comprehensive (loss)/income (restated)(1)(2)
Foreign currency translation differences (restated) – (34.7) – – – (34.7)
Effective portion of changes in fair value of cash flow hedges – – 62.5 – – 62.5
Net change in fair value of cash flow hedges transferred to profit or loss – – 13.1 – – 13.1
Total other comprehensive (loss)/income (restated)(1) – (34.7) 75.6 – – 40.9
Total comprehensive (loss)/income for the year (restated)(1) – (34.7) 75.6 – (98.1) (57.2)
Transactions with owners, recorded directly in equity(2)
Issue of ordinary shares for cash 30 110.7 – – – – 110.7
Issue of ordinary shares related to business combinations 30 48.5 – – – – 48.5
Share-based payment transactions 2.2 – – 0.2 – 2.4
Total transactions with owners 161.4 – – 0.2 – 161.6
Balance at 30 June 2013 (restated)(1) 794.7 36.7 40.9 16.9 212.1 1,101.3
(1) Refer to notes 3(b) and 7(c).
(2) Amounts recognised are disclosed net of income tax (where applicable).
The above consolidated statement of changes in equity is to be read in conjunction with the accompanying notes to the consolidated financial statements.
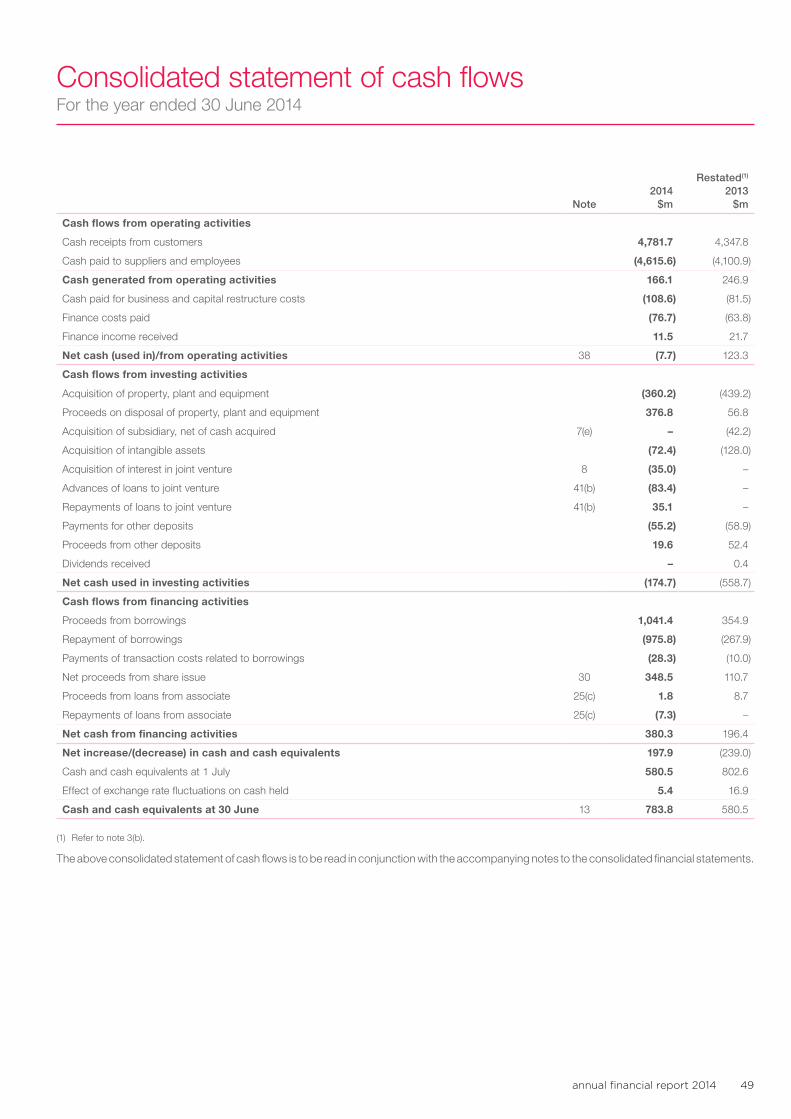
annual financial report 2014 49
Consolidated statement of cash flowsFor the year ended 30 June 2014
Note2014
$m
Restated(1) 2013
$m
Cash flows from operating activities
Cash receipts from customers 4,781.7 4,347.8
Cash paid to suppliers and employees (4,615.6) (4,100.9)
Cash generated from operating activities 166.1 246.9
Cash paid for business and capital restructure costs (108.6) (81.5)
Finance costs paid (76.7) (63.8)
Finance income received 11.5 21.7
Net cash (used in)/from operating activities 38 (7.7) 123.3
Cash flows from investing activities
Acquisition of property, plant and equipment (360.2) (439.2)
Proceeds on disposal of property, plant and equipment 376.8 56.8
Acquisition of subsidiary, net of cash acquired 7(e) – (42.2)
Acquisition of intangible assets (72.4) (128.0)
Acquisition of interest in joint venture 8 (35.0) –
Advances of loans to joint venture 41(b) (83.4) –
Repayments of loans to joint venture 41(b) 35.1 –
Payments for other deposits (55.2) (58.9)
Proceeds from other deposits 19.6 52.4
Dividends received – 0.4
Net cash used in investing activities (174.7) (558.7)
Cash flows from financing activities
Proceeds from borrowings 1,041.4 354.9
Repayment of borrowings (975.8) (267.9)
Payments of transaction costs related to borrowings (28.3) (10.0)
Net proceeds from share issue 30 348.5 110.7
Proceeds from loans from associate 25(c) 1.8 8.7
Repayments of loans from associate 25(c) (7.3) –
Net cash from financing activities 380.3 196.4
Net increase/(decrease) in cash and cash equivalents 197.9 (239.0)
Cash and cash equivalents at 1 July 580.5 802.6
Effect of exchange rate fluctuations on cash held 5.4 16.9
Cash and cash equivalents at 30 June 13 783.8 580.5
(1) Refer to note 3(b).
The above consolidated statement of cash flows is to be read in conjunction with the accompanying notes to the consolidated financial statements.
Virgin Australia50
Notes to the consolidated financial statementsFor the year ended 30 June 2014
1. Reporting entityVirgin Australia Holdings Limited (VAH) (the Company) is a company domiciled in Australia. The address of the Company’s registered office and principal place of business is 56 Edmondstone Road, Bowen Hills, Queensland.
The consolidated financial statements of the Company as at and for the year ended 30 June 2014 comprise the Company and its subsidiaries (together referred to as the Group, and individually as Group entities), and the Group’s interests in associates and joint ventures.
The Group is a for-profit entity and is primarily involved in the airline industry, both domestic and international.
2. Basis of preparation(a) Statement of complianceThe consolidated financial statements are general purpose financial statements which have been prepared in accordance with Australian Accounting Standards adopted by the Australian Accounting Standards Board (AASB) and the Corporations Act 2001. The consolidated financial statements comply with International Financial Reporting Standards (IFRS) adopted by the International Accounting Standards Board (IASB).
The consolidated financial statements were approved by the Board of Directors (Board) on 29 September 2014.
(b) Basis of measurementThe consolidated financial statements have been prepared on the basis of historical costs, except where assets and liabilities are stated at fair value in accordance with relevant accounting policies.
The Group’s current liabilities exceed its current assets for the year ended 30 June 2014 by $685.7 million (2013: $832.7 million) including a current liability for unearned revenue of $807.7 million (2013: $736.1 million). The consolidated financial statements have been prepared on a going concern basis, which contemplates the return to profitable trading and retention of a strong cash position. A net improvement of $147.0 million in net current liabilities was achieved in the year ended 30 June 2014, mainly due to an increase in cash and cash equivalents primarily due to debt and equity funding raised during the year. The Group has a cash and cash equivalents balance at 30 June 2014 of $783.8 million (2013: $580.5 million) and has an unrestricted cash balance at 30 June 2014 of $541.0 million (2013: $326.5 million).
(c) Functional and presentation currencyThese consolidated financial statements are presented in Australian dollars, which is the Company’s functional currency and the functional currency of the majority of the Group entities.
The Group is of a kind referred to in ASIC Class Order 98/100 dated 10 July 1998 and in accordance with the Class Order, amounts in the consolidated financial statements have been rounded off to the nearest one hundred thousand dollars, unless otherwise stated.
(d) Use of estimates and judgementsThe preparation of the consolidated financial statements requires management to make judgements, estimates and assumptions that affect the application of accounting policies and the reported amounts of assets, liabilities, income and expenses. Actual results may differ from these estimates.
Information about significant areas of estimation uncertainty and critical judgements in applying accounting policies that have the most significant effect on the amounts recognised in the consolidated financial statements is disclosed in note 4.
Estimates and underlying assumptions are reviewed on an ongoing basis. Revisions to accounting estimates are recognised in the period in which the estimate is revised and in any future periods affected. The significant changes in estimates recognised in the year ended 30 June 2014 and the comparative year ended 30 June 2013 are detailed in note 5.
(e) ComparativesWhere applicable, various comparative balances have been reclassified to align with current period presentation. These amendments have no material impact on the consolidated financial statements.

annual financial report 2014 51
3. Significant accounting policiesThe accounting policies set out below have been consistently applied to all the periods presented in these consolidated financial statements with the exception of those changes noted in notes 3(a) and 3(b) and have been applied consistently by Group entities.
(a) New accounting policies
(i) Assets classified as held for saleThe Group classifies assets as held for sale if it is highly probable that their carrying amounts will be recovered principally through a sale rather than through continuing use. Such assets classified as held for sale are measured at the lower of their carrying amount and fair value less costs to sell. Impairment losses on initial classification as held for sale and subsequent gains and losses on re-measurement are recognised in profit and loss. Assets are not depreciated or amortised once classified as held for sale. Assets classified as held for sale are presented separately as current items in the consolidated statement of financial position.
(b) Change in accounting policy
(i) Repairs and maintenance – operating leased aircraftThe Group has re-assessed its accounting for major maintenance of operating leased engines, airframes, landing gear and auxiliary power units, including the end of lease obligations to return the aircraft in the condition specified by the lessor. The Group previously recognised provisions for the estimated future costs of major maintenance, calculated by reference to the estimated rectification cost. Provisions were also made for end of lease obligations to return the aircraft in the condition specified by the lessor. Provisions were recognised net of reserve payments made to the lessor which were available to be drawn down. The costs of major maintenance were recognised against the provision when incurred.
Following the assessment of the current policy against those applied by industry participants in conjunction with the Board announcement in November 2013 of its intention to work with major airline shareholders for future Board representation with appropriate protocols, the Group elected to change the method of accounting for major maintenance of leased aircraft parts and end of lease obligations on 30 June 2014. Under the new policy, where the Group is obligated under its operating leases to pay an amount upon return of the aircraft based on either use or condition, a provision is recognised at inception of the lease for the present value of the expected payment, with a corresponding asset, reflecting the maintenance components within the lease payments. The asset is then amortised on a straight line basis over the life of the lease. The provision is accreted to the expected payment at the end of the lease with interest expense recognised in profit and loss. The cost of major cyclical maintenance and modifications incurred subsequently are capitalised as a leasehold improvement and depreciated over the shorter of the remaining lease term period or the time to the next major maintenance event. Where leasehold improvements are made to aircraft at inception of the lease, restoration provisions are also recognised at inception. Maintenance reserve payments made to the lessor are recognised in the consolidated statement of financial position as an other financial asset where recoverable. Unrecoverable reserve payments are treated as a component of lease expense and recognised over the term of the lease. The Group believes the change in accounting policy provides more relevant and reliable information, better reflects the present obligations arising under the lease agreements and achieves closer alignment with the policies adopted by industry participants.
The change in accounting policy has been applied retrospectively and the comparative amounts disclosed for the 2013 financial year have been restated where appropriate. The tables below summarise the adjustments made to reflect the implementation of the change in accounting policy:
Consolidated statement of financial position
Balances at 1 July 2012,
as previously reported
$m
Impact of the change in
accounting policy for the
year ended 30 June 2012
$m
Restated balances at 1 July 2012
$m
Balances at 30 June 2013, as previously
reported $m
Impact of the change in
accounting policy for the
year ended 30 June 2012
$m
Impact of the change in
accounting policy for the
year ended 30 June 2013
$m
Restated balances at
30 June 2013 $m
Other financial assets (current) 8.1 20.2 28.3 3.4 20.2 (10.9) 12.7
Other financial assets (non-current) 47.7 62.8 110.5 42.6 62.8 30.9 136.3
Deferred tax assets 10.9 (10.9) – 32.6 (10.9) (21.7) –
Property, plant and equipment 2,769.0 42.3 2,811.3 3,005.2 42.3 (13.0) 3,034.5
Provisions (current) (104.1) (5.0) (109.1) (102.0) (5.0) (10.4) (117.4)
Provisions (non-current) (25.9) (24.3) (50.2) (53.6) (24.3) 3.4 (74.5)
Deferred tax liabilities (8.7) (17.9) (26.6) – (17.9) 21.7 3.8
Retained (losses)/profits (243.0) (67.2) (310.2) (144.9) (67.2) – (212.1)
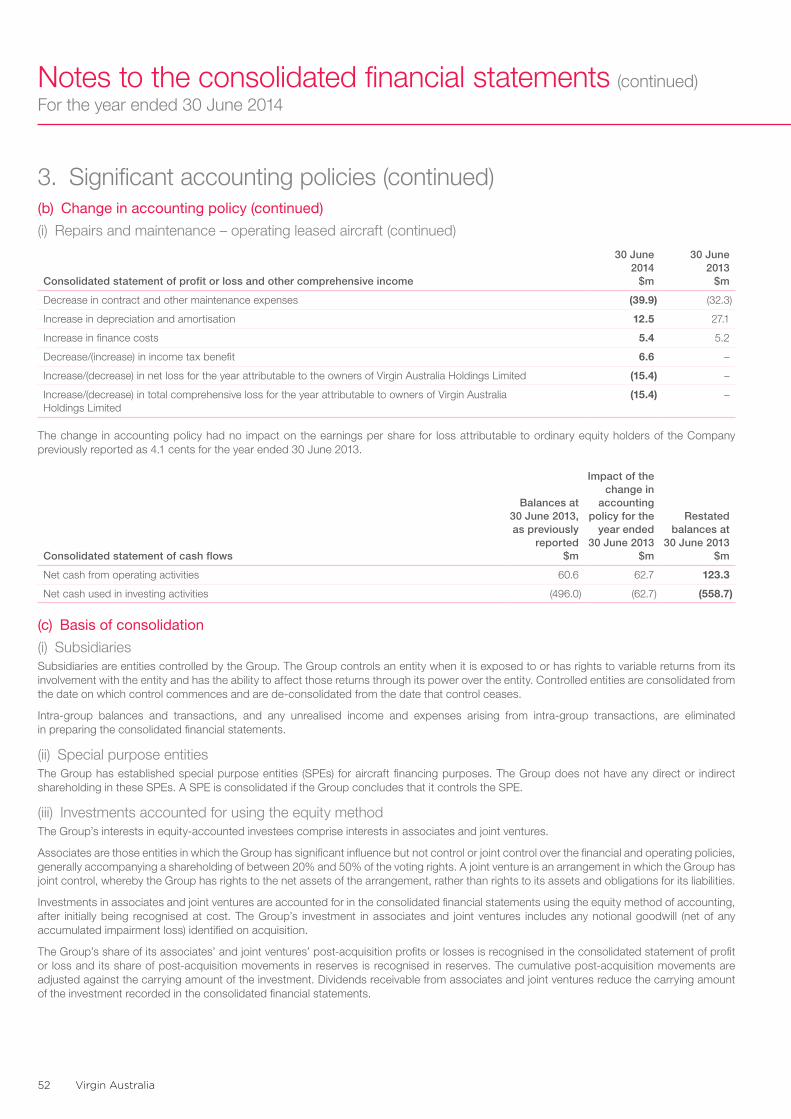
Virgin Australia52
Notes to the consolidated financial statements (continued)For the year ended 30 June 2014
3. Significant accounting policies (continued)(b) Change in accounting policy (continued)
(i) Repairs and maintenance – operating leased aircraft (continued)
Consolidated statement of profit or loss and other comprehensive income
30 June 2014
$m
30 June 2013
$m
Decrease in contract and other maintenance expenses (39.9) (32.3)
Increase in depreciation and amortisation 12.5 27.1
Increase in finance costs 5.4 5.2
Decrease/(increase) in income tax benefit 6.6 –
Increase/(decrease) in net loss for the year attributable to the owners of Virgin Australia Holdings Limited (15.4) –
Increase/(decrease) in total comprehensive loss for the year attributable to owners of Virgin Australia Holdings Limited
(15.4) –
The change in accounting policy had no impact on the earnings per share for loss attributable to ordinary equity holders of the Company previously reported as 4.1 cents for the year ended 30 June 2013.
Consolidated statement of cash flows
Balances at 30 June 2013, as previously
reported $m
Impact of the change in
accounting policy for the
year ended 30 June 2013
$m
Restated balances at
30 June 2013 $m
Net cash from operating activities 60.6 62.7 123.3
Net cash used in investing activities (496.0) (62.7) (558.7)
(c) Basis of consolidation
(i) SubsidiariesSubsidiaries are entities controlled by the Group. The Group controls an entity when it is exposed to or has rights to variable returns from its involvement with the entity and has the ability to affect those returns through its power over the entity. Controlled entities are consolidated from the date on which control commences and are de-consolidated from the date that control ceases.
Intra-group balances and transactions, and any unrealised income and expenses arising from intra-group transactions, are eliminated in preparing the consolidated financial statements.
(ii) Special purpose entitiesThe Group has established special purpose entities (SPEs) for aircraft financing purposes. The Group does not have any direct or indirect shareholding in these SPEs. A SPE is consolidated if the Group concludes that it controls the SPE.
(iii) Investments accounted for using the equity methodThe Group’s interests in equity-accounted investees comprise interests in associates and joint ventures.
Associates are those entities in which the Group has significant influence but not control or joint control over the financial and operating policies, generally accompanying a shareholding of between 20% and 50% of the voting rights. A joint venture is an arrangement in which the Group has joint control, whereby the Group has rights to the net assets of the arrangement, rather than rights to its assets and obligations for its liabilities.
Investments in associates and joint ventures are accounted for in the consolidated financial statements using the equity method of accounting, after initially being recognised at cost. The Group’s investment in associates and joint ventures includes any notional goodwill (net of any accumulated impairment loss) identified on acquisition.
The Group’s share of its associates’ and joint ventures’ post-acquisition profits or losses is recognised in the consolidated statement of profit or loss and its share of post-acquisition movements in reserves is recognised in reserves. The cumulative post-acquisition movements are adjusted against the carrying amount of the investment. Dividends receivable from associates and joint ventures reduce the carrying amount of the investment recorded in the consolidated financial statements.
annual financial report 2014 53
3. Significant accounting policies (continued)(c) Basis of consolidation (continued)
(iii) Investments accounted for using the equity method (continued)Unrealised gains on transactions between the Group and its associates and joint ventures are eliminated to the extent of the Group’s interest in the associates and joint ventures and are eliminated against the carrying amount of the investment. Unrealised losses are also eliminated in the same way unless the transaction provides evidence of impairment.
(iv) Business combinations Business combinations are accounted for using the acquisition method as at the acquisition date, being the date at which control is transferred to the Group. Refer note 3(c)(i) for the definition of control.
The Group measures goodwill at the acquisition date as:• The fair value of the consideration transferred; plus• The amount recognised of any non-controlling interests in the acquiree; plus• If the business combination is achieved in stages, the fair value of the existing equity interest in the acquiree; less• The net amount recognised (generally fair value) of the identifiable assets acquired and liabilities assumed.
When the excess is negative, a bargain purchase gain is recognised immediately in profit or loss.
The consideration transferred does not include amounts related to the settlement of pre-existing relationships. Such amounts are generally recognised in profit or loss.
Transaction costs, other than those associated with the issue of debt or equity securities, that the Group incurs in connection with a business combination are expensed as incurred.
(d) Foreign currency
(i) Transactions and balancesForeign currency transactions are translated to the functional currency of respective Group entities at the rates of exchange ruling at the dates of the transactions. Monetary assets and liabilities denominated in foreign currencies at the reporting date are retranslated to the functional currency at the foreign exchange rate at that date. The foreign currency gain or loss on monetary items is the difference between amortised cost in the functional currency at the beginning of the period, adjusted for effective interest and payments during the period, and the amortised cost in foreign currency translated at the exchange rate at the end of the period.
Non-monetary assets and liabilities denominated in foreign currencies that are measured at fair value are retranslated to the functional currency at the exchange rate at the date that the fair value was determined.
Foreign currency differences arising on retranslation are recognised in profit or loss, except for differences arising on qualifying cash flow hedges, which are recognised directly in other comprehensive income. Non-monetary items that are measured in terms of historical cost in a foreign currency are translated using the exchange rate at the date of the transaction.
Foreign currency gains and losses are reported on a net basis.
(ii) Foreign operationsThe results and financial position of all the Group entities (none of which has the currency of a hyperinflationary economy) that have a functional currency different from the presentation currency are translated into the presentation currency as follows:• Assets and liabilities are translated at exchange rates at the reporting date;• Income and expenses are translated at average exchange rates (unless that is not a reasonable approximation of the cumulative effect
of the rates prevailing on the transaction dates, in which case income and expenses are translated at the dates of the transactions); and• All resulting exchange differences are recognised in other comprehensive income and accumulated in the foreign currency translation reserve.
On consolidation, exchange differences arising from the translation of any net investment in foreign entities are recognised as equity in the foreign currency translation reserve.
When a foreign operation is sold, liquidated, has share capital repaid or is abandoned partially or in full such that control, significant influence or joint control is lost, the cumulative amount in the translation reserve related to that foreign operation is reclassified to profit or loss as part of the gain or loss on disposal.
Foreign exchange gains and losses arising from a monetary item receivable from or payable to a foreign operation, the settlement of which is neither planned nor likely in the foreseeable future, are also considered to form part of a net investment in a foreign operation and are recognised in other comprehensive income and accumulated in the foreign currency translation reserve.
Virgin Australia54
Notes to the consolidated financial statements (continued)For the year ended 30 June 2014
3. Significant accounting policies (continued)(e) Revenue and other incomeRevenue is measured at the fair value of the consideration received or receivable. Revenue is recognised for the major business activities as follows:
(i) Airline passenger revenueAirline passenger revenue comprises revenue from passenger ticket sales. Revenue is recognised in profit or loss when carriage is performed. Airline passenger revenue received in advance is carried forward in the consolidated statement of financial position as unearned revenue based on expected future carriage.
In addition, the Group is a party to various alliance arrangements. Revenue under these arrangements is recognised in profit or loss when the Group performs the carriage or otherwise fulfils all relevant contractual commitments.
(ii) Other revenueOther revenue comprises revenue earned from the provision of other airline related services (including charter revenue, freight revenue, on-board sales and other product revenue) and revenue from unutilised carriage. Other revenue is recognised in profit or loss at the time the service is provided or upon determination that carriage has not occurred.
(iii) Loyalty programAs described in note 3(u), the Group defers revenue relating to the issuance of points to members in the Velocity Frequent Flyer program. The receipt of cash from third parties above the fair value of the redemption is recognised immediately in profit or loss. For airline redemptions, revenue is recognised in profit or loss in accordance with the accounting policy for airline passenger revenue above. For non-airline redemptions relating to third parties, revenue is recognised in profit or loss as other revenue when points are redeemed.
(iv) Credit vouchersRevenue from the redemption of credit vouchers is recognised in profit or loss as other revenue when carriage is complete, or when the credit voucher is no longer expected to be redeemed by the guest based on an analysis of historical non-redemption rates, or upon expiry.
(v) DividendsRevenue from dividends and distributions from associates and joint ventures are recognised by the Group when they are declared by the associates and joint ventures.
(f) Government grantsGrants from the government are recognised at their fair value where there is a reasonable assurance that the grant will be received and the Group will comply with all attached conditions.
Government grants relating to costs are deferred and recognised in profit or loss over the period necessary to match them with the costs that they are intended to compensate.
Government grants relating to the purchase of property, plant and equipment are included in non-current liabilities as deferred income and are credited to profit or loss on a straight-line basis over the expected lives of the related assets.
(g) Net finance costsNet finance costs comprise interest paid or payable on borrowings calculated using the effective interest rate method, unwinding of the discount on provisions and receivables, interest receivable on funds invested and amortisation of borrowing costs.
Finance income is recognised in profit or loss as it accrues, using the effective interest rate method.
Finance costs are recognised in profit or loss as incurred on an effective interest rate method, except where interest costs relate to qualifying assets in which case they are capitalised to the cost of the assets. If borrowed specifically for the acquisition, construction or production of a qualifying asset, the amount of finance costs capitalised are those incurred in relation to that borrowing, net of any interest earned on those borrowings. Where funds are borrowed generally, finance costs are capitalised using a weighted average capitalisation rate and amortised over the terms of the agreement.
(h) Income taxThe income tax expense/benefit for the period comprises tax payable or receivable on the current period’s taxable income or loss based on the notional income tax rate for each jurisdiction, using tax rates enacted or substantively enacted at the reporting date, adjusted by changes in deferred tax assets and liabilities attributable to temporary differences between the tax bases of assets and liabilities and their carrying amounts in the consolidated financial statements, and to unused tax losses.
annual financial report 2014 55
3. Significant accounting policies (continued)(h) Income tax (continued)Deferred tax assets and liabilities are recognised for temporary differences at the tax rates expected to apply when the assets are recovered or liabilities are settled, based on those tax rates which are enacted or substantively enacted at the reporting date for each jurisdiction. The relevant tax rates are applied to the cumulative amounts of deductible and temporary differences to measure the deferred tax asset or liability. Deferred tax assets are recognised for deductible temporary differences and unused tax losses only if it is probable that future taxable amounts will be available to utilise those temporary differences and losses. Deferred tax assets are reviewed at each reporting date and are reduced to the extent that it is no longer probable that the related tax benefit will be realised.
Deferred tax is not recognised for:• Temporary differences on the initial recognition of assets or liabilities in a transaction that is not a business combination and that affects
neither accounting nor taxable profit or loss;• Temporary differences relating to investments in subsidiaries and associates, and interests in joint arrangements, where the Group is able
to control the timing of the reversal of the temporary differences and it is probable that the differences will not reverse in the foreseeable future; or
• Taxable temporary differences arising on initial recognition of goodwill.
Current and deferred tax balances attributable to amounts recognised directly in equity or other comprehensive income are also recognised directly in equity or other comprehensive income.
Deferred tax assets and liabilities are offset if there is a legally enforceable right to offset current tax liabilities and assets, and they relate to income taxes levied by the same tax authority on the same taxable entity, or on different taxable entities, but they intend to settle current tax liabilities and assets on a net basis or their tax assets and liabilities will be realised simultaneously.
(i) Tax consolidation legislationVAH and its wholly-owned Australian controlled entities are part of a tax consolidated group.
The head entity, VAH, and the controlled entities in the tax consolidated group continue to account for their own current and deferred tax amounts. These tax amounts are measured as if each entity in the tax consolidated group continues to be a stand-alone taxpayer in its own right.
In addition to its own current and deferred tax amounts, VAH also recognises the current tax liabilities (or assets) and the deferred tax assets arising from unused tax losses and unused tax credits assumed from controlled entities in the tax consolidated group to the extent that it is probable that future taxable profit will be available against which the unused tax losses and unused tax credits can be utilised.
(i) Goods and services taxRevenues, expenses and assets are recognised net of the amount of goods and services tax (GST), except where the amount of GST incurred is not recoverable from the taxation authority. In these circumstances, GST is recognised as part of the cost of acquisition of the asset or as part of the expense. Receivables and payables are stated with the amount of GST included.
The net amount of GST recoverable from, or payable to, the Australian Taxation Office (ATO) is included as a current asset or liability in the consolidated statement of financial position.
Cash flows are included in the consolidated statement of cash flows on a gross basis. The GST components of cash flows arising from investing and financing activities which are recoverable from, or payable to, the ATO are classified as operating cash flows.
(j) Earnings per shareBasic earnings per share (EPS) is calculated by dividing the net profit or loss attributable to the owners of the Company for the reporting period, after excluding any costs of servicing equity, by the weighted average number of ordinary shares of the Company, adjusted for any bonus elements in ordinary shares issued during the period.
Diluted EPS adjusts the figures used in the determination of basic EPS to take into account the after income tax effect of interest and other financing costs associated with dilutive potential ordinary shares and the weighted average number of shares assumed to have been issued for no consideration in relation to dilutive potential ordinary shares.
Virgin Australia56
Notes to the consolidated financial statements (continued)For the year ended 30 June 2014
3. Significant accounting policies (continued)(k) Financial instruments
(i) Non-derivative financial assetsThe Group initially recognises loans and receivables and deposits on the date that they originate. All other financial assets are recognised initially on the trade date at which the Group becomes a party to the contractual provisions of the instrument.
The Group derecognises a financial asset when the contractual rights to the cash flows from the asset expire, or it transfers the rights to receive the contractual cash flows on the financial asset in a transaction in which substantially all the risks and rewards of ownership of the financial asset are transferred. Any interest in transferred financial assets that is created or retained by the Group is recognised as a separate asset or liability.
Financial assets and liabilities are offset and the net amount presented in the consolidated statement of financial position when, and only when, the Group has a legal right to offset the amounts and intends either to settle on a net basis or to realise the asset and settle the liability simultaneously.
The Group has the following non-derivative financial assets: loans and receivables and cash and cash equivalents.
Loans and receivablesLoans and receivables are financial assets with fixed or determinable payments that are not quoted in an active market. Such assets are recognised initially at fair value plus any directly attributable transaction costs. Subsequent to initial recognition, loans and receivables are measured at amortised cost using the effective interest rate method, less any impairment losses. Loans and receivables comprise trade and other receivables and deposits (included in other financial assets).
Cash and cash equivalentsCash and cash equivalents includes cash on hand, deposits held at call with financial institutions and other short-term, highly liquid investments with original maturities of three months or less that are readily convertible to known amounts of cash and which are subject to an insignificant risk of changes in value.
(ii) Non-derivative financial liabilitiesThe Group initially recognises debt securities issued on the date that they originate. All other financial liabilities are recognised initially on the trade date at which the Group becomes a party to the contractual provisions of the instrument. The Group derecognises a financial liability when its contractual obligations are discharged or cancelled or expire. Financial assets and liabilities are offset and the net amount presented in the consolidated statement of financial position when, and only when, the Group has a legal right to offset the amounts and intends either to settle on a net basis or to realise the asset and settle the liability simultaneously.
The Group has the following non-derivative financial liabilities: loans, finance leases and trade and other payables.
Such financial liabilities are recognised initially at fair value less any directly attributable transaction costs. Subsequent to initial recognition these financial liabilities are measured at amortised cost using the effective interest rate method.
(iii) Share capital – ordinary sharesOrdinary shares are classified as equity. Incremental costs directly attributable to the issue of new shares or options are recognised as a deduction in equity, net of any tax effects.
Transactions of the Group sponsored Key Employee Performance Plan Trust are treated as being executed directly by the Company (as the Trust acts as the Company’s agent). Accordingly, shares in the Company held by the Trust are recognised as treasury shares and deducted from equity.
(iv) Derivative financial instruments, including hedge accountingThe Group enters into derivative financial instruments to hedge its foreign currency, fuel price risk, interest rate risk exposures and specific asset purchases denomindated in foreign currencies.
On initial designation of the hedge, the Group formally documents the relationship between the hedging instruments and hedged items, including the risk management objectives and strategy in undertaking the hedge transaction, together with the methods that will be used to assess the effectiveness of the hedging relationship. The Group makes an assessment, both at the inception of the hedge relationship as well as on an ongoing basis, whether the hedging instruments are expected to be “highly effective” in offsetting the changes in the fair value of cash flows of the respective hedged items during the period for which the hedge is designated, and whether the actual results of each hedge are within a range of 80-125%. For a cash flow hedge of a forecast transaction, the transaction should be highly probable to occur and should present an exposure to variations in cash flows that could ultimately affect profit or loss.
annual financial report 2014 57
3. Significant accounting policies (continued)(k) Financial instruments (continued)
(iv) Derivative financial instruments, including hedge accounting (continued)Derivatives are recognised initially at fair value. Subsequent to initial recognition, derivatives are measured at fair value, and changes therein are accounted for as described below.
Cash flow hedgesChanges in the fair value of the derivative hedging instrument designated as a cash flow hedge are recognised directly in other comprehensive income to the extent that the hedge is effective. To the extent that the hedge is ineffective, changes in fair value are recognised in profit or loss.
If the hedging instrument no longer meets the criteria for hedge accounting, is expired or sold, terminated or exercised, then hedge accounting is discontinued prospectively. The cumulative gain or loss previously recognised in other comprehensive income and presented in the hedging reserve in equity remains there until the forecast transaction is recognised in profit or loss. When the hedged item is a non-financial asset, the amount recognised in other comprehensive income is transferred to the carrying amount of the asset when the asset is recognised. In other cases, the amount recognised in other comprehensive income is transferred to profit or loss in the same period that the hedged item affects profit or loss.
(v) Non-hedge accounted derivative financial instrumentsWhen a derivative financial instrument is not designated in a hedge relationship, all changes in fair value are recognised immediately in profit or loss.
(vi) Embedded derivatives and optionsChanges in the fair value of separable embedded derivatives and options are recognised immediately in profit or loss.
(l) InventoriesInventories are measured at the lower of cost and net realisable value. The costs of engineering consumables, and uniforms are assigned to the individual items of inventory on the basis of weighted average costs. Cost of catering inventory is determined using the first-in, first-out (FIFO) cost method. Net realisable value is the estimated selling price in the ordinary course of business, less applicable variable selling expenses.
(m) Property, plant and equipmentProperty, plant and equipment is stated at historical cost less accumulated depreciation and impairment losses. Historical cost includes expenditure that is directly attributable to the acquisition of the items. Cost may also include transfers from other comprehensive income of any gains/losses on qualifying cash flow hedges of foreign currency purchases of property, plant and equipment.
Subsequent costs are included in the asset’s carrying amount or recognised as a separate asset, as appropriate, only when it is probable that future economic benefits associated with the item will flow to the Group and the cost of the item can be measured reliably. Ongoing repairs and maintenance are recognised in profit or loss.
Items of property, plant and equipment are depreciated using the straight-line method over their estimated useful lives, taking into account estimated residual values.
Major cyclical maintenance and modifications to operating leased aircraft capitalised are depreciated over the shorter of the time to the next maintenance event or remaining lease term period. Finance leased assets are depreciated over the shorter of the lease term and their useful lives unless it is reasonably certain that the Group will obtain ownership by the end of the lease term.
Depreciation methods, useful lives and residual values are reviewed at each reporting date.
Assets are depreciated from the date they are installed and are ready for use, or in respect of internally constructed assets, from the time an asset is completed and held ready for use. Where parts of an item of property, plant and equipment have different useful lives, they are accounted for as separate items (major components) of property, plant and equipment. An asset’s carrying amount is written down immediately to its recoverable amount if the asset’s carrying amount exceeds its estimated recoverable amount.
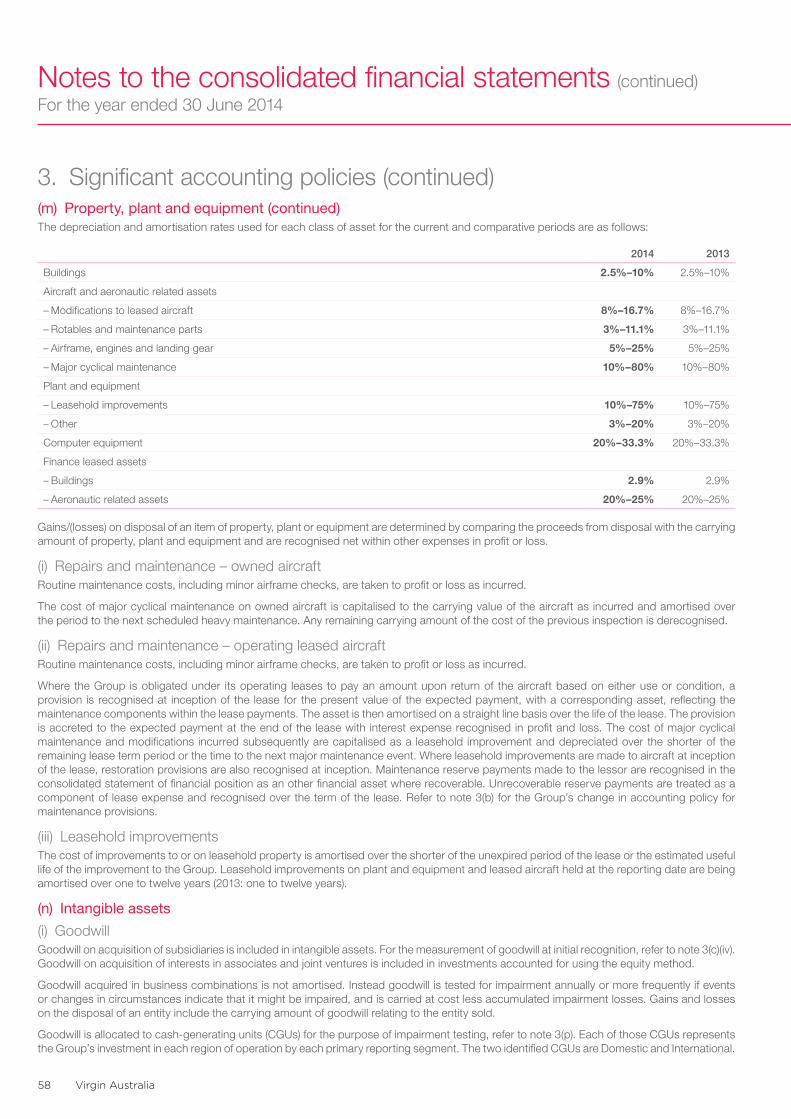
Virgin Australia58
Notes to the consolidated financial statements (continued)For the year ended 30 June 2014
3. Significant accounting policies (continued)(m) Property, plant and equipment (continued)The depreciation and amortisation rates used for each class of asset for the current and comparative periods are as follows:
2014 2013
Buildings 2.5%–10% 2.5%–10%
Aircraft and aeronautic related assets
– Modifications to leased aircraft 8%–16.7% 8%–16.7%
– Rotables and maintenance parts 3%–11.1% 3%–11.1%
– Airframe, engines and landing gear 5%–25% 5%–25%
– Major cyclical maintenance 10%–80% 10%–80%
Plant and equipment
– Leasehold improvements 10%–75% 10%–75%
– Other 3%–20% 3%–20%
Computer equipment 20%–33.3% 20%–33.3%
Finance leased assets
– Buildings 2.9% 2.9%
– Aeronautic related assets 20%–25% 20%–25%
Gains/(losses) on disposal of an item of property, plant or equipment are determined by comparing the proceeds from disposal with the carrying amount of property, plant and equipment and are recognised net within other expenses in profit or loss.
(i) Repairs and maintenance – owned aircraftRoutine maintenance costs, including minor airframe checks, are taken to profit or loss as incurred.
The cost of major cyclical maintenance on owned aircraft is capitalised to the carrying value of the aircraft as incurred and amortised over the period to the next scheduled heavy maintenance. Any remaining carrying amount of the cost of the previous inspection is derecognised.
(ii) Repairs and maintenance – operating leased aircraftRoutine maintenance costs, including minor airframe checks, are taken to profit or loss as incurred.
Where the Group is obligated under its operating leases to pay an amount upon return of the aircraft based on either use or condition, a provision is recognised at inception of the lease for the present value of the expected payment, with a corresponding asset, reflecting the maintenance components within the lease payments. The asset is then amortised on a straight line basis over the life of the lease. The provision is accreted to the expected payment at the end of the lease with interest expense recognised in profit and loss. The cost of major cyclical maintenance and modifications incurred subsequently are capitalised as a leasehold improvement and depreciated over the shorter of the remaining lease term period or the time to the next major maintenance event. Where leasehold improvements are made to aircraft at inception of the lease, restoration provisions are also recognised at inception. Maintenance reserve payments made to the lessor are recognised in the consolidated statement of financial position as an other financial asset where recoverable. Unrecoverable reserve payments are treated as a component of lease expense and recognised over the term of the lease. Refer to note 3(b) for the Group’s change in accounting policy for maintenance provisions.
(iii) Leasehold improvementsThe cost of improvements to or on leasehold property is amortised over the shorter of the unexpired period of the lease or the estimated useful life of the improvement to the Group. Leasehold improvements on plant and equipment and leased aircraft held at the reporting date are being amortised over one to twelve years (2013: one to twelve years).
(n) Intangible assets
(i) GoodwillGoodwill on acquisition of subsidiaries is included in intangible assets. For the measurement of goodwill at initial recognition, refer to note 3(c)(iv). Goodwill on acquisition of interests in associates and joint ventures is included in investments accounted for using the equity method.
Goodwill acquired in business combinations is not amortised. Instead goodwill is tested for impairment annually or more frequently if events or changes in circumstances indicate that it might be impaired, and is carried at cost less accumulated impairment losses. Gains and losses on the disposal of an entity include the carrying amount of goodwill relating to the entity sold.
Goodwill is allocated to cash-generating units (CGUs) for the purpose of impairment testing, refer to note 3(p). Each of those CGUs represents the Group’s investment in each region of operation by each primary reporting segment. The two identified CGUs are Domestic and International.
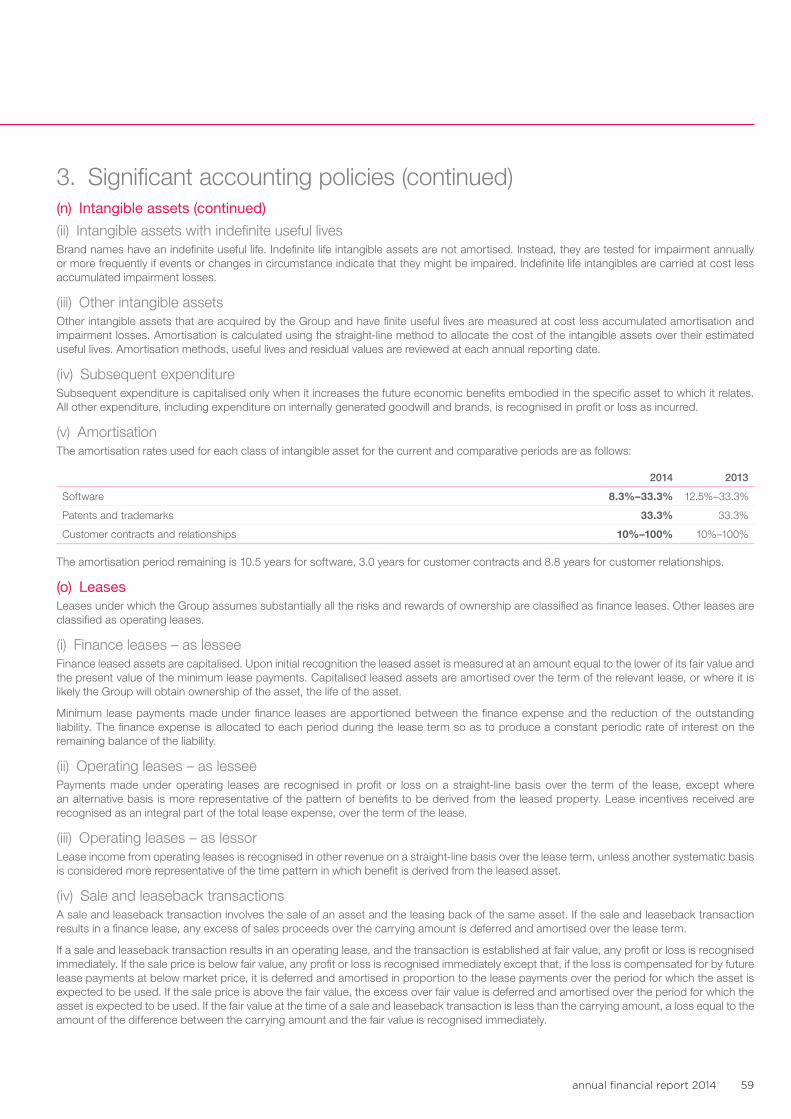
annual financial report 2014 59
3. Significant accounting policies (continued)(n) Intangible assets (continued)
(ii) Intangible assets with indefinite useful livesBrand names have an indefinite useful life. Indefinite life intangible assets are not amortised. Instead, they are tested for impairment annually or more frequently if events or changes in circumstance indicate that they might be impaired. Indefinite life intangibles are carried at cost less accumulated impairment losses.
(iii) Other intangible assetsOther intangible assets that are acquired by the Group and have finite useful lives are measured at cost less accumulated amortisation and impairment losses. Amortisation is calculated using the straight-line method to allocate the cost of the intangible assets over their estimated useful lives. Amortisation methods, useful lives and residual values are reviewed at each annual reporting date.
(iv) Subsequent expenditureSubsequent expenditure is capitalised only when it increases the future economic benefits embodied in the specific asset to which it relates. All other expenditure, including expenditure on internally generated goodwill and brands, is recognised in profit or loss as incurred.
(v) AmortisationThe amortisation rates used for each class of intangible asset for the current and comparative periods are as follows:
2014 2013
Software 8.3%–33.3% 12.5%–33.3%
Patents and trademarks 33.3% 33.3%
Customer contracts and relationships 10%–100% 10%–100%
The amortisation period remaining is 10.5 years for software, 3.0 years for customer contracts and 8.8 years for customer relationships.
(o) LeasesLeases under which the Group assumes substantially all the risks and rewards of ownership are classified as finance leases. Other leases are classified as operating leases.
(i) Finance leases – as lesseeFinance leased assets are capitalised. Upon initial recognition the leased asset is measured at an amount equal to the lower of its fair value and the present value of the minimum lease payments. Capitalised leased assets are amortised over the term of the relevant lease, or where it is likely the Group will obtain ownership of the asset, the life of the asset.
Minimum lease payments made under finance leases are apportioned between the finance expense and the reduction of the outstanding liability. The finance expense is allocated to each period during the lease term so as to produce a constant periodic rate of interest on the remaining balance of the liability.
(ii) Operating leases – as lesseePayments made under operating leases are recognised in profit or loss on a straight-line basis over the term of the lease, except where an alternative basis is more representative of the pattern of benefits to be derived from the leased property. Lease incentives received are recognised as an integral part of the total lease expense, over the term of the lease.
(iii) Operating leases – as lessorLease income from operating leases is recognised in other revenue on a straight-line basis over the lease term, unless another systematic basis is considered more representative of the time pattern in which benefit is derived from the leased asset.
(iv) Sale and leaseback transactionsA sale and leaseback transaction involves the sale of an asset and the leasing back of the same asset. If the sale and leaseback transaction results in a finance lease, any excess of sales proceeds over the carrying amount is deferred and amortised over the lease term.
If a sale and leaseback transaction results in an operating lease, and the transaction is established at fair value, any profit or loss is recognised immediately. If the sale price is below fair value, any profit or loss is recognised immediately except that, if the loss is compensated for by future lease payments at below market price, it is deferred and amortised in proportion to the lease payments over the period for which the asset is expected to be used. If the sale price is above the fair value, the excess over fair value is deferred and amortised over the period for which the asset is expected to be used. If the fair value at the time of a sale and leaseback transaction is less than the carrying amount, a loss equal to the amount of the difference between the carrying amount and the fair value is recognised immediately.
Virgin Australia60
Notes to the consolidated financial statements (continued)For the year ended 30 June 2014
3. Significant accounting policies (continued)(p) Impairment
(i) Financial assets (including receivables)A financial asset not carried at fair value through profit or loss, including an interest in an equity-accounted investee, is assessed at each reporting date to determine whether there is objective evidence that it is impaired. A financial asset is impaired if objective evidence indicates that a loss event has occurred after the initial recognition of the asset, and that the loss event had a negative effect on the estimated future cash flows of that asset. Individually significant financial assets are tested for impairment on an individual basis.
An impairment loss in respect of a financial asset measured at amortised cost is calculated as the difference between its carrying amount and the present value of the estimated future cash flows discounted at the asset’s original effective interest rate. Losses are recognised in profit or loss and reflected in an allowance account against receivables. Interest on the impaired asset continues to be recognised through the unwinding of the discount.
When a subsequent event causes the amount of impairment loss to decrease, the decrease in impairment loss is reversed through profit or loss.
An impairment loss in respect of an equity-accounted investee is measured by comparing the recoverable amount of the investment with its carrying amount. An impairment loss is recognised in profit or loss, and is reversed if there has been a favourable change in the estimates used to determine the recoverable amount.
(ii) Non-financial assetsThe carrying amounts of the Group’s non-financial assets, other than inventories and deferred tax assets, are reviewed at each reporting date to determine whether there is any indication of impairment. If any such indication exists, then the asset’s recoverable amount is estimated. For goodwill and intangible assets that have indefinite useful lives or that are not yet available for use, the recoverable amount is estimated each year at the same time.
The recoverable amount of an asset or CGU is the greater of its value-in-use and its fair value less costs of disposal. In assessing value-in-use, the estimated future cash flows are discounted to their present value using a post-tax discount rate that reflects current market assessments of the time value of money and the risks specific to the asset. For the purposes of assessing impairment, assets that cannot be tested individually are grouped together into the smallest group of assets that generates cash inflows from continuing use that are largely independent of the cash inflows of other assets or groups of assets, the CGU. Subject to an operating segment ceiling test, for the purposes of goodwill impairment testing, CGUs to which goodwill has been allocated have been aggregated so that the level at which impairment is tested reflects the lowest level at which goodwill is monitored for internal reporting purposes. Goodwill acquired in a business combination is allocated to CGUs that are expected to benefit from the synergies of the combination.
An impairment loss is recognised if the carrying amount of an asset or its CGU exceeds its estimated recoverable amount. Impairment losses are recognised in profit or loss. Impairment losses recognised in respect of CGUs are allocated first to reduce the carrying amount of any goodwill allocated to the units, and then to reduce the carrying amounts of the other assets in the unit (group of units) on a pro-rata basis.
An impairment loss in respect of goodwill is not reversed. In respect of other assets, impairment losses recognised in prior periods are assessed at each reporting date for any indications that the loss has decreased or no longer exists. An impairment loss is reversed if there has been a change in the estimates used to determine the recoverable amount. An impairment loss is reversed only to the extent that the asset’s carrying amount does not exceed the carrying amount that would have been determined, net of depreciation or amortisation, if no impairment loss had been recognised.
(q) BorrowingsBorrowings are initially recognised at fair value, net of transaction costs incurred. Borrowings are subsequently measured at amortised cost. Any difference between the proceeds (net of transaction costs) and the redemption amount is recognised in profit or loss over the period of the borrowings using the effective interest rate method.
Borrowings are classified as current liabilities unless the Group has an unconditional right to defer settlement of the liability for at least twelve months after the balance date.
(r) Employee benefits
(i) Wages and salaries, annual leave and sick leaveLiabilities for wages and salaries, including non-monetary benefits and annual leave expected to be settled within twelve months of the reporting date are measured at their nominal amounts in current other payables and provisions and represent the amounts expected to be paid when liabilities are settled. Liabilities for non-vesting sick leave are recognised when the leave is taken and measured at the rates paid or payable.
annual financial report 2014 61
3. Significant accounting policies (continued)(r) Employee benefits (continued)
(ii) Long term employee benefitsThe provision for long term employee benefits, such as long service leave, represents the present value of the estimated future cash outflows to be made resulting from employees’ services provided to the reporting date.
The provision is calculated using expected future increases in wage and salary rates including related on costs and expected settlement dates based on turnover history and is discounted using the rates attaching to state government bonds as appropriate at the reporting date which most closely match the terms of maturity of the related liabilities.
(iii) Employee bonus plansA liability for employee benefits in the form of bonus plans is recognised in the provision for employee entitlements when there is no realistic alternative but to settle the liability and at least one of the following conditions is met:• There are formal terms in the plan for determining the amount of the benefit;• The amounts to be paid are determined before the time of completion of the annual consolidated financial statements; or• Past practice gives clear evidence of the amount of the obligation.
Liabilities for bonus plans are expected to be settled within 12 months and are measured at the amounts expected to be paid when they are settled.
(iv) Superannuation planThe Group is required to make contributions to defined contribution employee superannuation plans. A defined contribution plan is a post-employment benefit plan under which an entity pays fixed contributions into a separate entity and will have no legal or constructive obligation to pay further amounts. Such contributions are charged to profit or loss in the periods during which services are rendered by employees. Prepaid contributions are recognised as an asset to the extent that a cash refund or reduction in future payments is available.
(v) Share-based paymentsThe Group operates a number of employee option plans and share plans. The fair value of options and performance rights granted are recognised as an employee benefit expense with a corresponding increase in equity. The fair value is measured at grant date and recognised over the period during which the employees become unconditionally entitled to the options and performance rights.
The fair value at grant date is determined using a Black-Scholes, Binomial or Monte Carlo option pricing model depending on the terms and conditions of each option, that takes into account the exercise price, the term of the option, the vesting and performance criteria, the impact of dilution, the non-tradeable nature of the option, the share price at grant date and expected price volatility of the underlying share, the expected dividend yield and the risk-free interest rate for the term of the option. The fair value of the performance rights at the grant date is independently determined using a discounted cash flow technique taking into account the share price at the grant date and dividends forgone over the vesting period of the performance rights.
The fair value of the option granted excludes the impact of any service and non-market vesting conditions (for example, profitability and sales growth targets). Service and non-market vesting conditions are included in assumptions about the number of options and performance rights that are expected to become exercisable. At each reporting date, the entity revises its estimate of the number of options and performance rights that are expected to become exercisable. The employee benefit expense recognised each period takes into account the most recent estimates, such that the amount ultimately recognised as an expense is based on the number of options and performance rights that meet the related service and non-market performance conditions at the vesting date.
Upon exercise of options and performance rights, the balance of the share-based payments reserve relating to those options and performance rights is transferred to share capital. The market value of shares issued to employees for no cash consideration under the employee share scheme is recognised as an employee benefits expense with a corresponding increase in equity when the shares vest.
When the Company grants options and performance rights over its shares to employees of subsidiaries, the fair value at grant date is recognised as an increase in the investments in subsidiaries, with a corresponding increase in equity over the vesting period of the grant.
(vi) Termination benefitsTermination benefits are recognised as an expense when the Group is committed demonstrably, without realistic possibility of withdrawal, to a formal detailed plan to either terminate employment before the normal retirement date, or to provide termination benefits as a result of an offer made to encourage voluntary redundancy. Termination benefits for voluntary redundancies are recognised as an expense if the Group has made an offer of voluntary redundancy, it is probable that the offer will be accepted and the number of acceptances can be estimated reliably. If benefits are payable more than 12 months after the reporting date, then they are discounted to their present value.
Virgin Australia62
Notes to the consolidated financial statements (continued)For the year ended 30 June 2014
3. Significant accounting policies (continued)(s) ProvisionsA provision is recognised when there is a present legal, equitable or constructive obligation as a result of a past event, it is probable that a future sacrifice of economic benefits will be required to settle the obligation, the timing or amount of which is uncertain and the amount has been reliably estimated.
Where there are a number of similar obligations, the likelihood that an outflow will be required in settlement is determined by considering the class of obligations as a whole. A provision is recognised even if the likelihood of an outflow with respect to any one item included in the same class of obligations may be small.
Provisions are determined by discounting expected future cash flows at a pre-tax rate that is specific to the liability. The unwinding of the discount is recognised as a finance cost.
(i) MaintenanceRefer note 3(m)(ii) for the accounting policy relating to provisions for repairs and maintenance – operating leased aircraft.
(ii) Onerous contractsA provision for onerous contracts is recognised when the expected benefits to be derived by the Group from a contract are lower than the unavoidable cost of meeting its obligations under the contract. The provision is measured at the present value of the lower of expected cost of terminating the contract and the expected net cost of continuing with the contract. Before a provision is established, the Group recognises any impairment loss on the assets associated with that contract in profit or loss.
In the prior year, a provision for unfavourable contract terms was recognised on acquisition of Skywest Airlines Pte Ltd (formerly Skywest Airlines Ltd) (Skywest). This provision relates to aircraft operating lease agreements that are unfavourable relative to market terms. The provision is measured at the present value of the unfavourable aircraft rental expense attributable to these lease agreements.
(t) DividendsProvision is made for the amount of any dividend declared, determined or publicly recommended by the directors on or before the end of the year but not distributed at balance date.
(u) Loyalty program accounting The Group receives participation fee revenue from third parties for the rights to have Velocity reward points allocated to members of the Velocity Frequent Flyer program. Members of the Velocity Frequent Flyer program also accumulate points by travelling on qualifying Group airline services. The obligation to provide awards to members is accounted for by deferring a portion of the flight ticket sales revenue. The amount deferred is the fair value, which is the amount for which the points could be sold separately (taking into account non-performance risk) and includes an estimate of historical trends of breakage.
(v) Segment reportingAn operating segment is a component of the Group that engages in business activities from which it may earn revenues and incur expenses, including revenues and expenses that relate to transactions with any of the Group’s other components. All operating segments’ operating results are reviewed regularly by the chief operating decision maker to make decisions about resources to be allocated to the segment and assess its performance, and for which discrete financial information is available. Segment results that are reported to the chief operating decision maker include items directly attributable to a segment as well as those that can be allocated on a reasonable basis.
(w) Determination of fair valuesA number of the Group’s accounting policies and disclosures require the determination of fair value, for both financial and non-financial assets and liabilities.
Fair value is the price that would be received to sell an asset or paid to transfer a liability in an orderly transaction between market participants at the measurement date.
The Group uses valuation techniques that are appropriate in the circumstances and for which sufficient data is available to measure fair value, maximising the use of relevant observable inputs and minimising the use of unobservable inputs.
The fair value of cash and cash equivalents, trade and other receivables, other financial assets, trade and other payables and other financial liabilities approximate their carrying amounts largely due to the short term nature of these instruments.
annual financial report 2014 63
3. Significant accounting policies (continued)(w) Determination of fair values (continued)Fair values have been determined for measurement and/or disclosure purposes based on the following methods:
(i) DerivativesThe fair value of financial instruments traded in active markets (such as publicly traded derivatives) is based on quoted market prices at the reporting date. The quoted market price used for financial assets held by the Group is the current bid price; the appropriate quoted market price for financial liabilities is the current ask price.
The fair value of financial instruments that are not traded in an active market (for example, over-the-counter derivatives) is determined using valuation techniques, such as estimated discounted cash flows. The fair value of forward exchange contracts and fuel contracts is determined using forward exchange market rates and fuel prices at the reporting date. The fair value of interest-rate swaps is calculated as the present value of the estimated future cash flows and credit adjustments.
(ii) Non-derivative financial liabilitiesNon-derivative financial liabilities are measured at fair value, at initial recognition and for disclosure purposes, at each annual reporting date. The fair value of interest-bearing borrowings and loans, including leases, are determined by discounting the remaining contractual cash-flows at the relevant credit adjusted market interest rates at the reporting date.
(iii) Share-based payment transactionsRefer to note 3(r)(v) for discussion of fair value calculations of employee shares, share options and performance rights.
(iv) Unearned revenueRefer to note 3(u) for discussion of fair value of Velocity Frequent Flyer program reward points, which are recorded in the statement of financial position as unearned revenue.
(v) Property, plant and equipmentThe fair value of property, plant and equipment recognised as a result of a business combination is the estimated amount for which a property could be exchanged on the date of acquisition between a willing buyer and a willing seller in an arm’s length transaction after proper marketing wherein the parties had each acted knowledgeably. The fair value of items of plant and equipment, including aircraft and aeronautical related assets, is based on the market approach and cost approaches using quoted market prices for similar items when available and depreciated replacement cost when appropriate. The market approach reflects adjustments for differences in the timing, location, background and subject matter of the assets. Depreciated replacement cost reflects adjustments for physical deterioration in addition to functional and economic obsolescence.
(vi) Intangible assetsThe fair value of brand names acquired in a business combination is calculated using the relief from royalty methodology. The fair value is calculated as the net present value of the prospective stream of hypothetical royalty income that would be generated over the expected useful life of the brand name if it was licensed to an independent third party owner. The fair value of customer contracts and customer relationships acquired in a business combination are determined using the excess earnings method. The intangible asset is valued after deducting a fair return on all other assets that contribute to generating the cash flows attributed to the intangible asset.
(vii) InventoriesThe fair value of engineering consumables acquired in a business combination is determined using the current replacement cost method, with reference to consumables with equivalent functionality at current prices and costs.
(viii) Provisions on acquisitionThe fair value of provisions acquired in a business combination is determined differently for each type of provision. The fair value of provisions for employee benefits has been determined in accordance with the accounting policy in note 3(r), while the provisions for aircraft maintenance have been determined in accordance with the accounting policy in note 3(m)(ii). The fair value of the provision for unfavourable aircraft lease terms was determined via the identification of the prospective unfavourable portion of the rental payments associated with the lease agreements, on an incremental cash flow basis. All provisions acquired in a business combination are adjusted for the effect of the time value of money by discounting expected future cash flows at a pre-tax rate that is specific to the liability.
Virgin Australia64
Notes to the consolidated financial statements (continued)For the year ended 30 June 2014
3. Significant accounting policies (continued)(x) Impact of new accounting standards and interpretations adopted from 1 July 2013
(i) Fair value measurement and presentationFrom 1 July 2013 the Group applied AASB 13 Fair Value Measurement (AASB 13). AASB 13 establishes a single framework for measuring fair value and making disclosures about fair value measurements, when such measurements are required or permitted by other AASBs. It unifies the definition of fair value as the price at which an orderly transaction to sell an asset or to transfer a liability would take place between market participants at the measurement date. It replaces and expands the disclosure requirements about fair value measurements in other AASBs, including AASB 7 Financial Instruments: Disclosures. In accordance with the transitional provisions of AASB 13, the Group has applied the new fair value measurement guidance prospectively. Notwithstanding the above, the change had no material impact on the measurement of the Group’s assets and liabilities.
(ii) Employee benefits measurement and presentationFrom 1 July 2013, the Group applied amendments to AASB 119 Employee Benefits. The change in accounting policy impacts the Group’s measurement of annual leave provisions as a result of the amended definitions of short-term and other long-term employee benefits. The change had no material impacts for the Group.
(iii) Consolidated financial statementsAASB 10 Consolidated Financial Statements (AASB 10) supersedes AASB 127 Consolidated and Separate Financial Statements and Interpretation 112 Consolidation – Special Purpose Entities. It introduces a new single control model to assess whether to consolidate an investee. The Group has adopted the standard effective 1 July 2013 and has assessed that there are no material impacts for the Group.
(iv) Joint arrangementsAASB 11 Joint Arrangements (AASB 11) introduces a principles based approach to accounting for joint arrangements. If the parties have rights to and obligations for underlying assets and liabilities, the joint arrangement is considered a joint operation and the parties will account for their share of revenue, expenses, assets and liabilities. Otherwise the joint arrangement is considered a joint venture and the parties must use the equity method to account for their interest. The Group has adopted the standard effective 1 July 2013 and has assessed, other than the application of the standard on acquisition of Tiger Airways Australia Pty Limited (Tiger), refer note 8, there are no material impacts for the Group.
(v) Disclosure of interests in other entitiesAASB 12 Disclosure of Interests in Other Entities sets out the required disclosures in annual financial statements for entities reporting under the two new standards AASB 10 and AASB 11. The Group has adopted the standard effective 1 July 2013.
(vi) AASB 2013-3 Amendments to AASB 136 Recoverable Amount Disclosures for Non-Financial AssetsAASB 2013-3 Amendments to AASB 136 Recoverable Amount Disclosures for Non-Financial Assets amends the disclosure requirements in AASB 136 Impairment of Assets. The effective date of this amendment is 1 January 2014. The Group has early adopted the new standard before its operative date, which means that it will be applied in the reporting period ended 30 June 2014. Early adoption of this amendment is allowed, provided that AASB 13 is also applied to the same period. As a result, there are additional disclosure requirements where an impairment is recognised, refer to note 22(b).
(y) New accounting standards and interpretations not yet adoptedThe following standards, amendments to standards and interpretations have been identified as those which may impact the Group in the period of initial application, and have not been applied in preparing these consolidated financial statements:• AASB 9 (2013, 2010 and 2009) Financial Instruments introduces a new hedge accounting model to simplify hedge accounting requirements
and more closely align hedge accounting with risk management activities. It aims to improve and simplify the approach for classification and measurement of financial assets compared with the requirements of AASB 139 Financial Instruments: Recognition and Measurement. It also includes a logical model for classification and measurement, a single, forward-looking ‘expected loss’ impairment model and a substantially-reformed approach to hedge accounting. The basis of classification depends on the entity’s business model and the contractual cash flow characteristics of the financial asset. The standard is not applicable until 1 January 2018 but is available for early adoption. The Group will apply AASB 9 from 1 July 2014. As a result of the early adoption of this accounting standard, the financial results going forward are expected to reflect reduced accounting ineffectiveness and deferral of time value of options until maturity for qualifying hedges.
annual financial report 2014 65
4. Critical accounting estimates and judgementsEstimates and judgements are continually evaluated and are based on historical experience and other factors, including expectations of future events that are believed to be reasonable under the circumstances.
The Group makes estimates and assumptions concerning the future. The resulting accounting estimates will, by definition, seldom equal the related actual results. The estimates and assumptions that have a significant risk of causing a material adjustment to the carrying amount of assets and liabilities within the next financial year are discussed below.
(a) Impairment of assetsThe Group tests annually whether goodwill and intangible assets with indefinite useful lives have suffered any impairment and whether impairment of any non-current assets has occurred in accordance with the accounting policy stated in note 3(p). The recoverable amounts of CGUs have been determined based on value-in-use calculations. Refer to note 23(b) for details of these assumptions. Impairment of financial assets is assessed in accordance with the accounting policy stated in note 3(p)(i).
(b) Maintenance provisionsRefer to note 3(b)(i) for the basis for determining maintenance provisions relating to operating lease agreements. Assumptions for the provision for maintenance include expected use of the aircraft during the lease term, forecast maintenance obligation dates and forecast contractual maintenance rates. CPI was applied to certain current labour and market costs and the provisions are discounted as specified in note 3(s). The nominal discount rate applied was 9.0% (2013: 8.5%).
(c) Financial instrumentsAs detailed in note 3(k), the Group enters into financial arrangements to manage exposures to foreign currency, interest rate risk, fuel price risk and specific asset purchases denominated in foreign currencies. Financial instruments are recognised as financial assets and financial liabilities of the Group. The fair value of these financial assets and financial liabilities must be estimated for recognition and measurement disclosure purposes. These calculations require valuation techniques using various methods and assumptions, refer to note 3(w). For further details regarding financial instruments, refer to note 36.
(d) Residual values and estimated useful livesDetermining the depreciable amount of aircraft requires the use of assumptions regarding the residual value of the aircraft at the estimated time of disposal. Residual value is estimated based on market estimates of future aircraft values and current expectations of the aircraft operations. Assessments are made of the maintenance profile of owned aircraft and the timing of when specific maintenance events are considered likely to occur. This impacts the residual value assessment. As the market for aircraft is based on US dollars, residual value estimates are also affected by movements in the US dollar against the Australian dollar.
(e) Deferred points revenueAs described in note 3(u), the Group defers revenue relating to participation by members in the Velocity Frequent Flyer program. This revenue is deferred and recognised in profit or loss when reward points are redeemed. The amount of revenue deferred is calculated using assumptions regarding the fair value of reward points. The fair value of the reward points is reduced to reflect points that are expected to lapse under the rules of the Velocity Frequent Flyer program. Assumptions are based on historical trends experienced within the program.
(f) Credit vouchersThe key assumption in measuring the liability for credit vouchers is the expected redemption rate by guests. Expected redemption rates are reviewed at each reporting date. Any reassessment of the expected redemption rates in a particular period will affect the revenue recognised from expiry of credit vouchers.
(g) Unearned passenger revenueThe historical trends of passenger non-attendance rates is a key assumption in the measurement of unearned passenger revenue. Expected non-attendance rates are reviewed at each reporting date. Any reassessment of the expected rate of non-attendance in a particular period will affect the airline passenger revenue recognised.
(h) Long service leave Management judgement is applied in determining the following key assumptions used in the calculation of the liability for long service leave at the reporting date:• Future increases in salaries and wages;• Future on-cost rates; • Experience of employee departures and period of service; and• Discount rates.

Virgin Australia66
Notes to the consolidated financial statements (continued)For the year ended 30 June 2014
4. Critical accounting estimates and judgements (continued)(i) Income taxIn determining the amount of current and deferred tax the Group takes into account the impact of uncertain tax positions and whether additional taxes and interest may be due. The Group believes that its accruals for tax liabilities are adequate for all open tax years based on its assessment of many factors, including interpretations of tax law and prior experience. This assessment relies on estimates and assumptions and may involve a series of judgements about future events. New information may become available that causes the Group to change its judgement regarding the adequacy of existing tax liabilities; such changes to tax liabilities will impact tax expense in the period that such a determination is made.
(j) Deferred tax assetsDeferred tax assets are recognised to the extent that it is probable that taxable profit will be available against which the deductible temporary differences and the carry-forward of unused tax losses can be utilised. At 30 June 2014, the Group had approximately $1,322.0 million (2013: $860.0 million) of carry-forward tax losses that would be available to offset against future taxable profit. A deferred tax asset of $396.6 million (2013: $258.0 million) has been recognised in respect of these losses. It is expected that sufficient profits will be generated in the future to utilise these carried forward tax losses. Evidence supporting projections of future taxable income are in the form of detailed financial modelling based on Group operating initiatives, recent industry trends and long term industry analysis. This evidence is reviewed by senior management and the Board and if the evidence presented is not considered convincing, then the deferred tax assets associated with these tax losses are not recognised.
(k) Share-based paymentsThe assumptions and models used for estimating fair values of share-based payment transactions are disclosed in note 3(r)(v). In determining the fair values of the options and performance rights granted the impact of any service and non-market vesting conditions (for example, profitability and sales growth targets) are excluded.
(l) Basis of control of Virgin Australia International Holdings Pty LtdRefer to note 37, footnote 8.
(m) Joint arrangementsRefer to note 8 for basis of classification of the Group’s interest in Tiger as a joint venture.
(n) Share of net losses of equity accounted investeesIn determining the Group’s share of the equity accounted investment in Tiger and Virgin Samoa Limited (Virgin Samoa), the Group has not recognised tax benefits relating to its share of net losses for the year ended 30 June 2014. In accordance with accounting standards, at each subsequent reporting period, the Group will consider the impact of any unrecognised previous deferred tax assets of Tiger and Virgin Samoa and will recognise such amounts to the extent that it becomes probable that future taxable profits will allow the deferred tax asset to be recovered.
5. Change in accounting estimatesThe significant changes in estimates recognised in the current and previous financial years are:
(a) Estimation of unearned revenue redemption ratesThere is a continuous assessment of future obligations in relation to credit vouchers. As a consequence of reviewing historical issued and expired credit vouchers, there has been a reassessment of credit voucher redemption rates resulting in a decrease in revenue of $8.1 million (2013: increase of $8.0 million). The continuous assessment of unearned passenger revenue obligations and historical trends of non-attendance rates has resulted in an increase in revenue of $3.5 million (2013: $11.1 million). The annual review of the unused points liability in regards to the Velocity Frequent Flyer program was conducted during the year ended 30 June 2014, resulting in an increase in program revenue of $3.3 million (2013: $14.6 million).
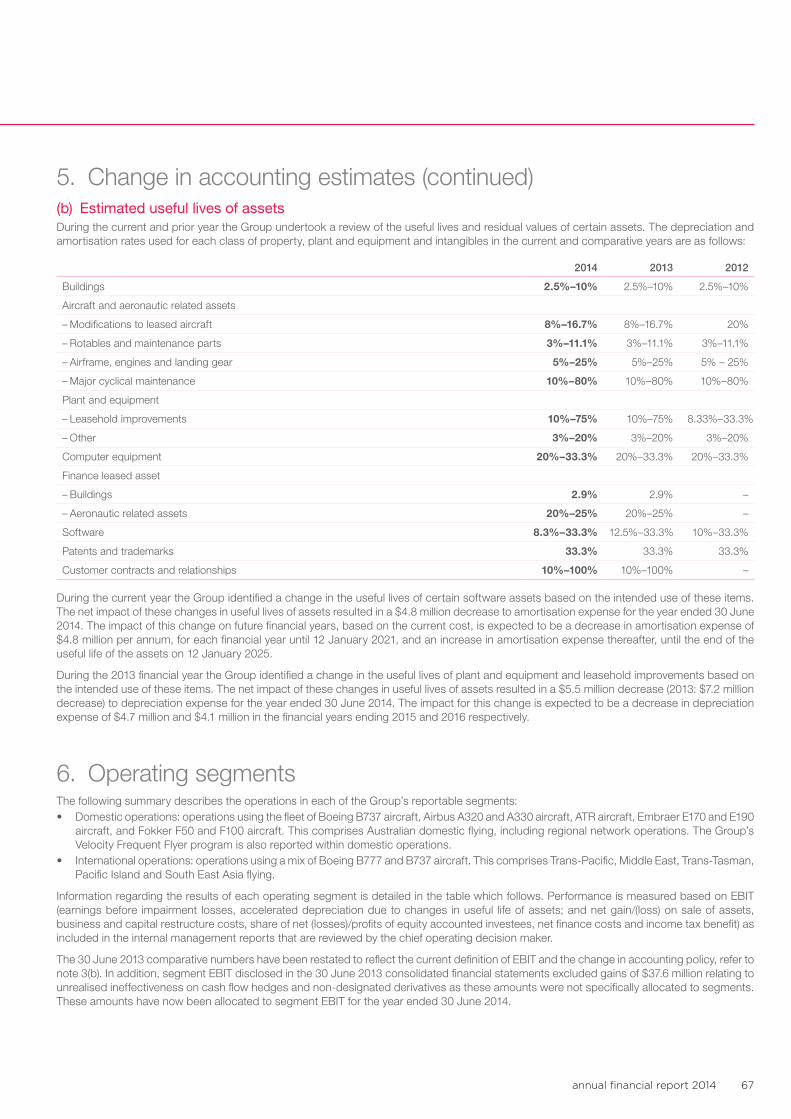
annual financial report 2014 67
5. Change in accounting estimates (continued)(b) Estimated useful lives of assetsDuring the current and prior year the Group undertook a review of the useful lives and residual values of certain assets. The depreciation and amortisation rates used for each class of property, plant and equipment and intangibles in the current and comparative years are as follows:
2014 2013 2012
Buildings 2.5%–10% 2.5%–10% 2.5%–10%
Aircraft and aeronautic related assets
– Modifications to leased aircraft 8%–16.7% 8%–16.7% 20%
– Rotables and maintenance parts 3%–11.1% 3%–11.1% 3%–11.1%
– Airframe, engines and landing gear 5%–25% 5%–25% 5% – 25%
– Major cyclical maintenance 10%–80% 10%–80% 10%–80%
Plant and equipment
– Leasehold improvements 10%–75% 10%–75% 8.33%–33.3%
– Other 3%–20% 3%–20% 3%–20%
Computer equipment 20%–33.3% 20%–33.3% 20%–33.3%
Finance leased asset
– Buildings 2.9% 2.9% –
– Aeronautic related assets 20%–25% 20%–25% –
Software 8.3%–33.3% 12.5%–33.3% 10%–33.3%
Patents and trademarks 33.3% 33.3% 33.3%
Customer contracts and relationships 10%–100% 10%–100% –
During the current year the Group identified a change in the useful lives of certain software assets based on the intended use of these items. The net impact of these changes in useful lives of assets resulted in a $4.8 million decrease to amortisation expense for the year ended 30 June 2014. The impact of this change on future financial years, based on the current cost, is expected to be a decrease in amortisation expense of $4.8 million per annum, for each financial year until 12 January 2021, and an increase in amortisation expense thereafter, until the end of the useful life of the assets on 12 January 2025.
During the 2013 financial year the Group identified a change in the useful lives of plant and equipment and leasehold improvements based on the intended use of these items. The net impact of these changes in useful lives of assets resulted in a $5.5 million decrease (2013: $7.2 million decrease) to depreciation expense for the year ended 30 June 2014. The impact for this change is expected to be a decrease in depreciation expense of $4.7 million and $4.1 million in the financial years ending 2015 and 2016 respectively.
6. Operating segmentsThe following summary describes the operations in each of the Group’s reportable segments: • Domestic operations: operations using the fleet of Boeing B737 aircraft, Airbus A320 and A330 aircraft, ATR aircraft, Embraer E170 and E190
aircraft, and Fokker F50 and F100 aircraft. This comprises Australian domestic flying, including regional network operations. The Group’s Velocity Frequent Flyer program is also reported within domestic operations.
• International operations: operations using a mix of Boeing B777 and B737 aircraft. This comprises Trans-Pacific, Middle East, Trans-Tasman, Pacific Island and South East Asia flying.
Information regarding the results of each operating segment is detailed in the table which follows. Performance is measured based on EBIT (earnings before impairment losses, accelerated depreciation due to changes in useful life of assets; and net gain/(loss) on sale of assets, business and capital restructure costs, share of net (losses)/profits of equity accounted investees, net finance costs and income tax benefit) as included in the internal management reports that are reviewed by the chief operating decision maker.
The 30 June 2013 comparative numbers have been restated to reflect the current definition of EBIT and the change in accounting policy, refer to note 3(b). In addition, segment EBIT disclosed in the 30 June 2013 consolidated financial statements excluded gains of $37.6 million relating to unrealised ineffectiveness on cash flow hedges and non-designated derivatives as these amounts were not specifically allocated to segments. These amounts have now been allocated to segment EBIT for the year ended 30 June 2014.
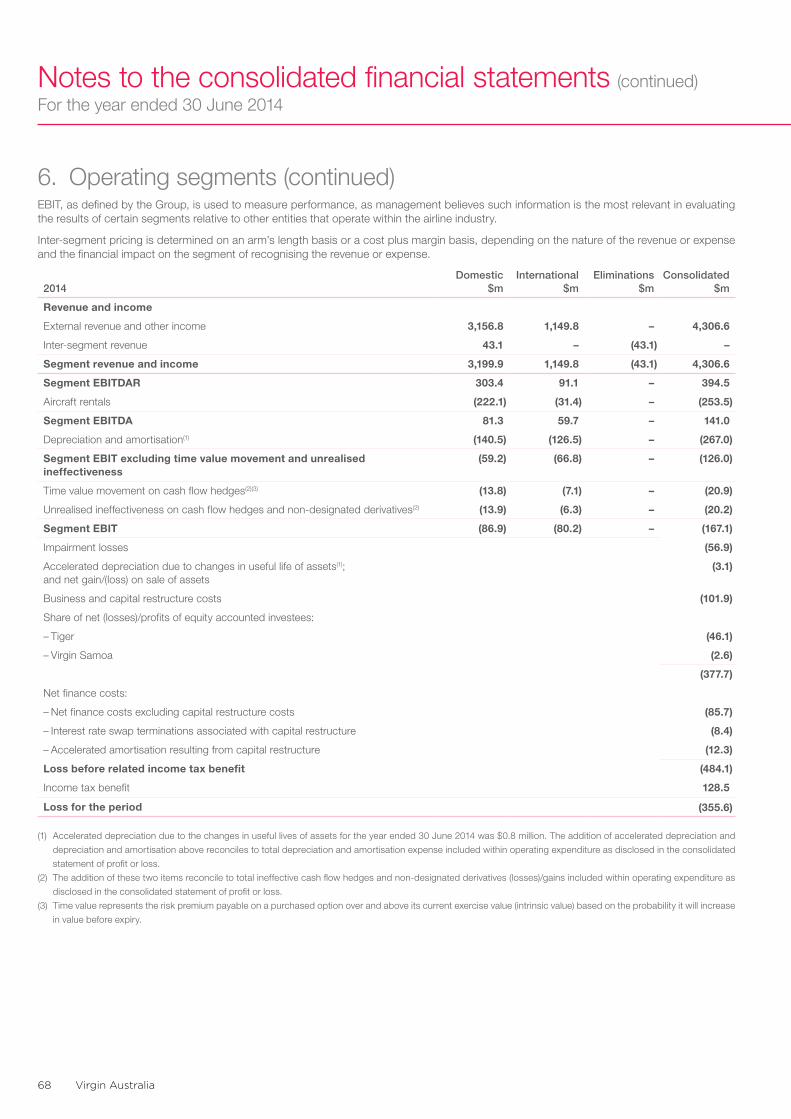
Virgin Australia68
Notes to the consolidated financial statements (continued)For the year ended 30 June 2014
6. Operating segments (continued)EBIT, as defined by the Group, is used to measure performance, as management believes such information is the most relevant in evaluating the results of certain segments relative to other entities that operate within the airline industry.
Inter-segment pricing is determined on an arm’s length basis or a cost plus margin basis, depending on the nature of the revenue or expense and the financial impact on the segment of recognising the revenue or expense.
2014Domestic
$mInternational
$mEliminations
$mConsolidated
$m
Revenue and income
External revenue and other income 3,156.8 1,149.8 – 4,306.6
Inter-segment revenue 43.1 – (43.1) –
Segment revenue and income 3,199.9 1,149.8 (43.1) 4,306.6
Segment EBITDAR 303.4 91.1 – 394.5
Aircraft rentals (222.1) (31.4) – (253.5)
Segment EBITDA 81.3 59.7 – 141.0
Depreciation and amortisation(1) (140.5) (126.5) – (267.0)
Segment EBIT excluding time value movement and unrealised ineffectiveness
(59.2) (66.8) – (126.0)
Time value movement on cash flow hedges(2)(3) (13.8) (7.1) – (20.9)
Unrealised ineffectiveness on cash flow hedges and non-designated derivatives(2) (13.9) (6.3) – (20.2)
Segment EBIT (86.9) (80.2) – (167.1)
Impairment losses (56.9)
Accelerated depreciation due to changes in useful life of assets(1); and net gain/(loss) on sale of assets
(3.1)
Business and capital restructure costs (101.9)
Share of net (losses)/profits of equity accounted investees:
– Tiger (46.1)
– Virgin Samoa (2.6)
(377.7)
Net finance costs:
– Net finance costs excluding capital restructure costs (85.7)
– Interest rate swap terminations associated with capital restructure (8.4)
– Accelerated amortisation resulting from capital restructure (12.3)
Loss before related income tax benefit (484.1)
Income tax benefit 128.5
Loss for the period (355.6)
(1) Accelerated depreciation due to the changes in useful lives of assets for the year ended 30 June 2014 was $0.8 million. The addition of accelerated depreciation and
depreciation and amortisation above reconciles to total depreciation and amortisation expense included within operating expenditure as disclosed in the consolidated
statement of profit or loss.
(2) The addition of these two items reconcile to total ineffective cash flow hedges and non-designated derivatives (losses)/gains included within operating expenditure as
disclosed in the consolidated statement of profit or loss.
(3) Time value represents the risk premium payable on a purchased option over and above its current exercise value (intrinsic value) based on the probability it will increase
in value before expiry.
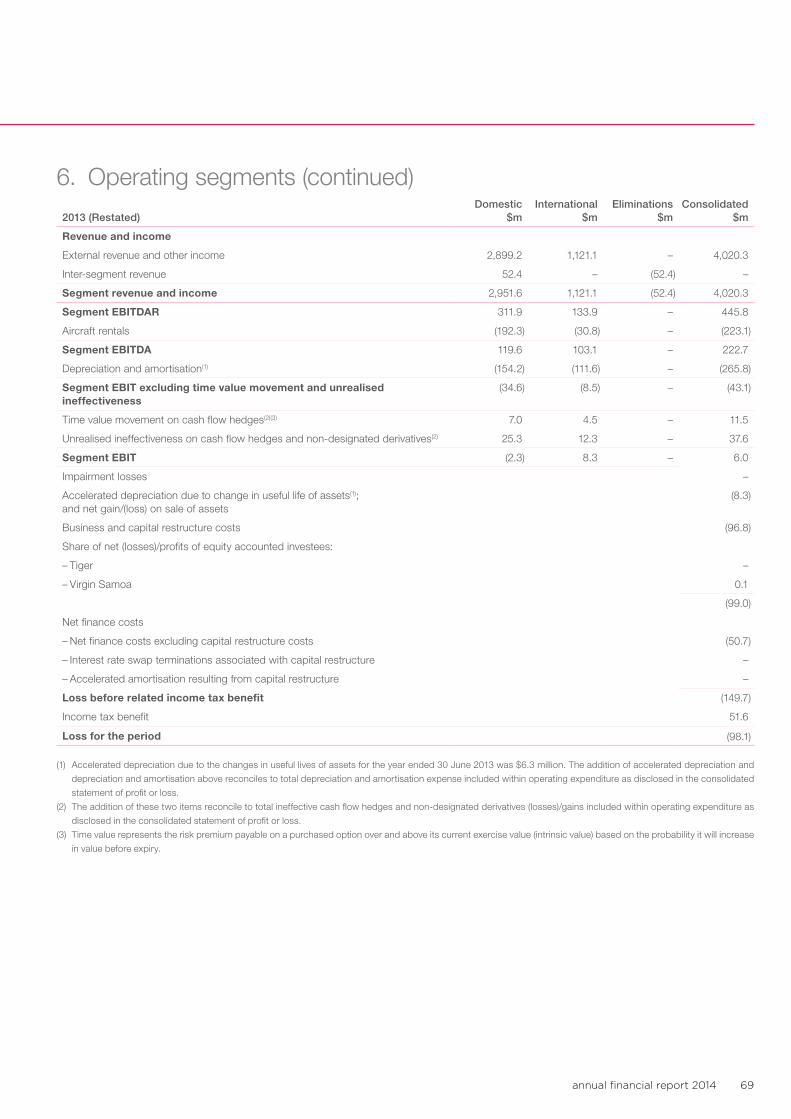
annual financial report 2014 69
6. Operating segments (continued)
2013 (Restated)Domestic
$mInternational
$mEliminations
$mConsolidated
$m
Revenue and income
External revenue and other income 2,899.2 1,121.1 – 4,020.3
Inter-segment revenue 52.4 – (52.4) –
Segment revenue and income 2,951.6 1,121.1 (52.4) 4,020.3
Segment EBITDAR 311.9 133.9 – 445.8
Aircraft rentals (192.3) (30.8) – (223.1)
Segment EBITDA 119.6 103.1 – 222.7
Depreciation and amortisation(1) (154.2) (111.6) – (265.8)
Segment EBIT excluding time value movement and unrealised ineffectiveness
(34.6) (8.5) – (43.1)
Time value movement on cash flow hedges(2)(3) 7.0 4.5 – 11.5
Unrealised ineffectiveness on cash flow hedges and non-designated derivatives(2) 25.3 12.3 – 37.6
Segment EBIT (2.3) 8.3 – 6.0
Impairment losses –
Accelerated depreciation due to change in useful life of assets(1); and net gain/(loss) on sale of assets
(8.3)
Business and capital restructure costs (96.8)
Share of net (losses)/profits of equity accounted investees:
– Tiger –
– Virgin Samoa 0.1
(99.0)
Net finance costs
– Net finance costs excluding capital restructure costs (50.7)
– Interest rate swap terminations associated with capital restructure –
– Accelerated amortisation resulting from capital restructure –
Loss before related income tax benefit (149.7)
Income tax benefit 51.6
Loss for the period (98.1)
(1) Accelerated depreciation due to the changes in useful lives of assets for the year ended 30 June 2013 was $6.3 million. The addition of accelerated depreciation and
depreciation and amortisation above reconciles to total depreciation and amortisation expense included within operating expenditure as disclosed in the consolidated
statement of profit or loss.
(2) The addition of these two items reconcile to total ineffective cash flow hedges and non-designated derivatives (losses)/gains included within operating expenditure as
disclosed in the consolidated statement of profit or loss.
(3) Time value represents the risk premium payable on a purchased option over and above its current exercise value (intrinsic value) based on the probability it will increase
in value before expiry.
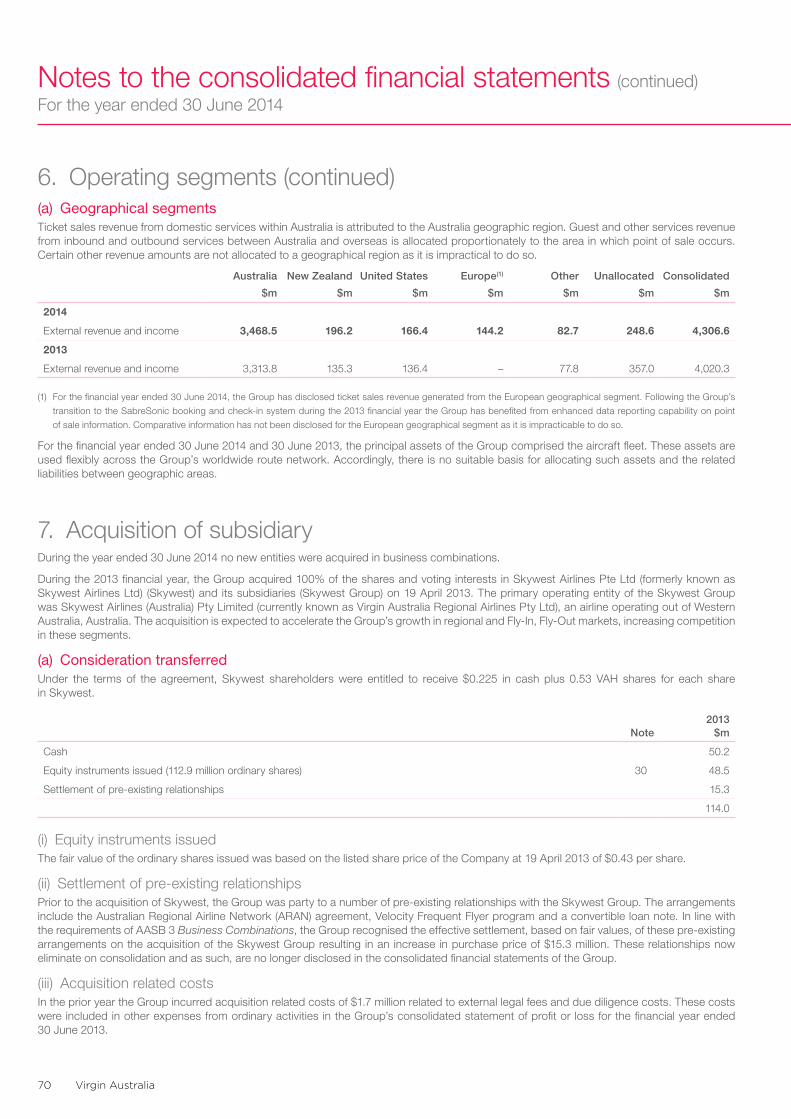
Virgin Australia70
Notes to the consolidated financial statements (continued)For the year ended 30 June 2014
6. Operating segments (continued)(a) Geographical segmentsTicket sales revenue from domestic services within Australia is attributed to the Australia geographic region. Guest and other services revenue from inbound and outbound services between Australia and overseas is allocated proportionately to the area in which point of sale occurs. Certain other revenue amounts are not allocated to a geographical region as it is impractical to do so.
Australia
$m
New Zealand
$m
United States
$m
Europe(1)
$m
Other
$m
Unallocated
$m
Consolidated
$m
2014
External revenue and income 3,468.5 196.2 166.4 144.2 82.7 248.6 4,306.6
2013
External revenue and income 3,313.8 135.3 136.4 – 77.8 357.0 4,020.3
(1) For the financial year ended 30 June 2014, the Group has disclosed ticket sales revenue generated from the European geographical segment. Following the Group’s
transition to the SabreSonic booking and check-in system during the 2013 financial year the Group has benefited from enhanced data reporting capability on point
of sale information. Comparative information has not been disclosed for the European geographical segment as it is impracticable to do so.
For the financial year ended 30 June 2014 and 30 June 2013, the principal assets of the Group comprised the aircraft fleet. These assets are used flexibly across the Group’s worldwide route network. Accordingly, there is no suitable basis for allocating such assets and the related liabilities between geographic areas.
7. Acquisition of subsidiaryDuring the year ended 30 June 2014 no new entities were acquired in business combinations.
During the 2013 financial year, the Group acquired 100% of the shares and voting interests in Skywest Airlines Pte Ltd (formerly known as Skywest Airlines Ltd) (Skywest) and its subsidiaries (Skywest Group) on 19 April 2013. The primary operating entity of the Skywest Group was Skywest Airlines (Australia) Pty Limited (currently known as Virgin Australia Regional Airlines Pty Ltd), an airline operating out of Western Australia, Australia. The acquisition is expected to accelerate the Group’s growth in regional and Fly-In, Fly-Out markets, increasing competition in these segments.
(a) Consideration transferredUnder the terms of the agreement, Skywest shareholders were entitled to receive $0.225 in cash plus 0.53 VAH shares for each share in Skywest.
Note2013
$m
Cash 50.2
Equity instruments issued (112.9 million ordinary shares) 30 48.5
Settlement of pre-existing relationships 15.3
114.0
(i) Equity instruments issuedThe fair value of the ordinary shares issued was based on the listed share price of the Company at 19 April 2013 of $0.43 per share.
(ii) Settlement of pre-existing relationshipsPrior to the acquisition of Skywest, the Group was party to a number of pre-existing relationships with the Skywest Group. The arrangements include the Australian Regional Airline Network (ARAN) agreement, Velocity Frequent Flyer program and a convertible loan note. In line with the requirements of AASB 3 Business Combinations, the Group recognised the effective settlement, based on fair values, of these pre-existing arrangements on the acquisition of the Skywest Group resulting in an increase in purchase price of $15.3 million. These relationships now eliminate on consolidation and as such, are no longer disclosed in the consolidated financial statements of the Group.
(iii) Acquisition related costsIn the prior year the Group incurred acquisition related costs of $1.7 million related to external legal fees and due diligence costs. These costs were included in other expenses from ordinary activities in the Group’s consolidated statement of profit or loss for the financial year ended 30 June 2013.
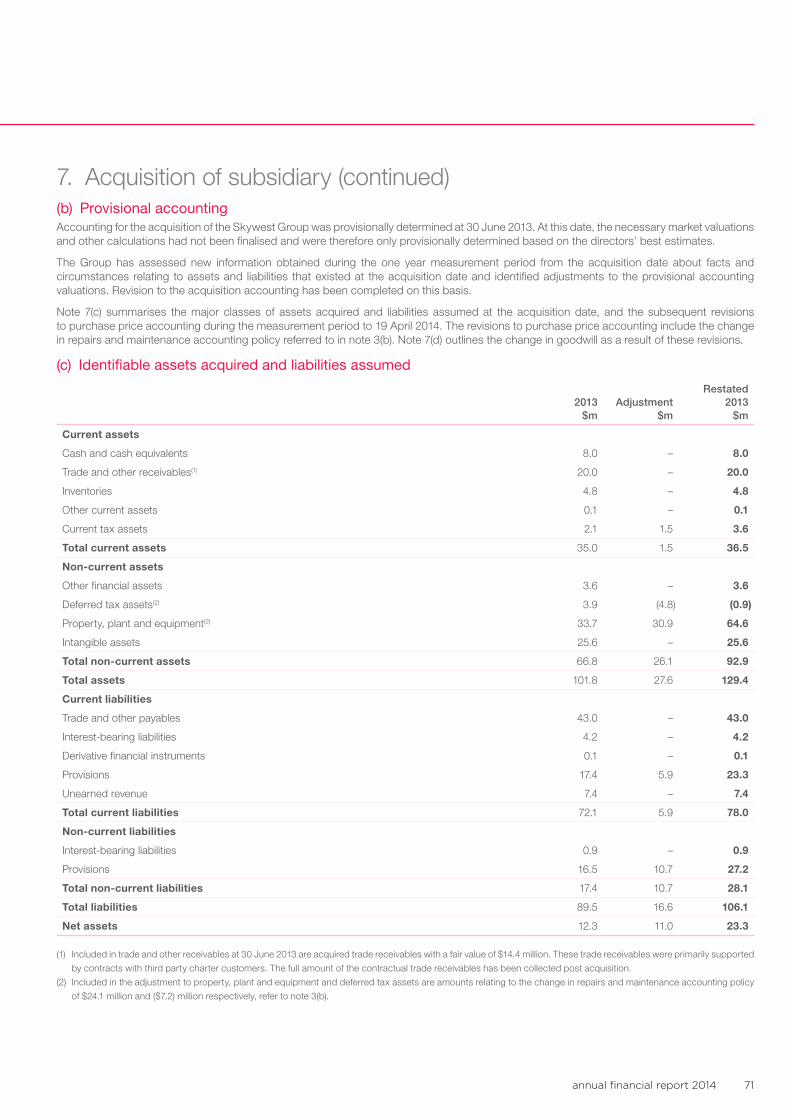
annual financial report 2014 71
7. Acquisition of subsidiary (continued)(b) Provisional accountingAccounting for the acquisition of the Skywest Group was provisionally determined at 30 June 2013. At this date, the necessary market valuations and other calculations had not been finalised and were therefore only provisionally determined based on the directors’ best estimates.
The Group has assessed new information obtained during the one year measurement period from the acquisition date about facts and circumstances relating to assets and liabilities that existed at the acquisition date and identified adjustments to the provisional accounting valuations. Revision to the acquisition accounting has been completed on this basis.
Note 7(c) summarises the major classes of assets acquired and liabilities assumed at the acquisition date, and the subsequent revisions to purchase price accounting during the measurement period to 19 April 2014. The revisions to purchase price accounting include the change in repairs and maintenance accounting policy referred to in note 3(b). Note 7(d) outlines the change in goodwill as a result of these revisions.
(c) Identifiable assets acquired and liabilities assumed
2013 $m
Adjustment $m
Restated 2013
$m
Current assets
Cash and cash equivalents 8.0 – 8.0
Trade and other receivables(1) 20.0 – 20.0
Inventories 4.8 – 4.8
Other current assets 0.1 – 0.1
Current tax assets 2.1 1.5 3.6
Total current assets 35.0 1.5 36.5
Non-current assets
Other financial assets 3.6 – 3.6
Deferred tax assets(2) 3.9 (4.8) (0.9)
Property, plant and equipment(2) 33.7 30.9 64.6
Intangible assets 25.6 – 25.6
Total non-current assets 66.8 26.1 92.9
Total assets 101.8 27.6 129.4
Current liabilities
Trade and other payables 43.0 – 43.0
Interest-bearing liabilities 4.2 – 4.2
Derivative financial instruments 0.1 – 0.1
Provisions 17.4 5.9 23.3
Unearned revenue 7.4 – 7.4
Total current liabilities 72.1 5.9 78.0
Non-current liabilities
Interest-bearing liabilities 0.9 – 0.9
Provisions 16.5 10.7 27.2
Total non-current liabilities 17.4 10.7 28.1
Total liabilities 89.5 16.6 106.1
Net assets 12.3 11.0 23.3
(1) Included in trade and other receivables at 30 June 2013 are acquired trade receivables with a fair value of $14.4 million. These trade receivables were primarily supported
by contracts with third party charter customers. The full amount of the contractual trade receivables has been collected post acquisition.
(2) Included in the adjustment to property, plant and equipment and deferred tax assets are amounts relating to the change in repairs and maintenance accounting policy
of $24.1 million and ($7.2) million respectively, refer to note 3(b).
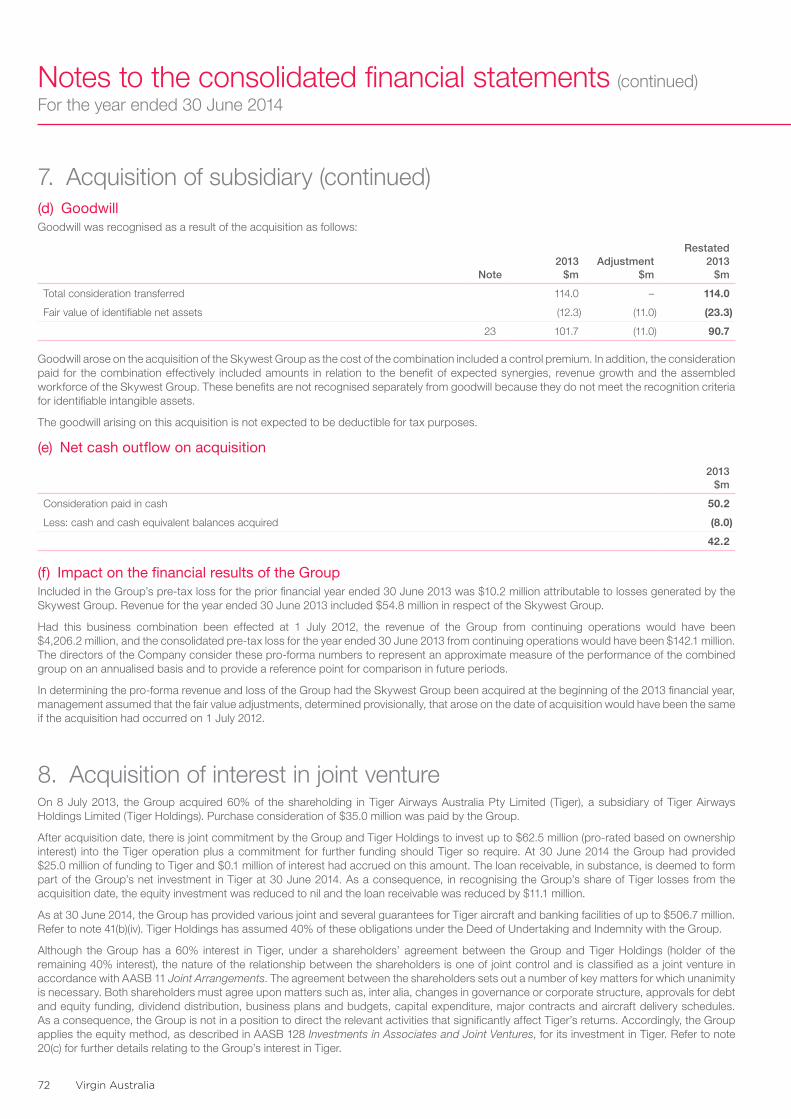
Virgin Australia72
Notes to the consolidated financial statements (continued)For the year ended 30 June 2014
7. Acquisition of subsidiary (continued) (d) GoodwillGoodwill was recognised as a result of the acquisition as follows:
Note2013
$mAdjustment
$m
Restated 2013
$m
Total consideration transferred 114.0 – 114.0
Fair value of identifiable net assets (12.3) (11.0) (23.3)
23 101.7 (11.0) 90.7
Goodwill arose on the acquisition of the Skywest Group as the cost of the combination included a control premium. In addition, the consideration paid for the combination effectively included amounts in relation to the benefit of expected synergies, revenue growth and the assembled workforce of the Skywest Group. These benefits are not recognised separately from goodwill because they do not meet the recognition criteria for identifiable intangible assets.
The goodwill arising on this acquisition is not expected to be deductible for tax purposes.
(e) Net cash outflow on acquisition
2013 $m
Consideration paid in cash 50.2
Less: cash and cash equivalent balances acquired (8.0)
42.2
(f) Impact on the financial results of the GroupIncluded in the Group’s pre-tax loss for the prior financial year ended 30 June 2013 was $10.2 million attributable to losses generated by the Skywest Group. Revenue for the year ended 30 June 2013 included $54.8 million in respect of the Skywest Group.
Had this business combination been effected at 1 July 2012, the revenue of the Group from continuing operations would have been $4,206.2 million, and the consolidated pre-tax loss for the year ended 30 June 2013 from continuing operations would have been $142.1 million. The directors of the Company consider these pro-forma numbers to represent an approximate measure of the performance of the combined group on an annualised basis and to provide a reference point for comparison in future periods.
In determining the pro-forma revenue and loss of the Group had the Skywest Group been acquired at the beginning of the 2013 financial year, management assumed that the fair value adjustments, determined provisionally, that arose on the date of acquisition would have been the same if the acquisition had occurred on 1 July 2012.
8. Acquisition of interest in joint ventureOn 8 July 2013, the Group acquired 60% of the shareholding in Tiger Airways Australia Pty Limited (Tiger), a subsidiary of Tiger Airways Holdings Limited (Tiger Holdings). Purchase consideration of $35.0 million was paid by the Group.
After acquisition date, there is joint commitment by the Group and Tiger Holdings to invest up to $62.5 million (pro-rated based on ownership interest) into the Tiger operation plus a commitment for further funding should Tiger so require. At 30 June 2014 the Group had provided $25.0 million of funding to Tiger and $0.1 million of interest had accrued on this amount. The loan receivable, in substance, is deemed to form part of the Group’s net investment in Tiger at 30 June 2014. As a consequence, in recognising the Group’s share of Tiger losses from the acquisition date, the equity investment was reduced to nil and the loan receivable was reduced by $11.1 million.
As at 30 June 2014, the Group has provided various joint and several guarantees for Tiger aircraft and banking facilities of up to $506.7 million. Refer to note 41(b)(iv). Tiger Holdings has assumed 40% of these obligations under the Deed of Undertaking and Indemnity with the Group.
Although the Group has a 60% interest in Tiger, under a shareholders’ agreement between the Group and Tiger Holdings (holder of the remaining 40% interest), the nature of the relationship between the shareholders is one of joint control and is classified as a joint venture in accordance with AASB 11 Joint Arrangements. The agreement between the shareholders sets out a number of key matters for which unanimity is necessary. Both shareholders must agree upon matters such as, inter alia, changes in governance or corporate structure, approvals for debt and equity funding, dividend distribution, business plans and budgets, capital expenditure, major contracts and aircraft delivery schedules. As a consequence, the Group is not in a position to direct the relevant activities that significantly affect Tiger’s returns. Accordingly, the Group applies the equity method, as described in AASB 128 Investments in Associates and Joint Ventures, for its investment in Tiger. Refer to note 20(c) for further details relating to the Group’s interest in Tiger.
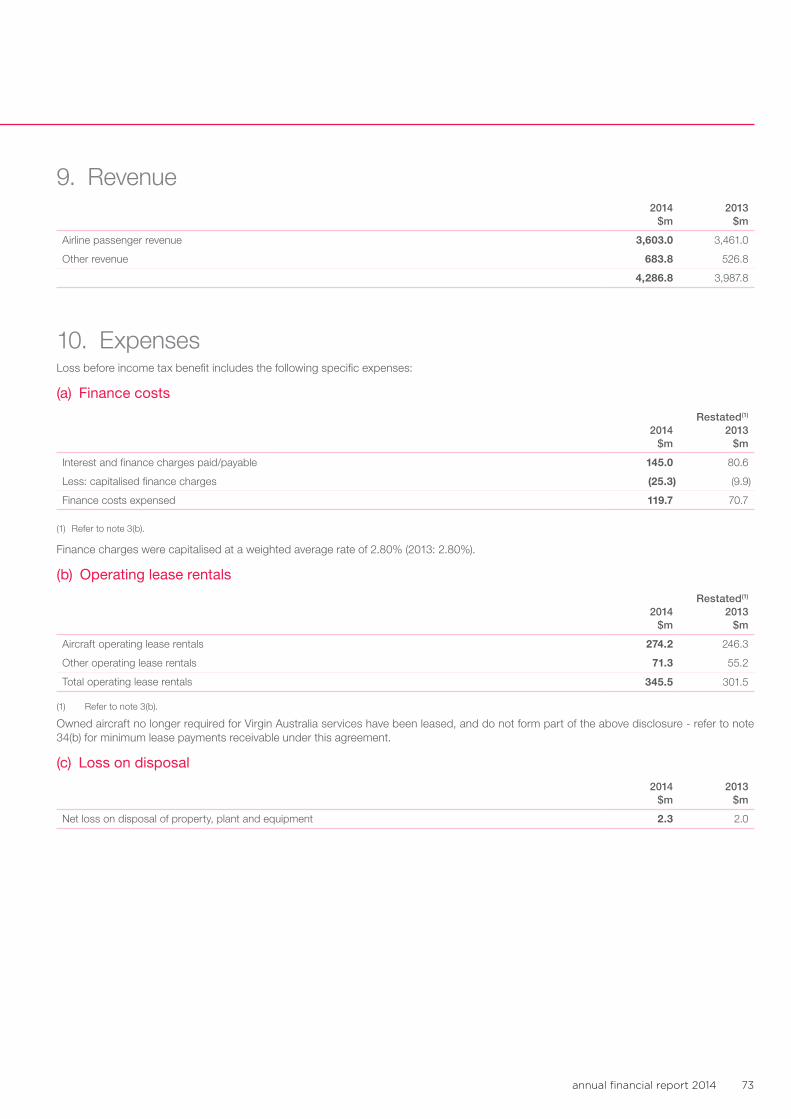
annual financial report 2014 73
9. Revenue2014
$m2013
$m
Airline passenger revenue 3,603.0 3,461.0
Other revenue 683.8 526.8
4,286.8 3,987.8
10. ExpensesLoss before income tax benefit includes the following specific expenses:
(a) Finance costs
2014 $m
Restated(1) 2013
$m
Interest and finance charges paid/payable 145.0 80.6
Less: capitalised finance charges (25.3) (9.9)
Finance costs expensed 119.7 70.7
(1) Refer to note 3(b).
Finance charges were capitalised at a weighted average rate of 2.80% (2013: 2.80%).
(b) Operating lease rentals
2014 $m
Restated(1) 2013
$m
Aircraft operating lease rentals 274.2 246.3
Other operating lease rentals 71.3 55.2
Total operating lease rentals 345.5 301.5
(1) Refer to note 3(b).
Owned aircraft no longer required for Virgin Australia services have been leased, and do not form part of the above disclosure - refer to note 34(b) for minimum lease payments receivable under this agreement.
(c) Loss on disposal
2014 $m
2013 $m
Net loss on disposal of property, plant and equipment 2.3 2.0
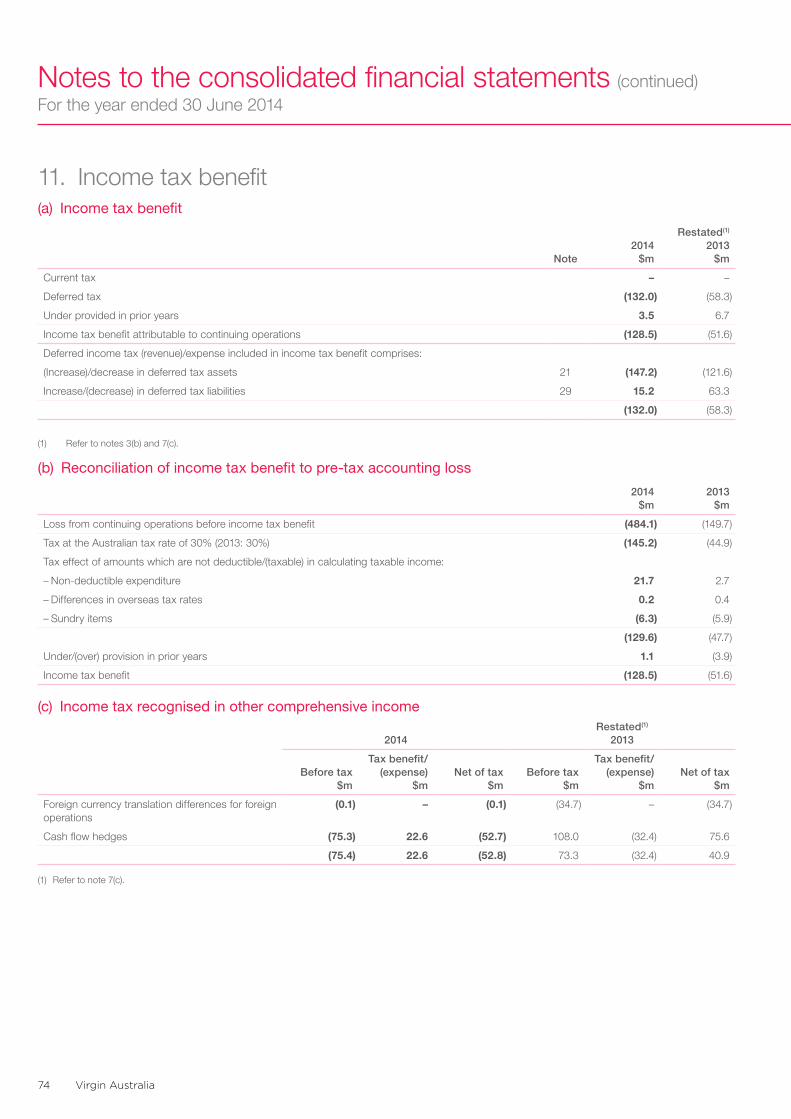
Virgin Australia74
Notes to the consolidated financial statements (continued)For the year ended 30 June 2014
11. Income tax benefit(a) Income tax benefit
Note2014
$m
Restated(1) 2013
$m
Current tax – –
Deferred tax (132.0) (58.3)
Under provided in prior years 3.5 6.7
Income tax benefit attributable to continuing operations (128.5) (51.6)
Deferred income tax (revenue)/expense included in income tax benefit comprises:
(Increase)/decrease in deferred tax assets 21 (147.2) (121.6)
Increase/(decrease) in deferred tax liabilities 29 15.2 63.3
(132.0) (58.3)
(1) Refer to notes 3(b) and 7(c).
(b) Reconciliation of income tax benefit to pre-tax accounting loss
2014 $m
2013 $m
Loss from continuing operations before income tax benefit (484.1) (149.7)
Tax at the Australian tax rate of 30% (2013: 30%) (145.2) (44.9)
Tax effect of amounts which are not deductible/(taxable) in calculating taxable income:
– Non-deductible expenditure 21.7 2.7
– Differences in overseas tax rates 0.2 0.4
– Sundry items (6.3) (5.9)
(129.6) (47.7)
Under/(over) provision in prior years 1.1 (3.9)
Income tax benefit (128.5) (51.6)
(c) Income tax recognised in other comprehensive income
2014Restated(1)
2013
Before tax $m
Tax benefit/ (expense)
$mNet of tax
$mBefore tax
$m
Tax benefit/ (expense)
$mNet of tax
$m
Foreign currency translation differences for foreign operations
(0.1) – (0.1) (34.7) – (34.7)
Cash flow hedges (75.3) 22.6 (52.7) 108.0 (32.4) 75.6
(75.4) 22.6 (52.8) 73.3 (32.4) 40.9
(1) Refer to note 7(c).
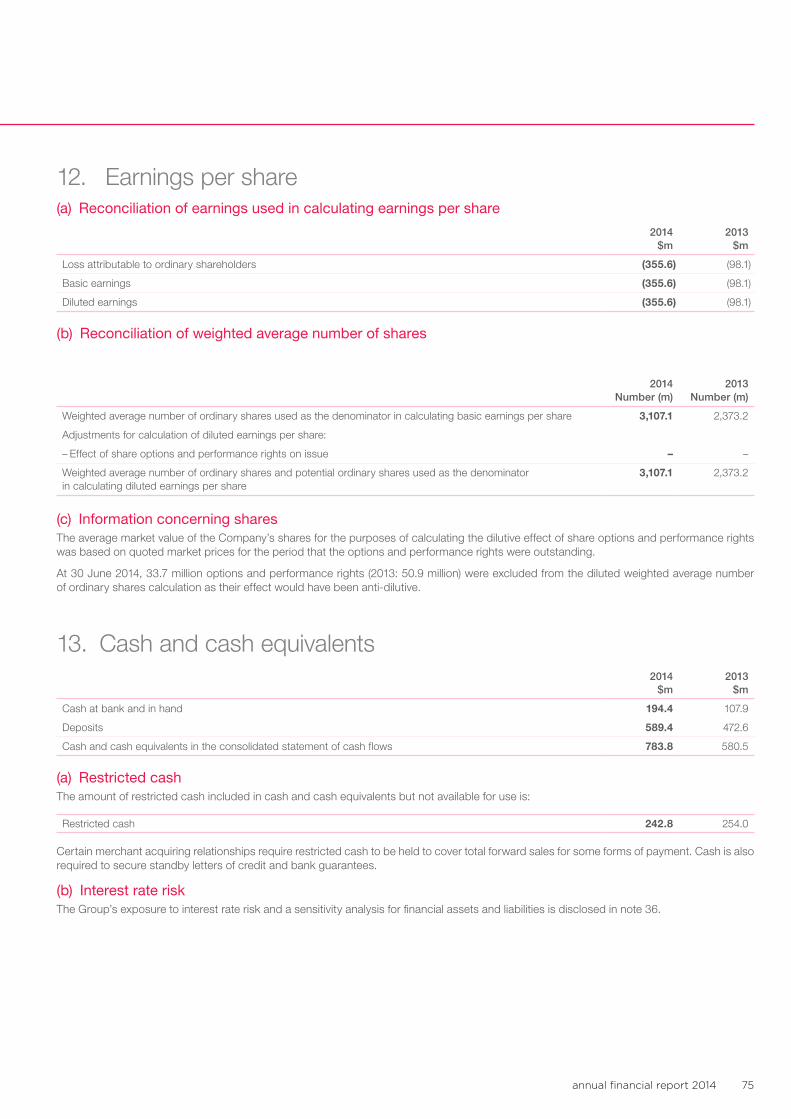
annual financial report 2014 75
12. Earnings per share(a) Reconciliation of earnings used in calculating earnings per share
2014 $m
2013 $m
Loss attributable to ordinary shareholders (355.6) (98.1)
Basic earnings (355.6) (98.1)
Diluted earnings (355.6) (98.1)
(b) Reconciliation of weighted average number of shares
2014 Number (m)
2013 Number (m)
Weighted average number of ordinary shares used as the denominator in calculating basic earnings per share 3,107.1 2,373.2
Adjustments for calculation of diluted earnings per share:
– Effect of share options and performance rights on issue – –
Weighted average number of ordinary shares and potential ordinary shares used as the denominator in calculating diluted earnings per share
3,107.1 2,373.2
(c) Information concerning sharesThe average market value of the Company’s shares for the purposes of calculating the dilutive effect of share options and performance rights was based on quoted market prices for the period that the options and performance rights were outstanding.
At 30 June 2014, 33.7 million options and performance rights (2013: 50.9 million) were excluded from the diluted weighted average number of ordinary shares calculation as their effect would have been anti-dilutive.
13. Cash and cash equivalents2014
$m2013
$m
Cash at bank and in hand 194.4 107.9
Deposits 589.4 472.6
Cash and cash equivalents in the consolidated statement of cash flows 783.8 580.5
(a) Restricted cashThe amount of restricted cash included in cash and cash equivalents but not available for use is:
Restricted cash 242.8 254.0
Certain merchant acquiring relationships require restricted cash to be held to cover total forward sales for some forms of payment. Cash is also required to secure standby letters of credit and bank guarantees.
(b) Interest rate riskThe Group’s exposure to interest rate risk and a sensitivity analysis for financial assets and liabilities is disclosed in note 36.
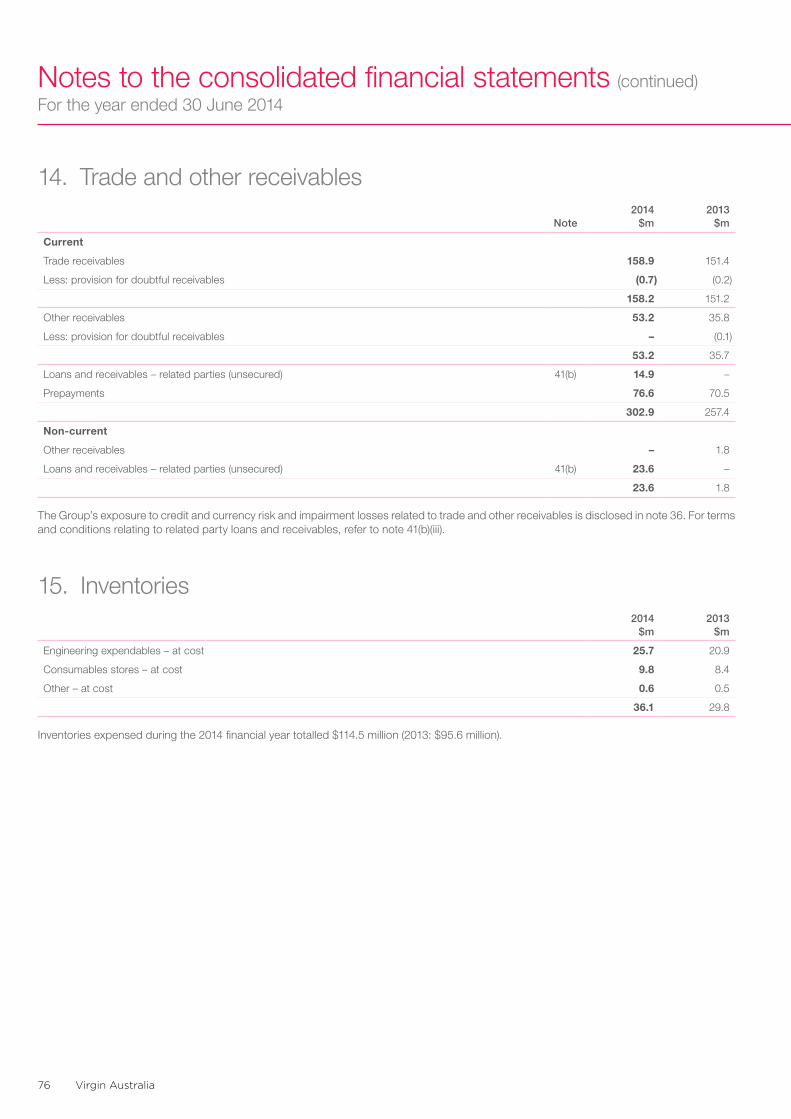
Virgin Australia76
Notes to the consolidated financial statements (continued)For the year ended 30 June 2014
14. Trade and other receivables
Note2014
$m2013
$m
Current
Trade receivables 158.9 151.4
Less: provision for doubtful receivables (0.7) (0.2)
158.2 151.2
Other receivables 53.2 35.8
Less: provision for doubtful receivables – (0.1)
53.2 35.7
Loans and receivables – related parties (unsecured) 41(b) 14.9 –
Prepayments 76.6 70.5
302.9 257.4
Non-current
Other receivables – 1.8
Loans and receivables – related parties (unsecured) 41(b) 23.6 –
23.6 1.8
The Group’s exposure to credit and currency risk and impairment losses related to trade and other receivables is disclosed in note 36. For terms and conditions relating to related party loans and receivables, refer to note 41(b)(iii).
15. Inventories2014
$m2013
$m
Engineering expendables – at cost 25.7 20.9
Consumables stores – at cost 9.8 8.4
Other – at cost 0.6 0.5
36.1 29.8
Inventories expensed during the 2014 financial year totalled $114.5 million (2013: $95.6 million).
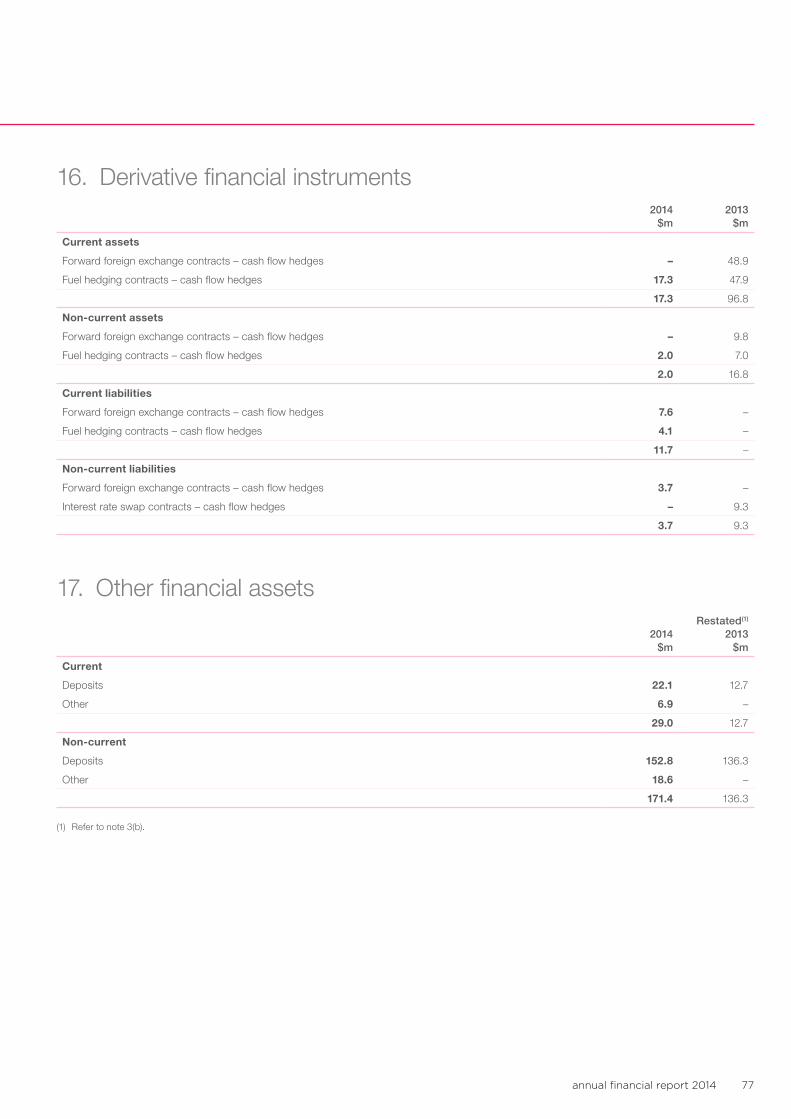
annual financial report 2014 77
16. Derivative financial instruments2014
$m2013
$m
Current assets
Forward foreign exchange contracts – cash flow hedges – 48.9
Fuel hedging contracts – cash flow hedges 17.3 47.9
17.3 96.8
Non-current assets
Forward foreign exchange contracts – cash flow hedges – 9.8
Fuel hedging contracts – cash flow hedges 2.0 7.0
2.0 16.8
Current liabilities
Forward foreign exchange contracts – cash flow hedges 7.6 –
Fuel hedging contracts – cash flow hedges 4.1 –
11.7 –
Non-current liabilities
Forward foreign exchange contracts – cash flow hedges 3.7 –
Interest rate swap contracts – cash flow hedges – 9.3
3.7 9.3
17. Other financial assets
2014 $m
Restated(1) 2013
$m
Current
Deposits 22.1 12.7
Other 6.9 –
29.0 12.7
Non-current
Deposits 152.8 136.3
Other 18.6 –
171.4 136.3
(1) Refer to note 3(b).
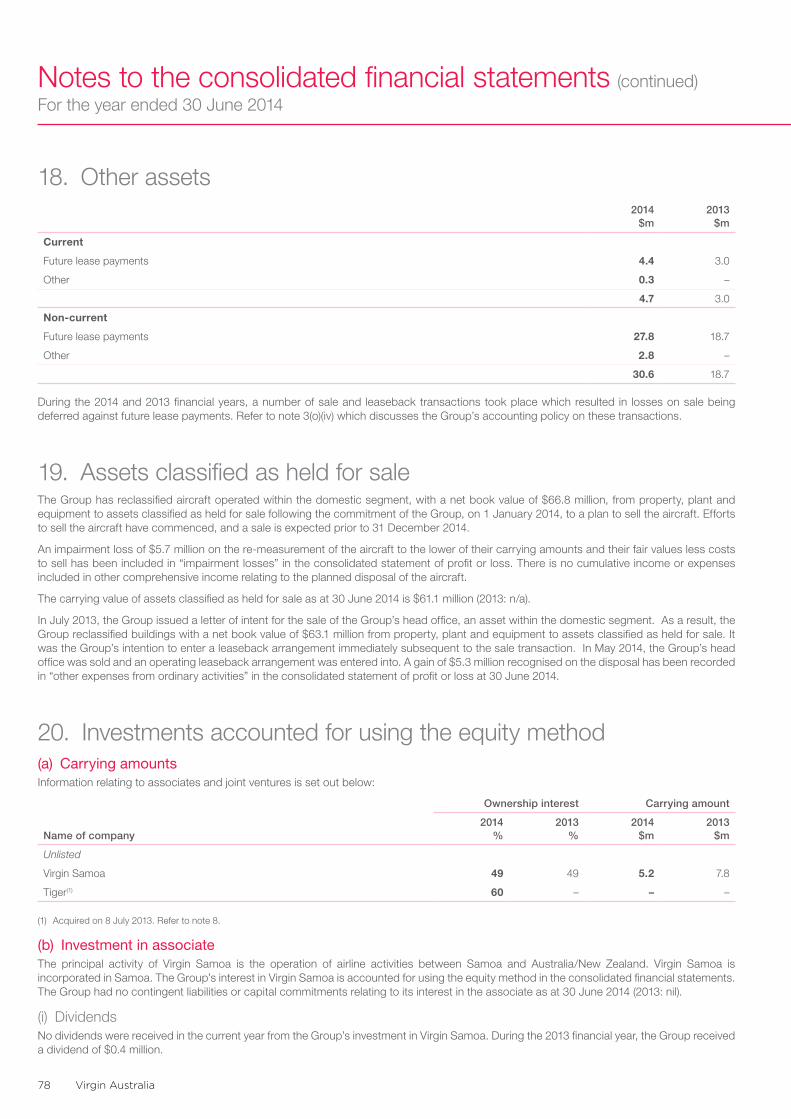
Virgin Australia78
Notes to the consolidated financial statements (continued)For the year ended 30 June 2014
18. Other assets2014
$m2013
$m
Current
Future lease payments 4.4 3.0
Other 0.3 –
4.7 3.0
Non-current
Future lease payments 27.8 18.7
Other 2.8 –
30.6 18.7
During the 2014 and 2013 financial years, a number of sale and leaseback transactions took place which resulted in losses on sale being deferred against future lease payments. Refer to note 3(o)(iv) which discusses the Group’s accounting policy on these transactions.
19. Assets classified as held for saleThe Group has reclassified aircraft operated within the domestic segment, with a net book value of $66.8 million, from property, plant and equipment to assets classified as held for sale following the commitment of the Group, on 1 January 2014, to a plan to sell the aircraft. Efforts to sell the aircraft have commenced, and a sale is expected prior to 31 December 2014.
An impairment loss of $5.7 million on the re-measurement of the aircraft to the lower of their carrying amounts and their fair values less costs to sell has been included in “impairment losses” in the consolidated statement of profit or loss. There is no cumulative income or expenses included in other comprehensive income relating to the planned disposal of the aircraft.
The carrying value of assets classified as held for sale as at 30 June 2014 is $61.1 million (2013: n/a).
In July 2013, the Group issued a letter of intent for the sale of the Group’s head office, an asset within the domestic segment. As a result, the Group reclassified buildings with a net book value of $63.1 million from property, plant and equipment to assets classified as held for sale. It was the Group’s intention to enter a leaseback arrangement immediately subsequent to the sale transaction. In May 2014, the Group’s head office was sold and an operating leaseback arrangement was entered into. A gain of $5.3 million recognised on the disposal has been recorded in “other expenses from ordinary activities” in the consolidated statement of profit or loss at 30 June 2014.
20. Investments accounted for using the equity method(a) Carrying amountsInformation relating to associates and joint ventures is set out below:
Ownership interest Carrying amount
Name of company2014
%2013
%2014
$m2013
$m
Unlisted
Virgin Samoa 49 49 5.2 7.8
Tiger(1) 60 – – –
(1) Acquired on 8 July 2013. Refer to note 8.
(b) Investment in associateThe principal activity of Virgin Samoa is the operation of airline activities between Samoa and Australia/New Zealand. Virgin Samoa is incorporated in Samoa. The Group’s interest in Virgin Samoa is accounted for using the equity method in the consolidated financial statements. The Group had no contingent liabilities or capital commitments relating to its interest in the associate as at 30 June 2014 (2013: nil).
(i) DividendsNo dividends were received in the current year from the Group’s investment in Virgin Samoa. During the 2013 financial year, the Group received a dividend of $0.4 million.
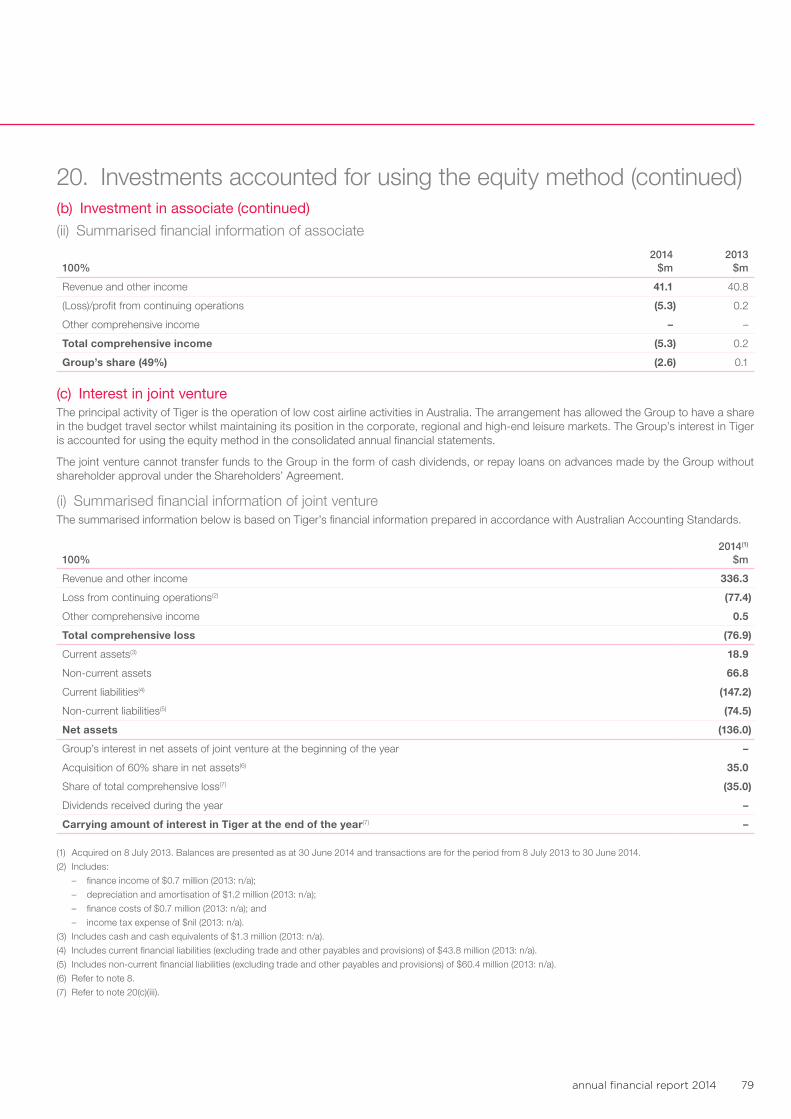
annual financial report 2014 79
20. Investments accounted for using the equity method (continued)(b) Investment in associate (continued)
(ii) Summarised financial information of associate
100%2014
$m2013
$m
Revenue and other income 41.1 40.8
(Loss)/profit from continuing operations (5.3) 0.2
Other comprehensive income – –
Total comprehensive income (5.3) 0.2
Group’s share (49%) (2.6) 0.1
(c) Interest in joint ventureThe principal activity of Tiger is the operation of low cost airline activities in Australia. The arrangement has allowed the Group to have a share in the budget travel sector whilst maintaining its position in the corporate, regional and high-end leisure markets. The Group’s interest in Tiger is accounted for using the equity method in the consolidated annual financial statements.
The joint venture cannot transfer funds to the Group in the form of cash dividends, or repay loans on advances made by the Group without shareholder approval under the Shareholders’ Agreement.
(i) Summarised financial information of joint ventureThe summarised information below is based on Tiger’s financial information prepared in accordance with Australian Accounting Standards.
100%2014(1)
$m
Revenue and other income 336.3
Loss from continuing operations(2) (77.4)
Other comprehensive income 0.5
Total comprehensive loss (76.9)
Current assets(3) 18.9
Non-current assets 66.8
Current liabilities(4) (147.2)
Non-current liabilities(5) (74.5)
Net assets (136.0)
Group’s interest in net assets of joint venture at the beginning of the year –
Acquisition of 60% share in net assets(6) 35.0
Share of total comprehensive loss(7) (35.0)
Dividends received during the year –
Carrying amount of interest in Tiger at the end of the year(7) –
(1) Acquired on 8 July 2013. Balances are presented as at 30 June 2014 and transactions are for the period from 8 July 2013 to 30 June 2014.
(2) Includes:
– finance income of $0.7 million (2013: n/a);
– depreciation and amortisation of $1.2 million (2013: n/a);
– finance costs of $0.7 million (2013: n/a); and
– income tax expense of $nil (2013: n/a).
(3) Includes cash and cash equivalents of $1.3 million (2013: n/a).
(4) Includes current financial liabilities (excluding trade and other payables and provisions) of $43.8 million (2013: n/a).
(5) Includes non-current financial liabilities (excluding trade and other payables and provisions) of $60.4 million (2013: n/a).
(6) Refer to note 8.
(7) Refer to note 20(c)(iii).
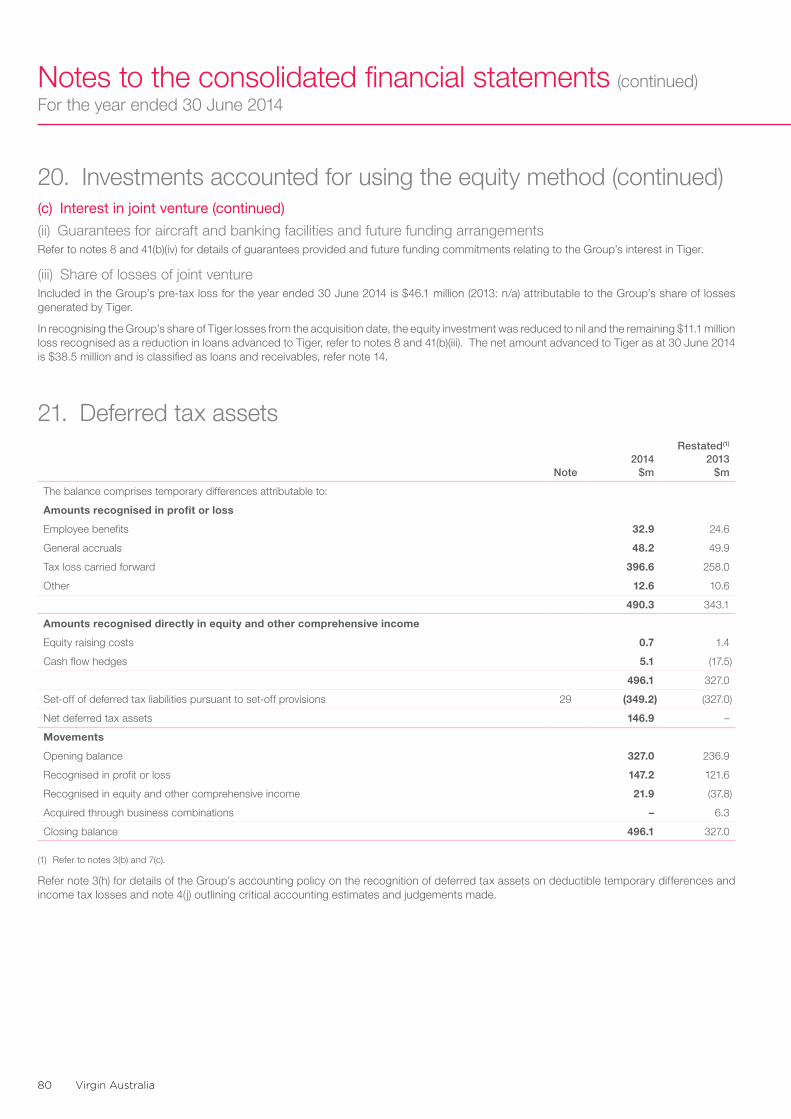
Virgin Australia80
Notes to the consolidated financial statements (continued)For the year ended 30 June 2014
20. Investments accounted for using the equity method (continued)(c) Interest in joint venture (continued)
(ii) Guarantees for aircraft and banking facilities and future funding arrangementsRefer to notes 8 and 41(b)(iv) for details of guarantees provided and future funding commitments relating to the Group’s interest in Tiger.
(iii) Share of losses of joint ventureIncluded in the Group’s pre-tax loss for the year ended 30 June 2014 is $46.1 million (2013: n/a) attributable to the Group’s share of losses generated by Tiger.
In recognising the Group’s share of Tiger losses from the acquisition date, the equity investment was reduced to nil and the remaining $11.1 million loss recognised as a reduction in loans advanced to Tiger, refer to notes 8 and 41(b)(iii). The net amount advanced to Tiger as at 30 June 2014 is $38.5 million and is classified as loans and receivables, refer note 14.
21. Deferred tax assets
Note2014
$m
Restated(1) 2013
$m
The balance comprises temporary differences attributable to:
Amounts recognised in profit or loss
Employee benefits 32.9 24.6
General accruals 48.2 49.9
Tax loss carried forward 396.6 258.0
Other 12.6 10.6
490.3 343.1
Amounts recognised directly in equity and other comprehensive income
Equity raising costs 0.7 1.4
Cash flow hedges 5.1 (17.5)
496.1 327.0
Set-off of deferred tax liabilities pursuant to set-off provisions 29 (349.2) (327.0)
Net deferred tax assets 146.9 –
Movements
Opening balance 327.0 236.9
Recognised in profit or loss 147.2 121.6
Recognised in equity and other comprehensive income 21.9 (37.8)
Acquired through business combinations – 6.3
Closing balance 496.1 327.0
(1) Refer to notes 3(b) and 7(c).
Refer note 3(h) for details of the Group’s accounting policy on the recognition of deferred tax assets on deductible temporary differences and income tax losses and note 4(j) outlining critical accounting estimates and judgements made.
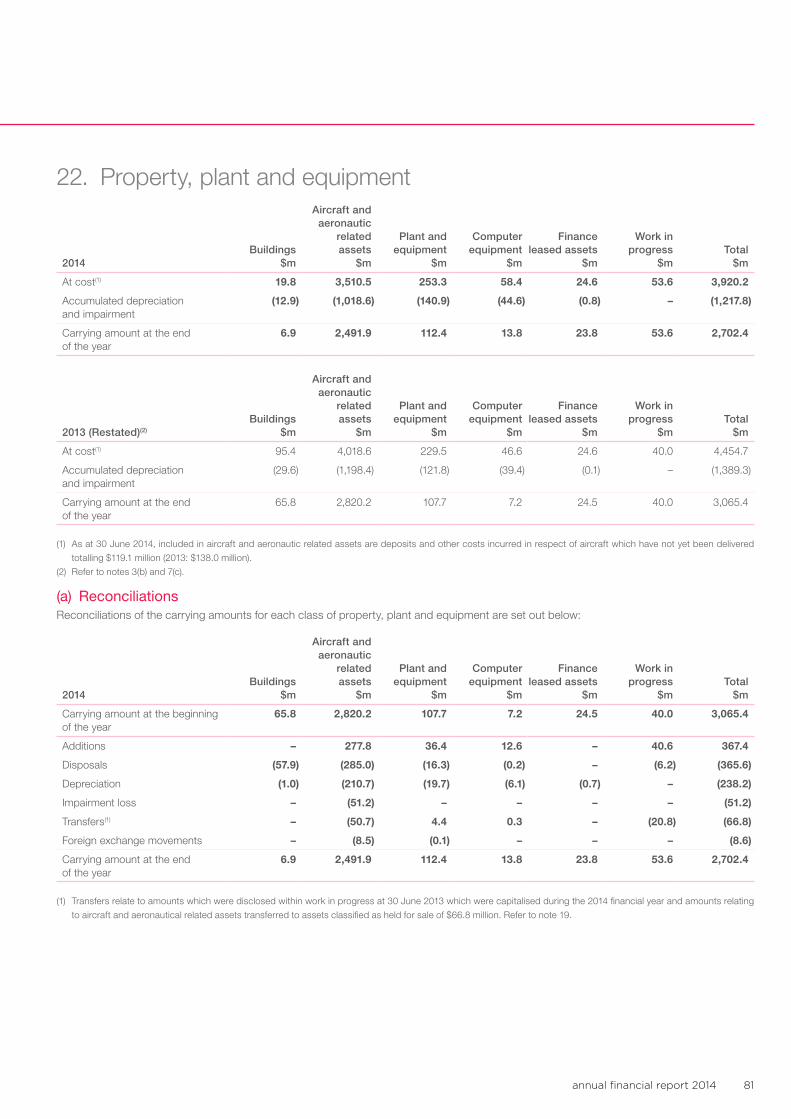
annual financial report 2014 81
22. Property, plant and equipment
2014Buildings
$m
Aircraft and aeronautic
related assets
$m
Plant and equipment
$m
Computer equipment
$m
Finance leased assets
$m
Work in progress
$mTotal
$m
At cost(1) 19.8 3,510.5 253.3 58.4 24.6 53.6 3,920.2
Accumulated depreciation and impairment
(12.9) (1,018.6) (140.9) (44.6) (0.8) – (1,217.8)
Carrying amount at the end of the year
6.9 2,491.9 112.4 13.8 23.8 53.6 2,702.4
2013 (Restated)(2)
Buildings $m
Aircraft and aeronautic
related assets
$m
Plant and equipment
$m
Computer equipment
$m
Finance leased assets
$m
Work in progress
$mTotal
$m
At cost(1) 95.4 4,018.6 229.5 46.6 24.6 40.0 4,454.7
Accumulated depreciation and impairment
(29.6) (1,198.4) (121.8) (39.4) (0.1) – (1,389.3)
Carrying amount at the end of the year
65.8 2,820.2 107.7 7.2 24.5 40.0 3,065.4
(1) As at 30 June 2014, included in aircraft and aeronautic related assets are deposits and other costs incurred in respect of aircraft which have not yet been delivered
totalling $119.1 million (2013: $138.0 million).
(2) Refer to notes 3(b) and 7(c).
(a) ReconciliationsReconciliations of the carrying amounts for each class of property, plant and equipment are set out below:
2014Buildings
$m
Aircraft and aeronautic
related assets
$m
Plant and equipment
$m
Computer equipment
$m
Finance leased assets
$m
Work in progress
$mTotal
$m
Carrying amount at the beginning of the year
65.8 2,820.2 107.7 7.2 24.5 40.0 3,065.4
Additions – 277.8 36.4 12.6 – 40.6 367.4
Disposals (57.9) (285.0) (16.3) (0.2) – (6.2) (365.6)
Depreciation (1.0) (210.7) (19.7) (6.1) (0.7) – (238.2)
Impairment loss – (51.2) – – – – (51.2)
Transfers(1) – (50.7) 4.4 0.3 – (20.8) (66.8)
Foreign exchange movements – (8.5) (0.1) – – – (8.6)
Carrying amount at the end of the year
6.9 2,491.9 112.4 13.8 23.8 53.6 2,702.4
(1) Transfers relate to amounts which were disclosed within work in progress at 30 June 2013 which were capitalised during the 2014 financial year and amounts relating
to aircraft and aeronautical related assets transferred to assets classified as held for sale of $66.8 million. Refer to note 19.

Virgin Australia82
Notes to the consolidated financial statements (continued)For the year ended 30 June 2014
22. Property, plant and equipment (continued)(a) Reconciliations (continued)
2013 (Restated)Buildings
$m
Aircraft and aeronautic
related assets
$m
Plant and equipment
$m
Computer equipment
$m
Finance leased assets
$m
Work in progress
$mTotal
$m
Carrying amount at the beginning of the year(1)
90.8 2,630.7 68.2 5.9 – 15.7 2,811.3
Acquisitions through business combinations(2) 0.2 56.3 5.0 0.2 1.6 1.3 64.6
Other additions(1) 0.1 340.3 30.4 4.6 23.0 38.0 436.4
Disposals(1) (18.7) (34.1) – – – (1.3) (54.1)
Depreciation(1) (6.6) (226.7) (9.6) (3.5) (0.1) – (246.5)
Impairment loss – – – – – – –
Transfers(3) – – 13.7 – – (13.7) –
Foreign exchange movements(1) – 53.7 – – – – 53.7
Carrying amount at the end of the year
65.8 2,820.2 107.7 7.2 24.5 40.0 3,065.4
(1) Refer to note 3(b).
(2) Refer to note 7(c).
(3) Transfers relate to amounts which were disclosed within work in progress at 30 June 2012 which were capitalised during the 2013 financial year.
(b) Decreases in value of property, plant and equipmentChanges in the use of certain assets in the prior year resulted in asset devaluations and subsequent accelerated depreciation totalling $0.8 million for the 2014 financial year (2013: $1.0 million). This accelerated depreciation expense has been included in depreciation and amortisation expense in the consolidated statement of profit or loss.
In addition, the Group recognised a net loss on disposal of property, plant and equipment of $2.3 million (2013: $2.0 million). This loss has been included in other expenses from ordinary activities in the consolidated statement of profit or loss.
Impairment loss – International operationsThe carrying amounts of the Group’s non-financial assets, other than inventories and deferred tax assets, are reviewed at each reporting period to determine whether there is any indication of impairment. As at 30 June 2014, the Group assessed that the carrying amount of the International CGU had exceeded its recoverable amount due to a deterioration of performance on its short haul international market segment, in particular on the Bali route, due to increased capacity and competition, refer to note 23(b).
The recoverable amount of the International CGU was based on its value-in-use, determined by discounting the future cash flows to be generated from the continuing use of the CGU. The cash flow projection covers a five-year period and is based on financial budgets approved by senior management. Value-in-use in 2014 was determined in a similar manner as in 2013. The carrying amount of the CGU was determined to be higher than its recoverable amount of $528.3 million and an impairment loss of $51.2 million (2013: n/a) was recognised. The impairment loss was fully allocated to the carrying value of property, plant and equipment assets attributable to the International CGU. The estimate of value-in-use was determined using a post-tax discount rate of 10.13% (2013: 9.73%) (equivalent pre-tax rate of 9.84% (2013: 12.25%)).
(c) Non-current assets pledged as securityRefer to note 25(b) for information on non-current assets pledged as security by the Group.
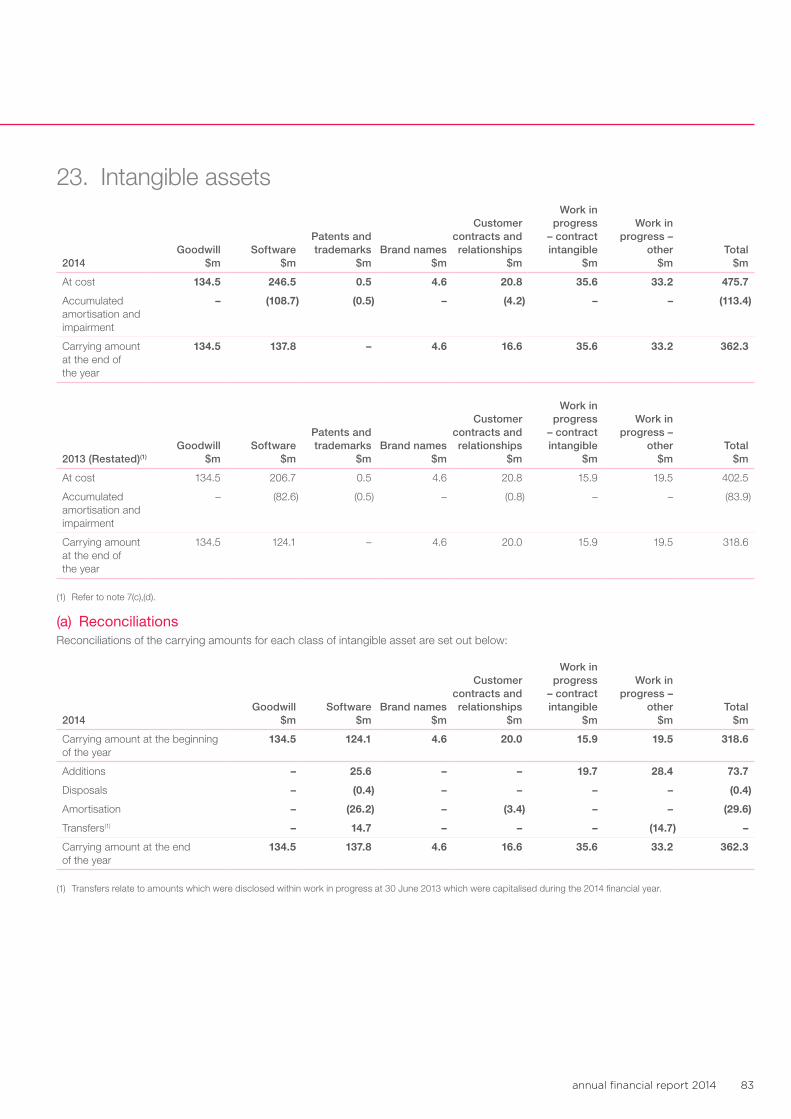
annual financial report 2014 83
23. Intangible assets
2014Goodwill
$mSoftware
$m
Patents and trademarks
$mBrand names
$m
Customer contracts and relationships
$m
Work in progress
– contract intangible
$m
Work in progress –
other $m
Total $m
At cost 134.5 246.5 0.5 4.6 20.8 35.6 33.2 475.7
Accumulated amortisation and impairment
– (108.7) (0.5) – (4.2) – – (113.4)
Carrying amount at the end of the year
134.5 137.8 – 4.6 16.6 35.6 33.2 362.3
2013 (Restated)(1)
Goodwill $m
Software $m
Patents and trademarks
$mBrand names
$m
Customer contracts and relationships
$m
Work in progress
– contract intangible
$m
Work in progress –
other $m
Total $m
At cost 134.5 206.7 0.5 4.6 20.8 15.9 19.5 402.5
Accumulated amortisation and impairment
– (82.6) (0.5) – (0.8) – – (83.9)
Carrying amount at the end of the year
134.5 124.1 – 4.6 20.0 15.9 19.5 318.6
(1) Refer to note 7(c),(d).
(a) ReconciliationsReconciliations of the carrying amounts for each class of intangible asset are set out below:
2014Goodwill
$mSoftware
$mBrand names
$m
Customer contracts and relationships
$m
Work in progress
– contract intangible
$m
Work in progress –
other $m
Total $m
Carrying amount at the beginning of the year
134.5 124.1 4.6 20.0 15.9 19.5 318.6
Additions – 25.6 – – 19.7 28.4 73.7
Disposals – (0.4) – – – – (0.4)
Amortisation – (26.2) – (3.4) – – (29.6)
Transfers(1) – 14.7 – – – (14.7) –
Carrying amount at the end of the year
134.5 137.8 4.6 16.6 35.6 33.2 362.3
(1) Transfers relate to amounts which were disclosed within work in progress at 30 June 2013 which were capitalised during the 2014 financial year.
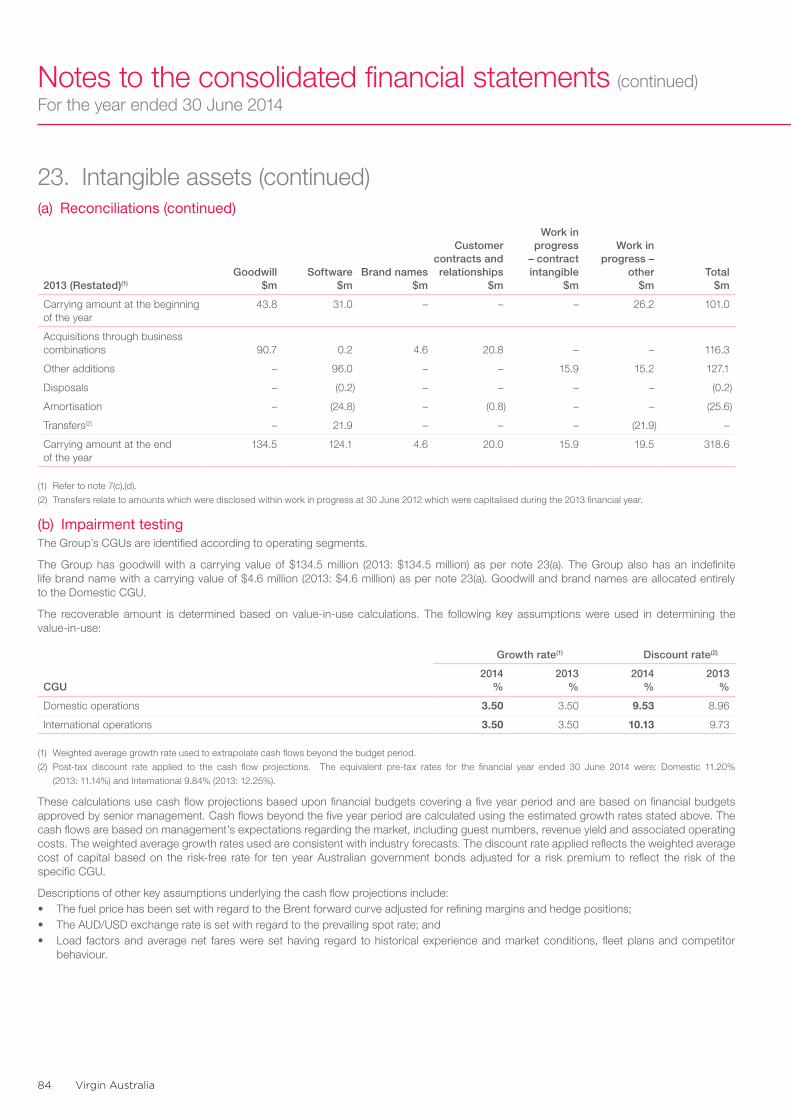
Virgin Australia84
Notes to the consolidated financial statements (continued)For the year ended 30 June 2014
23. Intangible assets (continued)(a) Reconciliations (continued)
2013 (Restated)(1)
Goodwill $m
Software $m
Brand names $m
Customer contracts and relationships
$m
Work in progress
– contract intangible
$m
Work in progress –
other $m
Total $m
Carrying amount at the beginning of the year
43.8 31.0 – – – 26.2 101.0
Acquisitions through business combinations 90.7 0.2 4.6 20.8 – – 116.3
Other additions – 96.0 – – 15.9 15.2 127.1
Disposals – (0.2) – – – – (0.2)
Amortisation – (24.8) – (0.8) – – (25.6)
Transfers(2) – 21.9 – – – (21.9) –
Carrying amount at the end of the year
134.5 124.1 4.6 20.0 15.9 19.5 318.6
(1) Refer to note 7(c),(d).
(2) Transfers relate to amounts which were disclosed within work in progress at 30 June 2012 which were capitalised during the 2013 financial year.
(b) Impairment testingThe Group’s CGUs are identified according to operating segments.
The Group has goodwill with a carrying value of $134.5 million (2013: $134.5 million) as per note 23(a). The Group also has an indefinite life brand name with a carrying value of $4.6 million (2013: $4.6 million) as per note 23(a). Goodwill and brand names are allocated entirely to the Domestic CGU.
The recoverable amount is determined based on value-in-use calculations. The following key assumptions were used in determining the value-in-use:
Growth rate(1) Discount rate(2)
CGU2014
%2013
%2014
%2013
%
Domestic operations 3.50 3.50 9.53 8.96
International operations 3.50 3.50 10.13 9.73
(1) Weighted average growth rate used to extrapolate cash flows beyond the budget period.
(2) Post-tax discount rate applied to the cash flow projections. The equivalent pre-tax rates for the financial year ended 30 June 2014 were: Domestic 11.20%
(2013: 11.14%) and International 9.84% (2013: 12.25%).
These calculations use cash flow projections based upon financial budgets covering a five year period and are based on financial budgets approved by senior management. Cash flows beyond the five year period are calculated using the estimated growth rates stated above. The cash flows are based on management’s expectations regarding the market, including guest numbers, revenue yield and associated operating costs. The weighted average growth rates used are consistent with industry forecasts. The discount rate applied reflects the weighted average cost of capital based on the risk-free rate for ten year Australian government bonds adjusted for a risk premium to reflect the risk of the specific CGU.
Descriptions of other key assumptions underlying the cash flow projections include:• The fuel price has been set with regard to the Brent forward curve adjusted for refining margins and hedge positions;• The AUD/USD exchange rate is set with regard to the prevailing spot rate; and• Load factors and average net fares were set having regard to historical experience and market conditions, fleet plans and competitor
behaviour.
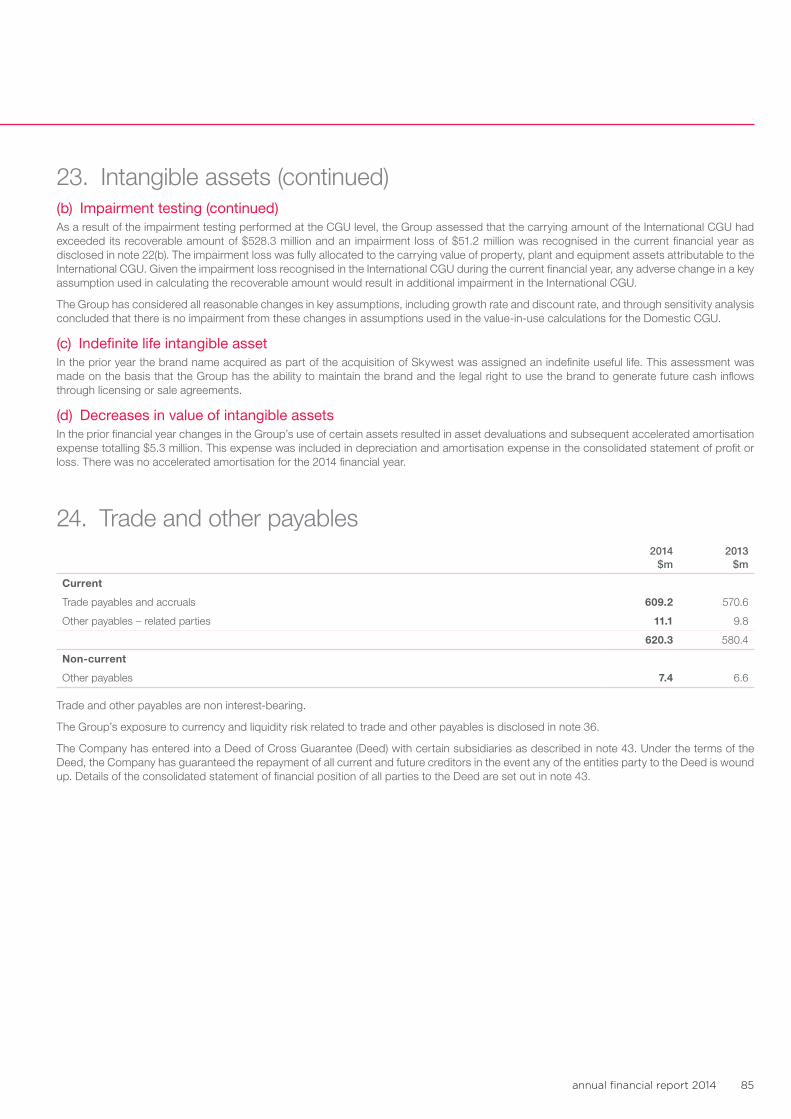
annual financial report 2014 85
23. Intangible assets (continued)(b) Impairment testing (continued)As a result of the impairment testing performed at the CGU level, the Group assessed that the carrying amount of the International CGU had exceeded its recoverable amount of $528.3 million and an impairment loss of $51.2 million was recognised in the current financial year as disclosed in note 22(b). The impairment loss was fully allocated to the carrying value of property, plant and equipment assets attributable to the International CGU. Given the impairment loss recognised in the International CGU during the current financial year, any adverse change in a key assumption used in calculating the recoverable amount would result in additional impairment in the International CGU.
The Group has considered all reasonable changes in key assumptions, including growth rate and discount rate, and through sensitivity analysis concluded that there is no impairment from these changes in assumptions used in the value-in-use calculations for the Domestic CGU.
(c) Indefinite life intangible assetIn the prior year the brand name acquired as part of the acquisition of Skywest was assigned an indefinite useful life. This assessment was made on the basis that the Group has the ability to maintain the brand and the legal right to use the brand to generate future cash inflows through licensing or sale agreements.
(d) Decreases in value of intangible assetsIn the prior financial year changes in the Group’s use of certain assets resulted in asset devaluations and subsequent accelerated amortisation expense totalling $5.3 million. This expense was included in depreciation and amortisation expense in the consolidated statement of profit or loss. There was no accelerated amortisation for the 2014 financial year.
24. Trade and other payables2014
$m2013
$m
Current
Trade payables and accruals 609.2 570.6
Other payables – related parties 11.1 9.8
620.3 580.4
Non-current
Other payables 7.4 6.6
Trade and other payables are non interest-bearing.
The Group’s exposure to currency and liquidity risk related to trade and other payables is disclosed in note 36.
The Company has entered into a Deed of Cross Guarantee (Deed) with certain subsidiaries as described in note 43. Under the terms of the Deed, the Company has guaranteed the repayment of all current and future creditors in the event any of the entities party to the Deed is wound up. Details of the consolidated statement of financial position of all parties to the Deed are set out in note 43.
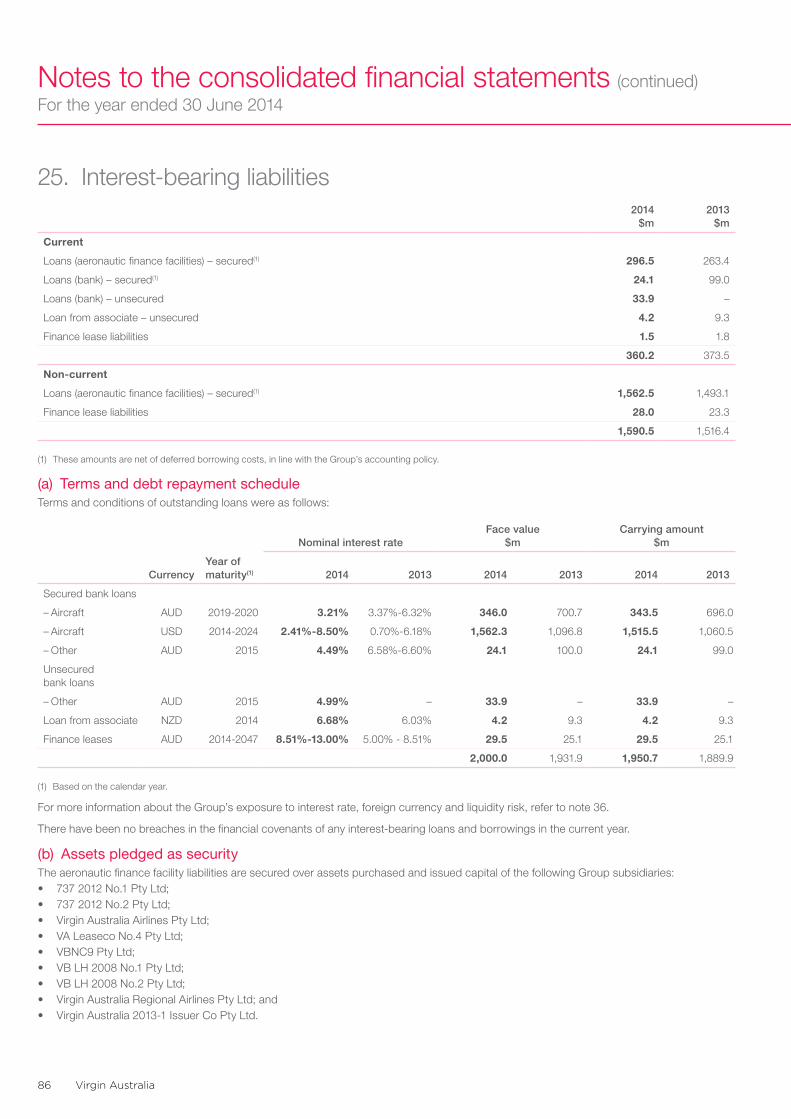
Virgin Australia86
Notes to the consolidated financial statements (continued)For the year ended 30 June 2014
25. Interest-bearing liabilities2014
$m2013
$m
Current
Loans (aeronautic finance facilities) – secured(1) 296.5 263.4
Loans (bank) – secured(1) 24.1 99.0
Loans (bank) – unsecured 33.9 –
Loan from associate – unsecured 4.2 9.3
Finance lease liabilities 1.5 1.8
360.2 373.5
Non-current
Loans (aeronautic finance facilities) – secured(1) 1,562.5 1,493.1
Finance lease liabilities 28.0 23.3
1,590.5 1,516.4
(1) These amounts are net of deferred borrowing costs, in line with the Group’s accounting policy.
(a) Terms and debt repayment scheduleTerms and conditions of outstanding loans were as follows:
Nominal interest rateFace value
$mCarrying amount
$m
CurrencyYear of maturity(1) 2014 2013 2014 2013 2014 2013
Secured bank loans
– Aircraft AUD 2019-2020 3.21% 3.37%-6.32% 346.0 700.7 343.5 696.0
– Aircraft USD 2014-2024 2.41%-8.50% 0.70%-6.18% 1,562.3 1,096.8 1,515.5 1,060.5
– Other AUD 2015 4.49% 6.58%-6.60% 24.1 100.0 24.1 99.0
Unsecured bank loans
– Other AUD 2015 4.99% – 33.9 – 33.9 –
Loan from associate NZD 2014 6.68% 6.03% 4.2 9.3 4.2 9.3
Finance leases AUD 2014-2047 8.51%-13.00% 5.00% - 8.51% 29.5 25.1 29.5 25.1
2,000.0 1,931.9 1,950.7 1,889.9
(1) Based on the calendar year.
For more information about the Group’s exposure to interest rate, foreign currency and liquidity risk, refer to note 36.
There have been no breaches in the financial covenants of any interest-bearing loans and borrowings in the current year.
(b) Assets pledged as securityThe aeronautic finance facility liabilities are secured over assets purchased and issued capital of the following Group subsidiaries:• 737 2012 No.1 Pty Ltd;• 737 2012 No.2 Pty Ltd;• Virgin Australia Airlines Pty Ltd;• VA Leaseco No.4 Pty Ltd;• VBNC9 Pty Ltd;• VB LH 2008 No.1 Pty Ltd; • VB LH 2008 No.2 Pty Ltd;• Virgin Australia Regional Airlines Pty Ltd; and• Virgin Australia 2013-1 Issuer Co Pty Ltd.
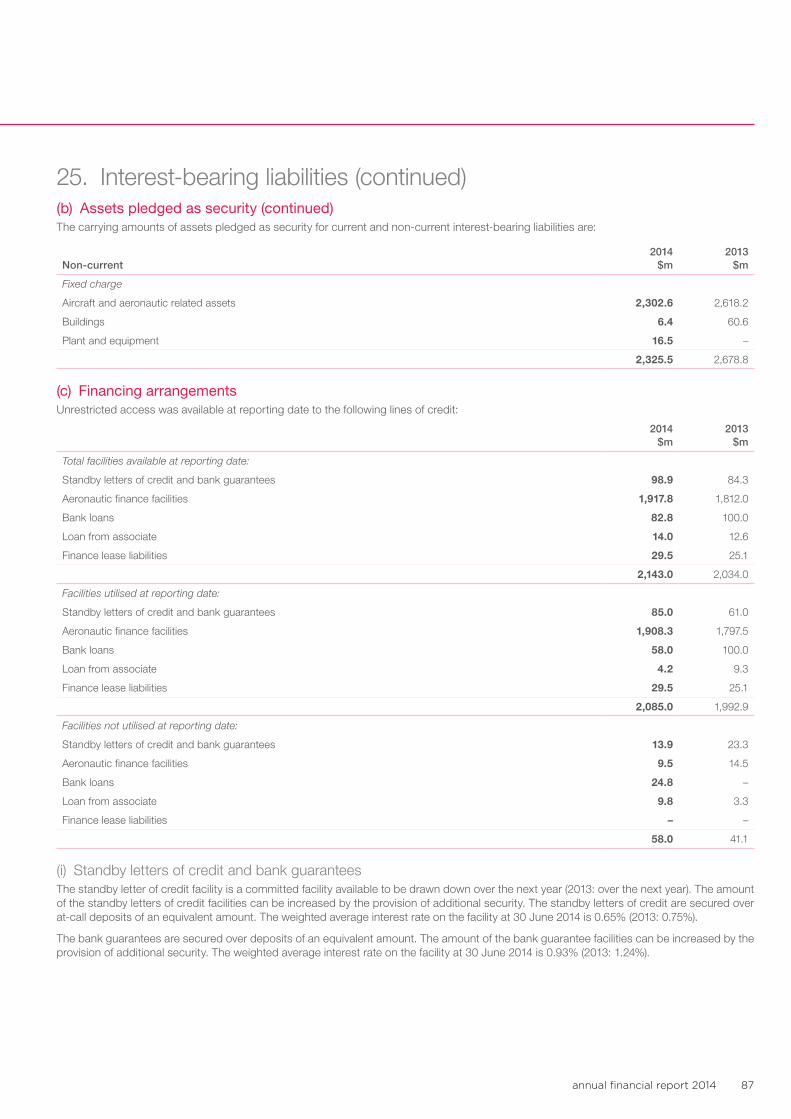
annual financial report 2014 87
25. Interest-bearing liabilities (continued)(b) Assets pledged as security (continued)The carrying amounts of assets pledged as security for current and non-current interest-bearing liabilities are:
Non-current2014
$m2013
$m
Fixed charge
Aircraft and aeronautic related assets 2,302.6 2,618.2
Buildings 6.4 60.6
Plant and equipment 16.5 –
2,325.5 2,678.8
(c) Financing arrangementsUnrestricted access was available at reporting date to the following lines of credit:
2014 $m
2013 $m
Total facilities available at reporting date:
Standby letters of credit and bank guarantees 98.9 84.3
Aeronautic finance facilities 1,917.8 1,812.0
Bank loans 82.8 100.0
Loan from associate 14.0 12.6
Finance lease liabilities 29.5 25.1
2,143.0 2,034.0
Facilities utilised at reporting date:
Standby letters of credit and bank guarantees 85.0 61.0
Aeronautic finance facilities 1,908.3 1,797.5
Bank loans 58.0 100.0
Loan from associate 4.2 9.3
Finance lease liabilities 29.5 25.1
2,085.0 1,992.9
Facilities not utilised at reporting date:
Standby letters of credit and bank guarantees 13.9 23.3
Aeronautic finance facilities 9.5 14.5
Bank loans 24.8 –
Loan from associate 9.8 3.3
Finance lease liabilities – –
58.0 41.1
(i) Standby letters of credit and bank guaranteesThe standby letter of credit facility is a committed facility available to be drawn down over the next year (2013: over the next year). The amount of the standby letters of credit facilities can be increased by the provision of additional security. The standby letters of credit are secured over at-call deposits of an equivalent amount. The weighted average interest rate on the facility at 30 June 2014 is 0.65% (2013: 0.75%).
The bank guarantees are secured over deposits of an equivalent amount. The amount of the bank guarantee facilities can be increased by the provision of additional security. The weighted average interest rate on the facility at 30 June 2014 is 0.93% (2013: 1.24%).
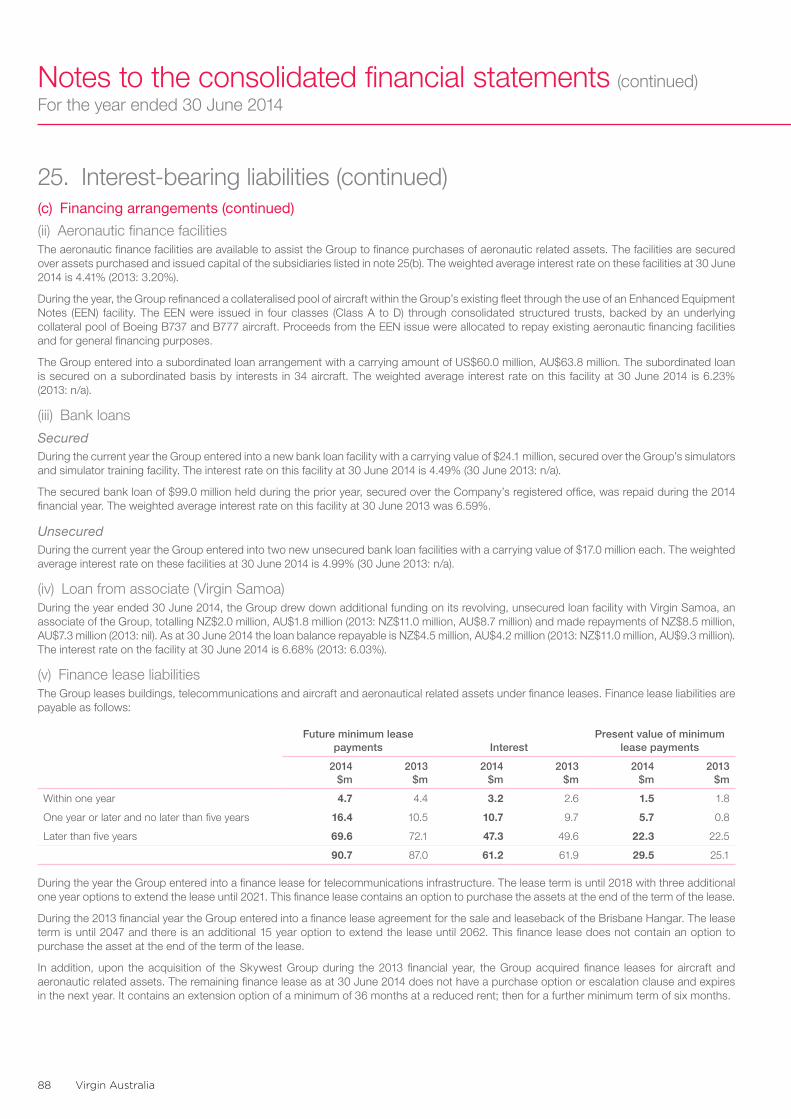
Virgin Australia88
Notes to the consolidated financial statements (continued)For the year ended 30 June 2014
25. Interest-bearing liabilities (continued)(c) Financing arrangements (continued)
(ii) Aeronautic finance facilitiesThe aeronautic finance facilities are available to assist the Group to finance purchases of aeronautic related assets. The facilities are secured over assets purchased and issued capital of the subsidiaries listed in note 25(b). The weighted average interest rate on these facilities at 30 June 2014 is 4.41% (2013: 3.20%).
During the year, the Group refinanced a collateralised pool of aircraft within the Group’s existing fleet through the use of an Enhanced Equipment Notes (EEN) facility. The EEN were issued in four classes (Class A to D) through consolidated structured trusts, backed by an underlying collateral pool of Boeing B737 and B777 aircraft. Proceeds from the EEN issue were allocated to repay existing aeronautic financing facilities and for general financing purposes.
The Group entered into a subordinated loan arrangement with a carrying amount of US$60.0 million, AU$63.8 million. The subordinated loan is secured on a subordinated basis by interests in 34 aircraft. The weighted average interest rate on this facility at 30 June 2014 is 6.23% (2013: n/a).
(iii) Bank loans
SecuredDuring the current year the Group entered into a new bank loan facility with a carrying value of $24.1 million, secured over the Group’s simulators and simulator training facility. The interest rate on this facility at 30 June 2014 is 4.49% (30 June 2013: n/a).
The secured bank loan of $99.0 million held during the prior year, secured over the Company’s registered office, was repaid during the 2014 financial year. The weighted average interest rate on this facility at 30 June 2013 was 6.59%.
UnsecuredDuring the current year the Group entered into two new unsecured bank loan facilities with a carrying value of $17.0 million each. The weighted average interest rate on these facilities at 30 June 2014 is 4.99% (30 June 2013: n/a).
(iv) Loan from associate (Virgin Samoa)During the year ended 30 June 2014, the Group drew down additional funding on its revolving, unsecured loan facility with Virgin Samoa, an associate of the Group, totalling NZ$2.0 million, AU$1.8 million (2013: NZ$11.0 million, AU$8.7 million) and made repayments of NZ$8.5 million, AU$7.3 million (2013: nil). As at 30 June 2014 the loan balance repayable is NZ$4.5 million, AU$4.2 million (2013: NZ$11.0 million, AU$9.3 million). The interest rate on the facility at 30 June 2014 is 6.68% (2013: 6.03%).
(v) Finance lease liabilitiesThe Group leases buildings, telecommunications and aircraft and aeronautical related assets under finance leases. Finance lease liabilities are payable as follows:
Future minimum lease payments Interest
Present value of minimum lease payments
2014 $m
2013 $m
2014 $m
2013 $m
2014 $m
2013 $m
Within one year 4.7 4.4 3.2 2.6 1.5 1.8
One year or later and no later than five years 16.4 10.5 10.7 9.7 5.7 0.8
Later than five years 69.6 72.1 47.3 49.6 22.3 22.5
90.7 87.0 61.2 61.9 29.5 25.1
During the year the Group entered into a finance lease for telecommunications infrastructure. The lease term is until 2018 with three additional one year options to extend the lease until 2021. This finance lease contains an option to purchase the assets at the end of the term of the lease.
During the 2013 financial year the Group entered into a finance lease agreement for the sale and leaseback of the Brisbane Hangar. The lease term is until 2047 and there is an additional 15 year option to extend the lease until 2062. This finance lease does not contain an option to purchase the asset at the end of the term of the lease.
In addition, upon the acquisition of the Skywest Group during the 2013 financial year, the Group acquired finance leases for aircraft and aeronautic related assets. The remaining finance lease as at 30 June 2014 does not have a purchase option or escalation clause and expires in the next year. It contains an extension option of a minimum of 36 months at a reduced rent; then for a further minimum term of six months.
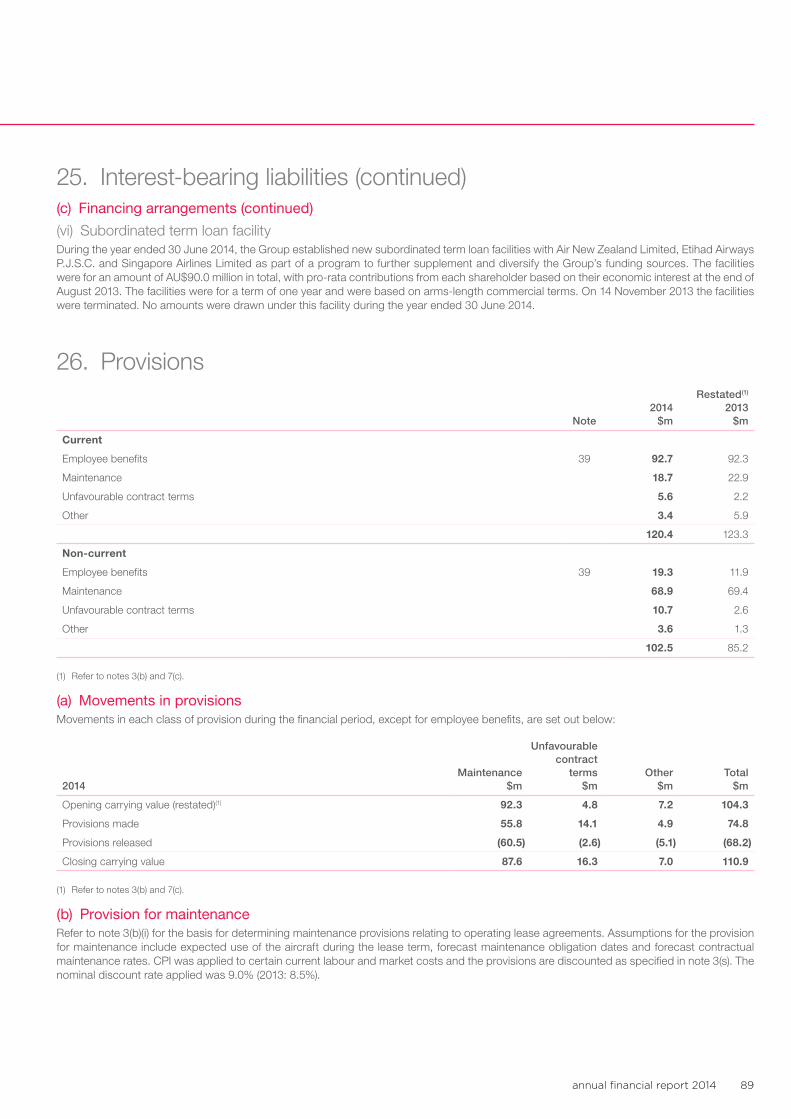
annual financial report 2014 89
25. Interest-bearing liabilities (continued)(c) Financing arrangements (continued)
(vi) Subordinated term loan facilityDuring the year ended 30 June 2014, the Group established new subordinated term loan facilities with Air New Zealand Limited, Etihad Airways P.J.S.C. and Singapore Airlines Limited as part of a program to further supplement and diversify the Group’s funding sources. The facilities were for an amount of AU$90.0 million in total, with pro-rata contributions from each shareholder based on their economic interest at the end of August 2013. The facilities were for a term of one year and were based on arms-length commercial terms. On 14 November 2013 the facilities were terminated. No amounts were drawn under this facility during the year ended 30 June 2014.
26. Provisions
Note2014
$m
Restated(1) 2013
$m
Current
Employee benefits 39 92.7 92.3
Maintenance 18.7 22.9
Unfavourable contract terms 5.6 2.2
Other 3.4 5.9
120.4 123.3
Non-current
Employee benefits 39 19.3 11.9
Maintenance 68.9 69.4
Unfavourable contract terms 10.7 2.6
Other 3.6 1.3
102.5 85.2
(1) Refer to notes 3(b) and 7(c).
(a) Movements in provisionsMovements in each class of provision during the financial period, except for employee benefits, are set out below:
2014 Maintenance
$m
Unfavourable contract
terms $m
Other $m
Total $m
Opening carrying value (restated)(1) 92.3 4.8 7.2 104.3
Provisions made 55.8 14.1 4.9 74.8
Provisions released (60.5) (2.6) (5.1) (68.2)
Closing carrying value 87.6 16.3 7.0 110.9
(1) Refer to notes 3(b) and 7(c).
(b) Provision for maintenanceRefer to note 3(b)(i) for the basis for determining maintenance provisions relating to operating lease agreements. Assumptions for the provision for maintenance include expected use of the aircraft during the lease term, forecast maintenance obligation dates and forecast contractual maintenance rates. CPI was applied to certain current labour and market costs and the provisions are discounted as specified in note 3(s). The nominal discount rate applied was 9.0% (2013: 8.5%).
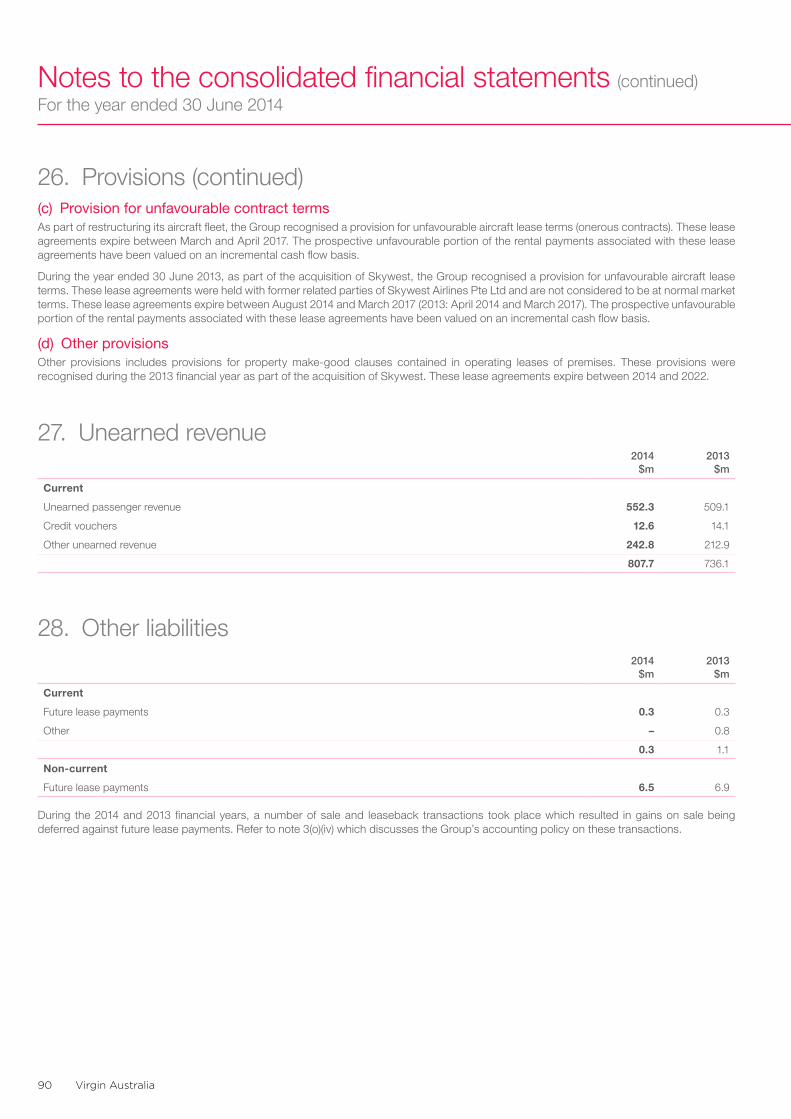
Virgin Australia90
Notes to the consolidated financial statements (continued)For the year ended 30 June 2014
26. Provisions (continued)(c) Provision for unfavourable contract termsAs part of restructuring its aircraft fleet, the Group recognised a provision for unfavourable aircraft lease terms (onerous contracts). These lease agreements expire between March and April 2017. The prospective unfavourable portion of the rental payments associated with these lease agreements have been valued on an incremental cash flow basis.
During the year ended 30 June 2013, as part of the acquisition of Skywest, the Group recognised a provision for unfavourable aircraft lease terms. These lease agreements were held with former related parties of Skywest Airlines Pte Ltd and are not considered to be at normal market terms. These lease agreements expire between August 2014 and March 2017 (2013: April 2014 and March 2017). The prospective unfavourable portion of the rental payments associated with these lease agreements have been valued on an incremental cash flow basis.
(d) Other provisionsOther provisions includes provisions for property make-good clauses contained in operating leases of premises. These provisions were recognised during the 2013 financial year as part of the acquisition of Skywest. These lease agreements expire between 2014 and 2022.
27. Unearned revenue 2014
$m2013
$m
Current
Unearned passenger revenue 552.3 509.1
Credit vouchers 12.6 14.1
Other unearned revenue 242.8 212.9
807.7 736.1
28. Other liabilities2014
$m2013
$m
Current
Future lease payments 0.3 0.3
Other – 0.8
0.3 1.1
Non-current
Future lease payments 6.5 6.9
During the 2014 and 2013 financial years, a number of sale and leaseback transactions took place which resulted in gains on sale being deferred against future lease payments. Refer to note 3(o)(iv) which discusses the Group’s accounting policy on these transactions.
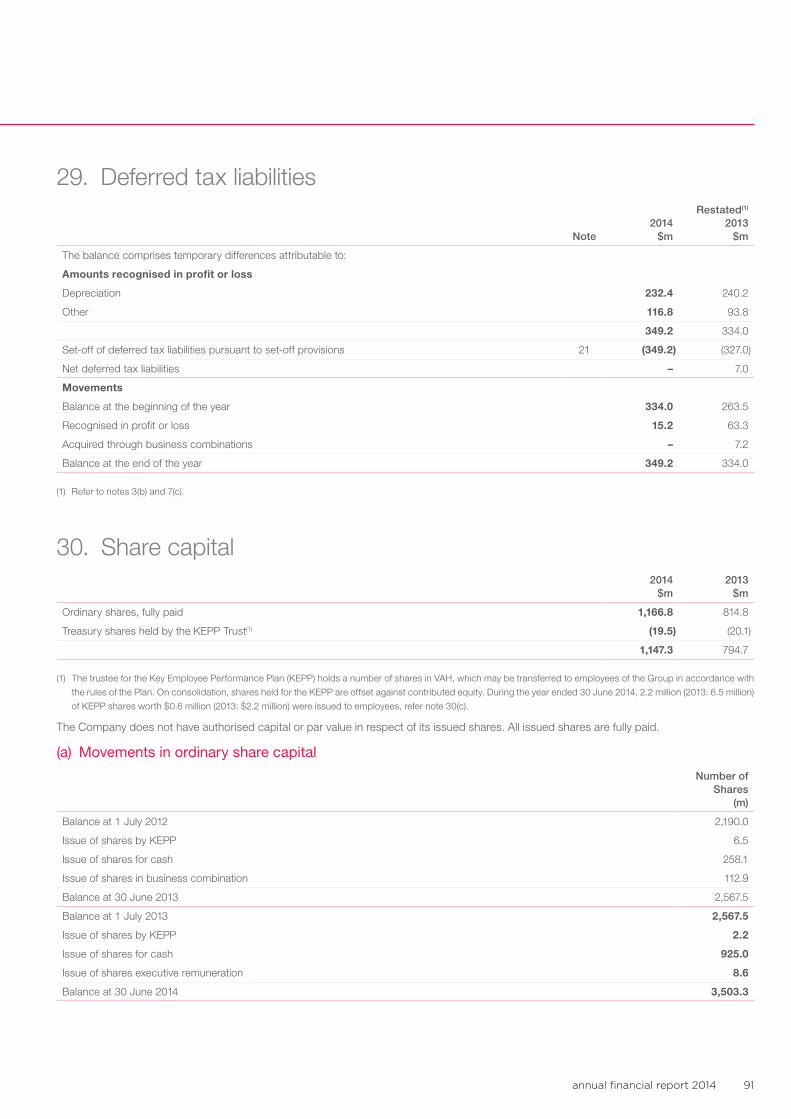
annual financial report 2014 91
29. Deferred tax liabilities
Note2014
$m
Restated(1) 2013
$m
The balance comprises temporary differences attributable to:
Amounts recognised in profit or loss
Depreciation 232.4 240.2
Other 116.8 93.8
349.2 334.0
Set-off of deferred tax liabilities pursuant to set-off provisions 21 (349.2) (327.0)
Net deferred tax liabilities – 7.0
Movements
Balance at the beginning of the year 334.0 263.5
Recognised in profit or loss 15.2 63.3
Acquired through business combinations – 7.2
Balance at the end of the year 349.2 334.0
(1) Refer to notes 3(b) and 7(c).
30. Share capital2014
$m2013
$m
Ordinary shares, fully paid 1,166.8 814.8
Treasury shares held by the KEPP Trust(1) (19.5) (20.1)
1,147.3 794.7
(1) The trustee for the Key Employee Performance Plan (KEPP) holds a number of shares in VAH, which may be transferred to employees of the Group in accordance with
the rules of the Plan. On consolidation, shares held for the KEPP are offset against contributed equity. During the year ended 30 June 2014, 2.2 million (2013: 6.5 million)
of KEPP shares worth $0.6 million (2013: $2.2 million) were issued to employees, refer note 30(c).
The Company does not have authorised capital or par value in respect of its issued shares. All issued shares are fully paid.
(a) Movements in ordinary share capital
Number of Shares
(m)
Balance at 1 July 2012 2,190.0
Issue of shares by KEPP 6.5
Issue of shares for cash 258.1
Issue of shares in business combination 112.9
Balance at 30 June 2013 2,567.5
Balance at 1 July 2013 2,567.5
Issue of shares by KEPP 2.2
Issue of shares for cash 925.0
Issue of shares executive remuneration 8.6
Balance at 30 June 2014 3,503.3
Virgin Australia92
Notes to the consolidated financial statements (continued)For the year ended 30 June 2014
30. Share capital (continued)(b) Terms and conditions of ordinary sharesWith the exception of shares held in trust under the KEPP, holders of ordinary shares are entitled to receive dividends as declared from time to time and are entitled to one vote per share at shareholders’ meetings.
In the event of winding up of the Company, ordinary shareholders rank after all other shareholders and creditors and are fully entitled to any proceeds of liquidation.
At 30 June 2014, the trustee for the KEPP holds 11.5 million (2013: 13.7 million) shares. A participating employee is not entitled to any income or other rights (including voting rights) derived from any shares acquired by the trustee under KEPP unless and until the shares are transferred to the employee for nil consideration, following satisfaction of any vesting conditions – refer to note 40(b).
(c) Issue of ordinary shares
Transactions during the financial year ended 30 June 2014On 30 June 2013, the vesting conditions associated with Senior Executive Option Plan (SEOP) Issue 12, were partially met resulting in the issue of 8.3 million shares on 18 September 2013 and an increase in share capital of $2.2 million. Refer to note 40(a).
On 30 June 2013, the vesting conditions associated with Senior Executive Option Plan (SEOP) Issue 14, were partially met resulting in the issue of 0.3 million shares on 18 September 2013 and an increase in share capital of $0.1 million. Refer to note 40(a).
On 1 July 2013, vesting conditions associated with Tranche 1 of Key Employee Performance Plan 2012 were met resulting in the issue of 2.2 million performance rights and an increase in share capital of $0.6 million. Refer to note 40(b).
On 14 November 2013, the Group announced the intention to issue 925.0 million new shares, pursuant to the terms of the fully underwritten pro-rata, non-renounceable entitlement offer, comprising an institutional component (Institutional Entitlement Offer) and a retail component (Retail Entitlement Offer).
On 29 November 2013, 740.6 million shares were issued under the Institutional Entitlement Offer at a price of $0.38 per share resulting in an increase in share capital of $281.4 million. Transaction costs associated with the capital raising were capitalised and offset against share capital.
On 17 December 2013, 184.4 million shares were issued under the Retail Entitlement Offer at a price of $0.38 per share, resulting in an increase in share capital of $70.1 million. Transaction costs associated with the capital raising were capitalised and offset against share capital.
Of the total shares issued under the Institutional Entitlement Offer and the Retail Entitlement Offer, 633.8 million shares were issued to Air New Zealand Limited, Etihad Airways P.J.S.C. and Singapore Airlines Limited.
Transactions during the financial year ended 30 June 2013On 1 July 2012, upon vesting of the employee share plans, 6.5 million performance rights represented by shares were issued from the KEPP Trust, a consolidated entity of the Group, resulting in an increase in share capital of $2.2 million.
On 16 November 2012, Singapore Airlines Limited subscribed for 245.6 million shares in VAH at a price of $0.4288 per share, resulting in an increase in share capital of $105.3 million.
On 19 April 2013, the Group completed payment of the Scheme Cash and Securities consideration for the acquisition of 100% of the issued share capital in Skywest Airlines Pte Ltd. This included the issue of 112.9 million new shares in VAH, resulting in an increase in share capital of $48.5 million.
On 22 April 2013, Singapore Airlines Limited subscribed for 12.5 million shares in VAH at a price of $0.4288 per share resulting in an increase in the share capital of $5.4 million.
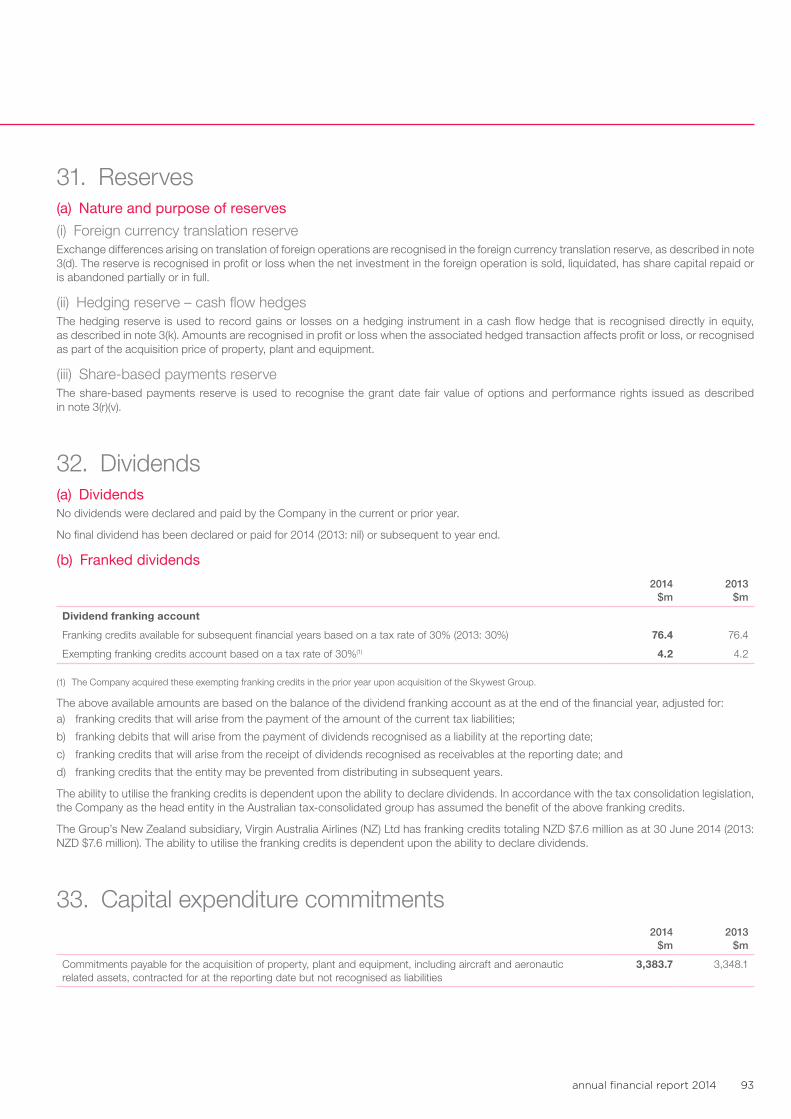
annual financial report 2014 93
31. Reserves(a) Nature and purpose of reserves
(i) Foreign currency translation reserveExchange differences arising on translation of foreign operations are recognised in the foreign currency translation reserve, as described in note 3(d). The reserve is recognised in profit or loss when the net investment in the foreign operation is sold, liquidated, has share capital repaid or is abandoned partially or in full.
(ii) Hedging reserve – cash flow hedgesThe hedging reserve is used to record gains or losses on a hedging instrument in a cash flow hedge that is recognised directly in equity, as described in note 3(k). Amounts are recognised in profit or loss when the associated hedged transaction affects profit or loss, or recognised as part of the acquisition price of property, plant and equipment.
(iii) Share-based payments reserveThe share-based payments reserve is used to recognise the grant date fair value of options and performance rights issued as described in note 3(r)(v).
32. Dividends(a) DividendsNo dividends were declared and paid by the Company in the current or prior year.
No final dividend has been declared or paid for 2014 (2013: nil) or subsequent to year end.
(b) Franked dividends
2014 $m
2013 $m
Dividend franking account
Franking credits available for subsequent financial years based on a tax rate of 30% (2013: 30%) 76.4 76.4
Exempting franking credits account based on a tax rate of 30%(1) 4.2 4.2
(1) The Company acquired these exempting franking credits in the prior year upon acquisition of the Skywest Group.
The above available amounts are based on the balance of the dividend franking account as at the end of the financial year, adjusted for:a) franking credits that will arise from the payment of the amount of the current tax liabilities;
b) franking debits that will arise from the payment of dividends recognised as a liability at the reporting date;
c) franking credits that will arise from the receipt of dividends recognised as receivables at the reporting date; and
d) franking credits that the entity may be prevented from distributing in subsequent years.
The ability to utilise the franking credits is dependent upon the ability to declare dividends. In accordance with the tax consolidation legislation, the Company as the head entity in the Australian tax-consolidated group has assumed the benefit of the above franking credits.
The Group’s New Zealand subsidiary, Virgin Australia Airlines (NZ) Ltd has franking credits totaling NZD $7.6 million as at 30 June 2014 (2013: NZD $7.6 million). The ability to utilise the franking credits is dependent upon the ability to declare dividends.
33. Capital expenditure commitments2014
$m2013
$m
Commitments payable for the acquisition of property, plant and equipment, including aircraft and aeronautic related assets, contracted for at the reporting date but not recognised as liabilities
3,383.7 3,348.1
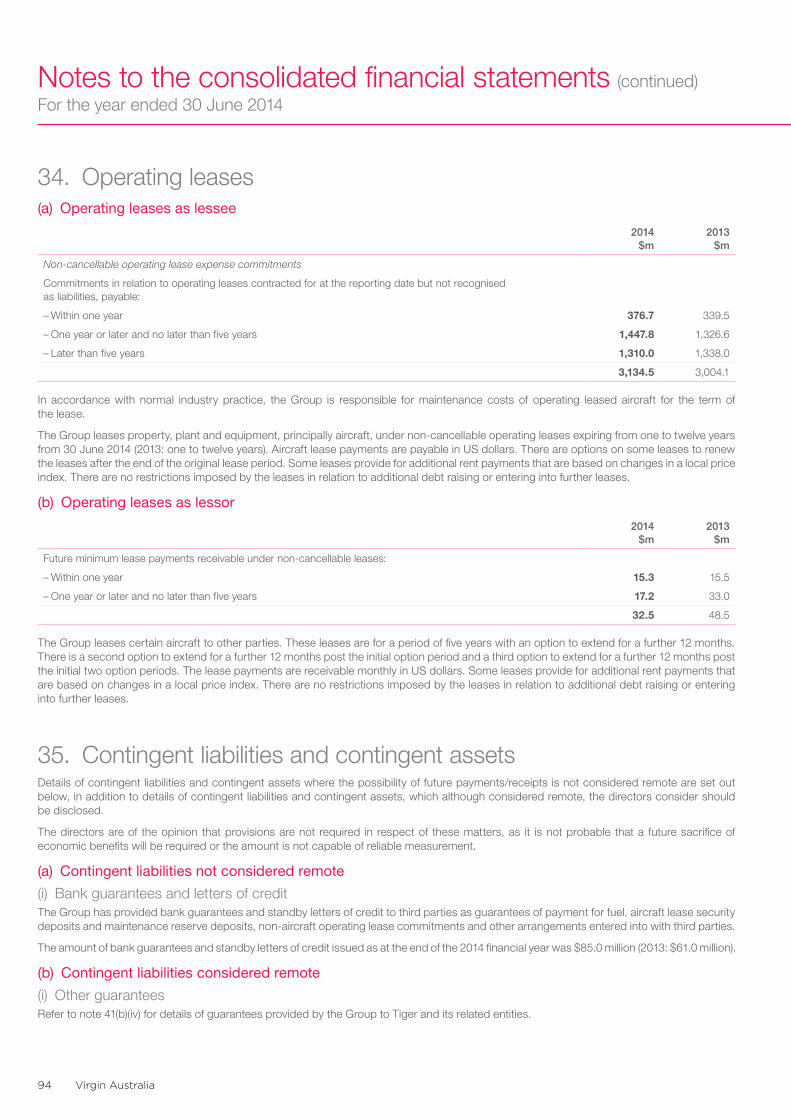
Virgin Australia94
Notes to the consolidated financial statements (continued)For the year ended 30 June 2014
34. Operating leases(a) Operating leases as lessee
2014 $m
2013 $m
Non-cancellable operating lease expense commitments
Commitments in relation to operating leases contracted for at the reporting date but not recognised as liabilities, payable:
– Within one year 376.7 339.5
– One year or later and no later than five years 1,447.8 1,326.6
– Later than five years 1,310.0 1,338.0
3,134.5 3,004.1
In accordance with normal industry practice, the Group is responsible for maintenance costs of operating leased aircraft for the term of the lease.
The Group leases property, plant and equipment, principally aircraft, under non-cancellable operating leases expiring from one to twelve years from 30 June 2014 (2013: one to twelve years). Aircraft lease payments are payable in US dollars. There are options on some leases to renew the leases after the end of the original lease period. Some leases provide for additional rent payments that are based on changes in a local price index. There are no restrictions imposed by the leases in relation to additional debt raising or entering into further leases.
(b) Operating leases as lessor
2014 $m
2013 $m
Future minimum lease payments receivable under non-cancellable leases:
– Within one year 15.3 15.5
– One year or later and no later than five years 17.2 33.0
32.5 48.5
The Group leases certain aircraft to other parties. These leases are for a period of five years with an option to extend for a further 12 months. There is a second option to extend for a further 12 months post the initial option period and a third option to extend for a further 12 months post the initial two option periods. The lease payments are receivable monthly in US dollars. Some leases provide for additional rent payments that are based on changes in a local price index. There are no restrictions imposed by the leases in relation to additional debt raising or entering into further leases.
35. Contingent liabilities and contingent assetsDetails of contingent liabilities and contingent assets where the possibility of future payments/receipts is not considered remote are set out below, in addition to details of contingent liabilities and contingent assets, which although considered remote, the directors consider should be disclosed.
The directors are of the opinion that provisions are not required in respect of these matters, as it is not probable that a future sacrifice of economic benefits will be required or the amount is not capable of reliable measurement.
(a) Contingent liabilities not considered remote
(i) Bank guarantees and letters of creditThe Group has provided bank guarantees and standby letters of credit to third parties as guarantees of payment for fuel, aircraft lease security deposits and maintenance reserve deposits, non-aircraft operating lease commitments and other arrangements entered into with third parties.
The amount of bank guarantees and standby letters of credit issued as at the end of the 2014 financial year was $85.0 million (2013: $61.0 million).
(b) Contingent liabilities considered remote
(i) Other guaranteesRefer to note 41(b)(iv) for details of guarantees provided by the Group to Tiger and its related entities.
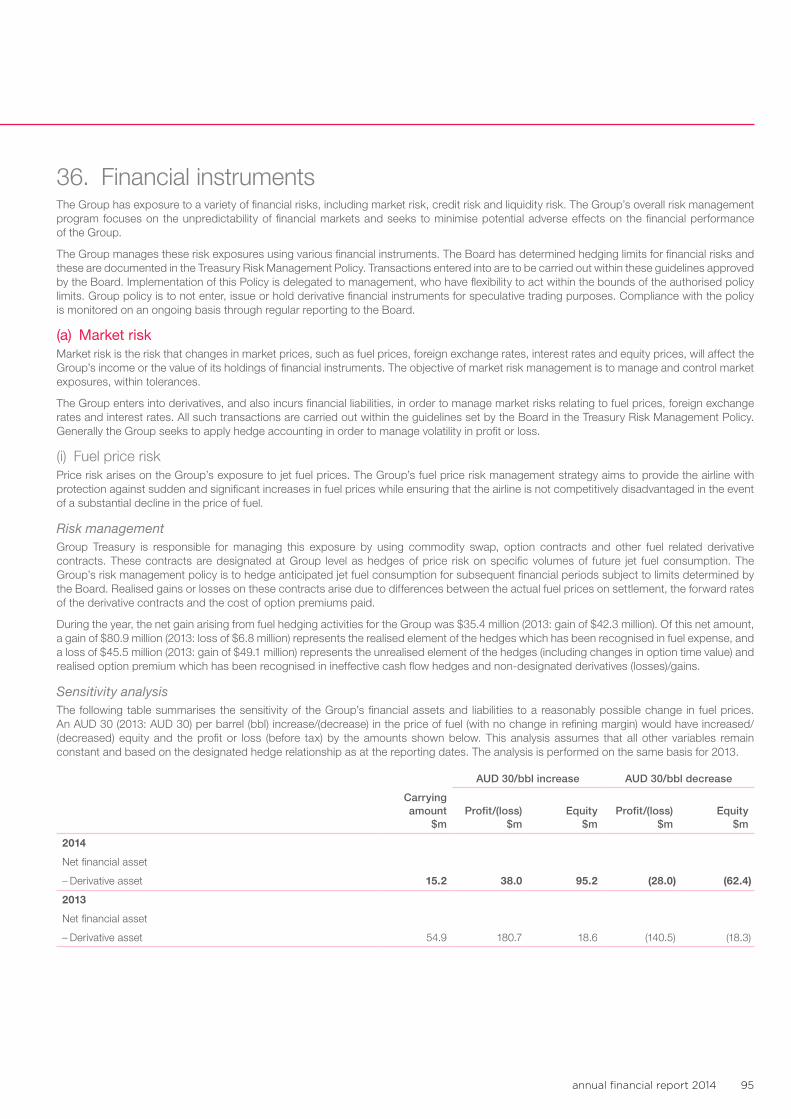
annual financial report 2014 95
36. Financial instrumentsThe Group has exposure to a variety of financial risks, including market risk, credit risk and liquidity risk. The Group’s overall risk management program focuses on the unpredictability of financial markets and seeks to minimise potential adverse effects on the financial performance of the Group.
The Group manages these risk exposures using various financial instruments. The Board has determined hedging limits for financial risks and these are documented in the Treasury Risk Management Policy. Transactions entered into are to be carried out within these guidelines approved by the Board. Implementation of this Policy is delegated to management, who have flexibility to act within the bounds of the authorised policy limits. Group policy is to not enter, issue or hold derivative financial instruments for speculative trading purposes. Compliance with the policy is monitored on an ongoing basis through regular reporting to the Board.
(a) Market riskMarket risk is the risk that changes in market prices, such as fuel prices, foreign exchange rates, interest rates and equity prices, will affect the Group’s income or the value of its holdings of financial instruments. The objective of market risk management is to manage and control market exposures, within tolerances.
The Group enters into derivatives, and also incurs financial liabilities, in order to manage market risks relating to fuel prices, foreign exchange rates and interest rates. All such transactions are carried out within the guidelines set by the Board in the Treasury Risk Management Policy. Generally the Group seeks to apply hedge accounting in order to manage volatility in profit or loss.
(i) Fuel price riskPrice risk arises on the Group’s exposure to jet fuel prices. The Group’s fuel price risk management strategy aims to provide the airline with protection against sudden and significant increases in fuel prices while ensuring that the airline is not competitively disadvantaged in the event of a substantial decline in the price of fuel.
Risk managementGroup Treasury is responsible for managing this exposure by using commodity swap, option contracts and other fuel related derivative contracts. These contracts are designated at Group level as hedges of price risk on specific volumes of future jet fuel consumption. The Group’s risk management policy is to hedge anticipated jet fuel consumption for subsequent financial periods subject to limits determined by the Board. Realised gains or losses on these contracts arise due to differences between the actual fuel prices on settlement, the forward rates of the derivative contracts and the cost of option premiums paid.
During the year, the net gain arising from fuel hedging activities for the Group was $35.4 million (2013: gain of $42.3 million). Of this net amount, a gain of $80.9 million (2013: loss of $6.8 million) represents the realised element of the hedges which has been recognised in fuel expense, and a loss of $45.5 million (2013: gain of $49.1 million) represents the unrealised element of the hedges (including changes in option time value) and realised option premium which has been recognised in ineffective cash flow hedges and non-designated derivatives (losses)/gains.
Sensitivity analysisThe following table summarises the sensitivity of the Group’s financial assets and liabilities to a reasonably possible change in fuel prices. An AUD 30 (2013: AUD 30) per barrel (bbl) increase/(decrease) in the price of fuel (with no change in refining margin) would have increased/(decreased) equity and the profit or loss (before tax) by the amounts shown below. This analysis assumes that all other variables remain constant and based on the designated hedge relationship as at the reporting dates. The analysis is performed on the same basis for 2013.
AUD 30/bbl increase AUD 30/bbl decrease
Carrying amount
$mProfit/(loss)
$mEquity
$mProfit/(loss)
$mEquity
$m
2014
Net financial asset
– Derivative asset 15.2 38.0 95.2 (28.0) (62.4)
2013
Net financial asset
– Derivative asset 54.9 180.7 18.6 (140.5) (18.3)
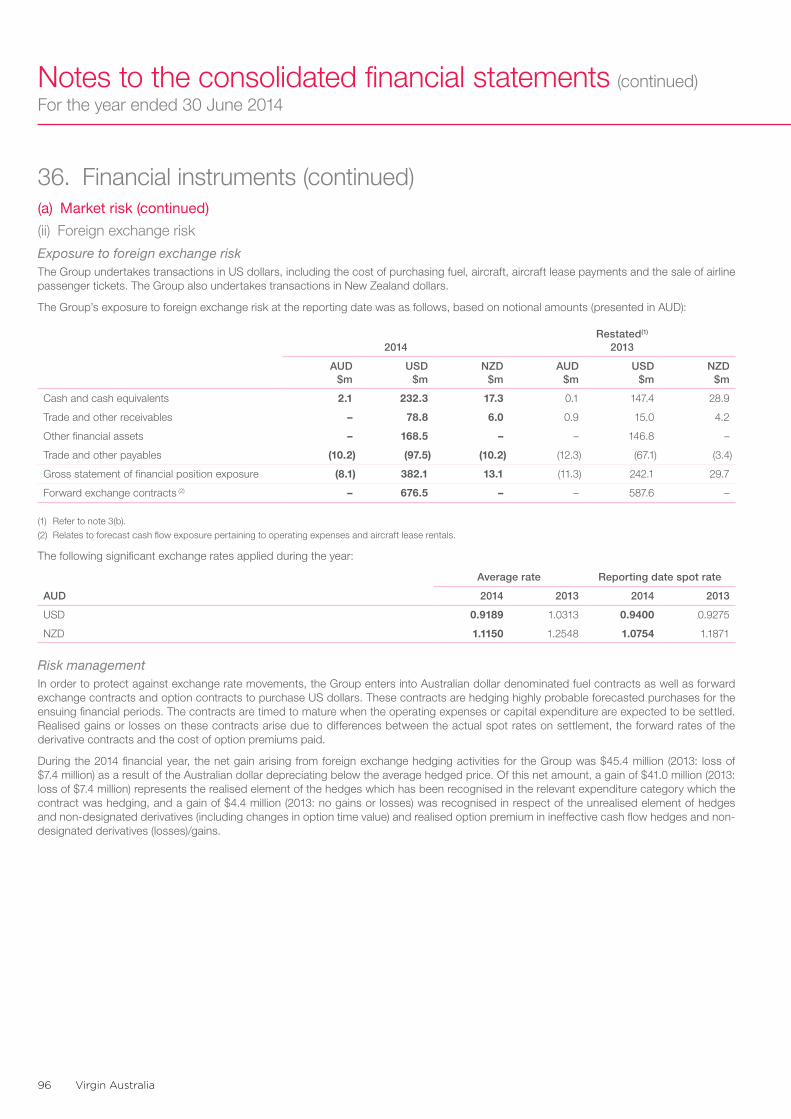
Virgin Australia96
Notes to the consolidated financial statements (continued)For the year ended 30 June 2014
36. Financial instruments (continued)(a) Market risk (continued)
(ii) Foreign exchange risk
Exposure to foreign exchange riskThe Group undertakes transactions in US dollars, including the cost of purchasing fuel, aircraft, aircraft lease payments and the sale of airline passenger tickets. The Group also undertakes transactions in New Zealand dollars.
The Group’s exposure to foreign exchange risk at the reporting date was as follows, based on notional amounts (presented in AUD):
2014Restated(1)
2013
AUD $m
USD $m
NZD $m
AUD $m
USD $m
NZD $m
Cash and cash equivalents 2.1 232.3 17.3 0.1 147.4 28.9
Trade and other receivables – 78.8 6.0 0.9 15.0 4.2
Other financial assets – 168.5 – – 146.8 –
Trade and other payables (10.2) (97.5) (10.2) (12.3) (67.1) (3.4)
Gross statement of financial position exposure (8.1) 382.1 13.1 (11.3) 242.1 29.7
Forward exchange contracts (2) – 676.5 – – 587.6 –
(1) Refer to note 3(b).
(2) Relates to forecast cash flow exposure pertaining to operating expenses and aircraft lease rentals.
The following significant exchange rates applied during the year:
Average rate Reporting date spot rate
AUD 2014 2013 2014 2013
USD 0.9189 1.0313 0.9400 0.9275
NZD 1.1150 1.2548 1.0754 1.1871
Risk managementIn order to protect against exchange rate movements, the Group enters into Australian dollar denominated fuel contracts as well as forward exchange contracts and option contracts to purchase US dollars. These contracts are hedging highly probable forecasted purchases for the ensuing financial periods. The contracts are timed to mature when the operating expenses or capital expenditure are expected to be settled. Realised gains or losses on these contracts arise due to differences between the actual spot rates on settlement, the forward rates of the derivative contracts and the cost of option premiums paid.
During the 2014 financial year, the net gain arising from foreign exchange hedging activities for the Group was $45.4 million (2013: loss of $7.4 million) as a result of the Australian dollar depreciating below the average hedged price. Of this net amount, a gain of $41.0 million (2013: loss of $7.4 million) represents the realised element of the hedges which has been recognised in the relevant expenditure category which the contract was hedging, and a gain of $4.4 million (2013: no gains or losses) was recognised in respect of the unrealised element of hedges and non-designated derivatives (including changes in option time value) and realised option premium in ineffective cash flow hedges and non-designated derivatives (losses)/gains.
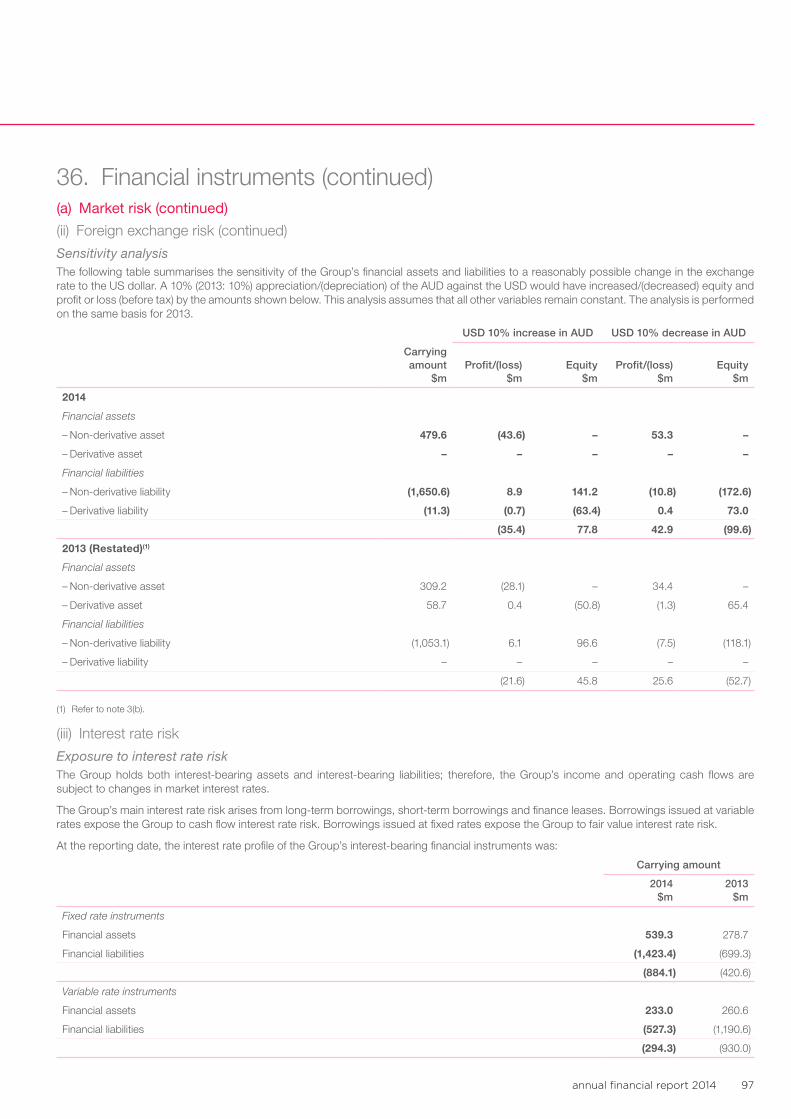
annual financial report 2014 97
36. Financial instruments (continued)(a) Market risk (continued)
(ii) Foreign exchange risk (continued)
Sensitivity analysisThe following table summarises the sensitivity of the Group’s financial assets and liabilities to a reasonably possible change in the exchange rate to the US dollar. A 10% (2013: 10%) appreciation/(depreciation) of the AUD against the USD would have increased/(decreased) equity and profit or loss (before tax) by the amounts shown below. This analysis assumes that all other variables remain constant. The analysis is performed on the same basis for 2013.
USD 10% increase in AUD USD 10% decrease in AUD
Carrying amount
$mProfit/(loss)
$mEquity
$mProfit/(loss)
$mEquity
$m
2014
Financial assets
– Non-derivative asset 479.6 (43.6) – 53.3 –
– Derivative asset – – – – –
Financial liabilities
– Non-derivative liability (1,650.6) 8.9 141.2 (10.8) (172.6)
– Derivative liability (11.3) (0.7) (63.4) 0.4 73.0
(35.4) 77.8 42.9 (99.6)
2013 (Restated)(1)
Financial assets
– Non-derivative asset 309.2 (28.1) – 34.4 –
– Derivative asset 58.7 0.4 (50.8) (1.3) 65.4
Financial liabilities
– Non-derivative liability (1,053.1) 6.1 96.6 (7.5) (118.1)
– Derivative liability – – – – –
(21.6) 45.8 25.6 (52.7)
(1) Refer to note 3(b).
(iii) Interest rate risk
Exposure to interest rate riskThe Group holds both interest-bearing assets and interest-bearing liabilities; therefore, the Group’s income and operating cash flows are subject to changes in market interest rates.
The Group’s main interest rate risk arises from long-term borrowings, short-term borrowings and finance leases. Borrowings issued at variable rates expose the Group to cash flow interest rate risk. Borrowings issued at fixed rates expose the Group to fair value interest rate risk.
At the reporting date, the interest rate profile of the Group’s interest-bearing financial instruments was:
Carrying amount
2014 $m
2013 $m
Fixed rate instruments
Financial assets 539.3 278.7
Financial liabilities (1,423.4) (699.3)
(884.1) (420.6)
Variable rate instruments
Financial assets 233.0 260.6
Financial liabilities (527.3) (1,190.6)
(294.3) (930.0)
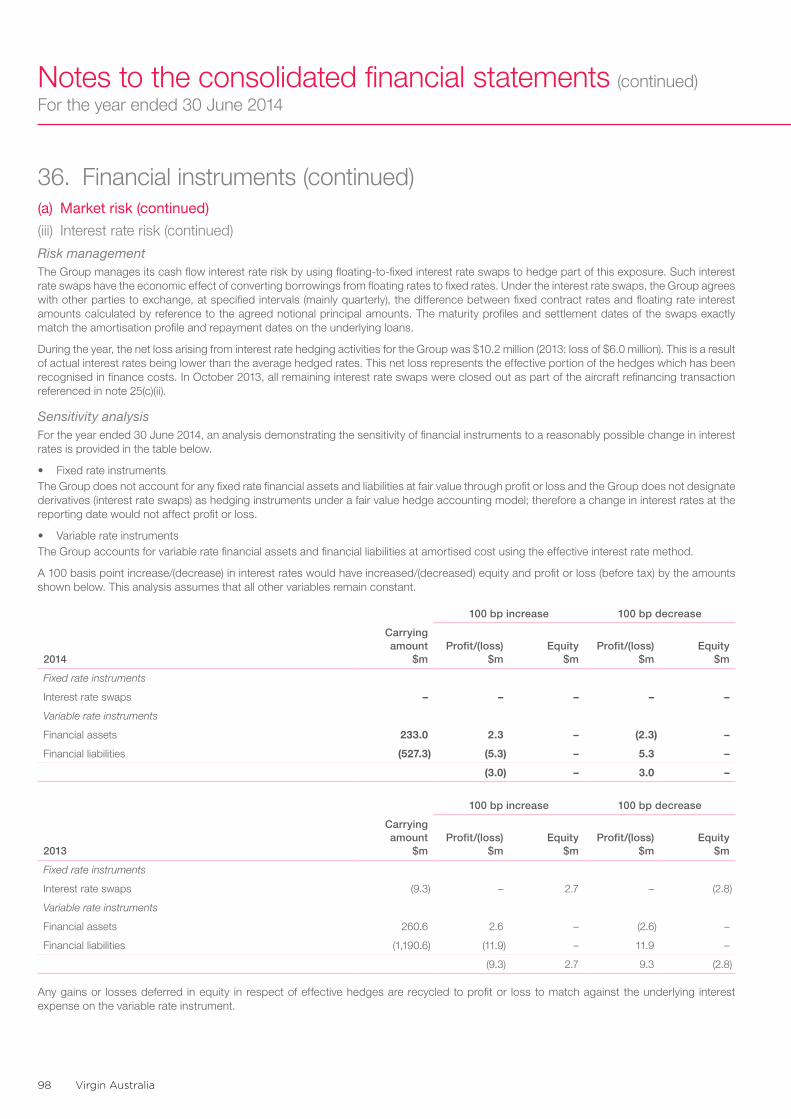
Virgin Australia98
Notes to the consolidated financial statements (continued)For the year ended 30 June 2014
36. Financial instruments (continued)(a) Market risk (continued)
(iii) Interest rate risk (continued)
Risk managementThe Group manages its cash flow interest rate risk by using floating-to-fixed interest rate swaps to hedge part of this exposure. Such interest rate swaps have the economic effect of converting borrowings from floating rates to fixed rates. Under the interest rate swaps, the Group agrees with other parties to exchange, at specified intervals (mainly quarterly), the difference between fixed contract rates and floating rate interest amounts calculated by reference to the agreed notional principal amounts. The maturity profiles and settlement dates of the swaps exactly match the amortisation profile and repayment dates on the underlying loans.
During the year, the net loss arising from interest rate hedging activities for the Group was $10.2 million (2013: loss of $6.0 million). This is a result of actual interest rates being lower than the average hedged rates. This net loss represents the effective portion of the hedges which has been recognised in finance costs. In October 2013, all remaining interest rate swaps were closed out as part of the aircraft refinancing transaction referenced in note 25(c)(ii).
Sensitivity analysisFor the year ended 30 June 2014, an analysis demonstrating the sensitivity of financial instruments to a reasonably possible change in interest rates is provided in the table below.
• Fixed rate instrumentsThe Group does not account for any fixed rate financial assets and liabilities at fair value through profit or loss and the Group does not designate derivatives (interest rate swaps) as hedging instruments under a fair value hedge accounting model; therefore a change in interest rates at the reporting date would not affect profit or loss.
• Variable rate instrumentsThe Group accounts for variable rate financial assets and financial liabilities at amortised cost using the effective interest rate method.
A 100 basis point increase/(decrease) in interest rates would have increased/(decreased) equity and profit or loss (before tax) by the amounts shown below. This analysis assumes that all other variables remain constant.
100 bp increase 100 bp decrease
2014
Carrying amount
$mProfit/(loss)
$mEquity
$mProfit/(loss)
$mEquity
$m
Fixed rate instruments
Interest rate swaps – – – – –
Variable rate instruments
Financial assets 233.0 2.3 – (2.3) –
Financial liabilities (527.3) (5.3) – 5.3 –
(3.0) – 3.0 –
100 bp increase 100 bp decrease
2013
Carrying amount
$mProfit/(loss)
$mEquity
$mProfit/(loss)
$mEquity
$m
Fixed rate instruments
Interest rate swaps (9.3) – 2.7 – (2.8)
Variable rate instruments
Financial assets 260.6 2.6 – (2.6) –
Financial liabilities (1,190.6) (11.9) – 11.9 –
(9.3) 2.7 9.3 (2.8)
Any gains or losses deferred in equity in respect of effective hedges are recycled to profit or loss to match against the underlying interest expense on the variable rate instrument.
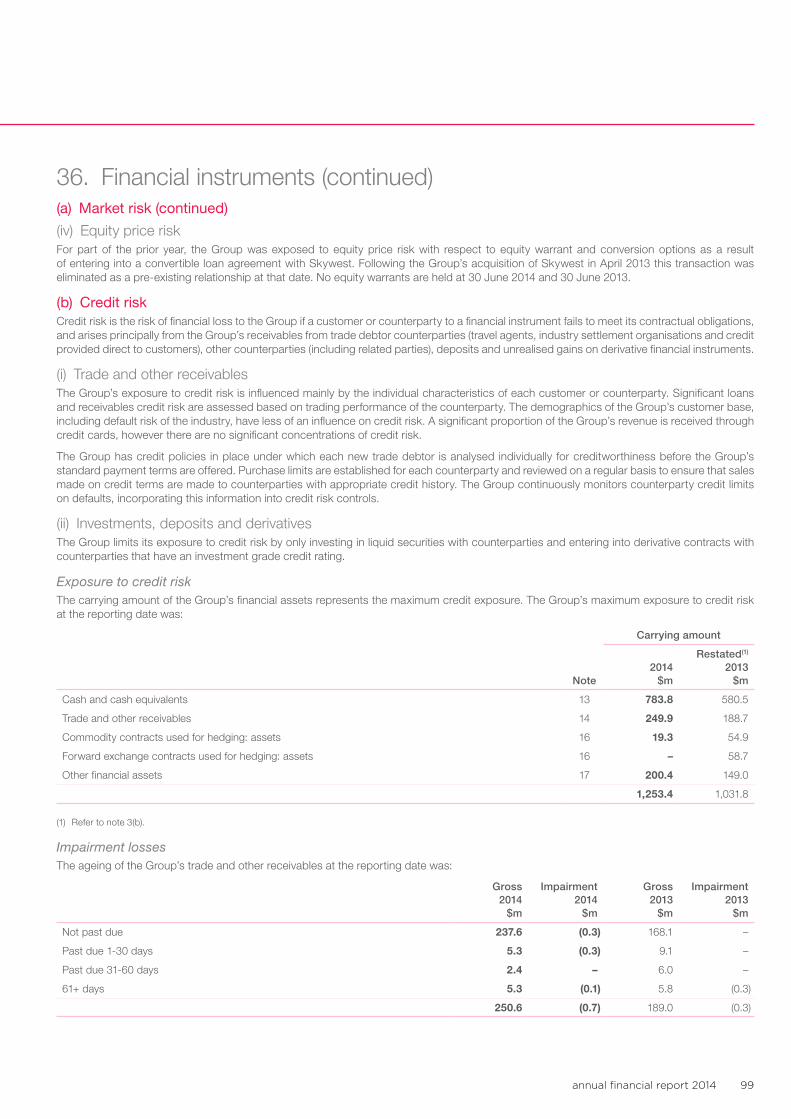
annual financial report 2014 99
36. Financial instruments (continued)(a) Market risk (continued)
(iv) Equity price riskFor part of the prior year, the Group was exposed to equity price risk with respect to equity warrant and conversion options as a result of entering into a convertible loan agreement with Skywest. Following the Group’s acquisition of Skywest in April 2013 this transaction was eliminated as a pre-existing relationship at that date. No equity warrants are held at 30 June 2014 and 30 June 2013.
(b) Credit riskCredit risk is the risk of financial loss to the Group if a customer or counterparty to a financial instrument fails to meet its contractual obligations, and arises principally from the Group’s receivables from trade debtor counterparties (travel agents, industry settlement organisations and credit provided direct to customers), other counterparties (including related parties), deposits and unrealised gains on derivative financial instruments.
(i) Trade and other receivablesThe Group’s exposure to credit risk is influenced mainly by the individual characteristics of each customer or counterparty. Significant loans and receivables credit risk are assessed based on trading performance of the counterparty. The demographics of the Group’s customer base, including default risk of the industry, have less of an influence on credit risk. A significant proportion of the Group’s revenue is received through credit cards, however there are no significant concentrations of credit risk.
The Group has credit policies in place under which each new trade debtor is analysed individually for creditworthiness before the Group’s standard payment terms are offered. Purchase limits are established for each counterparty and reviewed on a regular basis to ensure that sales made on credit terms are made to counterparties with appropriate credit history. The Group continuously monitors counterparty credit limits on defaults, incorporating this information into credit risk controls.
(ii) Investments, deposits and derivativesThe Group limits its exposure to credit risk by only investing in liquid securities with counterparties and entering into derivative contracts with counterparties that have an investment grade credit rating.
Exposure to credit riskThe carrying amount of the Group’s financial assets represents the maximum credit exposure. The Group’s maximum exposure to credit risk at the reporting date was:
Carrying amount
Note2014
$m
Restated(1) 2013
$m
Cash and cash equivalents 13 783.8 580.5
Trade and other receivables 14 249.9 188.7
Commodity contracts used for hedging: assets 16 19.3 54.9
Forward exchange contracts used for hedging: assets 16 – 58.7
Other financial assets 17 200.4 149.0
1,253.4 1,031.8
(1) Refer to note 3(b).
Impairment lossesThe ageing of the Group’s trade and other receivables at the reporting date was:
Gross 2014
$m
Impairment 2014
$m
Gross 2013
$m
Impairment 2013
$m
Not past due 237.6 (0.3) 168.1 –
Past due 1-30 days 5.3 (0.3) 9.1 –
Past due 31-60 days 2.4 – 6.0 –
61+ days 5.3 (0.1) 5.8 (0.3)
250.6 (0.7) 189.0 (0.3)
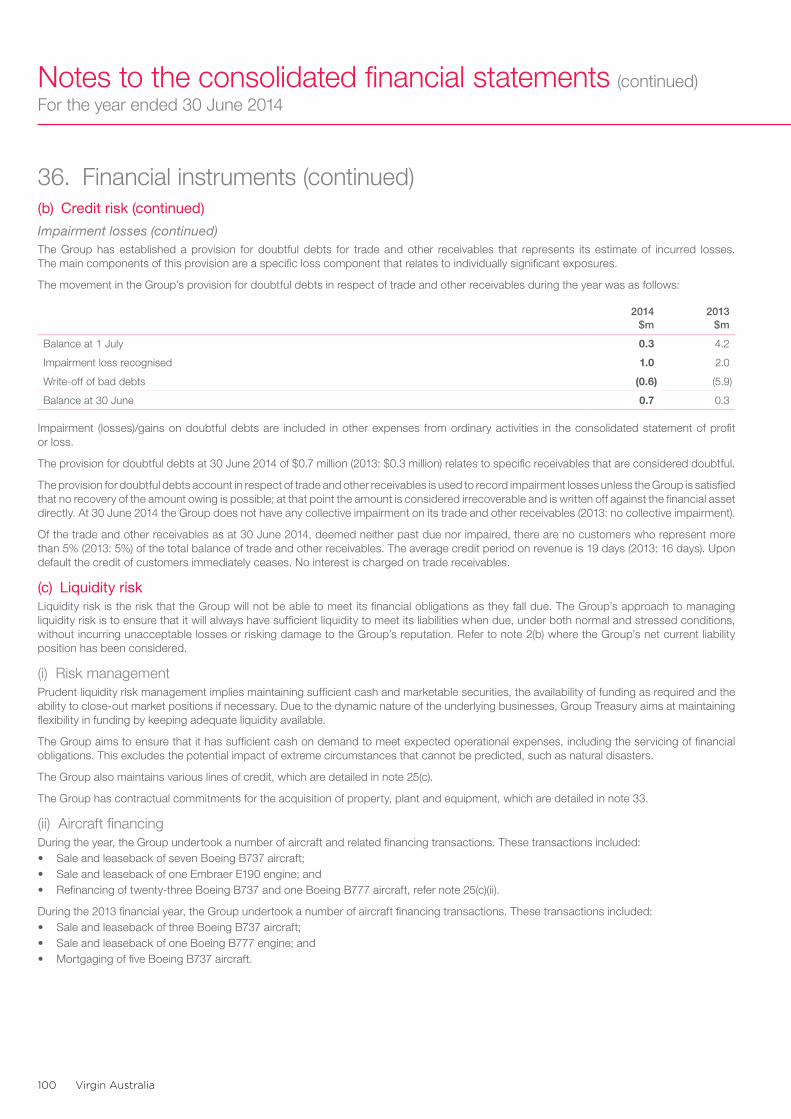
Virgin Australia100
Notes to the consolidated financial statements (continued)For the year ended 30 June 2014
36. Financial instruments (continued)(b) Credit risk (continued)
Impairment losses (continued)The Group has established a provision for doubtful debts for trade and other receivables that represents its estimate of incurred losses. The main components of this provision are a specific loss component that relates to individually significant exposures.
The movement in the Group’s provision for doubtful debts in respect of trade and other receivables during the year was as follows:
2014 $m
2013 $m
Balance at 1 July 0.3 4.2
Impairment loss recognised 1.0 2.0
Write-off of bad debts (0.6) (5.9)
Balance at 30 June 0.7 0.3
Impairment (losses)/gains on doubtful debts are included in other expenses from ordinary activities in the consolidated statement of profit or loss.
The provision for doubtful debts at 30 June 2014 of $0.7 million (2013: $0.3 million) relates to specific receivables that are considered doubtful.
The provision for doubtful debts account in respect of trade and other receivables is used to record impairment losses unless the Group is satisfied that no recovery of the amount owing is possible; at that point the amount is considered irrecoverable and is written off against the financial asset directly. At 30 June 2014 the Group does not have any collective impairment on its trade and other receivables (2013: no collective impairment).
Of the trade and other receivables as at 30 June 2014, deemed neither past due nor impaired, there are no customers who represent more than 5% (2013: 5%) of the total balance of trade and other receivables. The average credit period on revenue is 19 days (2013: 16 days). Upon default the credit of customers immediately ceases. No interest is charged on trade receivables.
(c) Liquidity riskLiquidity risk is the risk that the Group will not be able to meet its financial obligations as they fall due. The Group’s approach to managing liquidity risk is to ensure that it will always have sufficient liquidity to meet its liabilities when due, under both normal and stressed conditions, without incurring unacceptable losses or risking damage to the Group’s reputation. Refer to note 2(b) where the Group’s net current liability position has been considered.
(i) Risk managementPrudent liquidity risk management implies maintaining sufficient cash and marketable securities, the availability of funding as required and the ability to close-out market positions if necessary. Due to the dynamic nature of the underlying businesses, Group Treasury aims at maintaining flexibility in funding by keeping adequate liquidity available.
The Group aims to ensure that it has sufficient cash on demand to meet expected operational expenses, including the servicing of financial obligations. This excludes the potential impact of extreme circumstances that cannot be predicted, such as natural disasters.
The Group also maintains various lines of credit, which are detailed in note 25(c).
The Group has contractual commitments for the acquisition of property, plant and equipment, which are detailed in note 33.
(ii) Aircraft financingDuring the year, the Group undertook a number of aircraft and related financing transactions. These transactions included:• Sale and leaseback of seven Boeing B737 aircraft;• Sale and leaseback of one Embraer E190 engine; and• Refinancing of twenty-three Boeing B737 and one Boeing B777 aircraft, refer note 25(c)(ii).
During the 2013 financial year, the Group undertook a number of aircraft financing transactions. These transactions included:• Sale and leaseback of three Boeing B737 aircraft;• Sale and leaseback of one Boeing B777 engine; and• Mortgaging of five Boeing B737 aircraft.
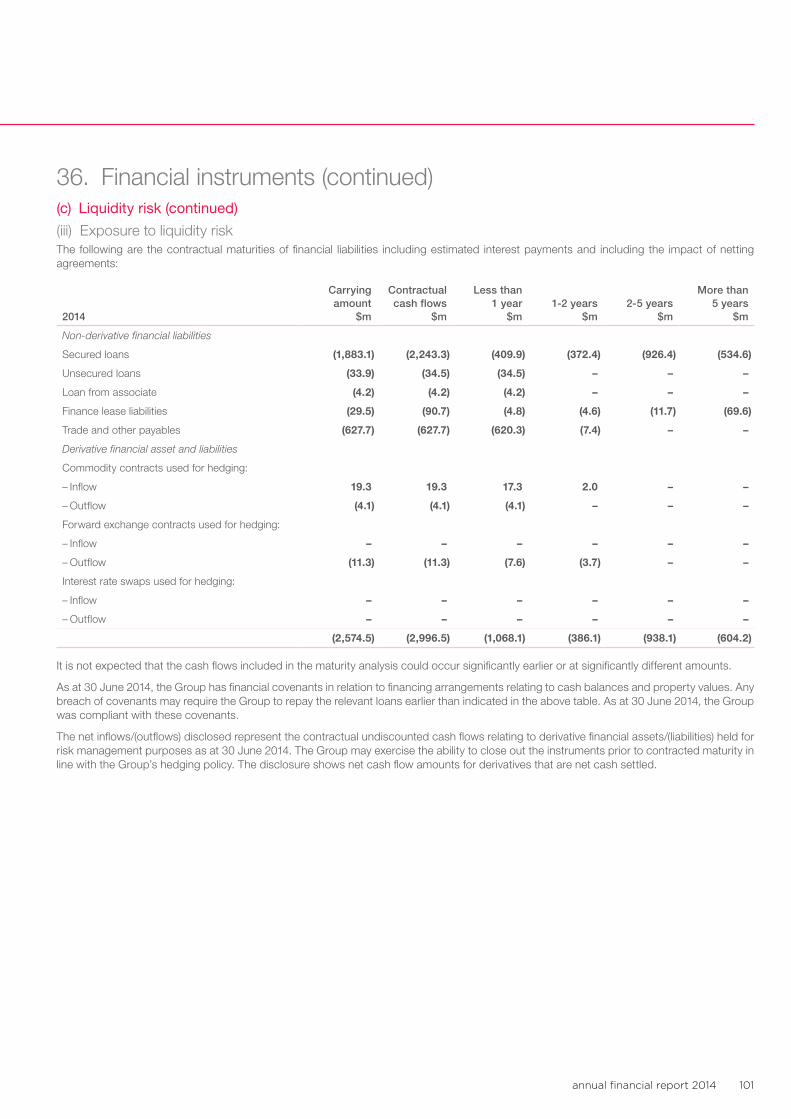
annual financial report 2014 101
36. Financial instruments (continued)(c) Liquidity risk (continued)
(iii) Exposure to liquidity riskThe following are the contractual maturities of financial liabilities including estimated interest payments and including the impact of netting agreements:
2014
Carrying amount
$m
Contractual cash flows
$m
Less than 1 year
$m1-2 years
$m2-5 years
$m
More than 5 years
$m
Non-derivative financial liabilities
Secured loans (1,883.1) (2,243.3) (409.9) (372.4) (926.4) (534.6)
Unsecured loans (33.9) (34.5) (34.5) – – –
Loan from associate (4.2) (4.2) (4.2) – – –
Finance lease liabilities (29.5) (90.7) (4.8) (4.6) (11.7) (69.6)
Trade and other payables (627.7) (627.7) (620.3) (7.4) – –
Derivative financial asset and liabilities
Commodity contracts used for hedging:
– Inflow 19.3 19.3 17.3 2.0 – –
– Outflow (4.1) (4.1) (4.1) – – –
Forward exchange contracts used for hedging:
– Inflow – – – – – –
– Outflow (11.3) (11.3) (7.6) (3.7) – –
Interest rate swaps used for hedging:
– Inflow – – – – – –
– Outflow – – – – – –
(2,574.5) (2,996.5) (1,068.1) (386.1) (938.1) (604.2)
It is not expected that the cash flows included in the maturity analysis could occur significantly earlier or at significantly different amounts.
As at 30 June 2014, the Group has financial covenants in relation to financing arrangements relating to cash balances and property values. Any breach of covenants may require the Group to repay the relevant loans earlier than indicated in the above table. As at 30 June 2014, the Group was compliant with these covenants.
The net inflows/(outflows) disclosed represent the contractual undiscounted cash flows relating to derivative financial assets/(liabilities) held for risk management purposes as at 30 June 2014. The Group may exercise the ability to close out the instruments prior to contracted maturity in line with the Group’s hedging policy. The disclosure shows net cash flow amounts for derivatives that are net cash settled.
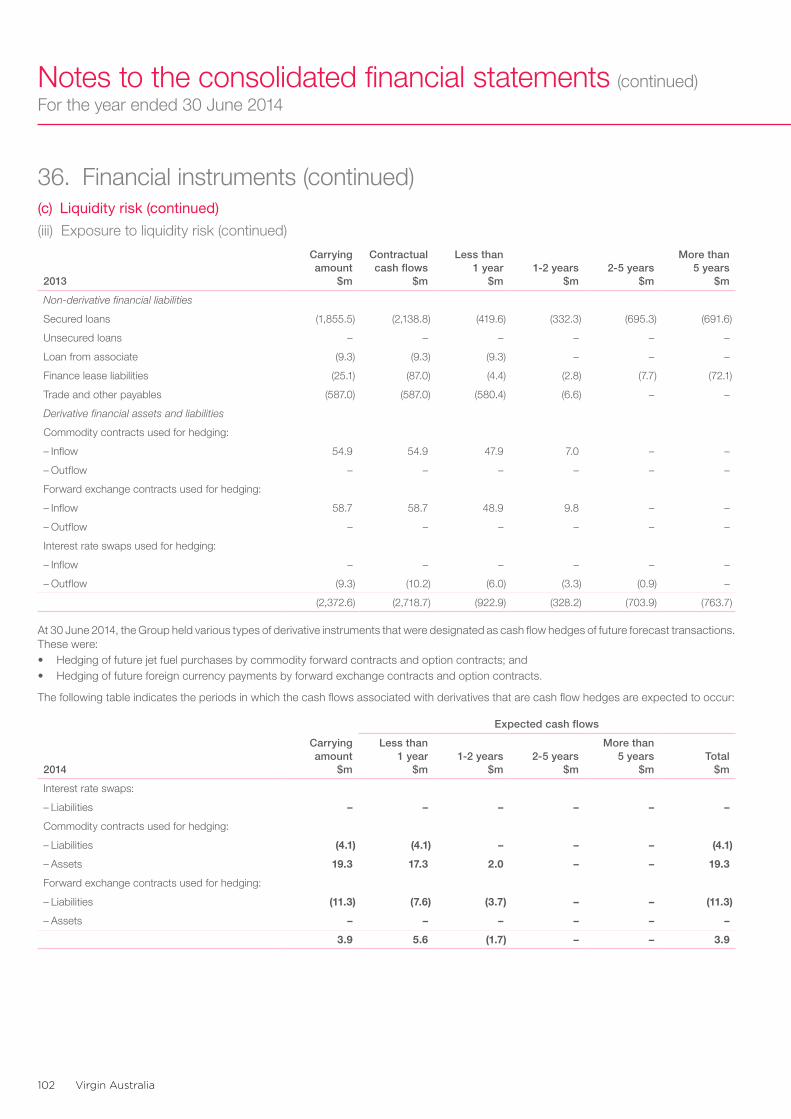
Virgin Australia102
Notes to the consolidated financial statements (continued)For the year ended 30 June 2014
36. Financial instruments (continued)(c) Liquidity risk (continued)
(iii) Exposure to liquidity risk (continued)
2013
Carrying amount
$m
Contractual cash flows
$m
Less than 1 year
$m1-2 years
$m2-5 years
$m
More than 5 years
$m
Non-derivative financial liabilities
Secured loans (1,855.5) (2,138.8) (419.6) (332.3) (695.3) (691.6)
Unsecured loans – – – – – –
Loan from associate (9.3) (9.3) (9.3) – – –
Finance lease liabilities (25.1) (87.0) (4.4) (2.8) (7.7) (72.1)
Trade and other payables (587.0) (587.0) (580.4) (6.6) – –
Derivative financial assets and liabilities
Commodity contracts used for hedging:
– Inflow 54.9 54.9 47.9 7.0 – –
– Outflow – – – – – –
Forward exchange contracts used for hedging:
– Inflow 58.7 58.7 48.9 9.8 – –
– Outflow – – – – – –
Interest rate swaps used for hedging:
– Inflow – – – – – –
– Outflow (9.3) (10.2) (6.0) (3.3) (0.9) –
(2,372.6) (2,718.7) (922.9) (328.2) (703.9) (763.7)
At 30 June 2014, the Group held various types of derivative instruments that were designated as cash flow hedges of future forecast transactions. These were:• Hedging of future jet fuel purchases by commodity forward contracts and option contracts; and• Hedging of future foreign currency payments by forward exchange contracts and option contracts.
The following table indicates the periods in which the cash flows associated with derivatives that are cash flow hedges are expected to occur:
Expected cash flows
2014
Carrying amount
$m
Less than 1 year
$m1-2 years
$m2-5 years
$m
More than 5 years
$mTotal
$m
Interest rate swaps:
– Liabilities – – – – – –
Commodity contracts used for hedging:
– Liabilities (4.1) (4.1) – – – (4.1)
– Assets 19.3 17.3 2.0 – – 19.3
Forward exchange contracts used for hedging:
– Liabilities (11.3) (7.6) (3.7) – – (11.3)
– Assets – – – – – –
3.9 5.6 (1.7) – – 3.9
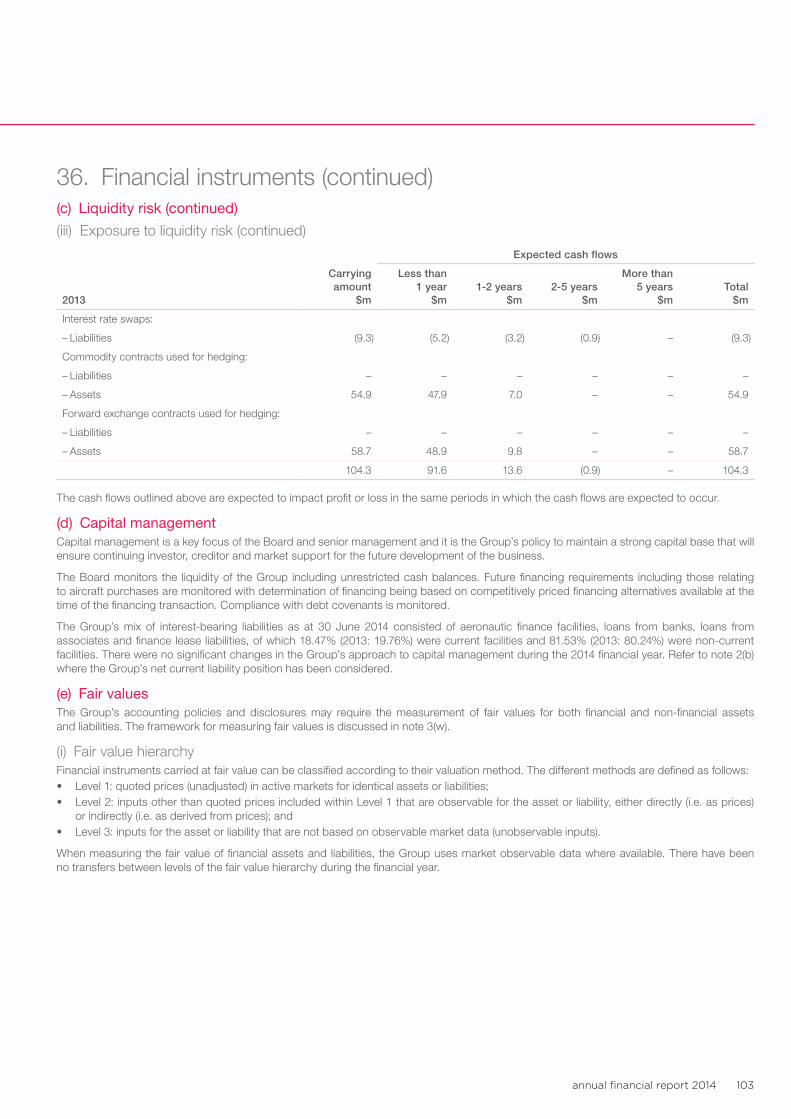
annual financial report 2014 103
36. Financial instruments (continued)(c) Liquidity risk (continued)
(iii) Exposure to liquidity risk (continued)
Expected cash flows
2013
Carrying amount
$m
Less than 1 year
$m1-2 years
$m2-5 years
$m
More than 5 years
$mTotal
$m
Interest rate swaps:
– Liabilities (9.3) (5.2) (3.2) (0.9) – (9.3)
Commodity contracts used for hedging:
– Liabilities – – – – – –
– Assets 54.9 47.9 7.0 – – 54.9
Forward exchange contracts used for hedging:
– Liabilities – – – – – –
– Assets 58.7 48.9 9.8 – – 58.7
104.3 91.6 13.6 (0.9) – 104.3
The cash flows outlined above are expected to impact profit or loss in the same periods in which the cash flows are expected to occur.
(d) Capital managementCapital management is a key focus of the Board and senior management and it is the Group’s policy to maintain a strong capital base that will ensure continuing investor, creditor and market support for the future development of the business.
The Board monitors the liquidity of the Group including unrestricted cash balances. Future financing requirements including those relating to aircraft purchases are monitored with determination of financing being based on competitively priced financing alternatives available at the time of the financing transaction. Compliance with debt covenants is monitored.
The Group’s mix of interest-bearing liabilities as at 30 June 2014 consisted of aeronautic finance facilities, loans from banks, loans from associates and finance lease liabilities, of which 18.47% (2013: 19.76%) were current facilities and 81.53% (2013: 80.24%) were non-current facilities. There were no significant changes in the Group’s approach to capital management during the 2014 financial year. Refer to note 2(b) where the Group’s net current liability position has been considered.
(e) Fair valuesThe Group’s accounting policies and disclosures may require the measurement of fair values for both financial and non-financial assets and liabilities. The framework for measuring fair values is discussed in note 3(w).
(i) Fair value hierarchyFinancial instruments carried at fair value can be classified according to their valuation method. The different methods are defined as follows: • Level 1: quoted prices (unadjusted) in active markets for identical assets or liabilities;• Level 2: inputs other than quoted prices included within Level 1 that are observable for the asset or liability, either directly (i.e. as prices)
or indirectly (i.e. as derived from prices); and• Level 3: inputs for the asset or liability that are not based on observable market data (unobservable inputs).
When measuring the fair value of financial assets and liabilities, the Group uses market observable data where available. There have been no transfers between levels of the fair value hierarchy during the financial year.
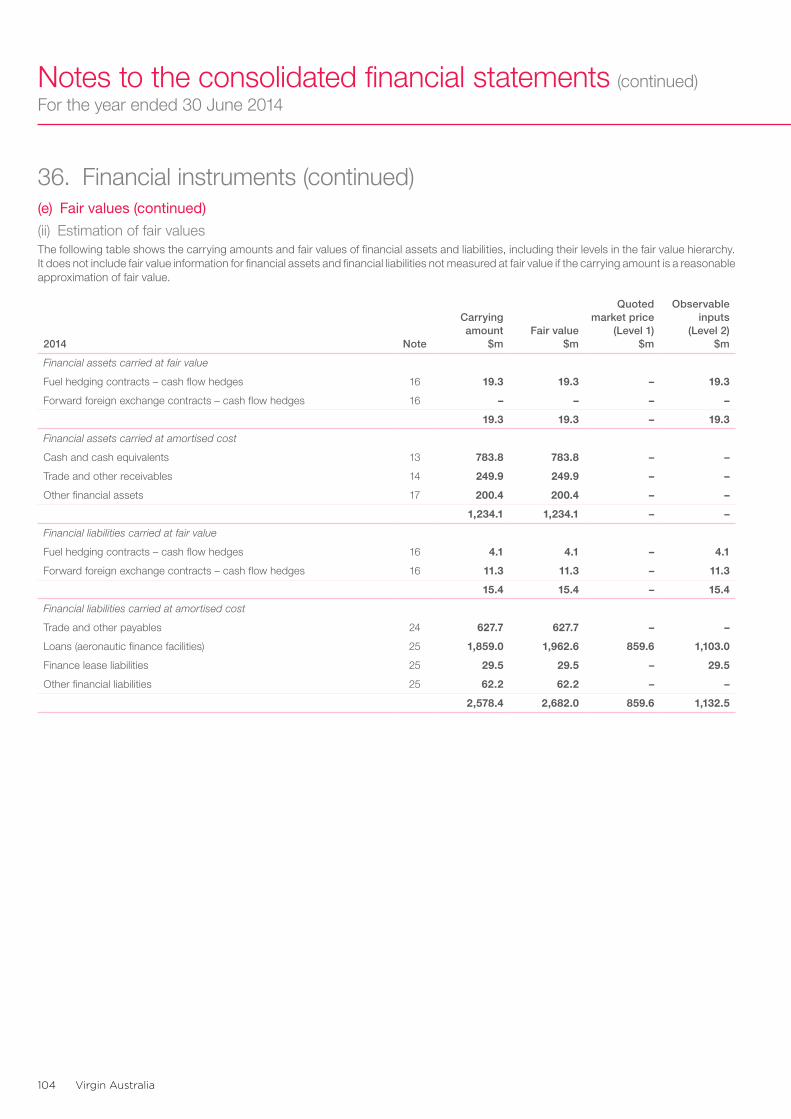
Virgin Australia104
Notes to the consolidated financial statements (continued)For the year ended 30 June 2014
36. Financial instruments (continued)(e) Fair values (continued)
(ii) Estimation of fair valuesThe following table shows the carrying amounts and fair values of financial assets and liabilities, including their levels in the fair value hierarchy. It does not include fair value information for financial assets and financial liabilities not measured at fair value if the carrying amount is a reasonable approximation of fair value.
2014 Note
Carrying amount
$mFair value
$m
Quoted market price
(Level 1) $m
Observable inputs
(Level 2) $m
Financial assets carried at fair value
Fuel hedging contracts – cash flow hedges 16 19.3 19.3 – 19.3
Forward foreign exchange contracts – cash flow hedges 16 – – – –
19.3 19.3 – 19.3
Financial assets carried at amortised cost
Cash and cash equivalents 13 783.8 783.8 – –
Trade and other receivables 14 249.9 249.9 – –
Other financial assets 17 200.4 200.4 – –
1,234.1 1,234.1 – –
Financial liabilities carried at fair value
Fuel hedging contracts – cash flow hedges 16 4.1 4.1 – 4.1
Forward foreign exchange contracts – cash flow hedges 16 11.3 11.3 – 11.3
15.4 15.4 – 15.4
Financial liabilities carried at amortised cost
Trade and other payables 24 627.7 627.7 – –
Loans (aeronautic finance facilities) 25 1,859.0 1,962.6 859.6 1,103.0
Finance lease liabilities 25 29.5 29.5 – 29.5
Other financial liabilities 25 62.2 62.2 – –
2,578.4 2,682.0 859.6 1,132.5
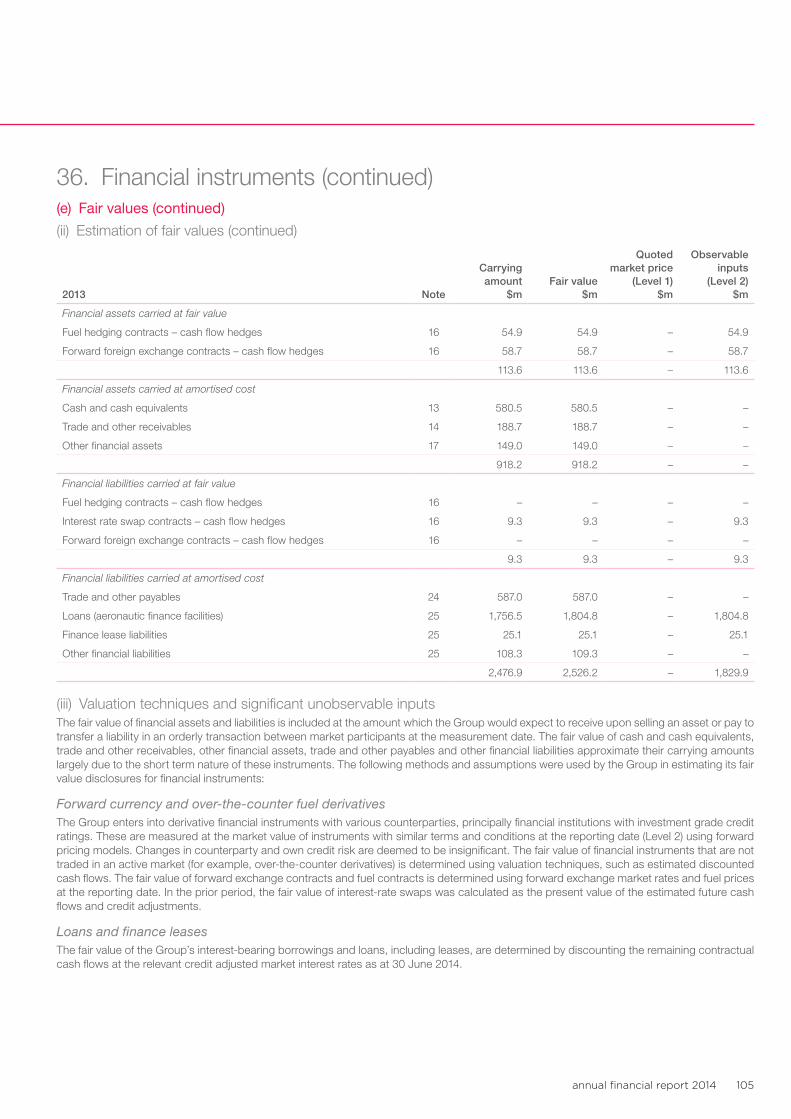
annual financial report 2014 105
36. Financial instruments (continued)(e) Fair values (continued)
(ii) Estimation of fair values (continued)
2013 Note
Carrying amount
$mFair value
$m
Quoted market price
(Level 1) $m
Observable inputs
(Level 2) $m
Financial assets carried at fair value
Fuel hedging contracts – cash flow hedges 16 54.9 54.9 – 54.9
Forward foreign exchange contracts – cash flow hedges 16 58.7 58.7 – 58.7
113.6 113.6 – 113.6
Financial assets carried at amortised cost
Cash and cash equivalents 13 580.5 580.5 – –
Trade and other receivables 14 188.7 188.7 – –
Other financial assets 17 149.0 149.0 – –
918.2 918.2 – –
Financial liabilities carried at fair value
Fuel hedging contracts – cash flow hedges 16 – – – –
Interest rate swap contracts – cash flow hedges 16 9.3 9.3 – 9.3
Forward foreign exchange contracts – cash flow hedges 16 – – – –
9.3 9.3 – 9.3
Financial liabilities carried at amortised cost
Trade and other payables 24 587.0 587.0 – –
Loans (aeronautic finance facilities) 25 1,756.5 1,804.8 – 1,804.8
Finance lease liabilities 25 25.1 25.1 – 25.1
Other financial liabilities 25 108.3 109.3 – –
2,476.9 2,526.2 – 1,829.9
(iii) Valuation techniques and significant unobservable inputsThe fair value of financial assets and liabilities is included at the amount which the Group would expect to receive upon selling an asset or pay to transfer a liability in an orderly transaction between market participants at the measurement date. The fair value of cash and cash equivalents, trade and other receivables, other financial assets, trade and other payables and other financial liabilities approximate their carrying amounts largely due to the short term nature of these instruments. The following methods and assumptions were used by the Group in estimating its fair value disclosures for financial instruments:
Forward currency and over-the-counter fuel derivativesThe Group enters into derivative financial instruments with various counterparties, principally financial institutions with investment grade credit ratings. These are measured at the market value of instruments with similar terms and conditions at the reporting date (Level 2) using forward pricing models. Changes in counterparty and own credit risk are deemed to be insignificant. The fair value of financial instruments that are not traded in an active market (for example, over-the-counter derivatives) is determined using valuation techniques, such as estimated discounted cash flows. The fair value of forward exchange contracts and fuel contracts is determined using forward exchange market rates and fuel prices at the reporting date. In the prior period, the fair value of interest-rate swaps was calculated as the present value of the estimated future cash flows and credit adjustments.
Loans and finance leasesThe fair value of the Group’s interest-bearing borrowings and loans, including leases, are determined by discounting the remaining contractual cash flows at the relevant credit adjusted market interest rates as at 30 June 2014.
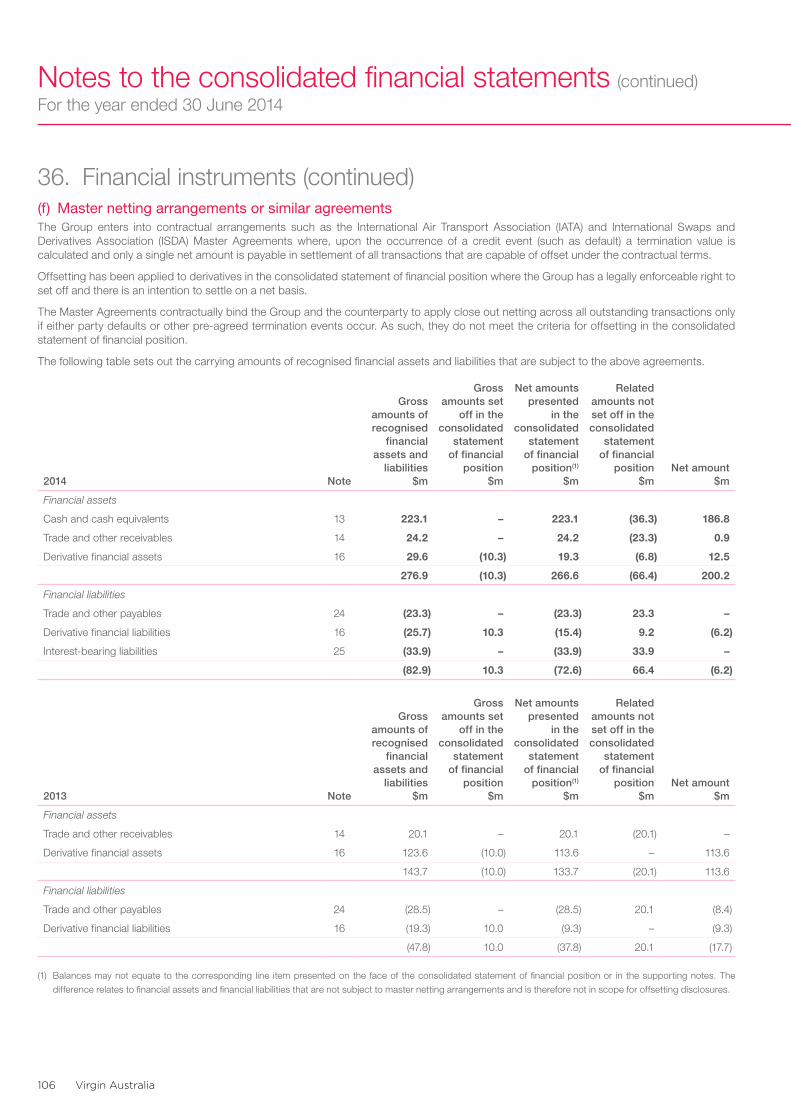
Virgin Australia106
Notes to the consolidated financial statements (continued)For the year ended 30 June 2014
36. Financial instruments (continued)(f) Master netting arrangements or similar agreementsThe Group enters into contractual arrangements such as the International Air Transport Association (IATA) and International Swaps and Derivatives Association (ISDA) Master Agreements where, upon the occurrence of a credit event (such as default) a termination value is calculated and only a single net amount is payable in settlement of all transactions that are capable of offset under the contractual terms.
Offsetting has been applied to derivatives in the consolidated statement of financial position where the Group has a legally enforceable right to set off and there is an intention to settle on a net basis.
The Master Agreements contractually bind the Group and the counterparty to apply close out netting across all outstanding transactions only if either party defaults or other pre-agreed termination events occur. As such, they do not meet the criteria for offsetting in the consolidated statement of financial position.
The following table sets out the carrying amounts of recognised financial assets and liabilities that are subject to the above agreements.
2014 Note
Gross amounts of recognised
financial assets and
liabilities $m
Gross amounts set
off in the consolidated
statement of financial
position $m
Net amounts presented
in the consolidated
statement of financial
position(1) $m
Related amounts not set off in the consolidated
statement of financial
position $m
Net amount $m
Financial assets
Cash and cash equivalents 13 223.1 – 223.1 (36.3) 186.8
Trade and other receivables 14 24.2 – 24.2 (23.3) 0.9
Derivative financial assets 16 29.6 (10.3) 19.3 (6.8) 12.5
276.9 (10.3) 266.6 (66.4) 200.2
Financial liabilities
Trade and other payables 24 (23.3) – (23.3) 23.3 –
Derivative financial liabilities 16 (25.7) 10.3 (15.4) 9.2 (6.2)
Interest-bearing liabilities 25 (33.9) – (33.9) 33.9 –
(82.9) 10.3 (72.6) 66.4 (6.2)
2013 Note
Gross amounts of recognised
financial assets and
liabilities $m
Gross amounts set
off in the consolidated
statement of financial
position $m
Net amounts presented
in the consolidated
statement of financial
position(1) $m
Related amounts not set off in the consolidated
statement of financial
position $m
Net amount $m
Financial assets
Trade and other receivables 14 20.1 – 20.1 (20.1) –
Derivative financial assets 16 123.6 (10.0) 113.6 – 113.6
143.7 (10.0) 133.7 (20.1) 113.6
Financial liabilities
Trade and other payables 24 (28.5) – (28.5) 20.1 (8.4)
Derivative financial liabilities 16 (19.3) 10.0 (9.3) – (9.3)
(47.8) 10.0 (37.8) 20.1 (17.7)
(1) Balances may not equate to the corresponding line item presented on the face of the consolidated statement of financial position or in the supporting notes. The
difference relates to financial assets and financial liabilities that are not subject to master netting arrangements and is therefore not in scope for offsetting disclosures.
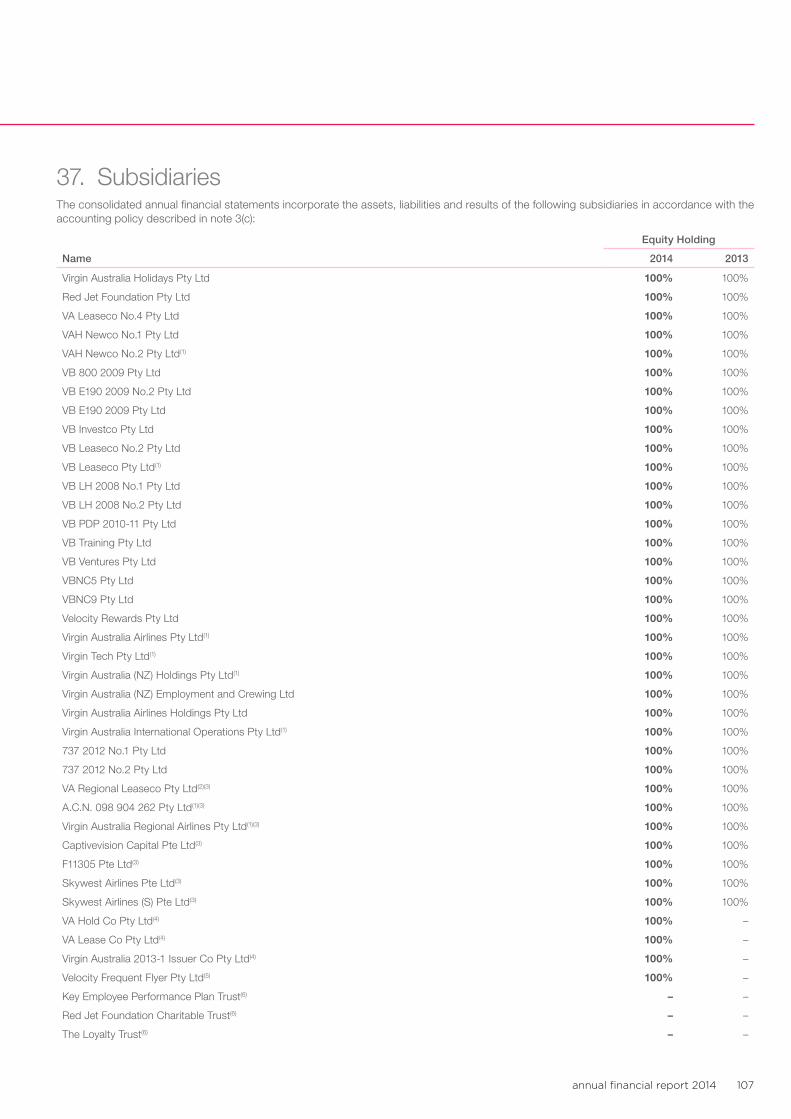
annual financial report 2014 107
37. SubsidiariesThe consolidated annual financial statements incorporate the assets, liabilities and results of the following subsidiaries in accordance with the accounting policy described in note 3(c):
Equity Holding
Name 2014 2013
Virgin Australia Holidays Pty Ltd 100% 100%
Red Jet Foundation Pty Ltd 100% 100%
VA Leaseco No.4 Pty Ltd 100% 100%
VAH Newco No.1 Pty Ltd 100% 100%
VAH Newco No.2 Pty Ltd(1) 100% 100%
VB 800 2009 Pty Ltd 100% 100%
VB E190 2009 No.2 Pty Ltd 100% 100%
VB E190 2009 Pty Ltd 100% 100%
VB Investco Pty Ltd 100% 100%
VB Leaseco No.2 Pty Ltd 100% 100%
VB Leaseco Pty Ltd(1) 100% 100%
VB LH 2008 No.1 Pty Ltd 100% 100%
VB LH 2008 No.2 Pty Ltd 100% 100%
VB PDP 2010-11 Pty Ltd 100% 100%
VB Training Pty Ltd 100% 100%
VB Ventures Pty Ltd 100% 100%
VBNC5 Pty Ltd 100% 100%
VBNC9 Pty Ltd 100% 100%
Velocity Rewards Pty Ltd 100% 100%
Virgin Australia Airlines Pty Ltd(1) 100% 100%
Virgin Tech Pty Ltd(1) 100% 100%
Virgin Australia (NZ) Holdings Pty Ltd(1) 100% 100%
Virgin Australia (NZ) Employment and Crewing Ltd 100% 100%
Virgin Australia Airlines Holdings Pty Ltd 100% 100%
Virgin Australia International Operations Pty Ltd(1) 100% 100%
737 2012 No.1 Pty Ltd 100% 100%
737 2012 No.2 Pty Ltd 100% 100%
VA Regional Leaseco Pty Ltd(2)(3) 100% 100%
A.C.N. 098 904 262 Pty Ltd(1)(3) 100% 100%
Virgin Australia Regional Airlines Pty Ltd(1)(3) 100% 100%
Captivevision Capital Pte Ltd(3) 100% 100%
F11305 Pte Ltd(3) 100% 100%
Skywest Airlines Pte Ltd(3) 100% 100%
Skywest Airlines (S) Pte Ltd(3) 100% 100%
VA Hold Co Pty Ltd(4) 100% –
VA Lease Co Pty Ltd(4) 100% –
Virgin Australia 2013-1 Issuer Co Pty Ltd (4) 100% –
Velocity Frequent Flyer Pty Ltd(5) 100% –
Key Employee Performance Plan Trust(6) – –
Red Jet Foundation Charitable Trust(6) – –
The Loyalty Trust(6) – –
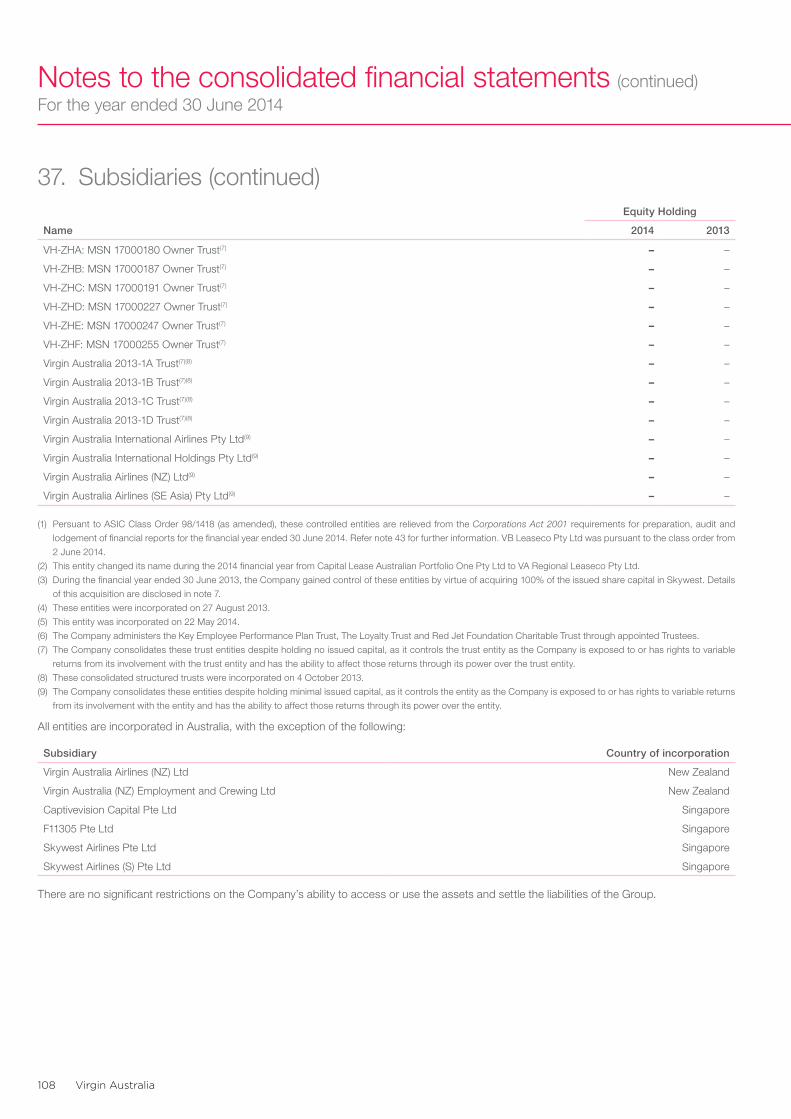
Virgin Australia108
Notes to the consolidated financial statements (continued)For the year ended 30 June 2014
Equity Holding
Name 2014 2013
VH-ZHA: MSN 17000180 Owner Trust(7) – –
VH-ZHB: MSN 17000187 Owner Trust(7) – –
VH-ZHC: MSN 17000191 Owner Trust(7) – –
VH-ZHD: MSN 17000227 Owner Trust(7) – –
VH-ZHE: MSN 17000247 Owner Trust(7) – –
VH-ZHF: MSN 17000255 Owner Trust(7) – –
Virgin Australia 2013-1A Trust(7)(8) – –
Virgin Australia 2013-1B Trust(7)(8) – –
Virgin Australia 2013-1C Trust(7)(8) – –
Virgin Australia 2013-1D Trust(7)(8) – –
Virgin Australia International Airlines Pty Ltd(9) – –
Virgin Australia International Holdings Pty Ltd(9) – –
Virgin Australia Airlines (NZ) Ltd(9) – –
Virgin Australia Airlines (SE Asia) Pty Ltd(9) – –
(1) Persuant to ASIC Class Order 98/1418 (as amended), these controlled entities are relieved from the Corporations Act 2001 requirements for preparation, audit and
lodgement of financial reports for the financial year ended 30 June 2014. Refer note 43 for further information. VB Leaseco Pty Ltd was pursuant to the class order from
2 June 2014.
(2) This entity changed its name during the 2014 financial year from Capital Lease Australian Portfolio One Pty Ltd to VA Regional Leaseco Pty Ltd.
(3) During the financial year ended 30 June 2013, the Company gained control of these entities by virtue of acquiring 100% of the issued share capital in Skywest. Details
of this acquisition are disclosed in note 7.
(4) These entities were incorporated on 27 August 2013.
(5) This entity was incorporated on 22 May 2014.
(6) The Company administers the Key Employee Performance Plan Trust, The Loyalty Trust and Red Jet Foundation Charitable Trust through appointed Trustees.
(7) The Company consolidates these trust entities despite holding no issued capital, as it controls the trust entity as the Company is exposed to or has rights to variable
returns from its involvement with the trust entity and has the ability to affect those returns through its power over the trust entity.
(8) These consolidated structured trusts were incorporated on 4 October 2013.
(9) The Company consolidates these entities despite holding minimal issued capital, as it controls the entity as the Company is exposed to or has rights to variable returns
from its involvement with the entity and has the ability to affect those returns through its power over the entity.
All entities are incorporated in Australia, with the exception of the following:
Subsidiary Country of incorporation
Virgin Australia Airlines (NZ) Ltd New Zealand
Virgin Australia (NZ) Employment and Crewing Ltd New Zealand
Captivevision Capital Pte Ltd Singapore
F11305 Pte Ltd Singapore
Skywest Airlines Pte Ltd Singapore
Skywest Airlines (S) Pte Ltd Singapore
There are no significant restrictions on the Company’s ability to access or use the assets and settle the liabilities of the Group.
37. Subsidiaries (continued)
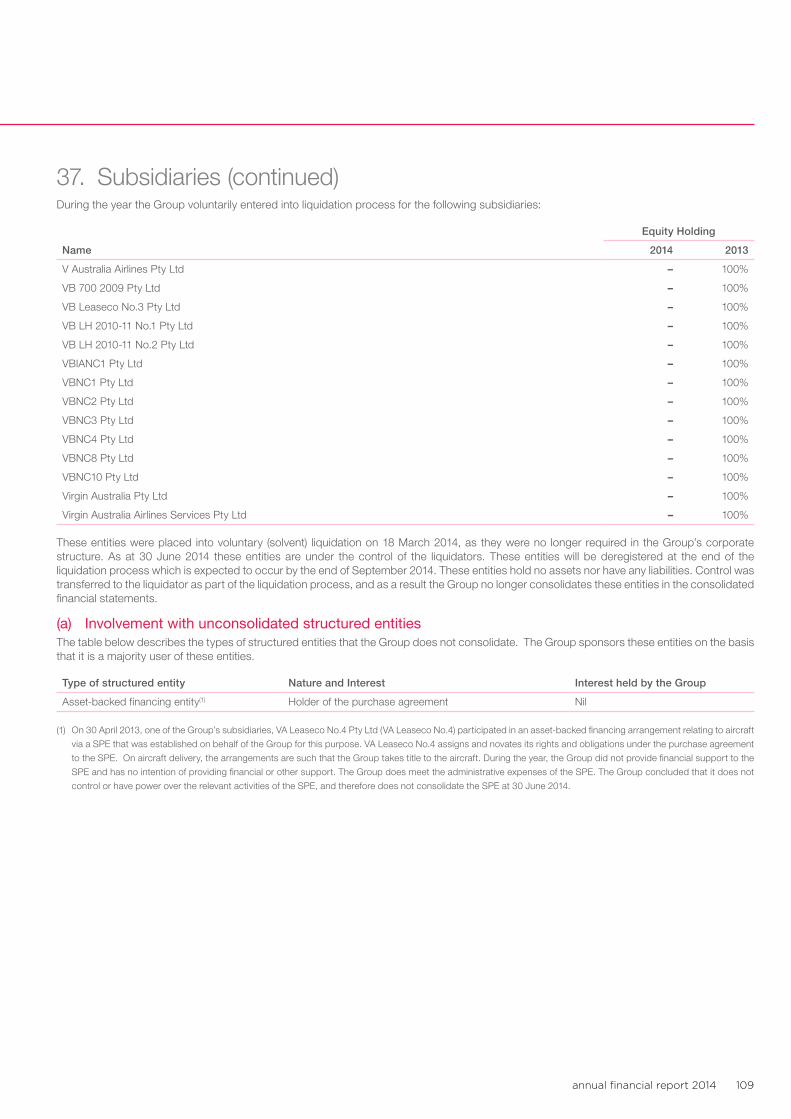
annual financial report 2014 109
37. Subsidiaries (continued)During the year the Group voluntarily entered into liquidation process for the following subsidiaries:
Equity Holding
Name 2014 2013
V Australia Airlines Pty Ltd – 100%
VB 700 2009 Pty Ltd – 100%
VB Leaseco No.3 Pty Ltd – 100%
VB LH 2010-11 No.1 Pty Ltd – 100%
VB LH 2010-11 No.2 Pty Ltd – 100%
VBIANC1 Pty Ltd – 100%
VBNC1 Pty Ltd – 100%
VBNC2 Pty Ltd – 100%
VBNC3 Pty Ltd – 100%
VBNC4 Pty Ltd – 100%
VBNC8 Pty Ltd – 100%
VBNC10 Pty Ltd – 100%
Virgin Australia Pty Ltd – 100%
Virgin Australia Airlines Services Pty Ltd – 100%
These entities were placed into voluntary (solvent) liquidation on 18 March 2014, as they were no longer required in the Group’s corporate structure. As at 30 June 2014 these entities are under the control of the liquidators. These entities will be deregistered at the end of the liquidation process which is expected to occur by the end of September 2014. These entities hold no assets nor have any liabilities. Control was transferred to the liquidator as part of the liquidation process, and as a result the Group no longer consolidates these entities in the consolidated financial statements.
(a) Involvement with unconsolidated structured entitiesThe table below describes the types of structured entities that the Group does not consolidate. The Group sponsors these entities on the basis that it is a majority user of these entities.
Type of structured entity Nature and Interest Interest held by the Group
Asset-backed financing entity(1) Holder of the purchase agreement Nil
(1) On 30 April 2013, one of the Group’s subsidiaries, VA Leaseco No.4 Pty Ltd (VA Leaseco No.4) participated in an asset-backed financing arrangement relating to aircraft
via a SPE that was established on behalf of the Group for this purpose. VA Leaseco No.4 assigns and novates its rights and obligations under the purchase agreement
to the SPE. On aircraft delivery, the arrangements are such that the Group takes title to the aircraft. During the year, the Group did not provide financial support to the
SPE and has no intention of providing financial or other support. The Group does meet the administrative expenses of the SPE. The Group concluded that it does not
control or have power over the relevant activities of the SPE, and therefore does not consolidate the SPE at 30 June 2014.
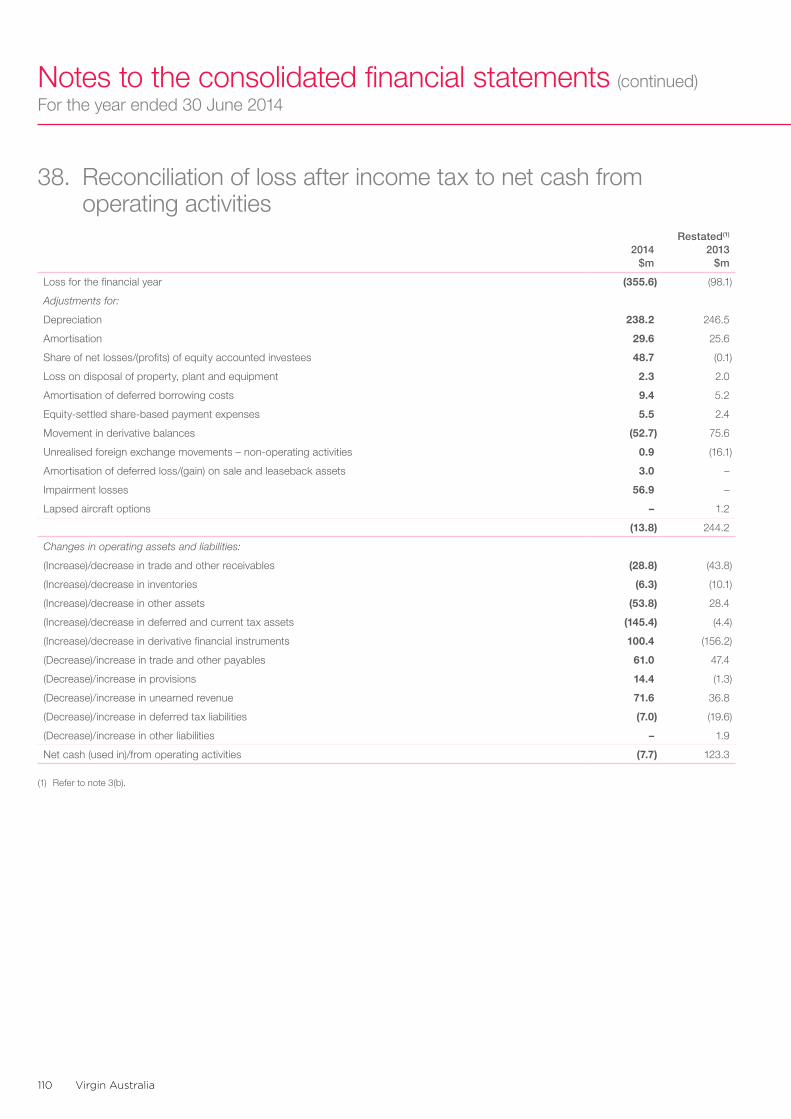
Virgin Australia110
Notes to the consolidated financial statements (continued)For the year ended 30 June 2014
38. Reconciliation of loss after income tax to net cash from operating activities
2014 $m
Restated(1) 2013
$m
Loss for the financial year (355.6) (98.1)
Adjustments for:
Depreciation 238.2 246.5
Amortisation 29.6 25.6
Share of net losses/(profits) of equity accounted investees 48.7 (0.1)
Loss on disposal of property, plant and equipment 2.3 2.0
Amortisation of deferred borrowing costs 9.4 5.2
Equity-settled share-based payment expenses 5.5 2.4
Movement in derivative balances (52.7) 75.6
Unrealised foreign exchange movements – non-operating activities 0.9 (16.1)
Amortisation of deferred loss/(gain) on sale and leaseback assets 3.0 –
Impairment losses 56.9 –
Lapsed aircraft options – 1.2
(13.8) 244.2
Changes in operating assets and liabilities:
(Increase)/decrease in trade and other receivables (28.8) (43.8)
(Increase)/decrease in inventories (6.3) (10.1)
(Increase)/decrease in other assets (53.8) 28.4
(Increase)/decrease in deferred and current tax assets (145.4) (4.4)
(Increase)/decrease in derivative financial instruments 100.4 (156.2)
(Decrease)/increase in trade and other payables 61.0 47.4
(Decrease)/increase in provisions 14.4 (1.3)
(Decrease)/increase in unearned revenue 71.6 36.8
(Decrease)/increase in deferred tax liabilities (7.0) (19.6)
(Decrease)/increase in other liabilities – 1.9
Net cash (used in)/from operating activities (7.7) 123.3
(1) Refer to note 3(b).
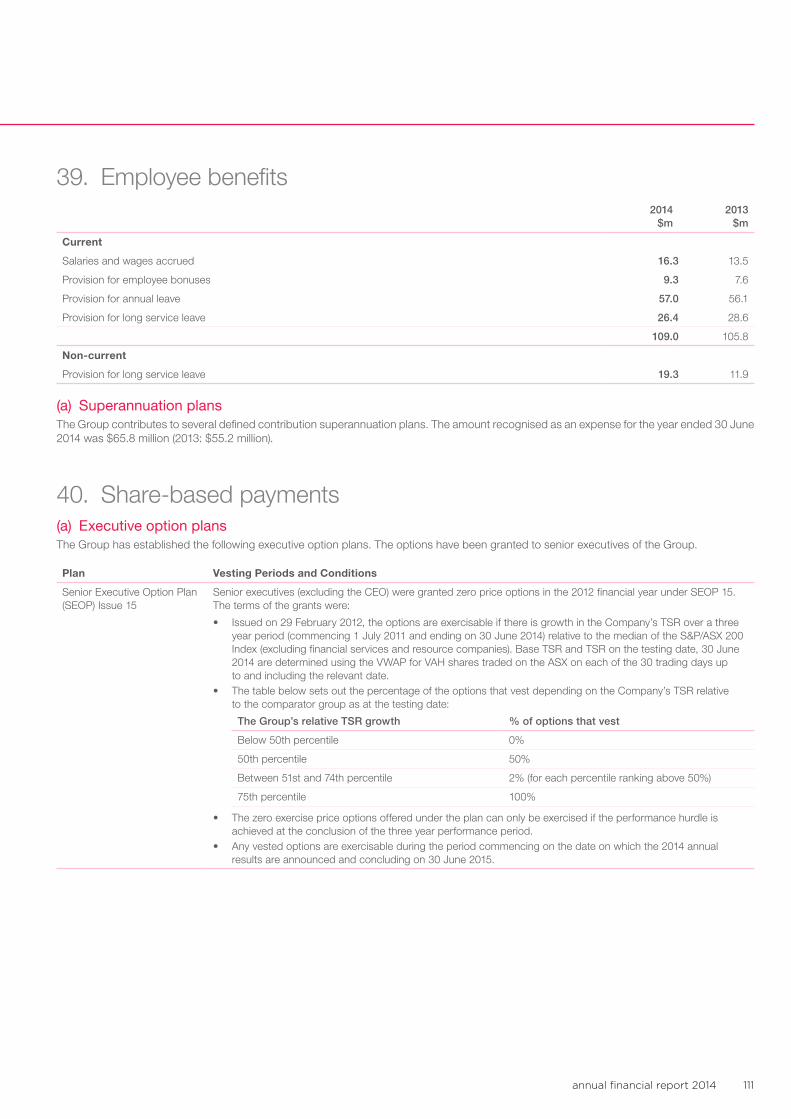
annual financial report 2014 111
39. Employee benefits2014
$m2013
$m
Current
Salaries and wages accrued 16.3 13.5
Provision for employee bonuses 9.3 7.6
Provision for annual leave 57.0 56.1
Provision for long service leave 26.4 28.6
109.0 105.8
Non-current
Provision for long service leave 19.3 11.9
(a) Superannuation plansThe Group contributes to several defined contribution superannuation plans. The amount recognised as an expense for the year ended 30 June 2014 was $65.8 million (2013: $55.2 million).
40. Share-based payments(a) Executive option plansThe Group has established the following executive option plans. The options have been granted to senior executives of the Group.
Plan Vesting Periods and Conditions
Senior Executive Option Plan (SEOP) Issue 15
Senior executives (excluding the CEO) were granted zero price options in the 2012 financial year under SEOP 15. The terms of the grants were:
• Issued on 29 February 2012, the options are exercisable if there is growth in the Company’s TSR over a three year period (commencing 1 July 2011 and ending on 30 June 2014) relative to the median of the S&P/ASX 200 Index (excluding financial services and resource companies). Base TSR and TSR on the testing date, 30 June 2014 are determined using the VWAP for VAH shares traded on the ASX on each of the 30 trading days up to and including the relevant date.
• The table below sets out the percentage of the options that vest depending on the Company’s TSR relative to the comparator group as at the testing date:
The Group’s relative TSR growth % of options that vest
Below 50th percentile 0%
50th percentile 50%
Between 51st and 74th percentile 2% (for each percentile ranking above 50%)
75th percentile 100%
• The zero exercise price options offered under the plan can only be exercised if the performance hurdle is achieved at the conclusion of the three year performance period.
• Any vested options are exercisable during the period commencing on the date on which the 2014 annual results are announced and concluding on 30 June 2015.
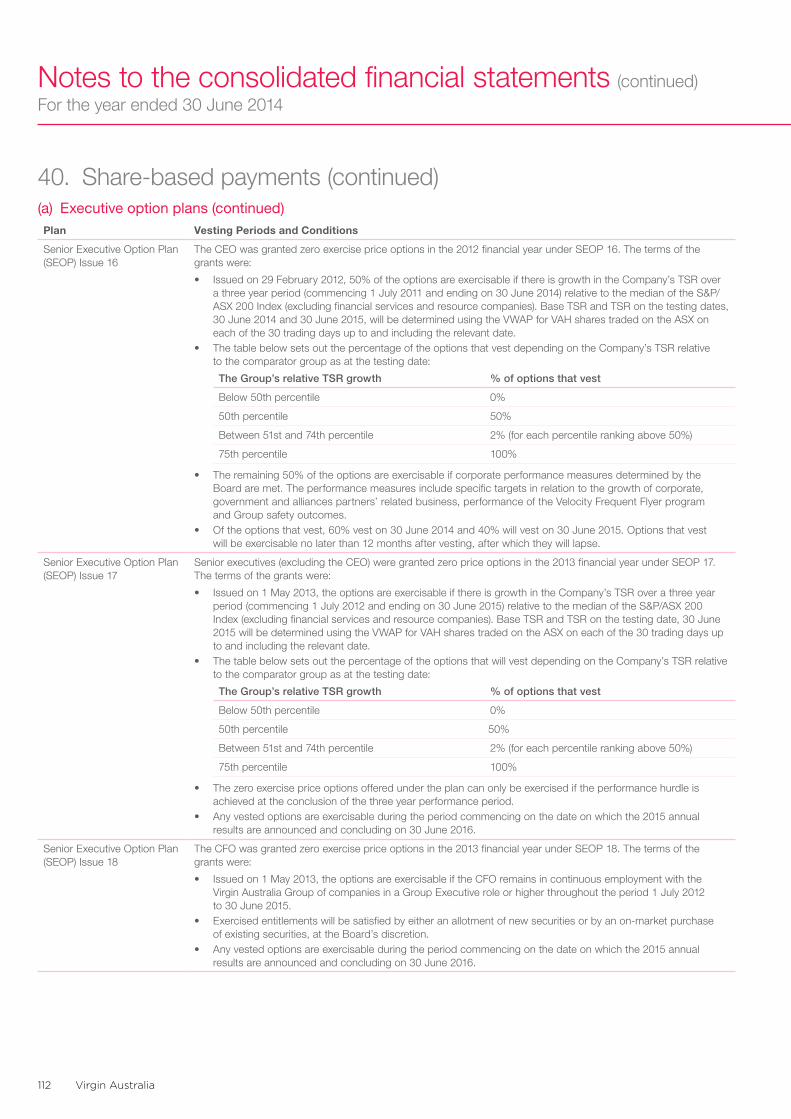
Virgin Australia112
Notes to the consolidated financial statements (continued)For the year ended 30 June 2014
Plan Vesting Periods and Conditions
Senior Executive Option Plan (SEOP) Issue 16
The CEO was granted zero exercise price options in the 2012 financial year under SEOP 16. The terms of the grants were:
• Issued on 29 February 2012, 50% of the options are exercisable if there is growth in the Company’s TSR over a three year period (commencing 1 July 2011 and ending on 30 June 2014) relative to the median of the S&P/ASX 200 Index (excluding financial services and resource companies). Base TSR and TSR on the testing dates, 30 June 2014 and 30 June 2015, will be determined using the VWAP for VAH shares traded on the ASX on each of the 30 trading days up to and including the relevant date.
• The table below sets out the percentage of the options that vest depending on the Company’s TSR relative to the comparator group as at the testing date:
The Group’s relative TSR growth % of options that vest
Below 50th percentile 0%
50th percentile 50%
Between 51st and 74th percentile 2% (for each percentile ranking above 50%)
75th percentile 100%
• The remaining 50% of the options are exercisable if corporate performance measures determined by the Board are met. The performance measures include specific targets in relation to the growth of corporate, government and alliances partners’ related business, performance of the Velocity Frequent Flyer program and Group safety outcomes.
• Of the options that vest, 60% vest on 30 June 2014 and 40% will vest on 30 June 2015. Options that vest will be exercisable no later than 12 months after vesting, after which they will lapse.
Senior Executive Option Plan (SEOP) Issue 17
Senior executives (excluding the CEO) were granted zero price options in the 2013 financial year under SEOP 17. The terms of the grants were:
• Issued on 1 May 2013, the options are exercisable if there is growth in the Company’s TSR over a three year period (commencing 1 July 2012 and ending on 30 June 2015) relative to the median of the S&P/ASX 200 Index (excluding financial services and resource companies). Base TSR and TSR on the testing date, 30 June 2015 will be determined using the VWAP for VAH shares traded on the ASX on each of the 30 trading days up to and including the relevant date.
• The table below sets out the percentage of the options that will vest depending on the Company’s TSR relative to the comparator group as at the testing date:
The Group’s relative TSR growth % of options that vest
Below 50th percentile 0%
50th percentile 50%
Between 51st and 74th percentile 2% (for each percentile ranking above 50%)
75th percentile 100%
• The zero exercise price options offered under the plan can only be exercised if the performance hurdle is achieved at the conclusion of the three year performance period.
• Any vested options are exercisable during the period commencing on the date on which the 2015 annual results are announced and concluding on 30 June 2016.
Senior Executive Option Plan (SEOP) Issue 18
The CFO was granted zero exercise price options in the 2013 financial year under SEOP 18. The terms of the grants were:
• Issued on 1 May 2013, the options are exercisable if the CFO remains in continuous employment with the Virgin Australia Group of companies in a Group Executive role or higher throughout the period 1 July 2012 to 30 June 2015.
• Exercised entitlements will be satisfied by either an allotment of new securities or by an on-market purchase of existing securities, at the Board’s discretion.
• Any vested options are exercisable during the period commencing on the date on which the 2015 annual results are announced and concluding on 30 June 2016.
40. Share-based payments (continued)(a) Executive option plans (continued)
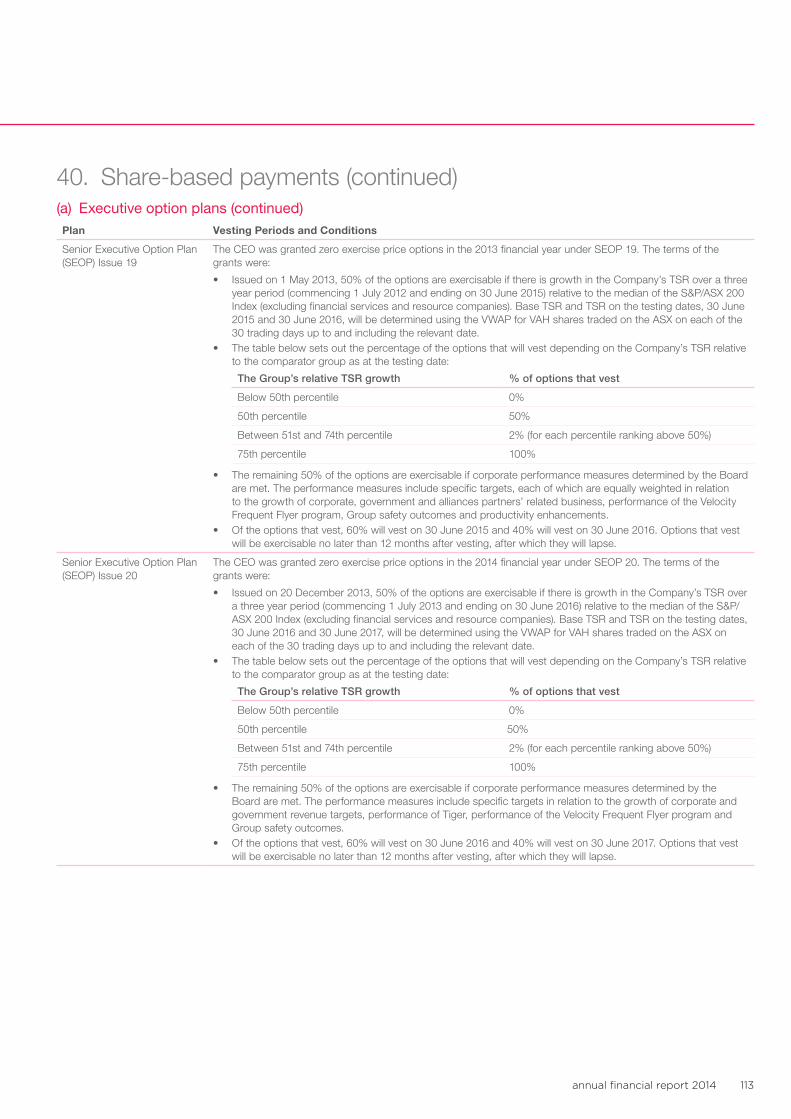
annual financial report 2014 113
Plan Vesting Periods and Conditions
Senior Executive Option Plan (SEOP) Issue 19
The CEO was granted zero exercise price options in the 2013 financial year under SEOP 19. The terms of the grants were:
• Issued on 1 May 2013, 50% of the options are exercisable if there is growth in the Company’s TSR over a three year period (commencing 1 July 2012 and ending on 30 June 2015) relative to the median of the S&P/ASX 200 Index (excluding financial services and resource companies). Base TSR and TSR on the testing dates, 30 June 2015 and 30 June 2016, will be determined using the VWAP for VAH shares traded on the ASX on each of the 30 trading days up to and including the relevant date.
• The table below sets out the percentage of the options that will vest depending on the Company’s TSR relative to the comparator group as at the testing date:
The Group’s relative TSR growth % of options that vest
Below 50th percentile 0%
50th percentile 50%
Between 51st and 74th percentile 2% (for each percentile ranking above 50%)
75th percentile 100%
• The remaining 50% of the options are exercisable if corporate performance measures determined by the Board are met. The performance measures include specific targets, each of which are equally weighted in relation to the growth of corporate, government and alliances partners’ related business, performance of the Velocity Frequent Flyer program, Group safety outcomes and productivity enhancements.
• Of the options that vest, 60% will vest on 30 June 2015 and 40% will vest on 30 June 2016. Options that vest will be exercisable no later than 12 months after vesting, after which they will lapse.
Senior Executive Option Plan (SEOP) Issue 20
The CEO was granted zero exercise price options in the 2014 financial year under SEOP 20. The terms of the grants were:
• Issued on 20 December 2013, 50% of the options are exercisable if there is growth in the Company’s TSR over a three year period (commencing 1 July 2013 and ending on 30 June 2016) relative to the median of the S&P/ASX 200 Index (excluding financial services and resource companies). Base TSR and TSR on the testing dates, 30 June 2016 and 30 June 2017, will be determined using the VWAP for VAH shares traded on the ASX on each of the 30 trading days up to and including the relevant date.
• The table below sets out the percentage of the options that will vest depending on the Company’s TSR relative to the comparator group as at the testing date:
The Group’s relative TSR growth % of options that vest
Below 50th percentile 0%
50th percentile 50%
Between 51st and 74th percentile 2% (for each percentile ranking above 50%)
75th percentile 100%
• The remaining 50% of the options are exercisable if corporate performance measures determined by the Board are met. The performance measures include specific targets in relation to the growth of corporate and government revenue targets, performance of Tiger, performance of the Velocity Frequent Flyer program and Group safety outcomes.
• Of the options that vest, 60% will vest on 30 June 2016 and 40% will vest on 30 June 2017. Options that vest will be exercisable no later than 12 months after vesting, after which they will lapse.
40. Share-based payments (continued)(a) Executive option plans (continued)
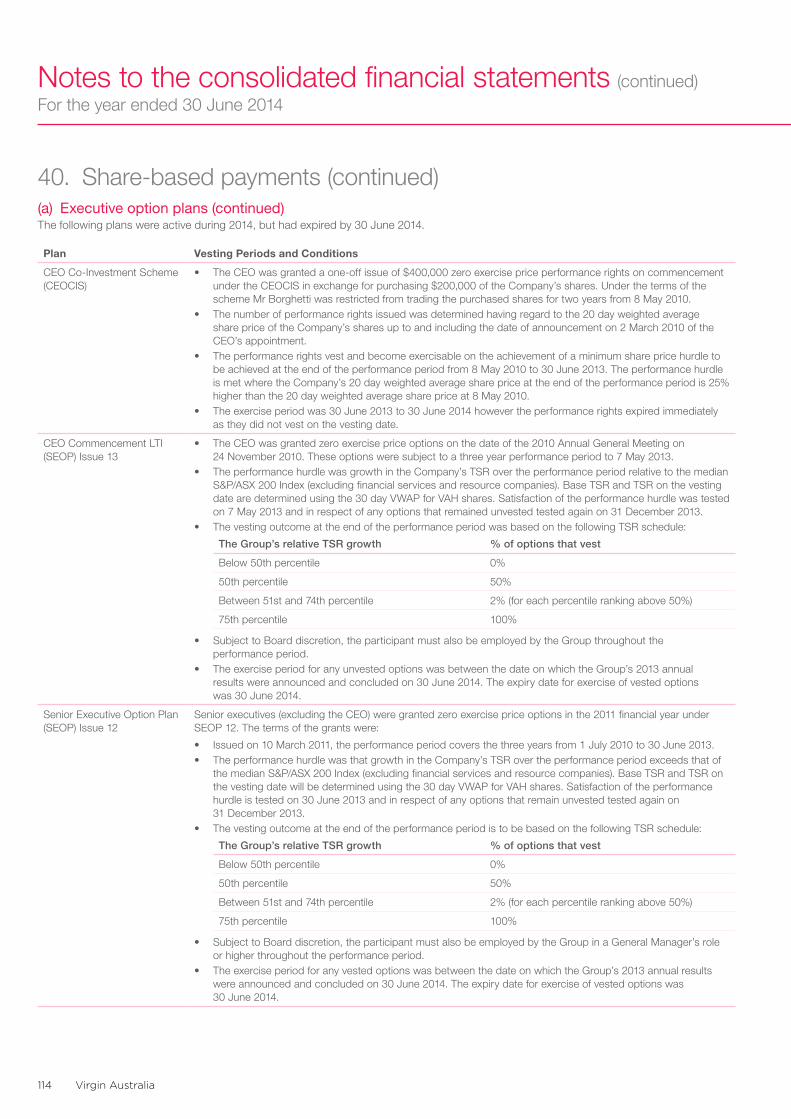
Virgin Australia114
Notes to the consolidated financial statements (continued)For the year ended 30 June 2014
The following plans were active during 2014, but had expired by 30 June 2014.
Plan Vesting Periods and Conditions
CEO Co-Investment Scheme (CEOCIS)
• The CEO was granted a one-off issue of $400,000 zero exercise price performance rights on commencement under the CEOCIS in exchange for purchasing $200,000 of the Company’s shares. Under the terms of the scheme Mr Borghetti was restricted from trading the purchased shares for two years from 8 May 2010.
• The number of performance rights issued was determined having regard to the 20 day weighted average share price of the Company’s shares up to and including the date of announcement on 2 March 2010 of the CEO’s appointment.
• The performance rights vest and become exercisable on the achievement of a minimum share price hurdle to be achieved at the end of the performance period from 8 May 2010 to 30 June 2013. The performance hurdle is met where the Company’s 20 day weighted average share price at the end of the performance period is 25% higher than the 20 day weighted average share price at 8 May 2010.
• The exercise period was 30 June 2013 to 30 June 2014 however the performance rights expired immediately as they did not vest on the vesting date.
CEO Commencement LTI (SEOP) Issue 13
• The CEO was granted zero exercise price options on the date of the 2010 Annual General Meeting on 24 November 2010. These options were subject to a three year performance period to 7 May 2013.
• The performance hurdle was growth in the Company’s TSR over the performance period relative to the median S&P/ASX 200 Index (excluding financial services and resource companies). Base TSR and TSR on the vesting date are determined using the 30 day VWAP for VAH shares. Satisfaction of the performance hurdle was tested on 7 May 2013 and in respect of any options that remained unvested tested again on 31 December 2013.
• The vesting outcome at the end of the performance period was based on the following TSR schedule:
The Group’s relative TSR growth % of options that vest
Below 50th percentile 0%
50th percentile 50%
Between 51st and 74th percentile 2% (for each percentile ranking above 50%)
75th percentile 100%
• Subject to Board discretion, the participant must also be employed by the Group throughout the performance period.
• The exercise period for any unvested options was between the date on which the Group’s 2013 annual results were announced and concluded on 30 June 2014. The expiry date for exercise of vested options was 30 June 2014.
Senior Executive Option Plan (SEOP) Issue 12
Senior executives (excluding the CEO) were granted zero exercise price options in the 2011 financial year under SEOP 12. The terms of the grants were:
• Issued on 10 March 2011, the performance period covers the three years from 1 July 2010 to 30 June 2013.• The performance hurdle was that growth in the Company’s TSR over the performance period exceeds that of
the median S&P/ASX 200 Index (excluding financial services and resource companies). Base TSR and TSR on the vesting date will be determined using the 30 day VWAP for VAH shares. Satisfaction of the performance hurdle is tested on 30 June 2013 and in respect of any options that remain unvested tested again on 31 December 2013.
• The vesting outcome at the end of the performance period is to be based on the following TSR schedule:
The Group’s relative TSR growth % of options that vest
Below 50th percentile 0%
50th percentile 50%
Between 51st and 74th percentile 2% (for each percentile ranking above 50%)
75th percentile 100%
• Subject to Board discretion, the participant must also be employed by the Group in a General Manager’s role or higher throughout the performance period.
• The exercise period for any vested options was between the date on which the Group’s 2013 annual results were announced and concluded on 30 June 2014. The expiry date for exercise of vested options was 30 June 2014.
40. Share-based payments (continued)(a) Executive option plans (continued)
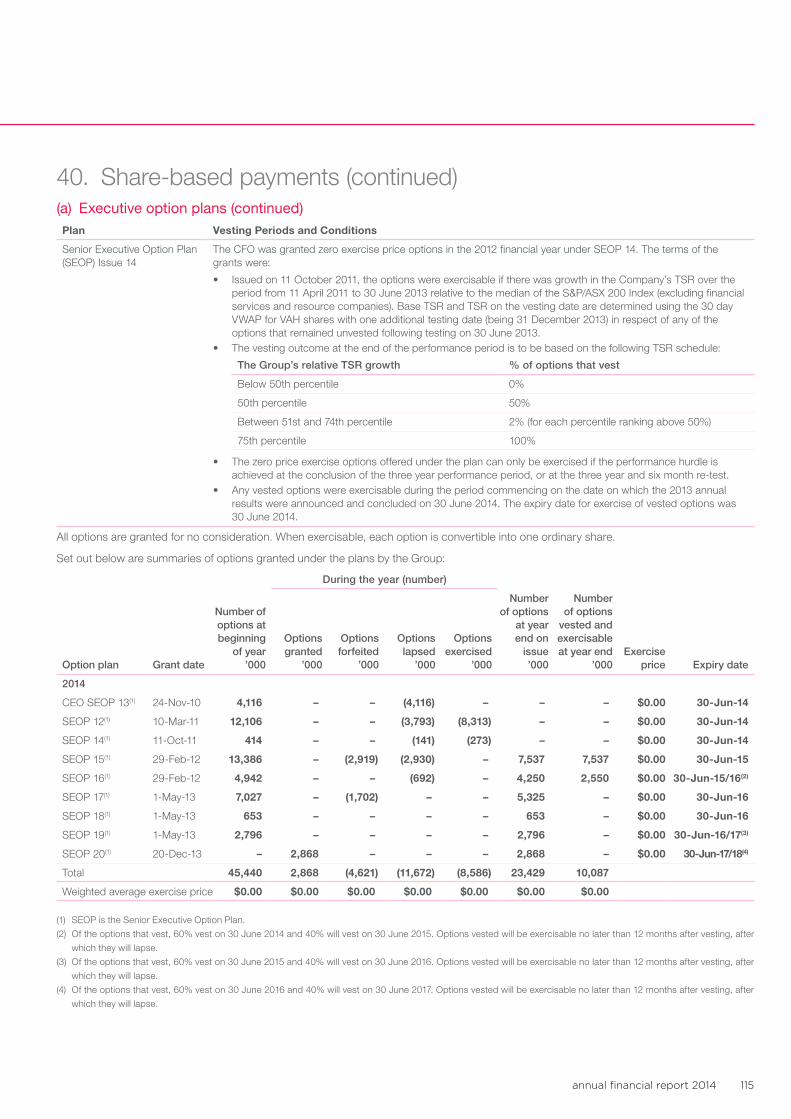
annual financial report 2014 115
Plan Vesting Periods and Conditions
Senior Executive Option Plan (SEOP) Issue 14
The CFO was granted zero exercise price options in the 2012 financial year under SEOP 14. The terms of the grants were:
• Issued on 11 October 2011, the options were exercisable if there was growth in the Company’s TSR over the period from 11 April 2011 to 30 June 2013 relative to the median of the S&P/ASX 200 Index (excluding financial services and resource companies). Base TSR and TSR on the vesting date are determined using the 30 day VWAP for VAH shares with one additional testing date (being 31 December 2013) in respect of any of the options that remained unvested following testing on 30 June 2013.
• The vesting outcome at the end of the performance period is to be based on the following TSR schedule:
The Group’s relative TSR growth % of options that vest
Below 50th percentile 0%
50th percentile 50%
Between 51st and 74th percentile 2% (for each percentile ranking above 50%)
75th percentile 100%
• The zero price exercise options offered under the plan can only be exercised if the performance hurdle is achieved at the conclusion of the three year performance period, or at the three year and six month re-test.
• Any vested options were exercisable during the period commencing on the date on which the 2013 annual results were announced and concluded on 30 June 2014. The expiry date for exercise of vested options was 30 June 2014.
All options are granted for no consideration. When exercisable, each option is convertible into one ordinary share.
Set out below are summaries of options granted under the plans by the Group:
During the year (number)
Option plan Grant date
Number of options at beginning
of year ’000
Options granted
’000
Options forfeited
’000
Options lapsed
’000
Options exercised
’000
Number of options
at year end on
issue ’000
Number of options
vested and exercisable at year end
’000Exercise
price Expiry date
2014
CEO SEOP 13(1) 24-Nov-10 4,116 – – (4,116) – – – $0.00 30-Jun-14
SEOP 12(1) 10-Mar-11 12,106 – – (3,793) (8,313) – – $0.00 30-Jun-14
SEOP 14(1) 11-Oct-11 414 – – (141) (273) – – $0.00 30-Jun-14
SEOP 15(1) 29-Feb-12 13,386 – (2,919) (2,930) – 7,537 7,537 $0.00 30-Jun-15
SEOP 16(1) 29-Feb-12 4,942 – – (692) – 4,250 2,550 $0.00 30-Jun-15/16(2)
SEOP 17(1) 1-May-13 7,027 – (1,702) – – 5,325 – $0.00 30-Jun-16
SEOP 18(1) 1-May-13 653 – – – – 653 – $0.00 30-Jun-16
SEOP 19(1) 1-May-13 2,796 – – – – 2,796 – $0.00 30-Jun-16/17(3)
SEOP 20(1) 20-Dec-13 – 2,868 – – – 2,868 – $0.00 30-Jun-17/18(4)
Total 45,440 2,868 (4,621) (11,672) (8,586) 23,429 10,087
Weighted average exercise price $0.00 $0.00 $0.00 $0.00 $0.00 $0.00 $0.00
(1) SEOP is the Senior Executive Option Plan.
(2) Of the options that vest, 60% vest on 30 June 2014 and 40% will vest on 30 June 2015. Options vested will be exercisable no later than 12 months after vesting, after
which they will lapse.
(3) Of the options that vest, 60% vest on 30 June 2015 and 40% will vest on 30 June 2016. Options vested will be exercisable no later than 12 months after vesting, after
which they will lapse.
(4) Of the options that vest, 60% vest on 30 June 2016 and 40% will vest on 30 June 2017. Options vested will be exercisable no later than 12 months after vesting, after
which they will lapse.
40. Share-based payments (continued)(a) Executive option plans (continued)
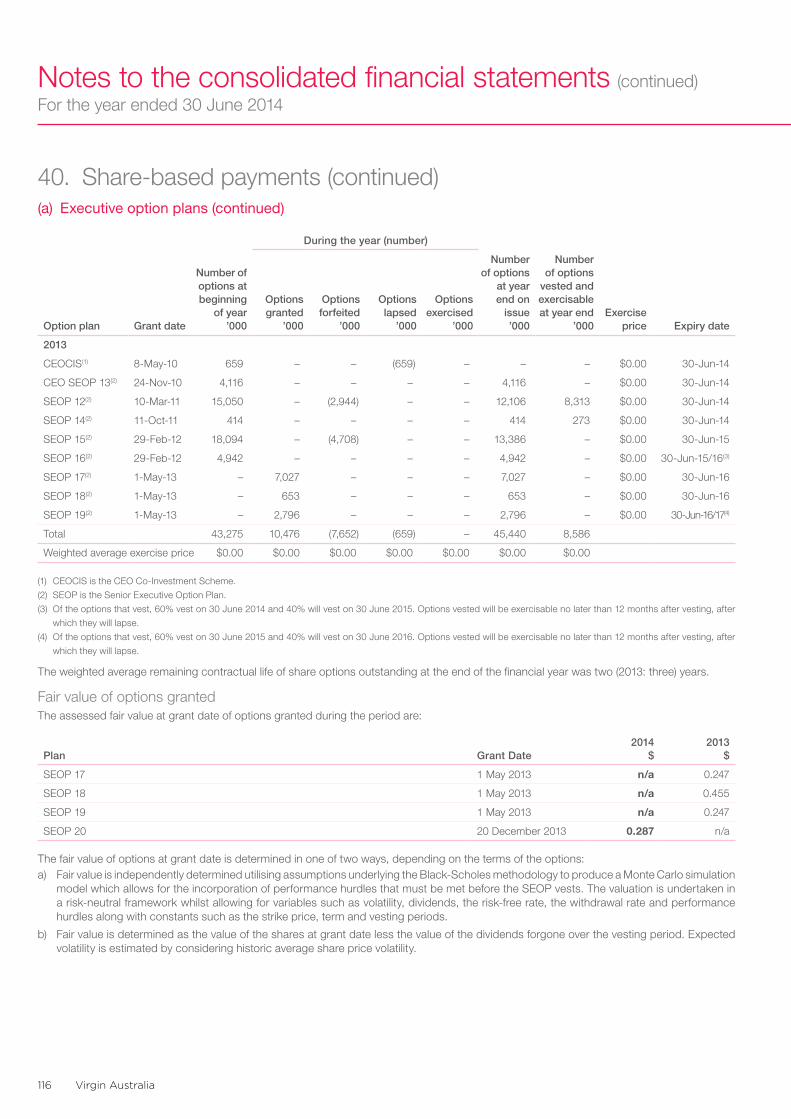
Virgin Australia116
Notes to the consolidated financial statements (continued)For the year ended 30 June 2014
40. Share-based payments (continued)(a) Executive option plans (continued)
During the year (number)
Option plan Grant date
Number of options at beginning
of year ’000
Options granted
’000
Options forfeited
’000
Options lapsed
’000
Options exercised
’000
Number of options
at year end on
issue ’000
Number of options
vested and exercisable at year end
’000Exercise
price Expiry date
2013
CEOCIS(1) 8-May-10 659 – – (659) – – – $0.00 30-Jun-14
CEO SEOP 13(2) 24-Nov-10 4,116 – – – – 4,116 – $0.00 30-Jun-14
SEOP 12(2) 10-Mar-11 15,050 – (2,944) – – 12,106 8,313 $0.00 30-Jun-14
SEOP 14(2) 11-Oct-11 414 – – – – 414 273 $0.00 30-Jun-14
SEOP 15(2) 29-Feb-12 18,094 – (4,708) – – 13,386 – $0.00 30-Jun-15
SEOP 16(2) 29-Feb-12 4,942 – – – – 4,942 – $0.00 30-Jun-15/16(3)
SEOP 17(2) 1-May-13 – 7,027 – – – 7,027 – $0.00 30-Jun-16
SEOP 18(2) 1-May-13 – 653 – – – 653 – $0.00 30-Jun-16
SEOP 19(2) 1-May-13 – 2,796 – – – 2,796 – $0.00 30-Jun-16/17(4)
Total 43,275 10,476 (7,652) (659) – 45,440 8,586
Weighted average exercise price $0.00 $0.00 $0.00 $0.00 $0.00 $0.00 $0.00
(1) CEOCIS is the CEO Co-Investment Scheme.
(2) SEOP is the Senior Executive Option Plan.
(3) Of the options that vest, 60% vest on 30 June 2014 and 40% will vest on 30 June 2015. Options vested will be exercisable no later than 12 months after vesting, after
which they will lapse.
(4) Of the options that vest, 60% vest on 30 June 2015 and 40% will vest on 30 June 2016. Options vested will be exercisable no later than 12 months after vesting, after
which they will lapse.
The weighted average remaining contractual life of share options outstanding at the end of the financial year was two (2013: three) years.
Fair value of options grantedThe assessed fair value at grant date of options granted during the period are:
Plan Grant Date2014
$2013
$
SEOP 17 1 May 2013 n/a 0.247
SEOP 18 1 May 2013 n/a 0.455
SEOP 19 1 May 2013 n/a 0.247
SEOP 20 20 December 2013 0.287 n/a
The fair value of options at grant date is determined in one of two ways, depending on the terms of the options:a) Fair value is independently determined utilising assumptions underlying the Black-Scholes methodology to produce a Monte Carlo simulation
model which allows for the incorporation of performance hurdles that must be met before the SEOP vests. The valuation is undertaken in a risk-neutral framework whilst allowing for variables such as volatility, dividends, the risk-free rate, the withdrawal rate and performance hurdles along with constants such as the strike price, term and vesting periods.
b) Fair value is determined as the value of the shares at grant date less the value of the dividends forgone over the vesting period. Expected volatility is estimated by considering historic average share price volatility.
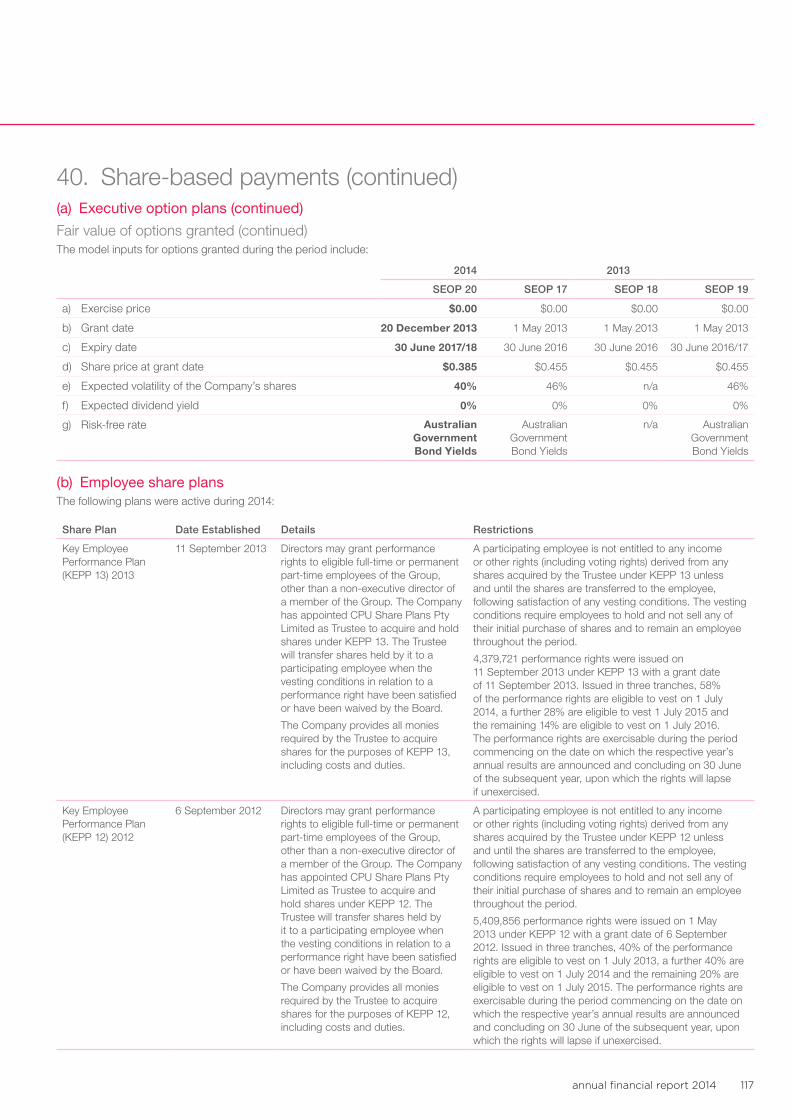
annual financial report 2014 117
40. Share-based payments (continued)(a) Executive option plans (continued)
Fair value of options granted (continued)The model inputs for options granted during the period include:
2014 2013
SEOP 20 SEOP 17 SEOP 18 SEOP 19
a) Exercise price $0.00 $0.00 $0.00 $0.00
b) Grant date 20 December 2013 1 May 2013 1 May 2013 1 May 2013
c) Expiry date 30 June 2017/18 30 June 2016 30 June 2016 30 June 2016/17
d) Share price at grant date $0.385 $0.455 $0.455 $0.455
e) Expected volatility of the Company’s shares 40% 46% n/a 46%
f) Expected dividend yield 0% 0% 0% 0%
g) Risk-free rate Australian Government Bond Yields
Australian Government Bond Yields
n/a Australian Government Bond Yields
(b) Employee share plansThe following plans were active during 2014:
Share Plan Date Established Details Restrictions
Key Employee Performance Plan (KEPP 13) 2013
11 September 2013 Directors may grant performance rights to eligible full-time or permanent part-time employees of the Group, other than a non-executive director of a member of the Group. The Company has appointed CPU Share Plans Pty Limited as Trustee to acquire and hold shares under KEPP 13. The Trustee will transfer shares held by it to a participating employee when the vesting conditions in relation to a performance right have been satisfied or have been waived by the Board.
The Company provides all monies required by the Trustee to acquire shares for the purposes of KEPP 13, including costs and duties.
A participating employee is not entitled to any income or other rights (including voting rights) derived from any shares acquired by the Trustee under KEPP 13 unless and until the shares are transferred to the employee, following satisfaction of any vesting conditions. The vesting conditions require employees to hold and not sell any of their initial purchase of shares and to remain an employee throughout the period.
4,379,721 performance rights were issued on 11 September 2013 under KEPP 13 with a grant date of 11 September 2013. Issued in three tranches, 58% of the performance rights are eligible to vest on 1 July 2014, a further 28% are eligible to vest 1 July 2015 and the remaining 14% are eligible to vest on 1 July 2016. The performance rights are exercisable during the period commencing on the date on which the respective year’s annual results are announced and concluding on 30 June of the subsequent year, upon which the rights will lapse if unexercised.
Key Employee Performance Plan (KEPP 12) 2012
6 September 2012 Directors may grant performance rights to eligible full-time or permanent part-time employees of the Group, other than a non-executive director of a member of the Group. The Company has appointed CPU Share Plans Pty Limited as Trustee to acquire and hold shares under KEPP 12. The Trustee will transfer shares held by it to a participating employee when the vesting conditions in relation to a performance right have been satisfied or have been waived by the Board.
The Company provides all monies required by the Trustee to acquire shares for the purposes of KEPP 12, including costs and duties.
A participating employee is not entitled to any income or other rights (including voting rights) derived from any shares acquired by the Trustee under KEPP 12 unless and until the shares are transferred to the employee, following satisfaction of any vesting conditions. The vesting conditions require employees to hold and not sell any of their initial purchase of shares and to remain an employee throughout the period.
5,409,856 performance rights were issued on 1 May 2013 under KEPP 12 with a grant date of 6 September 2012. Issued in three tranches, 40% of the performance rights are eligible to vest on 1 July 2013, a further 40% are eligible to vest on 1 July 2014 and the remaining 20% are eligible to vest on 1 July 2015. The performance rights are exercisable during the period commencing on the date on which the respective year’s annual results are announced and concluding on 30 June of the subsequent year, upon which the rights will lapse if unexercised.
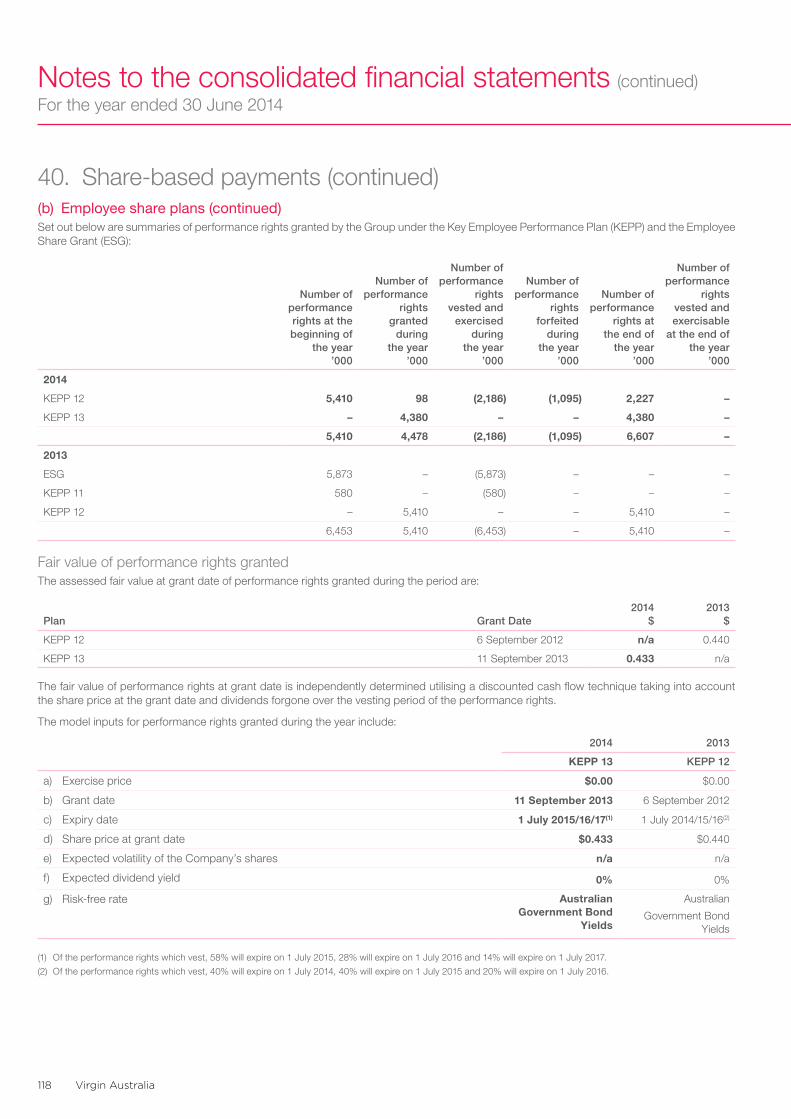
Virgin Australia118
Notes to the consolidated financial statements (continued)For the year ended 30 June 2014
40. Share-based payments (continued)(b) Employee share plans (continued)Set out below are summaries of performance rights granted by the Group under the Key Employee Performance Plan (KEPP) and the Employee Share Grant (ESG):
Number of performance rights at the beginning of
the year ’000
Number of performance
rights granted
during the year
’000
Number of performance
rights vested and
exercised during
the year ’000
Number of performance
rights forfeited
during the year
’000
Number of performance
rights at the end of
the year ’000
Number of performance
rights vested and exercisable
at the end of the year
’000
2014
KEPP 12 5,410 98 (2,186) (1,095) 2,227 –
KEPP 13 – 4,380 – – 4,380 –
5,410 4,478 (2,186) (1,095) 6,607 –
2013
ESG 5,873 – (5,873) – – –
KEPP 11 580 – (580) – – –
KEPP 12 – 5,410 – – 5,410 –
6,453 5,410 (6,453) – 5,410 –
Fair value of performance rights grantedThe assessed fair value at grant date of performance rights granted during the period are:
Plan Grant Date2014
$2013
$
KEPP 12 6 September 2012 n/a 0.440
KEPP 13 11 September 2013 0.433 n/a
The fair value of performance rights at grant date is independently determined utilising a discounted cash flow technique taking into account the share price at the grant date and dividends forgone over the vesting period of the performance rights.
The model inputs for performance rights granted during the year include:
2014 2013
KEPP 13 KEPP 12
a) Exercise price $0.00 $0.00
b) Grant date 11 September 2013 6 September 2012
c) Expiry date 1 July 2015/16/17(1) 1 July 2014/15/16(2)
d) Share price at grant date $0.433 $0.440
e) Expected volatility of the Company’s shares n/a n/a
f) Expected dividend yield 0% 0%
g) Risk-free rate Australian Government Bond
Yields
Australian
Government Bond Yields
(1) Of the performance rights which vest, 58% will expire on 1 July 2015, 28% will expire on 1 July 2016 and 14% will expire on 1 July 2017.
(2) Of the performance rights which vest, 40% will expire on 1 July 2014, 40% will expire on 1 July 2015 and 20% will expire on 1 July 2016.
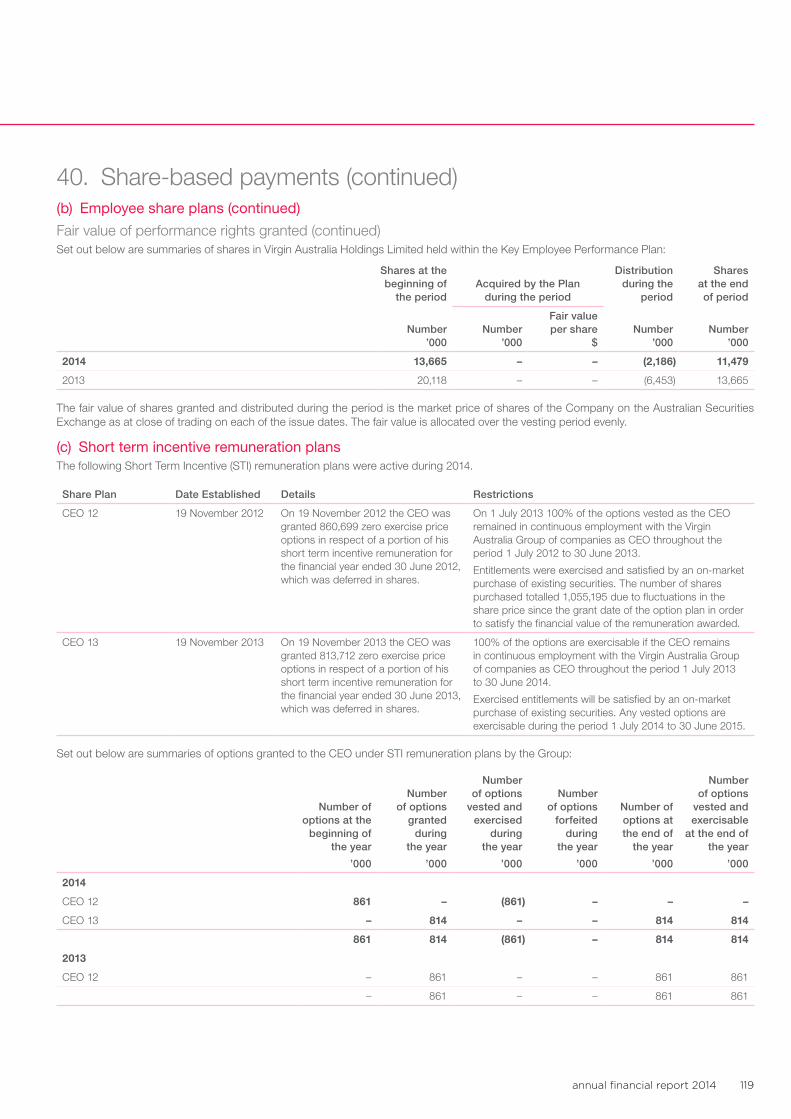
annual financial report 2014 119
40. Share-based payments (continued)(b) Employee share plans (continued)
Fair value of performance rights granted (continued)Set out below are summaries of shares in Virgin Australia Holdings Limited held within the Key Employee Performance Plan:
Shares at the beginning of
the periodAcquired by the Plan
during the period
Distribution during the
period
Shares at the end of period
Number ’000
Number ’000
Fair value per share
$Number
’000Number
’000
2014 13,665 – – (2,186) 11,479
2013 20,118 – – (6,453) 13,665
The fair value of shares granted and distributed during the period is the market price of shares of the Company on the Australian Securities Exchange as at close of trading on each of the issue dates. The fair value is allocated over the vesting period evenly.
(c) Short term incentive remuneration plansThe following Short Term Incentive (STI) remuneration plans were active during 2014.
Share Plan Date Established Details Restrictions
CEO 12 19 November 2012 On 19 November 2012 the CEO was granted 860,699 zero exercise price options in respect of a portion of his short term incentive remuneration for the financial year ended 30 June 2012, which was deferred in shares.
On 1 July 2013 100% of the options vested as the CEO remained in continuous employment with the Virgin Australia Group of companies as CEO throughout the period 1 July 2012 to 30 June 2013.
Entitlements were exercised and satisfied by an on-market purchase of existing securities. The number of shares purchased totalled 1,055,195 due to fluctuations in the share price since the grant date of the option plan in order to satisfy the financial value of the remuneration awarded.
CEO 13 19 November 2013 On 19 November 2013 the CEO was granted 813,712 zero exercise price options in respect of a portion of his short term incentive remuneration for the financial year ended 30 June 2013, which was deferred in shares.
100% of the options are exercisable if the CEO remains in continuous employment with the Virgin Australia Group of companies as CEO throughout the period 1 July 2013 to 30 June 2014.
Exercised entitlements will be satisfied by an on-market purchase of existing securities. Any vested options are exercisable during the period 1 July 2014 to 30 June 2015.
Set out below are summaries of options granted to the CEO under STI remuneration plans by the Group:
Number of options at the
beginning of the year
’000
Number of options
granted during
the year
’000
Number of options
vested and exercised
during the year
’000
Number of options
forfeited during
the year
’000
Number of options at the end of
the year
’000
Number of options
vested and exercisable
at the end of the year
’000
2014
CEO 12 861 – (861) – – –
CEO 13 – 814 – – 814 814
861 814 (861) – 814 814
2013
CEO 12 – 861 – – 861 861
– 861 – – 861 861
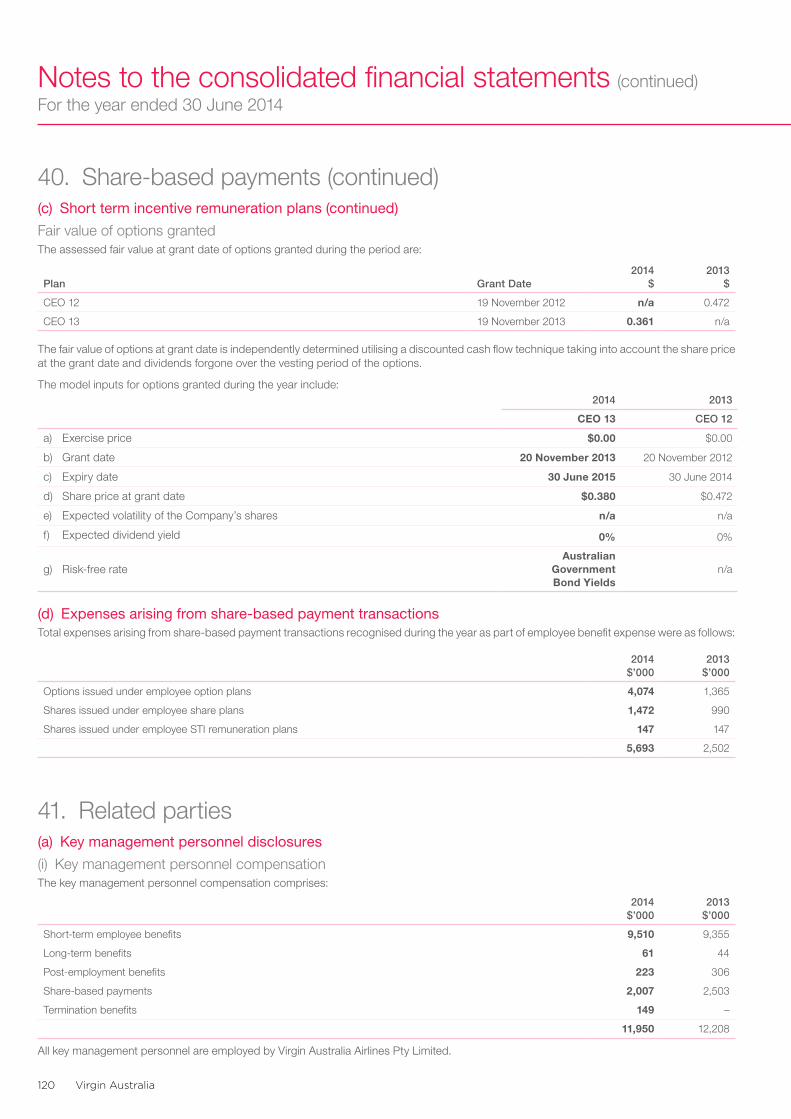
Virgin Australia120
Notes to the consolidated financial statements (continued)For the year ended 30 June 2014
40. Share-based payments (continued)(c) Short term incentive remuneration plans (continued)
Fair value of options grantedThe assessed fair value at grant date of options granted during the period are:
Plan Grant Date2014
$2013
$
CEO 12 19 November 2012 n/a 0.472
CEO 13 19 November 2013 0.361 n/a
The fair value of options at grant date is independently determined utilising a discounted cash flow technique taking into account the share price at the grant date and dividends forgone over the vesting period of the options.
The model inputs for options granted during the year include:2014 2013
CEO 13 CEO 12
a) Exercise price $0.00 $0.00
b) Grant date 20 November 2013 20 November 2012
c) Expiry date 30 June 2015 30 June 2014
d) Share price at grant date $0.380 $0.472
e) Expected volatility of the Company’s shares n/a n/a
f) Expected dividend yield 0% 0%
g) Risk-free rateAustralian
Government Bond Yields
n/a
(d) Expenses arising from share-based payment transactionsTotal expenses arising from share-based payment transactions recognised during the year as part of employee benefit expense were as follows:
2014 $’000
2013 $’000
Options issued under employee option plans 4,074 1,365
Shares issued under employee share plans 1,472 990
Shares issued under employee STI remuneration plans 147 147
5,693 2,502
41. Related parties(a) Key management personnel disclosures
(i) Key management personnel compensationThe key management personnel compensation comprises:
2014 $’000
2013 $’000
Short-term employee benefits 9,510 9,355
Long-term benefits 61 44
Post-employment benefits 223 306
Share-based payments 2,007 2,503
Termination benefits 149 –
11,950 12,208
All key management personnel are employed by Virgin Australia Airlines Pty Limited.
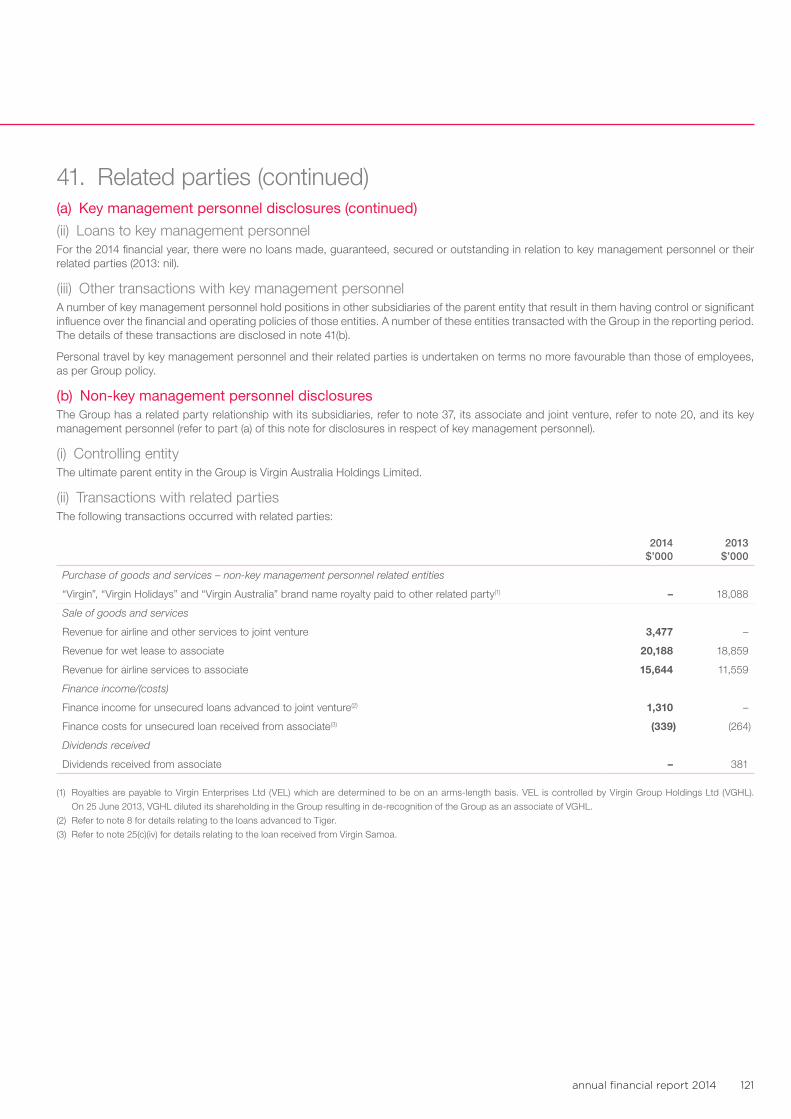
annual financial report 2014 121
41. Related parties (continued)(a) Key management personnel disclosures (continued)
(ii) Loans to key management personnelFor the 2014 financial year, there were no loans made, guaranteed, secured or outstanding in relation to key management personnel or their related parties (2013: nil).
(iii) Other transactions with key management personnelA number of key management personnel hold positions in other subsidiaries of the parent entity that result in them having control or significant influence over the financial and operating policies of those entities. A number of these entities transacted with the Group in the reporting period. The details of these transactions are disclosed in note 41(b).
Personal travel by key management personnel and their related parties is undertaken on terms no more favourable than those of employees, as per Group policy.
(b) Non-key management personnel disclosuresThe Group has a related party relationship with its subsidiaries, refer to note 37, its associate and joint venture, refer to note 20, and its key management personnel (refer to part (a) of this note for disclosures in respect of key management personnel).
(i) Controlling entityThe ultimate parent entity in the Group is Virgin Australia Holdings Limited.
(ii) Transactions with related partiesThe following transactions occurred with related parties:
2014 $’000
2013 $’000
Purchase of goods and services – non-key management personnel related entities
“Virgin”, “Virgin Holidays” and “Virgin Australia” brand name royalty paid to other related party(1) – 18,088
Sale of goods and services
Revenue for airline and other services to joint venture 3,477 –
Revenue for wet lease to associate 20,188 18,859
Revenue for airline services to associate 15,644 11,559
Finance income/(costs)
Finance income for unsecured loans advanced to joint venture(2) 1,310 –
Finance costs for unsecured loan received from associate(3) (339) (264)
Dividends received
Dividends received from associate – 381
(1) Royalties are payable to Virgin Enterprises Ltd (VEL) which are determined to be on an arms-length basis. VEL is controlled by Virgin Group Holdings Ltd (VGHL).
On 25 June 2013, VGHL diluted its shareholding in the Group resulting in de-recognition of the Group as an associate of VGHL.
(2) Refer to note 8 for details relating to the loans advanced to Tiger.
(3) Refer to note 25(c)(iv) for details relating to the loan received from Virgin Samoa.
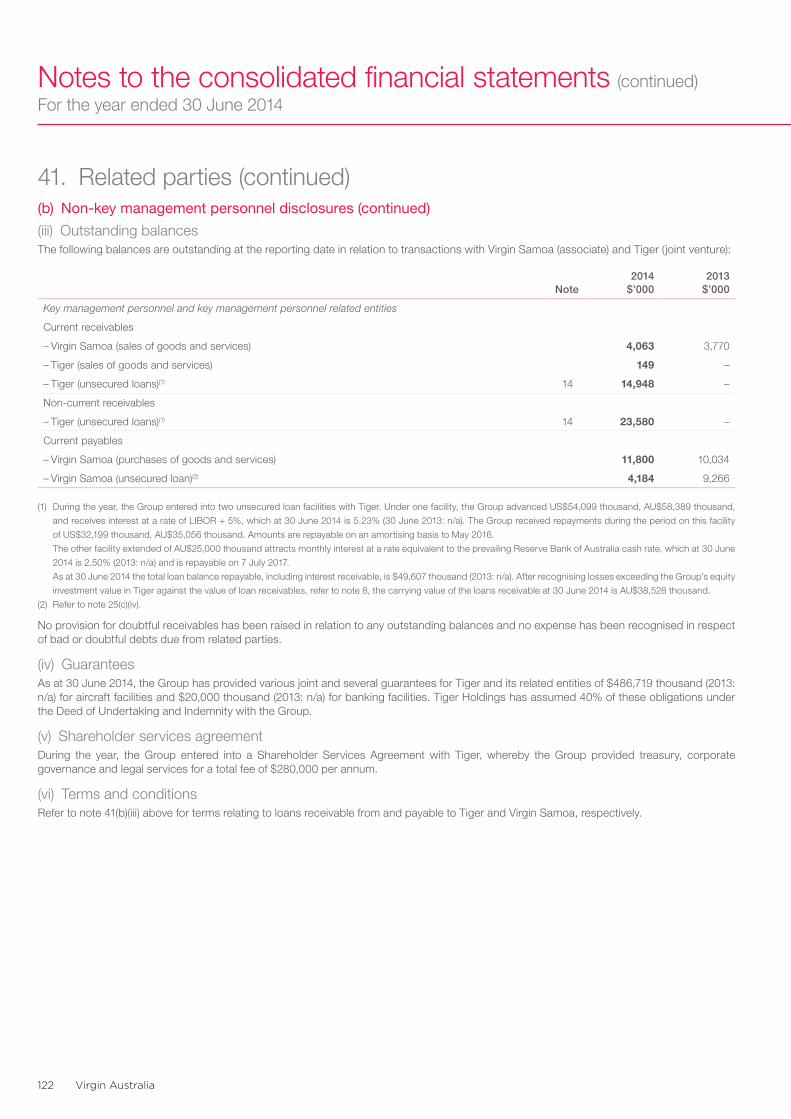
Virgin Australia122
Notes to the consolidated financial statements (continued)For the year ended 30 June 2014
41. Related parties (continued)(b) Non-key management personnel disclosures (continued)
(iii) Outstanding balancesThe following balances are outstanding at the reporting date in relation to transactions with Virgin Samoa (associate) and Tiger (joint venture):
Note2014
$’0002013
$’000
Key management personnel and key management personnel related entities
Current receivables
– Virgin Samoa (sales of goods and services) 4,063 3,770
– Tiger (sales of goods and services) 149 –
– Tiger (unsecured loans)(1) 14 14,948 –
Non-current receivables
– Tiger (unsecured loans)(1) 14 23,580 –
Current payables
– Virgin Samoa (purchases of goods and services) 11,800 10,034
– Virgin Samoa (unsecured loan)(2) 4,184 9,266
(1) During the year, the Group entered into two unsecured loan facilities with Tiger. Under one facility, the Group advanced US$54,099 thousand, AU$58,389 thousand,
and receives interest at a rate of LIBOR + 5%, which at 30 June 2014 is 5.23% (30 June 2013: n/a). The Group received repayments during the period on this facility
of US$32,199 thousand, AU$35,056 thousand. Amounts are repayable on an amortising basis to May 2016.
The other facility extended of AU$25,000 thousand attracts monthly interest at a rate equivalent to the prevailing Reserve Bank of Australia cash rate, which at 30 June
2014 is 2.50% (2013: n/a) and is repayable on 7 July 2017.
As at 30 June 2014 the total loan balance repayable, including interest receivable, is $49,607 thousand (2013: n/a). After recognising losses exceeding the Group’s equity
investment value in Tiger against the value of loan receivables, refer to note 8, the carrying value of the loans receivable at 30 June 2014 is AU$38,528 thousand.
(2) Refer to note 25(c)(iv).
No provision for doubtful receivables has been raised in relation to any outstanding balances and no expense has been recognised in respect of bad or doubtful debts due from related parties.
(iv) GuaranteesAs at 30 June 2014, the Group has provided various joint and several guarantees for Tiger and its related entities of $486,719 thousand (2013: n/a) for aircraft facilities and $20,000 thousand (2013: n/a) for banking facilities. Tiger Holdings has assumed 40% of these obligations under the Deed of Undertaking and Indemnity with the Group.
(v) Shareholder services agreementDuring the year, the Group entered into a Shareholder Services Agreement with Tiger, whereby the Group provided treasury, corporate governance and legal services for a total fee of $280,000 per annum.
(vi) Terms and conditionsRefer to note 41(b)(iii) above for terms relating to loans receivable from and payable to Tiger and Virgin Samoa, respectively.
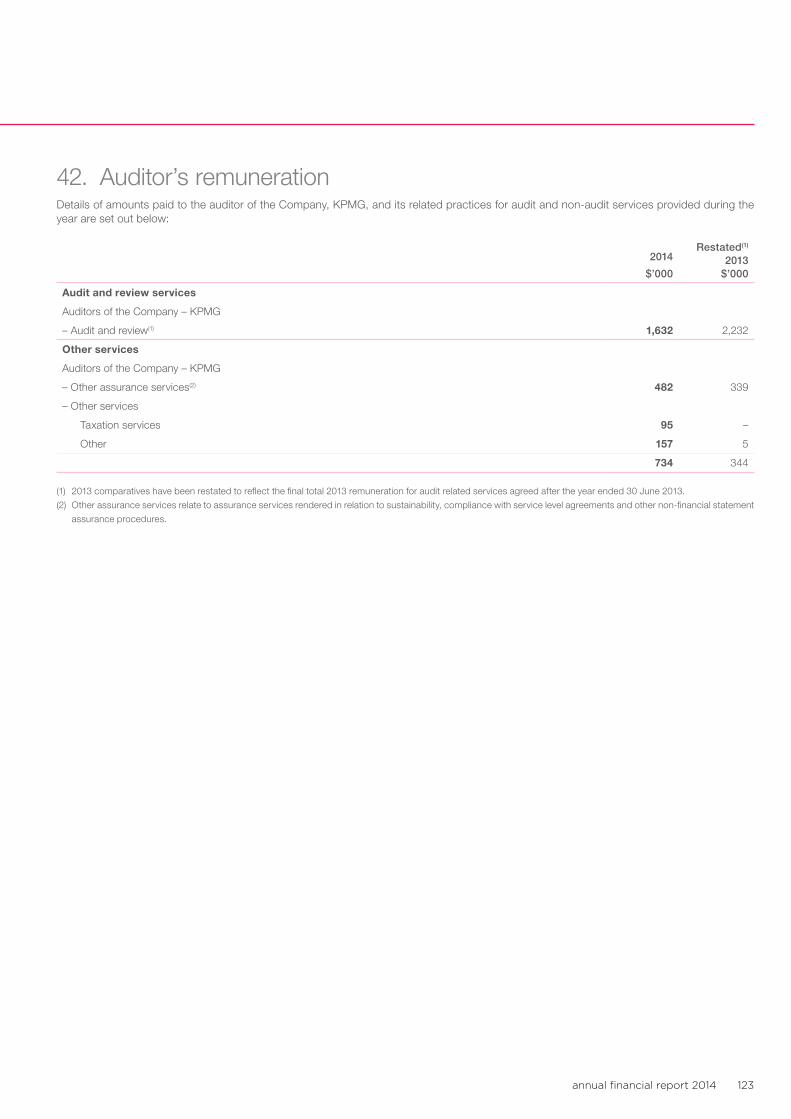
annual financial report 2014 123
42. Auditor’s remunerationDetails of amounts paid to the auditor of the Company, KPMG, and its related practices for audit and non-audit services provided during the year are set out below:
2014
$’000
Restated(1) 2013
$’000
Audit and review services
Auditors of the Company – KPMG
– Audit and review(1) 1,632 2,232
Other services
Auditors of the Company – KPMG
– Other assurance services(2) 482 339
– Other services
Taxation services 95 –
Other 157 5
734 344
(1) 2013 comparatives have been restated to reflect the final total 2013 remuneration for audit related services agreed after the year ended 30 June 2013.
(2) Other assurance services relate to assurance services rendered in relation to sustainability, compliance with service level agreements and other non-financial statement
assurance procedures.
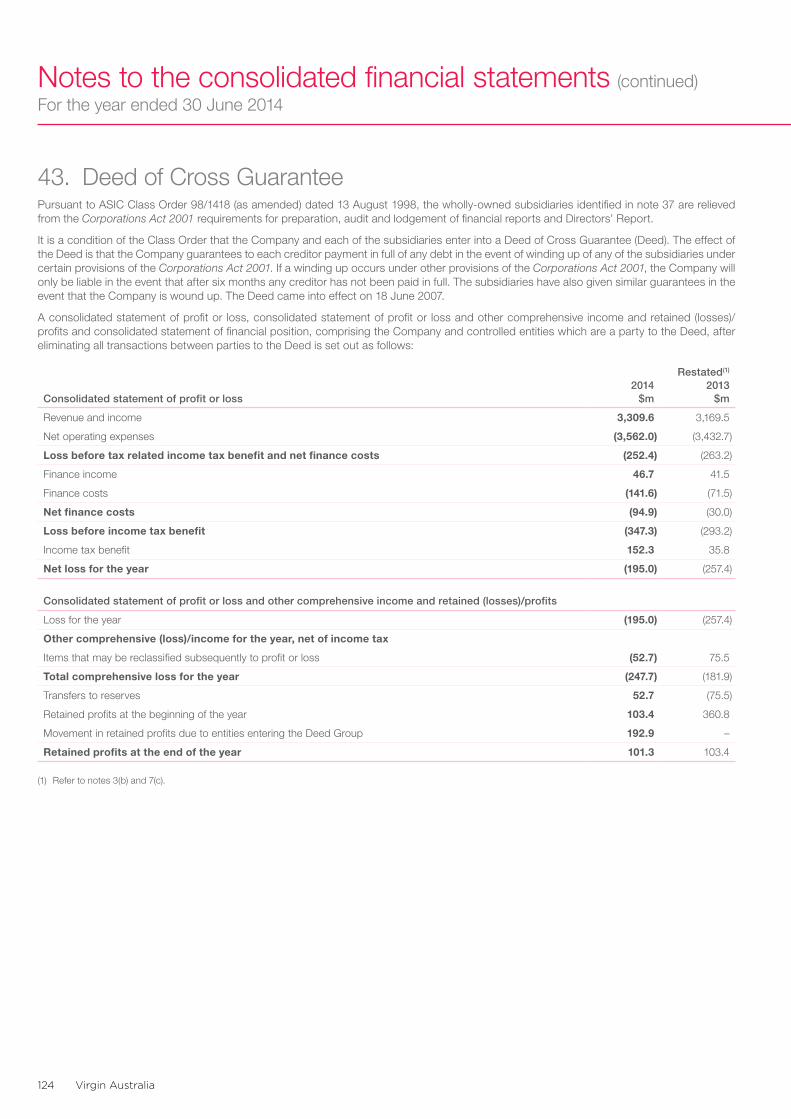
Virgin Australia124
Notes to the consolidated financial statements (continued)For the year ended 30 June 2014
43. Deed of Cross GuaranteePursuant to ASIC Class Order 98/1418 (as amended) dated 13 August 1998, the wholly-owned subsidiaries identified in note 37 are relieved from the Corporations Act 2001 requirements for preparation, audit and lodgement of financial reports and Directors’ Report.
It is a condition of the Class Order that the Company and each of the subsidiaries enter into a Deed of Cross Guarantee (Deed). The effect of the Deed is that the Company guarantees to each creditor payment in full of any debt in the event of winding up of any of the subsidiaries under certain provisions of the Corporations Act 2001. If a winding up occurs under other provisions of the Corporations Act 2001, the Company will only be liable in the event that after six months any creditor has not been paid in full. The subsidiaries have also given similar guarantees in the event that the Company is wound up. The Deed came into effect on 18 June 2007.
A consolidated statement of profit or loss, consolidated statement of profit or loss and other comprehensive income and retained (losses)/profits and consolidated statement of financial position, comprising the Company and controlled entities which are a party to the Deed, after eliminating all transactions between parties to the Deed is set out as follows:
Consolidated statement of profit or loss2014
$m
Restated(1) 2013
$m
Revenue and income 3,309.6 3,169.5
Net operating expenses (3,562.0) (3,432.7)
Loss before tax related income tax benefit and net finance costs (252.4) (263.2)
Finance income 46.7 41.5
Finance costs (141.6) (71.5)
Net finance costs (94.9) (30.0)
Loss before income tax benefit (347.3) (293.2)
Income tax benefit 152.3 35.8
Net loss for the year (195.0) (257.4)
Consolidated statement of profit or loss and other comprehensive income and retained (losses)/profits
Loss for the year (195.0) (257.4)
Other comprehensive (loss)/income for the year, net of income tax
Items that may be reclassified subsequently to profit or loss (52.7) 75.5
Total comprehensive loss for the year (247.7) (181.9)
Transfers to reserves 52.7 (75.5)
Retained profits at the beginning of the year 103.4 360.8
Movement in retained profits due to entities entering the Deed Group 192.9 –
Retained profits at the end of the year 101.3 103.4
(1) Refer to notes 3(b) and 7(c).
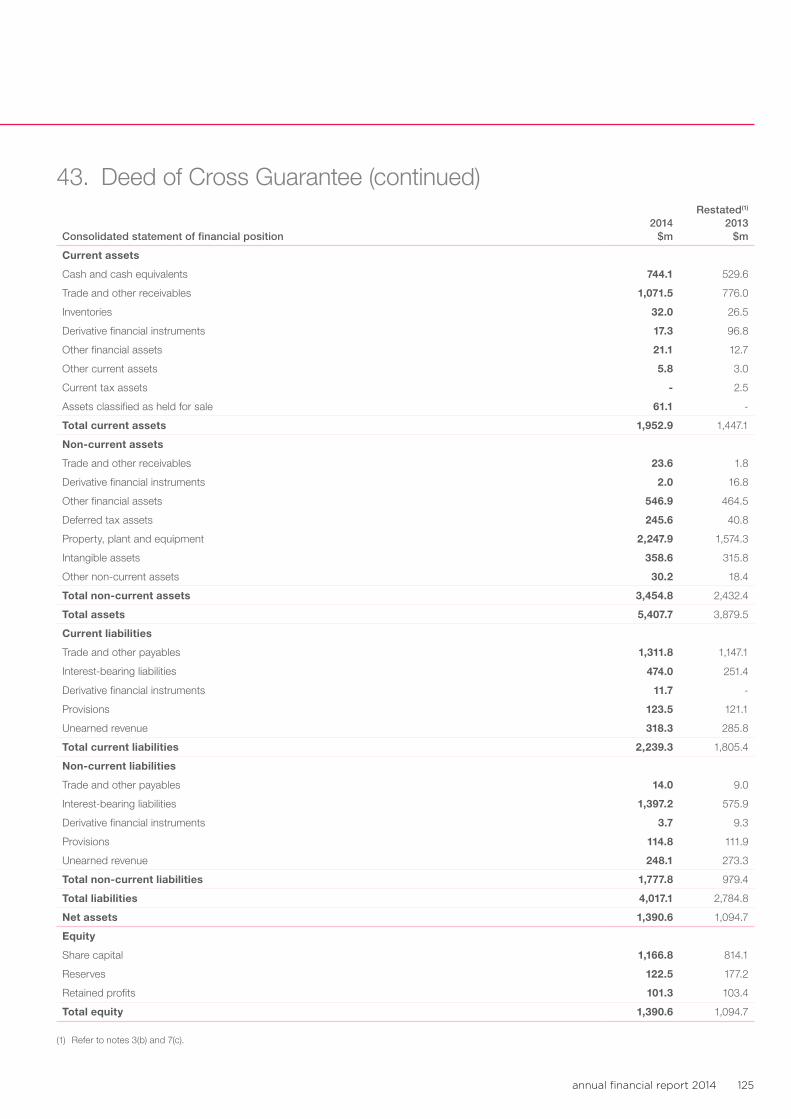
annual financial report 2014 125
43. Deed of Cross Guarantee (continued)
Consolidated statement of financial position2014
$m
Restated(1) 2013
$m
Current assets
Cash and cash equivalents 744.1 529.6
Trade and other receivables 1,071.5 776.0
Inventories 32.0 26.5
Derivative financial instruments 17.3 96.8
Other financial assets 21.1 12.7
Other current assets 5.8 3.0
Current tax assets - 2.5
Assets classified as held for sale 61.1 -
Total current assets 1,952.9 1,447.1
Non-current assets
Trade and other receivables 23.6 1.8
Derivative financial instruments 2.0 16.8
Other financial assets 546.9 464.5
Deferred tax assets 245.6 40.8
Property, plant and equipment 2,247.9 1,574.3
Intangible assets 358.6 315.8
Other non-current assets 30.2 18.4
Total non-current assets 3,454.8 2,432.4
Total assets 5,407.7 3,879.5
Current liabilities
Trade and other payables 1,311.8 1,147.1
Interest-bearing liabilities 474.0 251.4
Derivative financial instruments 11.7 -
Provisions 123.5 121.1
Unearned revenue 318.3 285.8
Total current liabilities 2,239.3 1,805.4
Non-current liabilities
Trade and other payables 14.0 9.0
Interest-bearing liabilities 1,397.2 575.9
Derivative financial instruments 3.7 9.3
Provisions 114.8 111.9
Unearned revenue 248.1 273.3
Total non-current liabilities 1,777.8 979.4
Total liabilities 4,017.1 2,784.8
Net assets 1,390.6 1,094.7
Equity
Share capital 1,166.8 814.1
Reserves 122.5 177.2
Retained profits 101.3 103.4
Total equity 1,390.6 1,094.7
(1) Refer to notes 3(b) and 7(c).
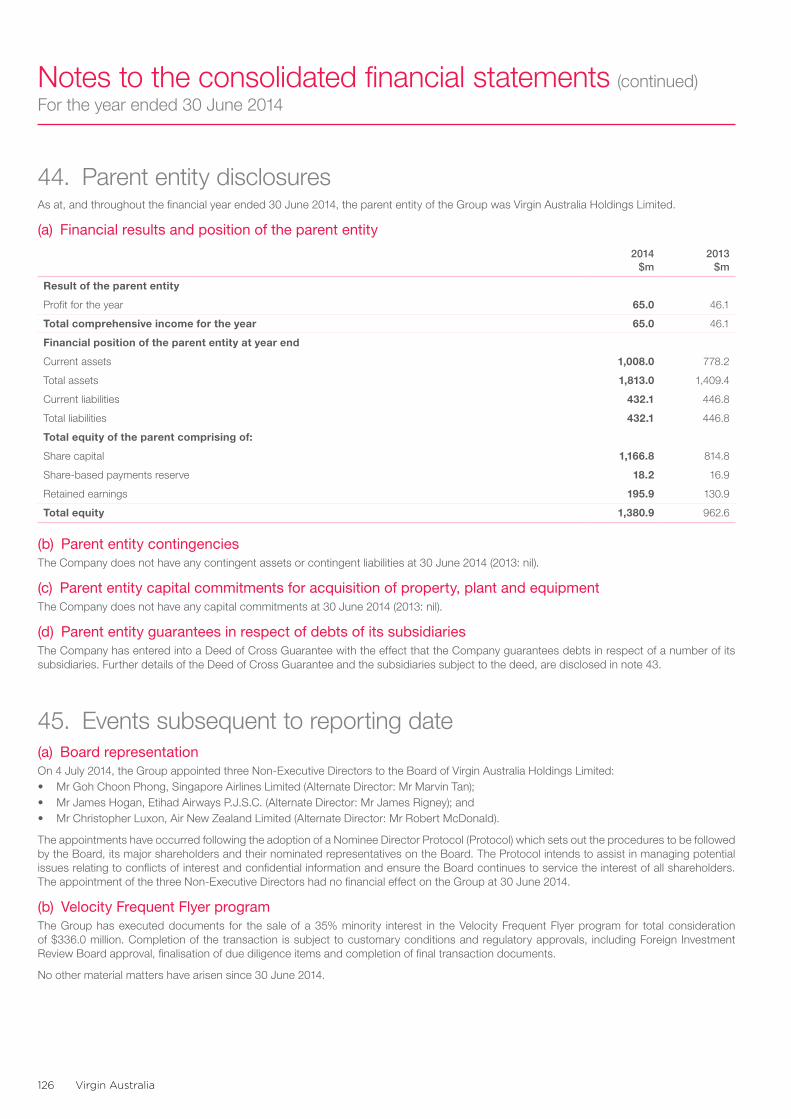
Virgin Australia126
Notes to the consolidated financial statements (continued)For the year ended 30 June 2014
44. Parent entity disclosuresAs at, and throughout the financial year ended 30 June 2014, the parent entity of the Group was Virgin Australia Holdings Limited.
(a) Financial results and position of the parent entity
2014 $m
2013 $m
Result of the parent entity
Profit for the year 65.0 46.1
Total comprehensive income for the year 65.0 46.1
Financial position of the parent entity at year end
Current assets 1,008.0 778.2
Total assets 1,813.0 1,409.4
Current liabilities 432.1 446.8
Total liabilities 432.1 446.8
Total equity of the parent comprising of:
Share capital 1,166.8 814.8
Share-based payments reserve 18.2 16.9
Retained earnings 195.9 130.9
Total equity 1,380.9 962.6
(b) Parent entity contingenciesThe Company does not have any contingent assets or contingent liabilities at 30 June 2014 (2013: nil).
(c) Parent entity capital commitments for acquisition of property, plant and equipmentThe Company does not have any capital commitments at 30 June 2014 (2013: nil).
(d) Parent entity guarantees in respect of debts of its subsidiariesThe Company has entered into a Deed of Cross Guarantee with the effect that the Company guarantees debts in respect of a number of its subsidiaries. Further details of the Deed of Cross Guarantee and the subsidiaries subject to the deed, are disclosed in note 43.
45. Events subsequent to reporting date(a) Board representationOn 4 July 2014, the Group appointed three Non-Executive Directors to the Board of Virgin Australia Holdings Limited:• Mr Goh Choon Phong, Singapore Airlines Limited (Alternate Director: Mr Marvin Tan);• Mr James Hogan, Etihad Airways P.J.S.C. (Alternate Director: Mr James Rigney); and• Mr Christopher Luxon, Air New Zealand Limited (Alternate Director: Mr Robert McDonald).
The appointments have occurred following the adoption of a Nominee Director Protocol (Protocol) which sets out the procedures to be followed by the Board, its major shareholders and their nominated representatives on the Board. The Protocol intends to assist in managing potential issues relating to conflicts of interest and confidential information and ensure the Board continues to service the interest of all shareholders. The appointment of the three Non-Executive Directors had no financial effect on the Group at 30 June 2014.
(b) Velocity Frequent Flyer programThe Group has executed documents for the sale of a 35% minority interest in the Velocity Frequent Flyer program for total consideration of $336.0 million. Completion of the transaction is subject to customary conditions and regulatory approvals, including Foreign Investment Review Board approval, finalisation of due diligence items and completion of final transaction documents.
No other material matters have arisen since 30 June 2014.
annual financial report 2014 127
Directors’ declaration
1. In the opinion of the directors of Virgin Australia Holdings Limited (the Company):
(a) the consolidated financial statements and notes that are set out on pages 44 to 126 and the Remuneration report in section 5 in the Directors’ Report, are in accordance with the Corporations Act 2001, including:
(i) giving a true and fair view of the Group’s financial position as at 30 June 2014 and of its performance for the financial year ended on that date;
(ii) complying with Australian Accounting Standards and the Corporations Regulations 2001; and
(b) there are reasonable grounds to believe that the Company will be able to pay its debts as and when they become due and payable.
2. There are reasonable grounds to believe that the Company and the group entities identified in note 37 will be able to meet any obligations or liabilities to which they are or may become subject to by virtue of the Deed of Cross Guarantee between the Company and those group entities pursuant to ASIC Class Order 98/1418.
3. The directors have been given the declarations required by Section 295A of the Corporations Act 2001 from the Chief Executive Officer and Chief Financial Officer for the financial year ended 30 June 2014.
4. The directors draw attention to note 2(a) to the financial statements, which includes a statement of compliance with International Financial Reporting Standards.
Signed in accordance with a resolution of the directors:
Neil Chatfield John Borghetti Director Director
Dated at Sydney, 29 September 2014
Virgin Australia128
Independent auditor’s report to the members of Virgin Australia Holdings LimitedReport on the financial reportWe have audited the accompanying financial report of Virgin Australia Holdings Limited (the company), which comprises the consolidated statement of financial position as at 30 June 2014, and consolidated statement of profit or loss, consolidated statement of profit or loss and other comprehensive income, consolidated statement of changes in equity and consolidated statement of cash flows for the year ended on that date, notes 1 to 45 comprising a summary of significant accounting policies and other explanatory information and the directors’ declaration of the Group comprising the company and the entities it controlled at the year’s end or from time to time during the financial year.
Directors’ responsibility for the financial report The directors of the company are responsible for the preparation of the financial report that gives a true and fair view in accordance with Australian Accounting Standards and the Corporations Act 2001 and for such internal control as the directors determine is necessary to enable the preparation of the financial report that is free from material misstatement whether due to fraud or error. In note 2(a), the directors also state, in accordance with Australian Accounting Standard AASB 101 Presentation of Financial Statements, that the financial statements of the Group comply with International Financial Reporting Standards.
Auditor’s responsibilityOur responsibility is to express an opinion on the financial report based on our audit. We conducted our audit in accordance with Australian Auditing Standards. These Auditing Standards require that we comply with relevant ethical requirements relating to audit engagements and plan and perform the audit to obtain reasonable assurance whether the financial report is free from material misstatement.
An audit involves performing procedures to obtain audit evidence about the amounts and disclosures in the financial report. The procedures selected depend on the auditor’s judgement, including the assessment of the risks of material misstatement of the financial report, whether due to fraud or error. In making those risk assessments, the auditor considers internal control relevant to the entity’s preparation of the financial report that gives a true and fair view in order to design audit procedures that are appropriate in the circumstances, but not for the purpose of expressing an opinion on the effectiveness of the entity’s internal control. An audit also includes evaluating the appropriateness of accounting policies used and the reasonableness of accounting estimates made by the directors, as well as evaluating the overall presentation of the financial report.
We performed the procedures to assess whether in all material respects the financial report presents fairly, in accordance with the Corporations Act 2001 and Australian Accounting Standards, a true and fair view which is consistent with our understanding of the Group’s financial position and of its performance.
We believe that the audit evidence we have obtained is sufficient and appropriate to provide a basis for our audit opinion.
IndependenceIn conducting our audit, we have complied with the independence requirements of the Corporations Act 2001.
Auditor’s opinionIn our opinion:a) the financial report of the Group is in accordance with the Corporations Act 2001, including:
(i) giving a true and fair view of the Group’s financial position as at 30 June 2014 and of its performance for the year ended on that date; and
(ii) complying with Australian Accounting Standards and the Corporations Regulations 2001.
b) the financial report also complies with International Financial Reporting Standards as disclosed in note 2(a).
KPMG, an Australian partnership and a member firm of the KPMG network of independent member firms affiliated with KPMG International Cooperative (“KPMG International”), a Swiss entity.
Liability limited by a scheme approved under Professional Standards Legislation.
annual financial report 2014 129
Independent auditor’s report to the members of Virgin Australia Holdings Limited (continued)Report on the remuneration reportWe have audited the Remuneration report included in pages 24 to 40 of the Directors’ Report for the year ended 30 June 2014. The directors of the company are responsible for the preparation and presentation of the remuneration report in accordance with Section 300A of the Corporations Act 2001. Our responsibility is to express an opinion on the remuneration report, based on our audit conducted in accordance with auditing standards.
Auditor’s opinionIn our opinion, the remuneration report of Virgin Australia Holdings Limited for the year ended 30 June 2014, complies with Section 300A of the Corporations Act 2001.
KPMG
A W Young Partner
Sydney, 29 September 2014
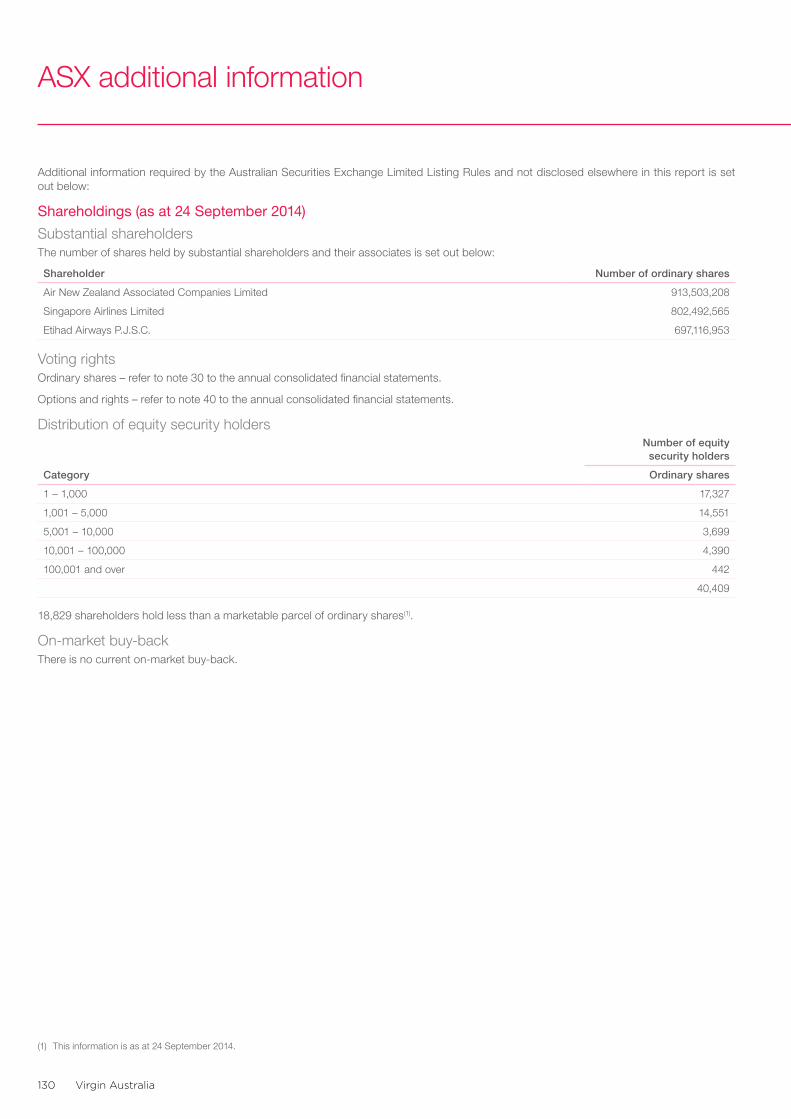
Virgin Australia130
ASX additional information
Additional information required by the Australian Securities Exchange Limited Listing Rules and not disclosed elsewhere in this report is set out below:
Shareholdings (as at 24 September 2014)
Substantial shareholdersThe number of shares held by substantial shareholders and their associates is set out below:
Shareholder Number of ordinary shares
Air New Zealand Associated Companies Limited 913,503,208
Singapore Airlines Limited 802,492,565
Etihad Airways P.J.S.C. 697,116,953
Voting rightsOrdinary shares – refer to note 30 to the annual consolidated financial statements.
Options and rights – refer to note 40 to the annual consolidated financial statements.
Distribution of equity security holdersNumber of equity
security holders
Category Ordinary shares
1 – 1,000 17,327
1,001 – 5,000 14,551
5,001 – 10,000 3,699
10,001 – 100,000 4,390
100,001 and over 442
40,409
18,829 shareholders hold less than a marketable parcel of ordinary shares(1).
On-market buy-backThere is no current on-market buy-back.
(1) This information is as at 24 September 2014.
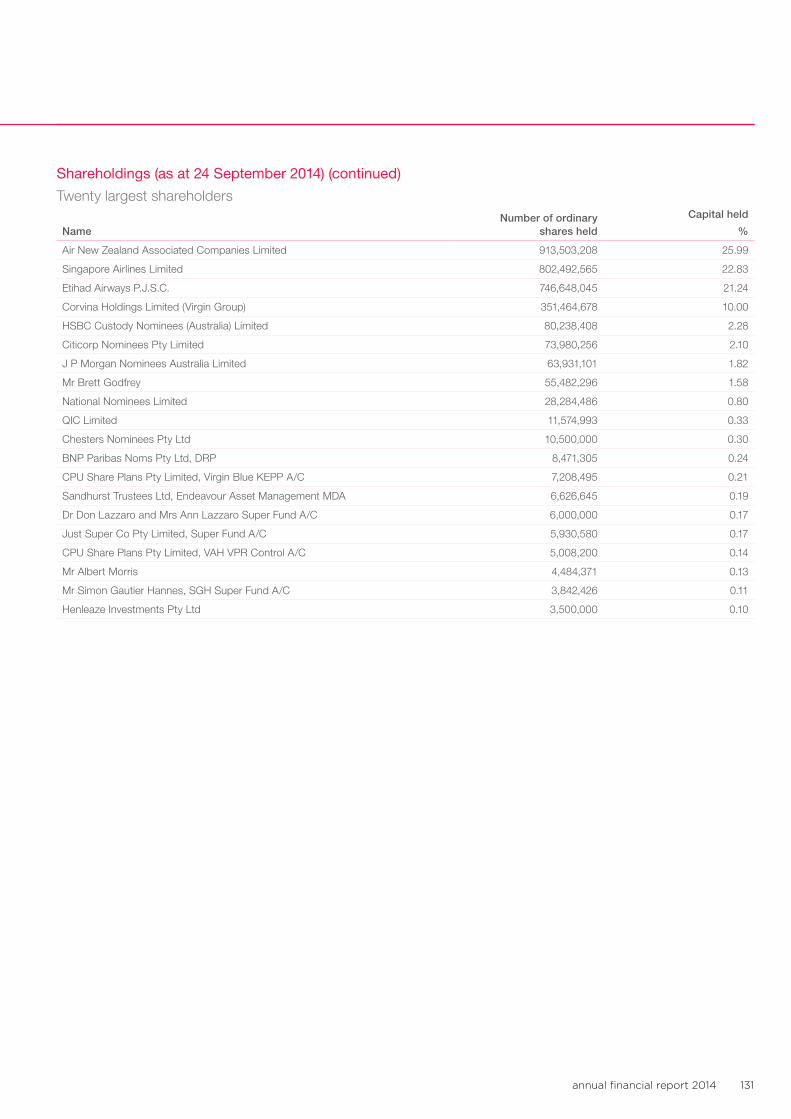
annual financial report 2014 131
Shareholdings (as at 24 September 2014) (continued)
Twenty largest shareholders
NameNumber of ordinary
shares held
Capital held
%
Air New Zealand Associated Companies Limited 913,503,208 25.99
Singapore Airlines Limited 802,492,565 22.83
Etihad Airways P.J.S.C. 746,648,045 21.24
Corvina Holdings Limited (Virgin Group) 351,464,678 10.00
HSBC Custody Nominees (Australia) Limited 80,238,408 2.28
Citicorp Nominees Pty Limited 73,980,256 2.10
J P Morgan Nominees Australia Limited 63,931,101 1.82
Mr Brett Godfrey 55,482,296 1.58
National Nominees Limited 28,284,486 0.80
QIC Limited 11,574,993 0.33
Chesters Nominees Pty Ltd 10,500,000 0.30
BNP Paribas Noms Pty Ltd, DRP 8,471,305 0.24
CPU Share Plans Pty Limited, Virgin Blue KEPP A/C 7,208,495 0.21
Sandhurst Trustees Ltd, Endeavour Asset Management MDA 6,626,645 0.19
Dr Don Lazzaro and Mrs Ann Lazzaro Super Fund A/C 6,000,000 0.17
Just Super Co Pty Limited, Super Fund A/C 5,930,580 0.17
CPU Share Plans Pty Limited, VAH VPR Control A/C 5,008,200 0.14
Mr Albert Morris 4,484,371 0.13
Mr Simon Gautier Hannes, SGH Super Fund A/C 3,842,426 0.11
Henleaze Investments Pty Ltd 3,500,000 0.10
Virgin Australia132
Sustainability – Flying for the Future
About this reportThis report presents a summary of Virgin Australia’s sustainability progress and performance for the period 1 July 2013 through to 30 June 2014. This report encompasses the domestic and international operations of Virgin Australia. The Skywest Airlines Pte Limited group of entities has been included in the scope of this report for 2014 only. Virgin Australia’s alliance partnerships, the other Virgin Group businesses and Virgin Australia’s interest in Tiger Airways Australia Pty Limited have not been included in the scope of this report. For more information or to provide feedback on the sustainability content of this report please email [email protected].
Sustainability2014 marks the fourth year Virgin Australia has reported to stakeholders on our performance and progress towards becoming a more sustainable business. We continue to focus on sustainable growth and to ensuring that we are embedding sustainable practices across our business.
The format for this year’s Sustainability Report has changed to accommodate the inclusion of information from Virgin Australia Regional Airlines Pty Ltd (VARA). For transparency, certain VARA figures have been reported separately to enable simpler comparisons with prior periods. The 2014 Sustainability Report continues to utilise the Global Reporting Initiative (GRI) G3.1 framework as the basis for our Sustainability assessment approach.
Our approach to sustainabilityVirgin Australia has a strong commitment to becoming a more sustainable business and working towards our vision of sustainability leadership within the aviation industry. As our business continues to change and mature we remain focussed on ensuring that we are growing sustainably. This approach is enshrined in our Sustainability Policy, a copy of which can be downloaded from our website(1). Relevant sustainability performance data can be found on page 134.
Further information on our corporate governance processes and ethical business practices can be found in the Directors’ Report.
Engaging our stakeholdersVirgin Australia recognises that we have many important stakeholders. Our list of key stakeholders have been identified and prioritised after careful consideration of groups and individuals who have invested in our business, been affected by our activities or who affect our ability to implement strategies and achieve our objectives. As the business continues to grow and diversify there is an ongoing need to consider an ever broader range of stakeholders. Our ability to communicate with our stakeholders and receive their feedback also continues to improve which assists in assessing the materiality of our impacts.
Assessing materiality The assessment of materiality is critical to sustainability reporting as it ensures that our Sustainability Report appropriately reflects our significant economic, environmental and social impacts along with issues that may substantively influence the assessments and decisions of our stakeholders. Those issues most critical to our stakeholders have again been identified by using a five-part materiality test. This test included the consideration of our:
1. Direct financial impacts
2. Policy related performance
3. Organisational peer based norms
4. Stakeholder behaviour and concerns
5. Societal norms
Each issue was then prioritised using a materiality matrix that plotted issues according to their relative significance to stakeholders and the relative significance to Virgin Australia. The results were then reviewed and validated by the Virgin Australia Sustainability Steering Committee.
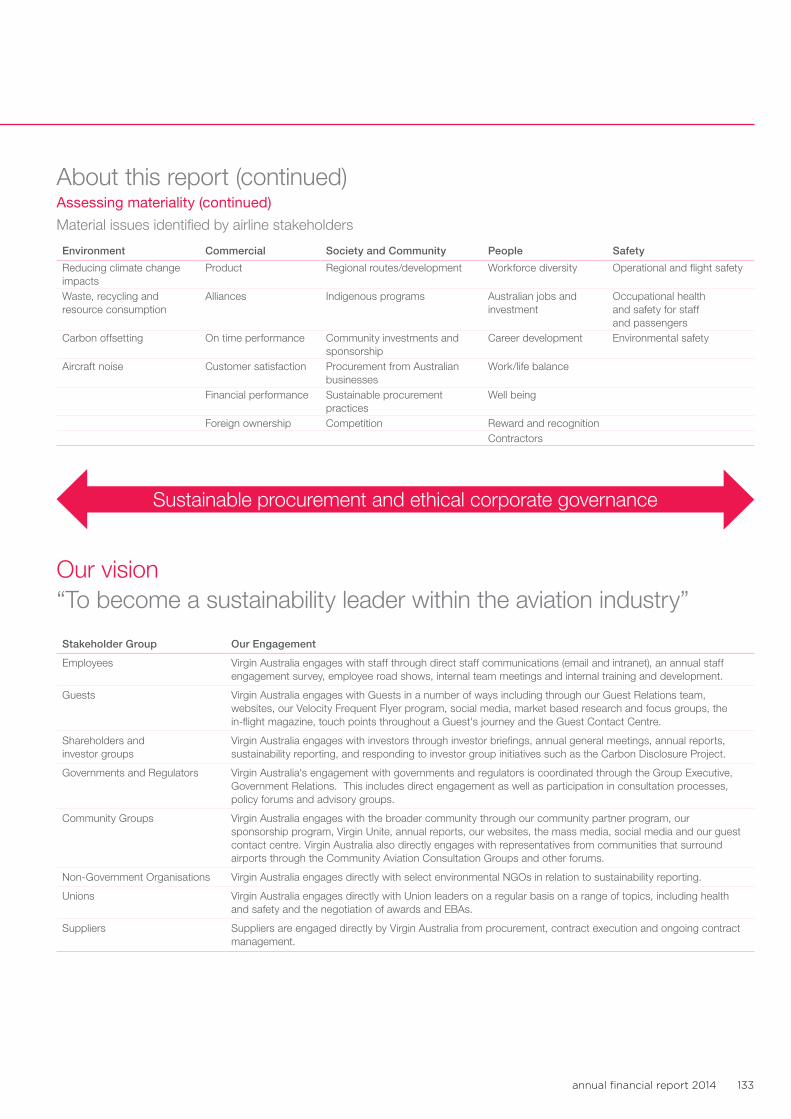
annual financial report 2014 133
About this report (continued)Assessing materiality (continued)
Material issues identified by airline stakeholders
Environment Commercial Society and Community People Safety
Reducing climate change impacts
Product Regional routes/development Workforce diversity Operational and flight safety
Waste, recycling and resource consumption
Alliances Indigenous programs Australian jobs and investment
Occupational health and safety for staff and passengers
Carbon offsetting On time performance Community investments and sponsorship
Career development Environmental safety
Aircraft noise Customer satisfaction Procurement from Australian businesses
Work/life balance
Financial performance Sustainable procurement practices
Well being
Foreign ownership Competition Reward and recognitionContractors
Sustainable procurement and ethical corporate governance
Our vision“To become a sustainability leader within the aviation industry”
Stakeholder Group Our Engagement
Employees Virgin Australia engages with staff through direct staff communications (email and intranet), an annual staff engagement survey, employee road shows, internal team meetings and internal training and development.
Guests Virgin Australia engages with Guests in a number of ways including through our Guest Relations team, websites, our Velocity Frequent Flyer program, social media, market based research and focus groups, the in-flight magazine, touch points throughout a Guest's journey and the Guest Contact Centre.
Shareholders and investor groups
Virgin Australia engages with investors through investor briefings, annual general meetings, annual reports, sustainability reporting, and responding to investor group initiatives such as the Carbon Disclosure Project.
Governments and Regulators Virgin Australia's engagement with governments and regulators is coordinated through the Group Executive, Government Relations. This includes direct engagement as well as participation in consultation processes, policy forums and advisory groups.
Community Groups Virgin Australia engages with the broader community through our community partner program, our sponsorship program, Virgin Unite, annual reports, our websites, the mass media, social media and our guest contact centre. Virgin Australia also directly engages with representatives from communities that surround airports through the Community Aviation Consultation Groups and other forums.
Non-Government Organisations Virgin Australia engages directly with select environmental NGOs in relation to sustainability reporting.
Unions Virgin Australia engages directly with Union leaders on a regular basis on a range of topics, including health and safety and the negotiation of awards and EBAs.
Suppliers Suppliers are engaged directly by Virgin Australia from procurement, contract execution and ongoing contract management.
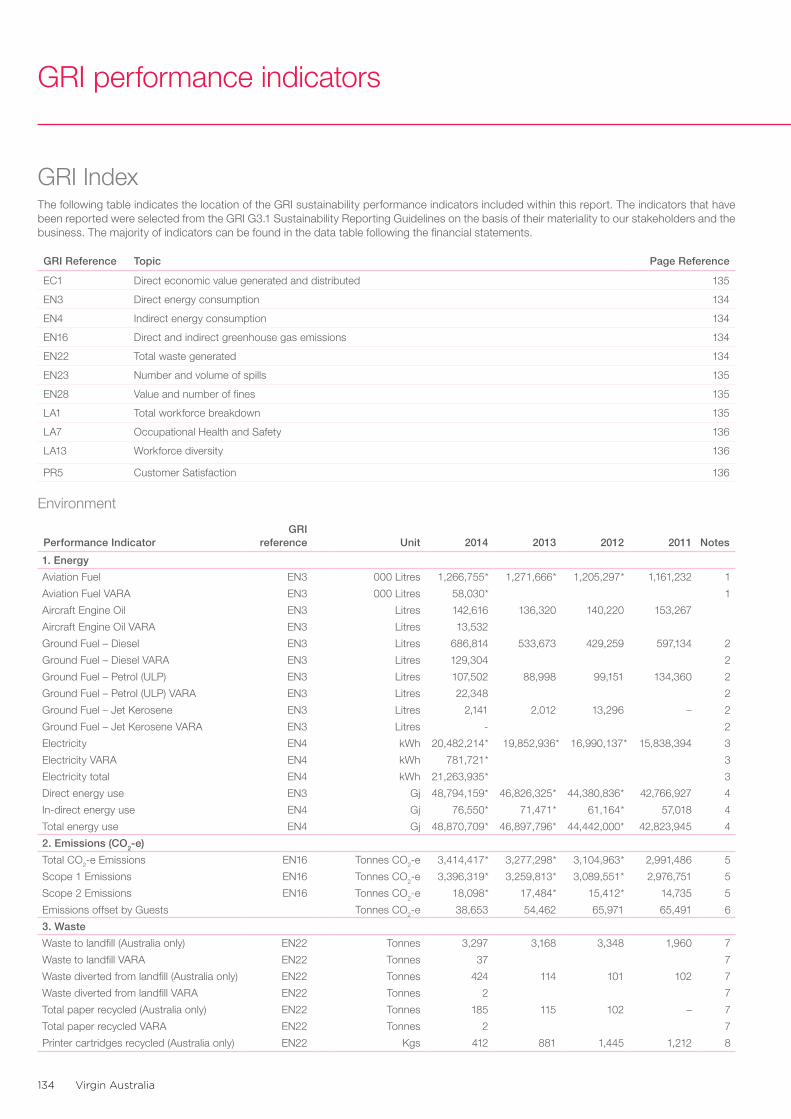
Virgin Australia134
GRI performance indicators
GRI Index The following table indicates the location of the GRI sustainability performance indicators included within this report. The indicators that have been reported were selected from the GRI G3.1 Sustainability Reporting Guidelines on the basis of their materiality to our stakeholders and the business. The majority of indicators can be found in the data table following the financial statements.
GRI Reference Topic Page Reference
EC1 Direct economic value generated and distributed 135
EN3 Direct energy consumption 134
EN4 Indirect energy consumption 134
EN16 Direct and indirect greenhouse gas emissions 134
EN22 Total waste generated 134
EN23 Number and volume of spills 135
EN28 Value and number of fines 135
LA1 Total workforce breakdown 135
LA7 Occupational Health and Safety 136
LA13 Workforce diversity 136
PR5 Customer Satisfaction 136
Environment
Performance IndicatorGRI
reference Unit 2014 2013 2012 2011 Notes
1. Energy
Aviation Fuel EN3 000 Litres 1,266,755* 1,271,666* 1,205,297* 1,161,232 1
Aviation Fuel VARA EN3 000 Litres 58,030* 1
Aircraft Engine Oil EN3 Litres 142,616 136,320 140,220 153,267
Aircraft Engine Oil VARA EN3 Litres 13,532
Ground Fuel – Diesel EN3 Litres 686,814 533,673 429,259 597,134 2
Ground Fuel – Diesel VARA EN3 Litres 129,304 2
Ground Fuel – Petrol (ULP) EN3 Litres 107,502 88,998 99,151 134,360 2
Ground Fuel – Petrol (ULP) VARA EN3 Litres 22,348 2
Ground Fuel – Jet Kerosene EN3 Litres 2,141 2,012 13,296 – 2
Ground Fuel – Jet Kerosene VARA EN3 Litres - 2
Electricity EN4 kWh 20,482,214* 19,852,936* 16,990,137* 15,838,394 3
Electricity VARA EN4 kWh 781,721* 3
Electricity total EN4 kWh 21,263,935* 3
Direct energy use EN3 Gj 48,794,159* 46,826,325* 44,380,836* 42,766,927 4
In-direct energy use EN4 Gj 76,550* 71,471* 61,164* 57,018 4
Total energy use EN4 Gj 48,870,709* 46,897,796* 44,442,000* 42,823,945 4
2. Emissions (CO2-e)
Total CO2-e Emissions EN16 Tonnes CO2-e 3,414,417* 3,277,298* 3,104,963* 2,991,486 5
Scope 1 Emissions EN16 Tonnes CO2-e 3,396,319* 3,259,813* 3,089,551* 2,976,751 5
Scope 2 Emissions EN16 Tonnes CO2-e 18,098* 17,484* 15,412* 14,735 5
Emissions offset by Guests Tonnes CO2-e 38,653 54,462 65,971 65,491 6
3. Waste
Waste to landfill (Australia only) EN22 Tonnes 3,297 3,168 3,348 1,960 7
Waste to landfill VARA EN22 Tonnes 37 7
Waste diverted from landfill (Australia only) EN22 Tonnes 424 114 101 102 7
Waste diverted from landfill VARA EN22 Tonnes 2 7
Total paper recycled (Australia only) EN22 Tonnes 185 115 102 – 7
Total paper recycled VARA EN22 Tonnes 2 7
Printer cartridges recycled (Australia only) EN22 Kgs 412 881 1,445 1,212 8
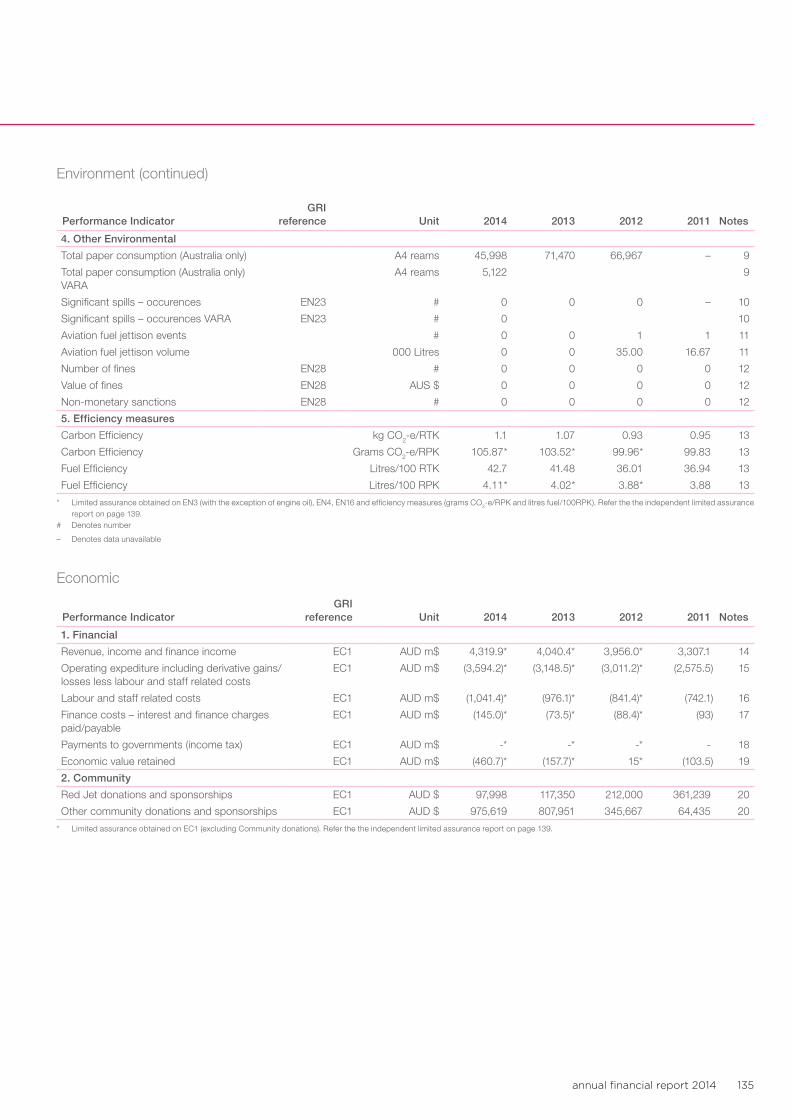
annual financial report 2014 135
Performance IndicatorGRI
reference Unit 2014 2013 2012 2011 Notes
4. Other Environmental
Total paper consumption (Australia only) A4 reams 45,998 71,470 66,967 – 9
Total paper consumption (Australia only) VARA
A4 reams 5,122 9
Significant spills – occurences EN23 # 0 0 0 – 10
Significant spills – occurences VARA EN23 # 0 10
Aviation fuel jettison events # 0 0 1 1 11
Aviation fuel jettison volume 000 Litres 0 0 35.00 16.67 11
Number of fines EN28 # 0 0 0 0 12
Value of fines EN28 AUS $ 0 0 0 0 12
Non-monetary sanctions EN28 # 0 0 0 0 12
5. Efficiency measures
Carbon Efficiency kg CO2-e/RTK 1.1 1.07 0.93 0.95 13
Carbon Efficiency Grams CO2-e/RPK 105.87* 103.52* 99.96* 99.83 13
Fuel Efficiency Litres/100 RTK 42.7 41.48 36.01 36.94 13
Fuel Efficiency Litres/100 RPK 4.11* 4.02* 3.88* 3.88 13
* Limited assurance obtained on EN3 (with the exception of engine oil), EN4, EN16 and efficiency measures (grams CO2-e/RPK and litres fuel/100RPK). Refer the the independent limited assurance report on page 139.
# Denotes number
– Denotes data unavailable
Economic
Performance IndicatorGRI
reference Unit 2014 2013 2012 2011 Notes
1. Financial
Revenue, income and finance income EC1 AUD m$ 4,319.9* 4,040.4* 3,956.0* 3,307.1 14
Operating expediture including derivative gains/losses less labour and staff related costs
EC1 AUD m$ (3,594.2)* (3,148.5)* (3,011.2)* (2,575.5) 15
Labour and staff related costs EC1 AUD m$ (1,041.4)* (976.1)* (841.4)* (742.1) 16
Finance costs – interest and finance charges paid/payable
EC1 AUD m$ (145.0)* (73.5)* (88.4)* (93) 17
Payments to governments (income tax) EC1 AUD m$ -* -* -* - 18
Economic value retained EC1 AUD m$ (460.7)* (157.7)* 15* (103.5) 19
2. Community
Red Jet donations and sponsorships EC1 AUD $ 97,998 117,350 212,000 361,239 20
Other community donations and sponsorships EC1 AUD $ 975,619 807,951 345,667 64,435 20
* Limited assurance obtained on EC1 (excluding Community donations). Refer the the independent limited assurance report on page 139.
Environment (continued)
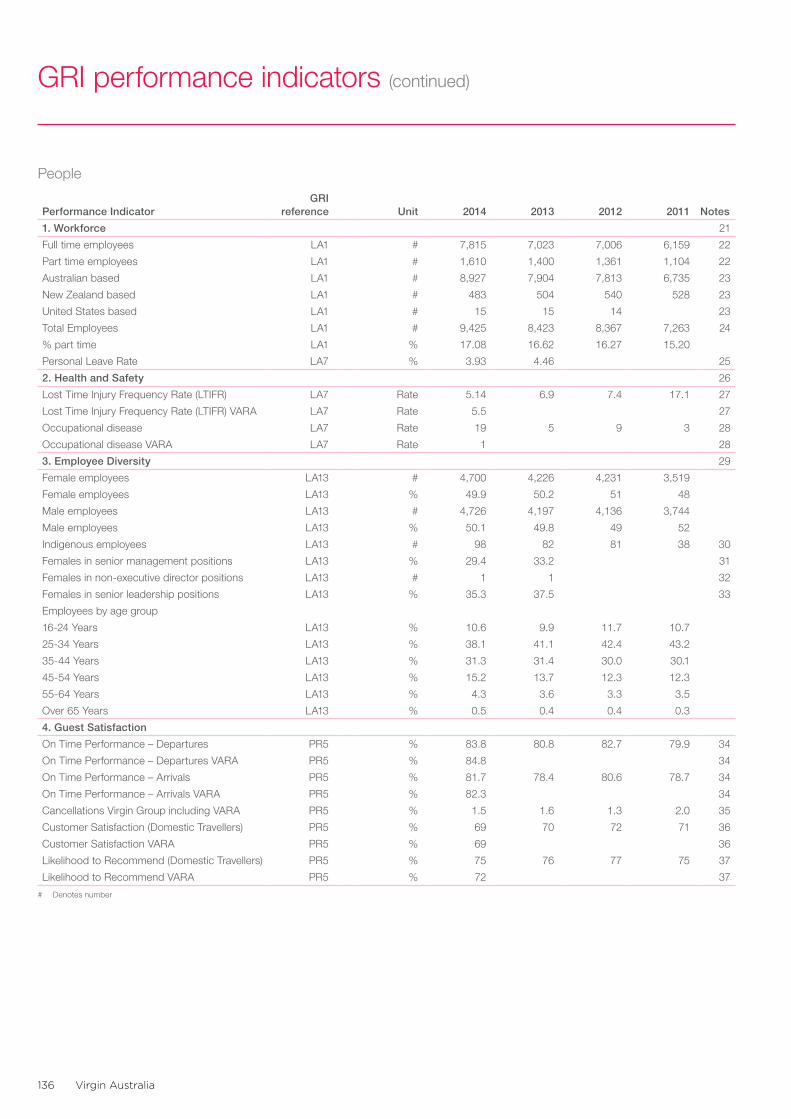
Virgin Australia136
GRI performance indicators (continued)
People
Performance IndicatorGRI
reference Unit 2014 2013 2012 2011 Notes
1. Workforce 21
Full time employees LA1 # 7,815 7,023 7,006 6,159 22
Part time employees LA1 # 1,610 1,400 1,361 1,104 22
Australian based LA1 # 8,927 7,904 7,813 6,735 23
New Zealand based LA1 # 483 504 540 528 23
United States based LA1 # 15 15 14 23
Total Employees LA1 # 9,425 8,423 8,367 7,263 24
% part time LA1 % 17.08 16.62 16.27 15.20
Personal Leave Rate LA7 % 3.93 4.46 25
2. Health and Safety 26
Lost Time Injury Frequency Rate (LTIFR) LA7 Rate 5.14 6.9 7.4 17.1 27
Lost Time Injury Frequency Rate (LTIFR) VARA LA7 Rate 5.5 27
Occupational disease LA7 Rate 19 5 9 3 28
Occupational disease VARA LA7 Rate 1 28
3. Employee Diversity 29
Female employees LA13 # 4,700 4,226 4,231 3,519
Female employees LA13 % 49.9 50.2 51 48
Male employees LA13 # 4,726 4,197 4,136 3,744
Male employees LA13 % 50.1 49.8 49 52
Indigenous employees LA13 # 98 82 81 38 30
Females in senior management positions LA13 % 29.4 33.2 31
Females in non-executive director positions LA13 # 1 1 32
Females in senior leadership positions LA13 % 35.3 37.5 33
Employees by age group
16-24 Years LA13 % 10.6 9.9 11.7 10.7
25-34 Years LA13 % 38.1 41.1 42.4 43.2
35-44 Years LA13 % 31.3 31.4 30.0 30.1
45-54 Years LA13 % 15.2 13.7 12.3 12.3
55-64 Years LA13 % 4.3 3.6 3.3 3.5
Over 65 Years LA13 % 0.5 0.4 0.4 0.3
4. Guest Satisfaction
On Time Performance – Departures PR5 % 83.8 80.8 82.7 79.9 34
On Time Performance – Departures VARA PR5 % 84.8 34
On Time Performance – Arrivals PR5 % 81.7 78.4 80.6 78.7 34
On Time Performance – Arrivals VARA PR5 % 82.3 34
Cancellations Virgin Group including VARA PR5 % 1.5 1.6 1.3 2.0 35
Customer Satisfaction (Domestic Travellers) PR5 % 69 70 72 71 36
Customer Satisfaction VARA PR5 % 69 36
Likelihood to Recommend (Domestic Travellers) PR5 % 75 76 77 75 37
Likelihood to Recommend VARA PR5 % 72 37
# Denotes number
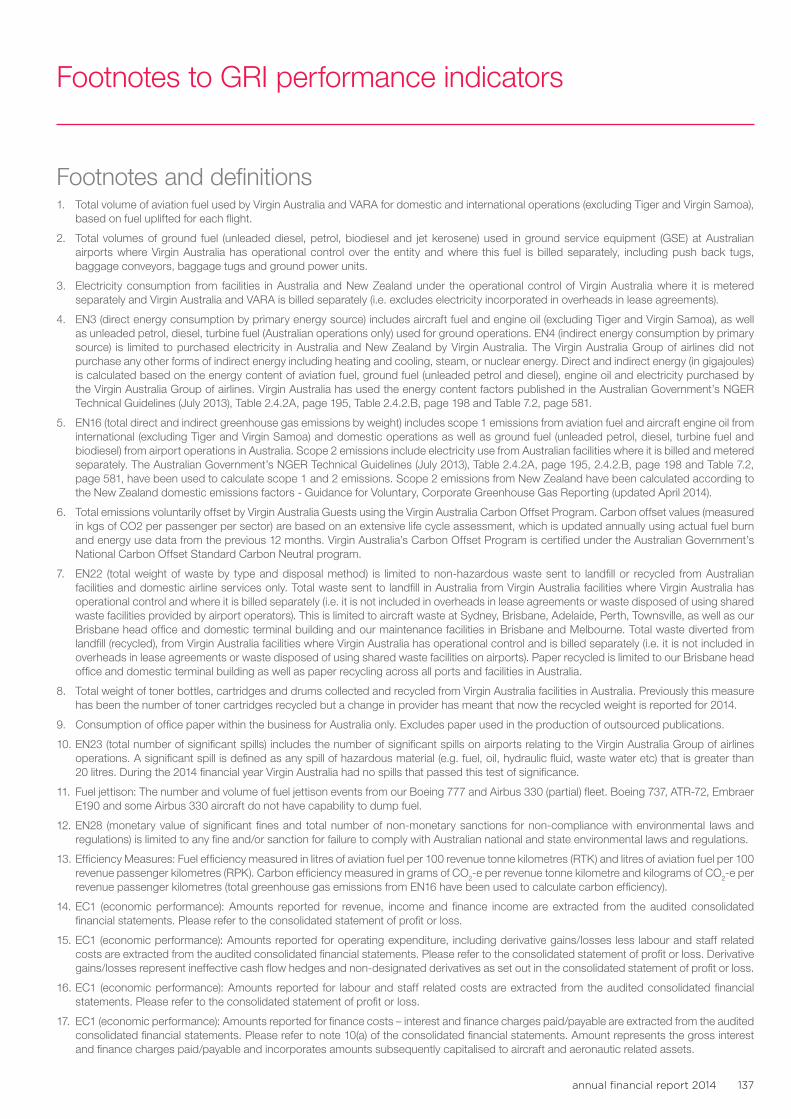
annual financial report 2014 137
Footnotes to GRI performance indicators
Footnotes and definitions1. Total volume of aviation fuel used by Virgin Australia and VARA for domestic and international operations (excluding Tiger and Virgin Samoa),
based on fuel uplifted for each flight.
2. Total volumes of ground fuel (unleaded diesel, petrol, biodiesel and jet kerosene) used in ground service equipment (GSE) at Australian airports where Virgin Australia has operational control over the entity and where this fuel is billed separately, including push back tugs, baggage conveyors, baggage tugs and ground power units.
3. Electricity consumption from facilities in Australia and New Zealand under the operational control of Virgin Australia where it is metered separately and Virgin Australia and VARA is billed separately (i.e. excludes electricity incorporated in overheads in lease agreements).
4. EN3 (direct energy consumption by primary energy source) includes aircraft fuel and engine oil (excluding Tiger and Virgin Samoa), as well as unleaded petrol, diesel, turbine fuel (Australian operations only) used for ground operations. EN4 (indirect energy consumption by primary source) is limited to purchased electricity in Australia and New Zealand by Virgin Australia. The Virgin Australia Group of airlines did not purchase any other forms of indirect energy including heating and cooling, steam, or nuclear energy. Direct and indirect energy (in gigajoules) is calculated based on the energy content of aviation fuel, ground fuel (unleaded petrol and diesel), engine oil and electricity purchased by the Virgin Australia Group of airlines. Virgin Australia has used the energy content factors published in the Australian Government’s NGER Technical Guidelines (July 2013), Table 2.4.2A, page 195, Table 2.4.2.B, page 198 and Table 7.2, page 581.
5. EN16 (total direct and indirect greenhouse gas emissions by weight) includes scope 1 emissions from aviation fuel and aircraft engine oil from international (excluding Tiger and Virgin Samoa) and domestic operations as well as ground fuel (unleaded petrol, diesel, turbine fuel and biodiesel) from airport operations in Australia. Scope 2 emissions include electricity use from Australian facilities where it is billed and metered separately. The Australian Government’s NGER Technical Guidelines (July 2013), Table 2.4.2A, page 195, 2.4.2.B, page 198 and Table 7.2, page 581, have been used to calculate scope 1 and 2 emissions. Scope 2 emissions from New Zealand have been calculated according to the New Zealand domestic emissions factors - Guidance for Voluntary, Corporate Greenhouse Gas Reporting (updated April 2014).
6. Total emissions voluntarily offset by Virgin Australia Guests using the Virgin Australia Carbon Offset Program. Carbon offset values (measured in kgs of CO2 per passenger per sector) are based on an extensive life cycle assessment, which is updated annually using actual fuel burn and energy use data from the previous 12 months. Virgin Australia’s Carbon Offset Program is certified under the Australian Government’s National Carbon Offset Standard Carbon Neutral program.
7. EN22 (total weight of waste by type and disposal method) is limited to non-hazardous waste sent to landfill or recycled from Australian facilities and domestic airline services only. Total waste sent to landfill in Australia from Virgin Australia facilities where Virgin Australia has operational control and where it is billed separately (i.e. it is not included in overheads in lease agreements or waste disposed of using shared waste facilities provided by airport operators). This is limited to aircraft waste at Sydney, Brisbane, Adelaide, Perth, Townsville, as well as our Brisbane head office and domestic terminal building and our maintenance facilities in Brisbane and Melbourne. Total waste diverted from landfill (recycled), from Virgin Australia facilities where Virgin Australia has operational control and is billed separately (i.e. it is not included in overheads in lease agreements or waste disposed of using shared waste facilities on airports). Paper recycled is limited to our Brisbane head office and domestic terminal building as well as paper recycling across all ports and facilities in Australia.
8. Total weight of toner bottles, cartridges and drums collected and recycled from Virgin Australia facilities in Australia. Previously this measure has been the number of toner cartridges recycled but a change in provider has meant that now the recycled weight is reported for 2014.
9. Consumption of office paper within the business for Australia only. Excludes paper used in the production of outsourced publications.
10. EN23 (total number of significant spills) includes the number of significant spills on airports relating to the Virgin Australia Group of airlines operations. A significant spill is defined as any spill of hazardous material (e.g. fuel, oil, hydraulic fluid, waste water etc) that is greater than 20 litres. During the 2014 financial year Virgin Australia had no spills that passed this test of significance.
11. Fuel jettison: The number and volume of fuel jettison events from our Boeing 777 and Airbus 330 (partial) fleet. Boeing 737, ATR-72, Embraer E190 and some Airbus 330 aircraft do not have capability to dump fuel.
12. EN28 (monetary value of significant fines and total number of non-monetary sanctions for non-compliance with environmental laws and regulations) is limited to any fine and/or sanction for failure to comply with Australian national and state environmental laws and regulations.
13. Efficiency Measures: Fuel efficiency measured in litres of aviation fuel per 100 revenue tonne kilometres (RTK) and litres of aviation fuel per 100 revenue passenger kilometres (RPK). Carbon efficiency measured in grams of CO2-e per revenue tonne kilometre and kilograms of CO2-e per revenue passenger kilometres (total greenhouse gas emissions from EN16 have been used to calculate carbon efficiency).
14. EC1 (economic performance): Amounts reported for revenue, income and finance income are extracted from the audited consolidated financial statements. Please refer to the consolidated statement of profit or loss.
15. EC1 (economic performance): Amounts reported for operating expenditure, including derivative gains/losses less labour and staff related costs are extracted from the audited consolidated financial statements. Please refer to the consolidated statement of profit or loss. Derivative gains/losses represent ineffective cash flow hedges and non-designated derivatives as set out in the consolidated statement of profit or loss.
16. EC1 (economic performance): Amounts reported for labour and staff related costs are extracted from the audited consolidated financial statements. Please refer to the consolidated statement of profit or loss.
17. EC1 (economic performance): Amounts reported for finance costs – interest and finance charges paid/payable are extracted from the audited consolidated financial statements. Please refer to note 10(a) of the consolidated financial statements. Amount represents the gross interest and finance charges paid/payable and incorporates amounts subsequently capitalised to aircraft and aeronautic related assets.
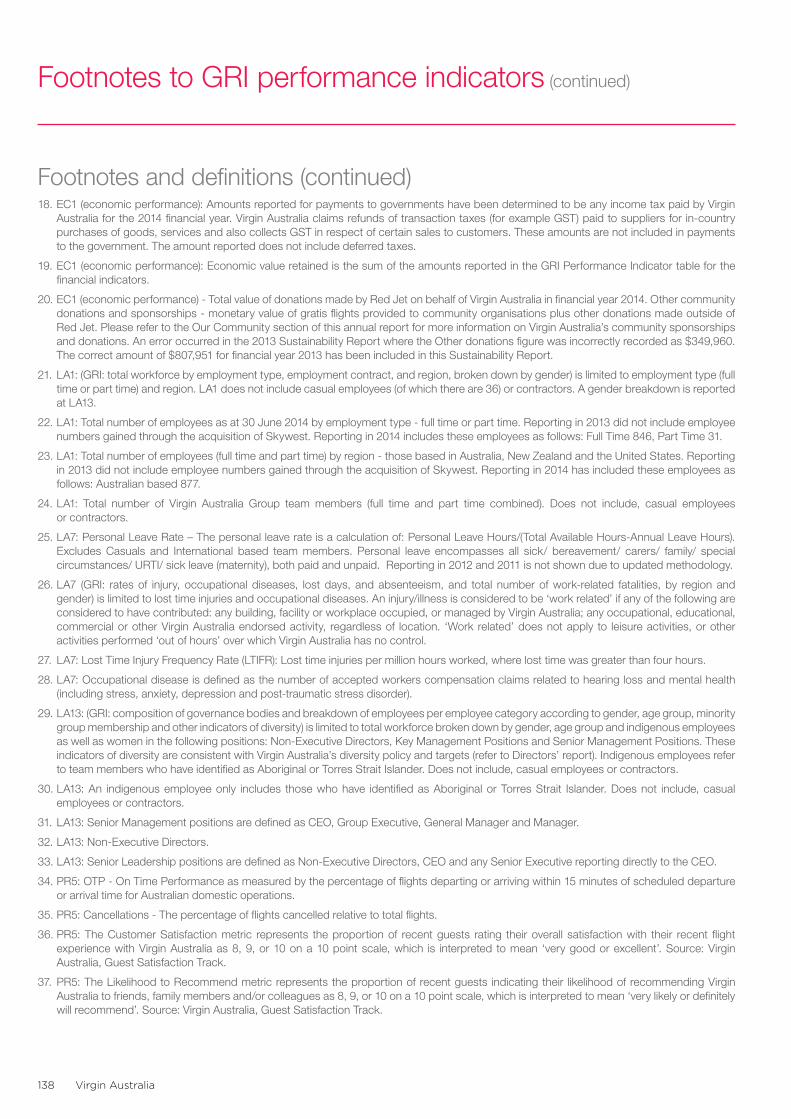
Virgin Australia138
Footnotes to GRI performance indicators (continued)
18. EC1 (economic performance): Amounts reported for payments to governments have been determined to be any income tax paid by Virgin Australia for the 2014 financial year. Virgin Australia claims refunds of transaction taxes (for example GST) paid to suppliers for in-country purchases of goods, services and also collects GST in respect of certain sales to customers. These amounts are not included in payments to the government. The amount reported does not include deferred taxes.
19. EC1 (economic performance): Economic value retained is the sum of the amounts reported in the GRI Performance Indicator table for the financial indicators.
20. EC1 (economic performance) - Total value of donations made by Red Jet on behalf of Virgin Australia in financial year 2014. Other community donations and sponsorships - monetary value of gratis flights provided to community organisations plus other donations made outside of Red Jet. Please refer to the Our Community section of this annual report for more information on Virgin Australia’s community sponsorships and donations. An error occurred in the 2013 Sustainability Report where the Other donations figure was incorrectly recorded as $349,960. The correct amount of $807,951 for financial year 2013 has been included in this Sustainability Report.
21. LA1: (GRI: total workforce by employment type, employment contract, and region, broken down by gender) is limited to employment type (full time or part time) and region. LA1 does not include casual employees (of which there are 36) or contractors. A gender breakdown is reported at LA13.
22. LA1: Total number of employees as at 30 June 2014 by employment type - full time or part time. Reporting in 2013 did not include employee numbers gained through the acquisition of Skywest. Reporting in 2014 includes these employees as follows: Full Time 846, Part Time 31.
23. LA1: Total number of employees (full time and part time) by region - those based in Australia, New Zealand and the United States. Reporting in 2013 did not include employee numbers gained through the acquisition of Skywest. Reporting in 2014 has included these employees as follows: Australian based 877.
24. LA1: Total number of Virgin Australia Group team members (full time and part time combined). Does not include, casual employees or contractors.
25. LA7: Personal Leave Rate – The personal leave rate is a calculation of: Personal Leave Hours/(Total Available Hours-Annual Leave Hours). Excludes Casuals and International based team members. Personal leave encompasses all sick/ bereavement/ carers/ family/ special circumstances/ URTI/ sick leave (maternity), both paid and unpaid. Reporting in 2012 and 2011 is not shown due to updated methodology.
26. LA7 (GRI: rates of injury, occupational diseases, lost days, and absenteeism, and total number of work-related fatalities, by region and gender) is limited to lost time injuries and occupational diseases. An injury/illness is considered to be ‘work related’ if any of the following are considered to have contributed: any building, facility or workplace occupied, or managed by Virgin Australia; any occupational, educational, commercial or other Virgin Australia endorsed activity, regardless of location. ‘Work related’ does not apply to leisure activities, or other activities performed ‘out of hours’ over which Virgin Australia has no control.
27. LA7: Lost Time Injury Frequency Rate (LTIFR): Lost time injuries per million hours worked, where lost time was greater than four hours.
28. LA7: Occupational disease is defined as the number of accepted workers compensation claims related to hearing loss and mental health (including stress, anxiety, depression and post-traumatic stress disorder).
29. LA13: (GRI: composition of governance bodies and breakdown of employees per employee category according to gender, age group, minority group membership and other indicators of diversity) is limited to total workforce broken down by gender, age group and indigenous employees as well as women in the following positions: Non-Executive Directors, Key Management Positions and Senior Management Positions. These indicators of diversity are consistent with Virgin Australia’s diversity policy and targets (refer to Directors’ report). Indigenous employees refer to team members who have identified as Aboriginal or Torres Strait Islander. Does not include, casual employees or contractors.
30. LA13: An indigenous employee only includes those who have identified as Aboriginal or Torres Strait Islander. Does not include, casual employees or contractors.
31. LA13: Senior Management positions are defined as CEO, Group Executive, General Manager and Manager.
32. LA13: Non-Executive Directors.
33. LA13: Senior Leadership positions are defined as Non-Executive Directors, CEO and any Senior Executive reporting directly to the CEO.
34. PR5: OTP - On Time Performance as measured by the percentage of flights departing or arriving within 15 minutes of scheduled departure or arrival time for Australian domestic operations.
35. PR5: Cancellations - The percentage of flights cancelled relative to total flights.
36. PR5: The Customer Satisfaction metric represents the proportion of recent guests rating their overall satisfaction with their recent flight experience with Virgin Australia as 8, 9, or 10 on a 10 point scale, which is interpreted to mean ‘very good or excellent’. Source: Virgin Australia, Guest Satisfaction Track.
37. PR5: The Likelihood to Recommend metric represents the proportion of recent guests indicating their likelihood of recommending Virgin Australia to friends, family members and/or colleagues as 8, 9, or 10 on a 10 point scale, which is interpreted to mean ‘very likely or definitely will recommend’. Source: Virgin Australia, Guest Satisfaction Track.
Footnotes and definitions (continued)
annual financial report 2014 139
Independent limited assurance report to Virgin Australia Holdings Limited
Our conclusion:Based on the procedures performed, as identified below, we have not become aware of any matter that would lead us to believe that the selected sustainability parameters identified below, have not, in all material respects, been prepared in accordance with the requirements of the GRI G3.1 Guidelines and Virgin Australia Holding Limited’s calculation methodologies for the year ended 30 June 2014.
We have been engaged by Virgin Australia Holdings Limited to perform an engagement to provide limited assurance in respect of the selected sustainability parameters as identified below (the Assured Sustainability Parameters), which have been included in the Sustainability Supplement of Virgin Australia Holdings Limited’s annual report (the Sustainability Section) for the year ended 30 June 2014.
The Assured Sustainability Parameters covered by our limited assurance engagement are:
Assured Sustainability Parameters Sustainability section
Direct energy consumption by primary energy source (EN3), excluding Ground Service Equipment (GSE) Fuel.
(Units: Litres and GJ)
Page 134
Indirect energy consumption (EN4). (Units: kWh and GJ) Page 134
Total direct and indirect greenhouse gas emissions by weight (EN16), excluding the emissions attributed to GSE fuel. (Unit: Tonnes CO2-e)
Page 134
Financial performance indicators (EC1) excluding community donations and sponsorships. (Unit: Dollars) Page 135
Reporting over Virgin Australia Holding Limited’s efficiency measure for carbon and fuel. (Unit: Grams CO2-e/PRK and Litres/100 RPK)
Page 135
Management’s and directors’ responsibility for the Assured Sustainability ParametersThe directors and management of Virgin Australia Holdings Limited are responsible for the preparation of the Assured Sustainability Parameters in accordance with the GRI G3.1 Guidelines as stated in the indicator protocols applicable to EN3, EN4, EN16, EC1 and Virgin Australia Holdings Limited’s calculation methodology for reported fuel efficiency measured in litres of aviation fuel per 100 revenue passenger kilometres and carbon efficiency measured in CO2-e per revenue passenger kilometre. This responsibility includes establishing and maintaining internal controls relevant to the preparation of the Assured Sustainability Parameters that are free from material misstatement whether due to fraud or error.
Our responsibilityOur responsibility is to express a limited assurance conclusion to the directors and management on the preparation and presentation of the Assured Sustainability Parameters included in the Sustainability Section of the annual report for the year ended 30 June 2014.
We conducted our limited assurance engagement in accordance with the Standard on Assurance Engagements ASAE 3000 Assurance Engagements other than Audits and Reviews of Historical Financial Information and other relevant Auditing and Assurance Standards, in order to state whether we have become aware of any matter that would lead us to believe that the Assured Sustainability Parameters have not, in all material respects, been prepared in accordance with the applicable elements of the GRI G3.1 Guidelines and Virgin Australia Holding Limited’s calculation methodologies.
ASAE 3000 requires us to comply with the requirements of the Code of Ethics for Professional Accountants as issued by the Accounting Professionals and Ethical Standards Board and plan and perform the engagement to obtain limited assurance about whether the Assured Sustainability Parameters are free from material misstatement.
KPMG, an Australian partnership and a member firm of the KPMG network of independent member firms affiliated with KPMG International Cooperative (“KPMG International”), a Swiss entity.
Liability limited by a scheme approved under Professional Standards Legislation.
Virgin Australia140
Independent limited assurance report to Virgin Australia Holdings Limited (continued)A limited assurance engagement on sustainability information consists of making enquiries, primarily of persons responsible for the management, monitoring and preparation of the Assured Sustainability Parameters, and applying analytical and other evidence gathering procedures, as appropriate. These procedures included the following:• Interviews with and enquiries of relevant staff responsible for the preparation of the Assured Sustainability Parameters including obtaining
an understanding of the design and implementation of the systems and methods used to collect and process the Assured Sustainability Parameters, including the aggregation of the reported information;
• Interviews and enquiries with senior management and relevant staff at corporate and selected business unit level concerning sustainability strategy and policies for material issues, and the implementation of these across the business;
• Interviews and enquiries with senior management to gain an understanding of Virgin Australia Holding Limited’s processes for determining material issues for Virgin Australia Holdings Limited’s key stakeholder groups;
• Performing analytical procedures to determine whether the Assured Sustainability Parameters are in line with our overall knowledge of, and experience with, the sustainability performance of Virgin Australia Holdings Limited; and
• Comparing the Assured Sustainability Parameters to relevant underlying sources on a sample basis.
A limited assurance engagement is substantially less in scope than a reasonable assurance engagement or an audit conducted in accordance with Australian Auditing and Assurance Standards and consequently does not enable us to obtain assurance that we would become aware of all significant matters that might be identified in an audit or a reasonable assurance engagement. Accordingly, we do not express a reasonable assurance or audit opinion.
This report has been prepared for Virgin Australia Holdings Limited. We disclaim any assumption of responsibility for any reliance on this report, or the Assured Sustainability Parameters to which it relates, to any person other than Virgin Australia Holdings Limited, or for any purpose other than that for which it was prepared.
IndependenceIn conducting our engagement, we have complied with the applicable ethical requirements, including independence requirements of the Code of Ethics for Professional Accountants issued by the Australian Accounting Professional and Ethical Standards Board.
KPMG
Sydney, 29 September 2014
annual financial report 2014 141
Corporate directory
Company secretaryMr Adam Thatcher
Principal administrative and registered officeVirgin Australia Holdings Limited 56 Edmondstone Road Bowen Hills QLD 4006Australia Telephone: (07) 3295 3000 (within Australia) or +61 7 3295 3000 (outside Australia)
Share registryComputershare Investor Services Pty Limited 117 Victoria Street West End QLD 4101Australia Telephone: 1300 850 505 (within Australia) or +61 3 9415 4000 (outside Australia)
Securities exchangeThe Company is listed on the Australian Securities Exchange. The Home Exchange is Brisbane.
Other informationVirgin Australia Holdings Limited, incorporated and domiciled in Australia, is a publicly listed company limited by shares.