Embed Size (px)
Citation preview
JCB: Article
The Rockefeller University Press $30.00J. Cell Biol. Vol. 202 No. 1 163–177www.jcb.org/cgi/doi/10.1083/jcb.201303129 JCB 163
Correspondence to Clare M. Waterman: [email protected]. Thievessen’s present address is Center for Medical Physics and Technology, Friedrich-Alexander-University of Erlangen-Nuremberg, Erlangen 91052, Germany.Abbreviations used in this paper: FA, focal adhesion; FSM, fluorescent speckle microscopy; mApple, monomeric apple; MEF, mouse embryonic fibroblasts; PA, partially activated; pS19MLC2, phosphoserine19 myosin regulatory light chain-2; qFSM, quantitative FSM; SDC, spinning disk confocal; TFM, traction force micros-copy; TIRF, total internal reflection fluorescence; VASP, vasodilator-stimulated phos-phoprotein; Vcl-KO, Vcl knockout; WT, wild type.
IntroductionCell migration is driven by a cycle of cell edge protrusion, ECM adhesion, cell body contraction, and de-adhesion at the cell rear. Coordinating these processes requires integration of forces gen-erated in the F-actin cytoskeleton near the leading cell edge and the formation and disassembly of integrin-based focal adhe-sions (FA) to the ECM (Choi et al., 2008). Leading edge protru-sion is driven by F-actin polymerization in the lamellipodium generating force against the plasma membrane that pushes the leading edge forward and counter-force that pushes lamellipodial
F-actin rearward, resulting in retrograde F-actin flow (Ponti et al., 2004). Proteins in nascent FA that indirectly link ECM-bound integrin cytoplasmic tails to F-actin are thought to constitute a “molecular clutch” for “engaging” lamellipodial retrograde F-actin flow (Lin and Forscher, 1995; Chan and Odde, 2008; Gardel et al., 2008; Renkawitz et al., 2009). Engagement of retrograde flow at nascent FA may provide friction that re-duces flow velocity and harnesses the force of polymerization to drive membrane protrusion and generate ECM traction forces. Force on nascent FA may drive their maturation, dur-ing which they grow and recruit cytosolic proteins, which strengthen their linkage to the cytoskeleton and change their signaling properties (Balaban et al., 2001; Choi et al., 2008;
In migrating cells, integrin-based focal adhesions (FAs) assemble in protruding lamellipodia in association with rapid filamentous actin (F-actin) assembly and
retrograde flow. How dynamic F-actin is coupled to FA is not known. We analyzed the role of vinculin in integrat-ing F-actin and FA dynamics by vinculin gene disruption in primary fibroblasts. Vinculin slowed F-actin flow in maturing FA to establish a lamellipodium–lamellum bor-der and generate high extracellular matrix (ECM) trac-tion forces. In addition, vinculin promoted nascent FA
formation and turnover in lamellipodia and inhibited the frequency and rate of FA maturation. Characterization of a vinculin point mutant that specifically disrupts F-actin binding showed that vinculin–F-actin interaction is critical for these functions. However, FA growth rate correlated with F-actin flow speed independently of vinculin. Thus, vinculin functions as a molecular clutch, organizing lead-ing edge F-actin, generating ECM traction, and promot-ing FA formation and turnover, but vinculin is dispensible for FA growth.
Vinculin–actin interaction couples actin retrograde flow to focal adhesions, but is dispensable for focal adhesion growth
Ingo Thievessen,1 Peter M. Thompson,2,3 Sylvain Berlemont,4 Karen M. Plevock,2,3 Sergey V. Plotnikov,1 Alice Zemljic-Harpf,5 Robert S. Ross,5 Michael W. Davidson,6 Gaudenz Danuser,4 Sharon L. Campbell,2 and Clare M. Waterman1
1Laboratory of Cell and Tissue Morphodynamics, Cell Biology and Physiology Center, National Heart, Lung and Blood Institute, National Institutes of Health, Bethesda, MD 20892
2Department of Biochemistry and Biophysics and 3Program in Molecular and Cellular Biophysics, University of North Carolina School of Medicine, Chapel Hill, NC 275994Department of Cell Biology, Harvard Medical School, Boston, MA 021155Department of Medicine, Division of Cardiology, University of California, San Diego, School of Medicine and Veteran Affairs San Diego Healthcare System, San Diego, CA 92161
6Department of Biological Science, Florida State University, Tallahassee, FL 32310
This article is distributed under the terms of an Attribution–Noncommercial–Share Alike–No Mirror Sites license for the first six months after the publication date (see http://www.rupress .org/terms). After six months it is available under a Creative Commons License (Attribution–Noncommercial–Share Alike 3.0 Unported license, as described at http://creativecommons .org/licenses/by-nc-sa/3.0/).
TH
EJ
OU
RN
AL
OF
CE
LL
BIO
LO
GY
JCB • VOLUME 202 • NUMBER 1 • 2013 164
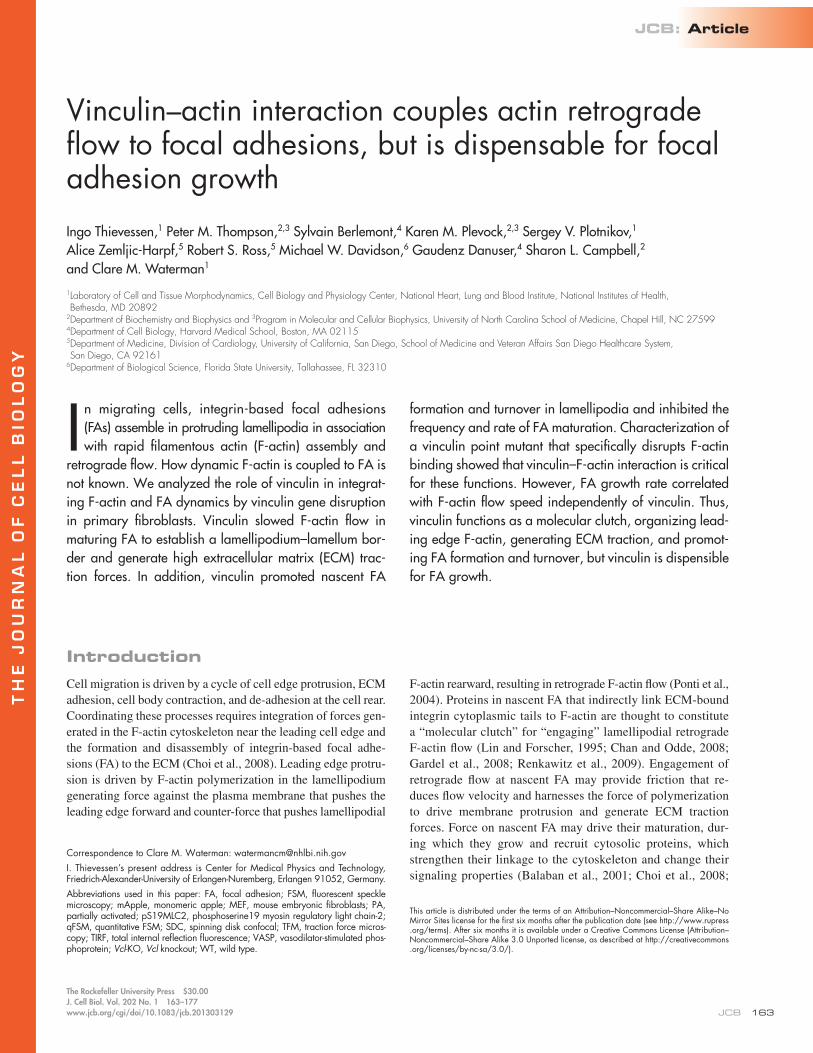
Vinculin organizes lamellipodia and lamella F-actin and mediates F-actin retrograde flow engagement at FA to generate ECM tractionTo determine the role of vinculin in regulating leading edge F-actin dynamics, we imaged F-actin and FA in control and Vcl-KO MEF microinjected with X-rhodamine actin and EGFP- paxillin cDNA by time-lapse spinning disk confocal (SDC) microscopy and analyzed the images by quantitative fluorescent speckle microscopy (qFSM; Ponti et al., 2004). Control MEF ex-hibited typical organization of leading edge F-actin dynamics (Fig. 1 A), characterized by a lamellipodium with rapid retro-grade flow (0.45 µm/min) in a narrow (1–3 µm) band along the cell edge adjacent to a broad lamellum region located 5–15 µm behind the leading edge where F-actin exhibited slower retro-grade flow (0.15 µm/min; Fig. 1, B [arrow] and C; and Video 3). The junction between fast retrograde flow in the lamellipodium and slower flow in the lamellum corresponded to the site of na-scent FA, as shown previously (Fig. 1 D and Video 4; Hu et al., 2007). Vcl-KO MEF exhibited a similar organization of F-actin dynamics with fast F-actin retrograde flow in the lamellipodium and slower flow in the lamellum (Fig. 1 B, arrowhead). However, F-actin flow in both lamellipodium and lamellum of Vcl-KO MEF was significantly faster than in the same regions of control cells (Fig. 1 C). Thus, vinculin slows F-actin retrograde flow in the leading edge of migrating cells.
To test whether vinculin modulates F-actin flow locally within FA, we developed algorithms to measure F-actin flow spe-cifically within or outside of segmented FA (Fig. S2 A and com-putational source code in online supplemental material). This showed a comparable reduction of F-actin flow velocity within nascent FA, compared with lamellipodial areas outside nascent FA, in both control and Vcl-KO MEF (Fig. 1 E), suggesting that vinculin was not required to slow F-actin flow at FA in the na-scent state. However, in control MEF, F-actin flow velocity in mature FA was significantly lower than in nascent FA, whereas in Vcl-KO MEF, F-actin flow velocity was similar in nascent and mature FA (Fig. 1 E). Consistent with this finding, control MEF showed a rapid drop of F-actin flow velocity 1.5 µm behind the leading edge at the site of nascent FA, whereas flow velocity in FA of Vcl-KO MEF dropped more gradually with distance from the leading edge, where FA undergo maturation (Fig. S2 B). Thus, vinculin is not required to slow F-actin flow at nascent FA in the lamellipodium but is critical for slowing F-actin flow in mature FA and for maintaining a steep flow velocity gradient between lamellipodium and lamellum.
To test whether vinculin mediates coupling of F-actin ret-rograde flow to the ECM to generate traction at FA, we used high resolution traction force microscopy (TFM; Sabass et al., 2008) to measure ECM traction stresses at individual FA in control and Vcl-KO MEF expressing EGFP-paxillin. As the resolution of our TFM was not sufficient to analyze nascent FA, we restricted our analysis to mature FA. This revealed signifi-cantly lower ECM-traction stresses generated by Vcl-KO com-pared with control FA (Fig. 1, F and G). Together, these results show that vinculin is required to slow F-actin retrograde flow and increase traction forces in maturing FA, suggesting that
Kuo et al., 2011; Schiller et al., 2011). Slowing of F-actin flow at maturing FA is thought to establish a border between the la-mellipodium and the adjacent F-actin structure, the lamellum (Alexandrova et al., 2008; Shemesh et al., 2009). In the lamel-lum, actomyosin powers slow retrograde F-actin flow (Ponti et al., 2004), and forces are transmitted through mature FA to the ECM to drive cell body advance.
Despite extensive evidence for the molecular clutch hy-pothesis (Lin and Forscher, 1995; Hu et al., 2007; Chan and Odde, 2008; Gardel et al., 2008; Renkawitz et al., 2009), it is unclear which molecules engage F-actin retrograde flow to in-tegrins in FA. Thus, it is not known how F-actin engagement regulates F-actin organization and FA maturation and dynam-ics. The integrin and F-actin binding protein talin may be part of the molecular clutch, as talin depletion results in excessive retrograde F-actin flow in spreading cells (Zhang et al., 2008). Vinculin is an F-actin and talin binding protein that bears force in FA, strengthens and stabilizes FA, is partially coupled to F-actin movement within FA, and is situated in a layer be-tween integrins and F-actin within FA (Galbraith et al., 2002; Saunders et al., 2006; Hu et al., 2007; Humphries et al., 2007; Dumbauld et al., 2010; Grashoff et al., 2010; Kanchanawong et al., 2010). Thus, vinculin is also a candidate for a molecular clutch component and a mediator of FA maturation. However, the role of vinculin in regulating the organization and dy-namics of F-actin at the leading edge in migrating cells has not been addressed. In addition, vinculin has numerous interactors in FA and lamellipodia including paxillin, Arp2/3, and vasodilator-stimulated phosphoprotein (VASP; Carisey and Ballestrem, 2011), and it is unclear whether vinculin regulates F-actin and FA dynamics by direct or indirect interaction with F-actin.
Here we report the effect of vinculin gene (Vcl) disruption on F-actin cytoskeleton and FA dynamics in migrating primary mouse embryonic fibroblasts (MEF). We find that vinculin is critical to coordinate F-actin organization and FA dynamics at the leading edge. Characterization of a vinculin point mutant that specifically disrupts F-actin binding shows that vinculin inter-action with F-actin is critical for these functions.
ResultsWe sought to determine the role of vinculin in F-actin and FA organization and dynamics in cells lacking vinculin. To circumvent long-term adaptation of cells to vinculin loss, we generated vinculin-deficient primary MEF by in vitro cre recombinase–mediated excision of essential Vcl sequences in MEF from E13.5 Vclflox/flox embryos (Fig. S1 A; Zemljic-Harpf et al., 2007). Cre-mediated Vcl disruption resulted in complete loss of vinculin protein within 4 d (Fig. S1 B). Compared with control (Vclflox/flox/adeno-control) MEF, Vcl knockout (Vcl-KO; genotype Vclflox/flox/adeno-cre) MEF were less spread, displayed narrow lamellae, lobular lamellipodia, and long tails (Fig. S1, C and D; and Video 1) and exhibited an increased random migration velocity (Fig. S1, E and F; and Video 2), all similar to vinculin-deficient clonal MEF and F9 cells (Volberg et al., 1995; Xu et al., 1998a,b; Mierke et al., 2010).
165Vinculin–actin interaction regulates actin and adhesion dynamics. • Thievessen et al.
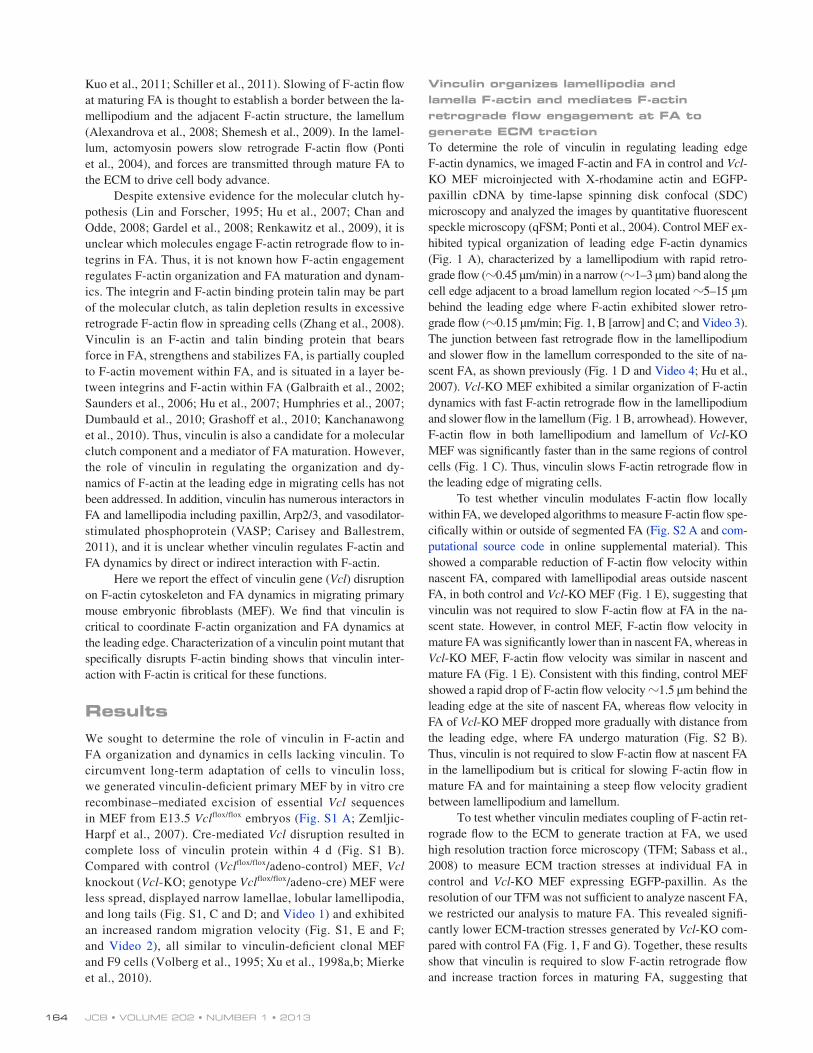
and C). Thus, consistent with the requirement of vinculin to engage F-actin flow at FA, vinculin is required to restrict lamel-lipodium width and to define a sharp border that spatially segre-gates lamellipodium and lamellum.
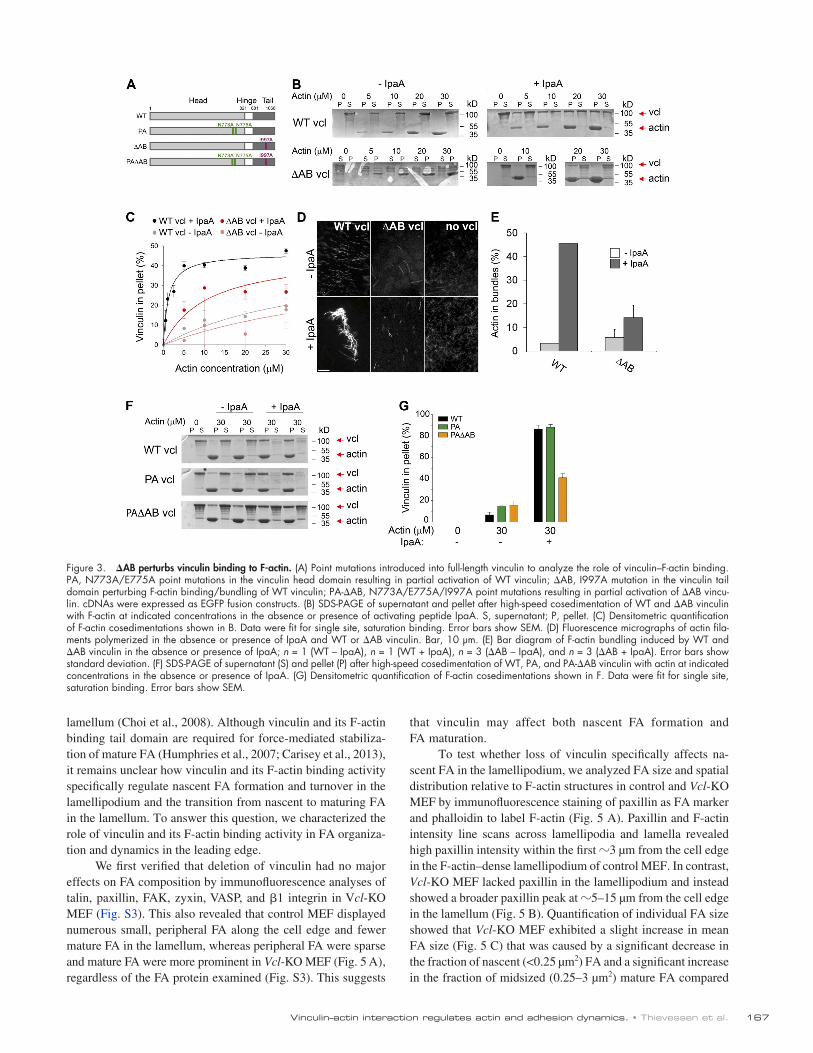
Isoleucine 997 mutation to alanine [AB] perturbs vinculin binding to F-actinTo test whether vinculin regulates leading edge F-actin dynam-ics and organization through direct interaction with F-actin, we introduced a mutation into the vinculin tail domain that impairs F-actin binding. AB impairs binding of the isolated vinculin tail domain to F-actin, but does not affect tail domain structure or acidic phospholipid binding in vitro (unpublished data). In the context of full-length vinculin AB (Fig. 3 A) significantly reduces vinculin cosedimentation with F-actin in the presence of the vinculin-activating peptide IpaA (Bourdet-Sicard et al., 1999; Fig. 3 B). This corresponds to an 10-fold decrease in the apparent dissociation constant for AB (1.4 ± 0.2 µM) com-pared with WT (12 ± 2 µM) vinculin, resulting in an equilibrium shift of F-actin–bound versus unbound AB vinculin (Fig. 3, B and C). To visualize the effect of AB vinculin on F-actin orga-nization in vitro we used fluorescence microscopy and phalloidin
vinculin mediates F-actin flow engagement to the ECM during FA maturation.
Because engagement of F-actin flow at FA is thought to limit the width of the lamellipodium and to establish a bor-der between lamellipodium and lamellum (Ponti et al., 2004; Alexandrova et al., 2008; Shemesh et al., 2009), we sought to test whether vinculin affected the spatial organization of lamellipo-dium and lamellum. We localized F-actin and the lamellipodial protein cortactin or the lamellum protein phosphoserine19 myo-sin regulatory light chain-2 (pS19MLC2) in control and Vcl-KO MEF (Wu and Parsons, 1993; Ponti et al., 2004; Gupton et al., 2005; Lai et al., 2008). Line scans of staining intensity across the leading edge of control MEF revealed a sharply defined, narrow band of cortactin that colocalized with dense lamellipodial F-actin (Fig. 2, A [arrow], D, and E). In contrast, cortactin staining at the leading edge of Vcl-KO MEF was significantly broader (Fig. 2, A [asterisk], D, and E) with a less defined border (Fig. 2 A, arrowhead). Line scans across the lamellum revealed a sig-moidal gradient with low amounts of pS19MLC2 near the cell edge in control MEF (Fig. 2, B [asterisk] and C), whereas Vcl-KO MEF displayed a more linear gradient with considerable pS19MLC2 staining near the cell edge (Fig. 2, B [arrowhead]
Figure 1. Vinculin mediates F-actin flow en-gagement in maturing FA and high ECM trac-tion. (A) Alexa Fluor 488–phalloidin staining of F-actin (green), paxillin (red), and myosin light chain-2 (MLC-2; blue; asterisk) immunofluores-cence staining of a primary control MEF. Bars, 5 µm. (B) qFSM of control and Vcl-KO MEF mi-croinjected with X-rhodamine actin and EGFP-paxillin cDNA. (left to right) SDC-FSM images of F-actin (Bar, 5 µm); F-actin flow maps (Bar, 2 μm/min); F-actin speed maps (μm/min); and EGFP-paxillin image showing FA location. Note a wider band of fast retrograde F-actin flow in Vcl-KO (arrowhead) compared to con-trol (arrow) MEF. 10-s frame rate. (C) Box and whisker plot of mean F-actin flow velocities in lamellipodium (LP) and lamellum (LM) of con-trol and Vcl-KO MEF, calculated from qFSM F-actin speed maps. n = 30 (control) and n = 40 (Vcl-KO) time points during protru-sion (6–8 cells/condition); means indicated; *, P < 0.01, Mann-Whitney U test. (D) Overlays of EGFP-paxillin (left) and F-actin flow maps (right) of control and Vcl-KO MEF. Bars: (left) 2 µm; (right, flow), 2 μm/min. (E) Box and whisker plot of F-actin flow velocities within and outside of segmented FA during protru-sion phases (6–8 cells per condition, qFSM, X-rhodamine actin/EGFP-paxillin); n = 1,000 per group (uniformly sampled among all seg-mented FA of each group, or among all pixels outside of segmented FA in a given region); means indicated; *, P < 0.0001, Mann-Whitney U test. (F) High resolution TFM of EGFP-paxillin expressing control and Vcl-KO MEF on FN-coated polyacrylamide substrates. (left to right) EGFP-paxillin SDC images and ECM traction maps (kPa). Arrows (control) and arrow-heads (Vcl-KO) denote individual FA. Bar, 5 µm. (G) Box and whisker plot of ECM trac-tion stresses of n = 48 (control) and n = 20 (Vcl-KO) segmented FA (eight control and six Vcl-KO MEF); means indicated; *, P < 0.01, Student’s t test.
JCB • VOLUME 202 • NUMBER 1 • 2013 166
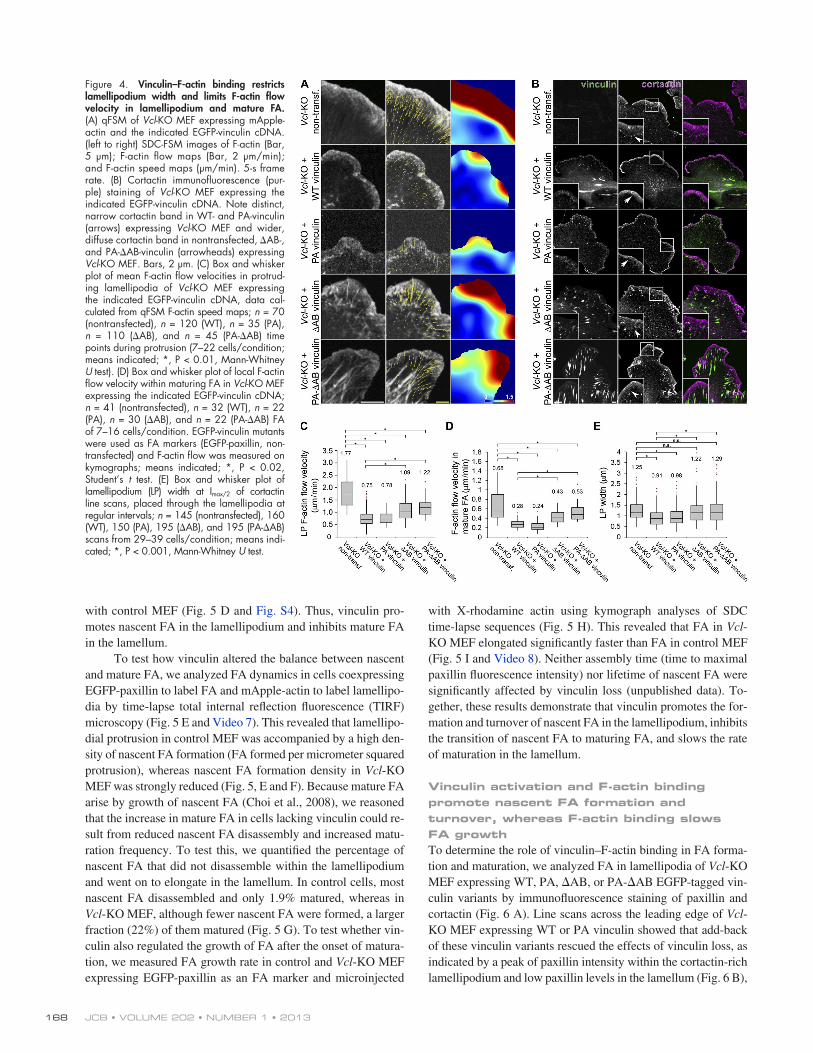
reducing F-actin flow velocity in Vcl-KO MEF to levels similar to control MEF both in the lamellipodium and within maturing FA in the lamellum (Fig. 4, A, C, and D; and Fig. 1 C). In con-trast, add-back of AB or PA-AB vinculin to Vcl-KO MEF only slightly rescued the effects of Vcl-KO on F-actin retro-grade flow, showing a decrease in F-actin flow in lamellipodia and maturing FA compared with Vcl-KO, but not to the same extent as add-back of WT vinculin. Immunostaining for cortac-tin revealed that add-back expression of either WT or PA vincu-lin in Vcl-KO MEF rescued the effects of vinculin deficiency, exhibiting a narrow cortactin band along the leading edge simi-lar to control MEF (Fig. 4 B, arrows; and Fig. 1 H). In contrast, Vcl-KO MEF expressing AB or PA-AB vinculin exhibited a significantly wider cortactin band with a diffuse border, similar to those in nontransfected Vcl-KO MEF (Fig. 4, B [arrowheads] and E; and Fig. 1 H). Together, these results show that the direct interaction of vinculin with F-actin is necessary to slow F-actin flow in lamellipodia and within mature FA and to restrict lamel-lipodium width to define a sharp lamellipodium–lamellum bor-der. However, other activities of vinculin may be required for full inhibition of F-actin flow by vinculin.
Vinculin promotes nascent FA formation and turnover in lamellipodia and slows FA growth in the lamellumThe formation and turnover of nascent FA occurs within pro-truding lamellipodia, whereas a small fraction of nascent FA that do not disassemble in lamellipodia go on to mature in the
staining (Fig. 3 D). In the absence of IpaA, neither wild-type (WT) nor AB vinculin induced F-actin bundles. In contrast, in the presence of IpaA, WT vinculin induced large F-actin bun-dles, whereas AB vinculin did not (Fig. 3, D and E). Because F-actin binding may be critical for the release of vinculin head–tail interaction to allow vinculin activation (Bakolitsa et al., 2004), we included additional mutations (N773/E775A) to re-duce the affinity of head–tail interaction to partially activate (PA) vinculin (Cohen et al., 2005) in both WT (PA vinculin) and AB (PA-AB vinculin) contexts as controls in our in vivo ex-periments (Fig. 3 A). F-actin binding experiments confirmed that PA-AB vinculin was still able to be activated by IpaA, de-spite its decreased affinity for F-actin (Fig. 3, F and G). Impor-tantly, expression of EGFP-tagged WT, PA, AB, and PA-AB vinculin variants in Vcl-KO MEF followed by immunostaining showed that all variants colocalized with paxillin in nascent and mature FA (see Figs. 6 A and S5).
Vinculin–F-actin binding restricts lamellipodia width and slows F-actin flow in mature FATo test whether vinculin regulates leading edge F-actin by direct F-actin binding, we performed SDC microscopy of F-actin dynamics and immunostaining of cortactin in Vcl-KO MEF ex-pressing EGFP-tagged WT, PA, AB, or PA-AB vinculin and monomeric Apple (mApple)–actin (Fig. 4 A and Videos 5 and 6). qFSM and kymograph analysis showed that add-back ex-pression of WT or PA vinculin rescued the effects of Vcl-KO,
Figure 2. Vinculin establishes a lamellipodium–lamellum border. (A) Cortactin immunofluorescence (purple) and Alexa Fluor 488–phalloidin staining (green) of control and Vcl-KO MEF. Note wider lamellipodium in Vcl-KO (asterisk) and diffuse lamellipodium–lamellum border (arrowhead) compared to control MEF (arrow). Bar, 5 µm. (B) pS19MLC2 immunofluorescence (purple) and Alexa Fluor 488–phalloidin staining (green) of control and Vcl-KO MEF. Note low amount of pS19MLC2 in the distal lamellum of control (asterisk) and abundant pS19MLC2 in the distal lamellum of Vcl-KO (arrowhead) MEF. Bar, 10 µm. (C) pS19MLC2 and Alexa Fluor 488–phalloidin fluorescence intensity distribution along line scans perpendicular to the leading edge (mean of 25 cells/condition). (D) Cortactin fluorescence intensity distribution along line scans, placed perpendicularly to the cell edge through the lamellipodium (mean of 60 scans/ condition). Width of the distribution at half maximal intensity (Imax/2) indicated. (E) Box and whisker plot of lamellipodium width at Imax/2 of cortactin line scans, placed through the lamellipodium at 15–20-µm intervals along the leading edge; n = 219 (control) and 243 (Vcl-KO) scans of 25 cells/genotype; means indicated; *, P < 0.0001, Mann-Whitney U test.
167Vinculin–actin interaction regulates actin and adhesion dynamics. • Thievessen et al.
that vinculin may affect both nascent FA formation and FA maturation.
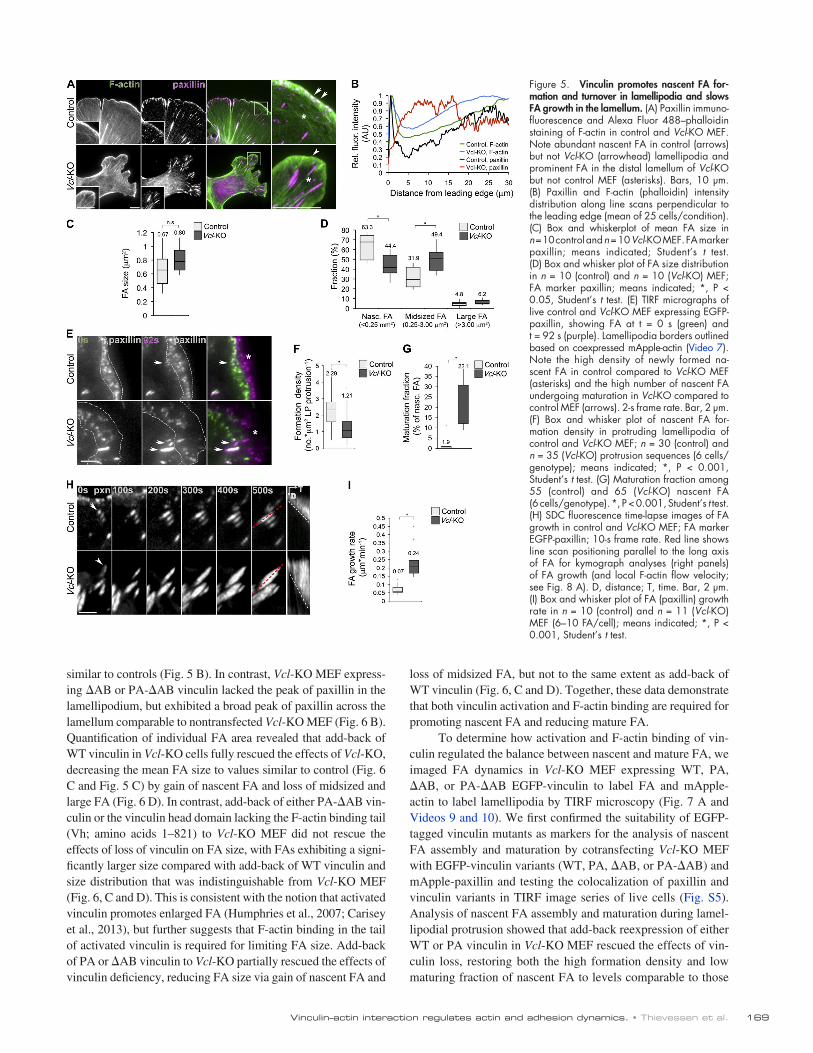
To test whether loss of vinculin specifically affects na-scent FA in the lamellipodium, we analyzed FA size and spatial distribution relative to F-actin structures in control and Vcl-KO MEF by immunofluorescence staining of paxillin as FA marker and phalloidin to label F-actin (Fig. 5 A). Paxillin and F-actin intensity line scans across lamellipodia and lamella revealed high paxillin intensity within the first 3 µm from the cell edge in the F-actin–dense lamellipodium of control MEF. In contrast, Vcl-KO MEF lacked paxillin in the lamellipodium and instead showed a broader paxillin peak at 5–15 µm from the cell edge in the lamellum (Fig. 5 B). Quantification of individual FA size showed that Vcl-KO MEF exhibited a slight increase in mean FA size (Fig. 5 C) that was caused by a significant decrease in the fraction of nascent (<0.25 µm2) FA and a significant increase in the fraction of midsized (0.25–3 µm2) mature FA compared
lamellum (Choi et al., 2008). Although vinculin and its F-actin binding tail domain are required for force-mediated stabiliza-tion of mature FA (Humphries et al., 2007; Carisey et al., 2013), it remains unclear how vinculin and its F-actin binding activity specifically regulate nascent FA formation and turnover in the lamellipodium and the transition from nascent to maturing FA in the lamellum. To answer this question, we characterized the role of vinculin and its F-actin binding activity in FA organiza-tion and dynamics in the leading edge.
We first verified that deletion of vinculin had no major effects on FA composition by immunofluorescence analyses of talin, paxillin, FAK, zyxin, VASP, and 1 integrin in Vcl-KO MEF (Fig. S3). This also revealed that control MEF displayed numerous small, peripheral FA along the cell edge and fewer mature FA in the lamellum, whereas peripheral FA were sparse and mature FA were more prominent in Vcl-KO MEF (Fig. 5 A), regardless of the FA protein examined (Fig. S3). This suggests
Figure 3. AB perturbs vinculin binding to F-actin. (A) Point mutations introduced into full-length vinculin to analyze the role of vinculin–F-actin binding. PA, N773A/E775A point mutations in the vinculin head domain resulting in partial activation of WT vinculin; AB, I997A mutation in the vinculin tail domain perturbing F-actin binding/bundling of WT vinculin; PA-AB, N773A/E775A/I997A point mutations resulting in partial activation of AB vincu-lin. cDNAs were expressed as EGFP fusion constructs. (B) SDS-PAGE of supernatant and pellet after high-speed cosedimentation of WT and AB vinculin with F-actin at indicated concentrations in the absence or presence of activating peptide IpaA. S, supernatant; P, pellet. (C) Densitometric quantification of F-actin cosedimentations shown in B. Data were fit for single site, saturation binding. Error bars show SEM. (D) Fluorescence micrographs of actin fila-ments polymerized in the absence or presence of IpaA and WT or AB vinculin. Bar, 10 µm. (E) Bar diagram of F-actin bundling induced by WT and AB vinculin in the absence or presence of IpaA; n = 1 (WT – IpaA), n = 1 (WT + IpaA), n = 3 (AB – IpaA), and n = 3 (AB + IpaA). Error bars show standard deviation. (F) SDS-PAGE of supernatant (S) and pellet (P) after high-speed cosedimentation of WT, PA, and PA-AB vinculin with actin at indicated concentrations in the absence or presence of IpaA. (G) Densitometric quantification of F-actin cosedimentations shown in F. Data were fit for single site, saturation binding. Error bars show SEM.
JCB • VOLUME 202 • NUMBER 1 • 2013 168
with X-rhodamine actin using kymograph analyses of SDC time-lapse sequences (Fig. 5 H). This revealed that FA in Vcl-KO MEF elongated significantly faster than FA in control MEF (Fig. 5 I and Video 8). Neither assembly time (time to maximal paxillin fluorescence intensity) nor lifetime of nascent FA were significantly affected by vinculin loss (unpublished data). To-gether, these results demonstrate that vinculin promotes the for-mation and turnover of nascent FA in the lamellipodium, inhibits the transition of nascent FA to maturing FA, and slows the rate of maturation in the lamellum.
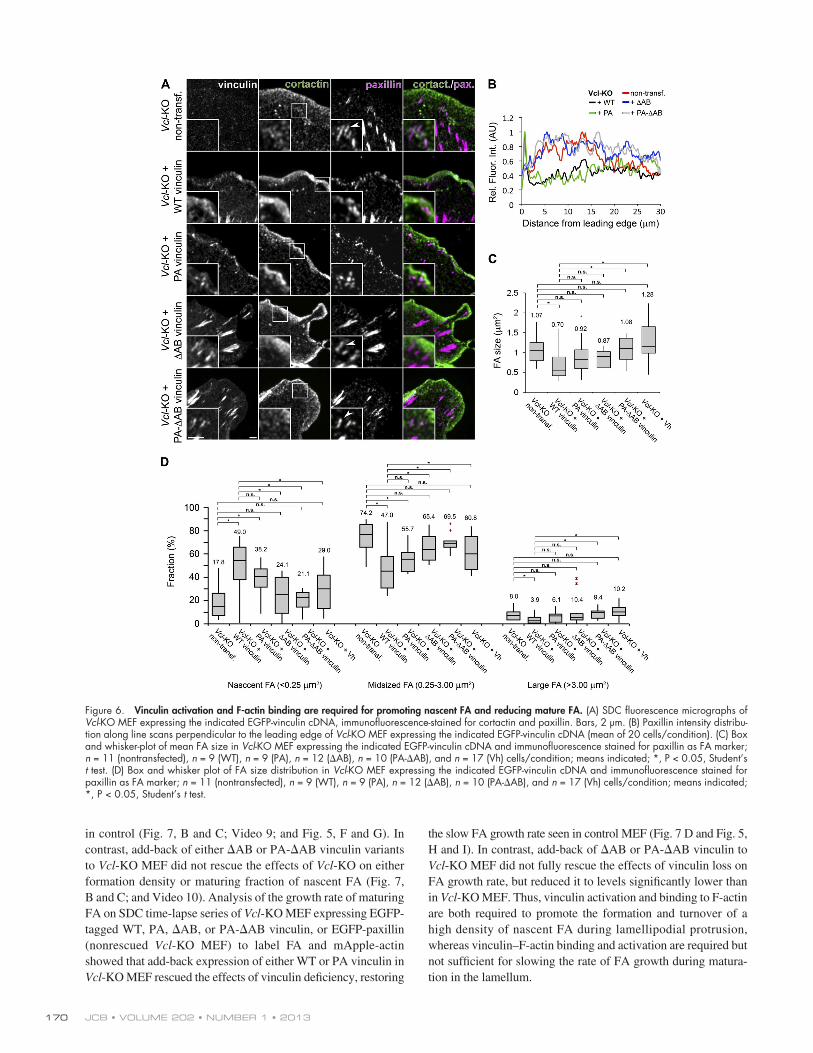
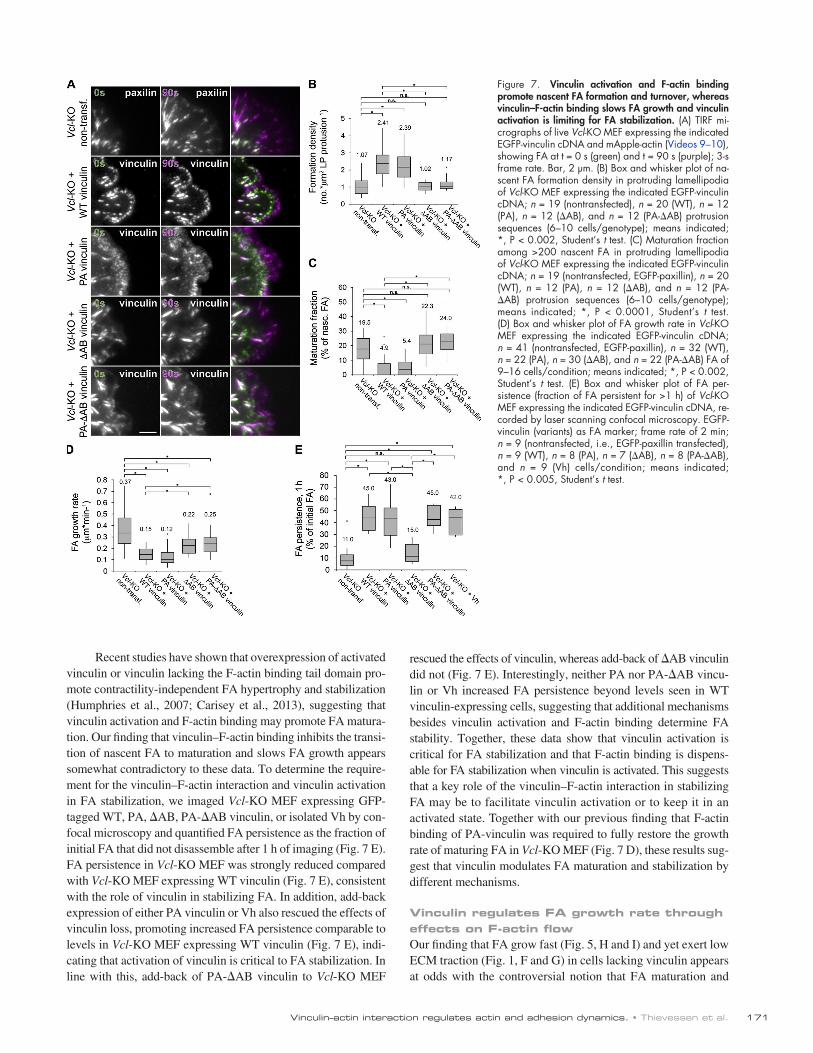
Vinculin activation and F-actin binding promote nascent FA formation and turnover, whereas F-actin binding slows FA growthTo determine the role of vinculin–F-actin binding in FA forma-tion and maturation, we analyzed FA in lamellipodia of Vcl-KO MEF expressing WT, PA, AB, or PA-AB EGFP-tagged vin-culin variants by immunofluorescence staining of paxillin and cortactin (Fig. 6 A). Line scans across the leading edge of Vcl-KO MEF expressing WT or PA vinculin showed that add-back of these vinculin variants rescued the effects of vinculin loss, as indicated by a peak of paxillin intensity within the cortactin-rich lamellipodium and low paxillin levels in the lamellum (Fig. 6 B),
with control MEF (Fig. 5 D and Fig. S4). Thus, vinculin pro-motes nascent FA in the lamellipodium and inhibits mature FA in the lamellum.
To test how vinculin altered the balance between nascent and mature FA, we analyzed FA dynamics in cells coexpressing EGFP-paxillin to label FA and mApple-actin to label lamellipo-dia by time-lapse total internal reflection fluorescence (TIRF) microscopy (Fig. 5 E and Video 7). This revealed that lamellipo-dial protrusion in control MEF was accompanied by a high den-sity of nascent FA formation (FA formed per micrometer squared protrusion), whereas nascent FA formation density in Vcl-KO MEF was strongly reduced (Fig. 5, E and F). Because mature FA arise by growth of nascent FA (Choi et al., 2008), we reasoned that the increase in mature FA in cells lacking vinculin could re-sult from reduced nascent FA disassembly and increased matu-ration frequency. To test this, we quantified the percentage of nascent FA that did not disassemble within the lamellipodium and went on to elongate in the lamellum. In control cells, most nascent FA disassembled and only 1.9% matured, whereas in Vcl-KO MEF, although fewer nascent FA were formed, a larger fraction (22%) of them matured (Fig. 5 G). To test whether vin-culin also regulated the growth of FA after the onset of matura-tion, we measured FA growth rate in control and Vcl-KO MEF expressing EGFP-paxillin as an FA marker and microinjected
Figure 4. Vinculin–F-actin binding restricts lamellipodium width and limits F-actin flow velocity in lamellipodium and mature FA. (A) qFSM of Vcl-KO MEF expressing mApple-actin and the indicated EGFP-vinculin cDNA. (left to right) SDC-FSM images of F-actin (Bar, 5 µm); F-actin flow maps (Bar, 2 μm/min); and F-actin speed maps (μm/min). 5-s frame rate. (B) Cortactin immunofluorescence (pur-ple) staining of Vcl-KO MEF expressing the indicated EGFP-vinculin cDNA. Note distinct, narrow cortactin band in WT- and PA-vinculin (arrows) expressing Vcl-KO MEF and wider, diffuse cortactin band in nontransfected, AB-, and PA-AB-vinculin (arrowheads) expressing Vcl-KO MEF. Bars, 2 µm. (C) Box and whisker plot of mean F-actin flow velocities in protrud-ing lamellipodia of Vcl-KO MEF expressing the indicated EGFP-vinculin cDNA, data cal-culated from qFSM F-actin speed maps; n = 70 (nontransfected), n = 120 (WT), n = 35 (PA), n = 110 (AB), and n = 45 (PA-AB) time points during protrusion (7–22 cells/condition; means indicated; *, P < 0.01, Mann-Whitney U test). (D) Box and whisker plot of local F-actin flow velocity within maturing FA in Vcl-KO MEF expressing the indicated EGFP-vinculin cDNA; n = 41 (nontransfected), n = 32 (WT), n = 22 (PA), n = 30 (AB), and n = 22 (PA-AB) FA of 7–16 cells/condition. EGFP-vinculin mutants were used as FA markers (EGFP-paxillin, non-transfected) and F-actin flow was measured on kymographs; means indicated; *, P < 0.02, Student’s t test. (E) Box and whisker plot of lamellipodium (LP) width at Imax/2 of cortactin line scans, placed through the lamellipodia at regular intervals; n = 145 (nontransfected), 160 (WT), 150 (PA), 195 (AB), and 195 (PA-AB) scans from 29–39 cells/condition; means indi-cated; *, P < 0.001, Mann-Whitney U test.
169Vinculin–actin interaction regulates actin and adhesion dynamics. • Thievessen et al.
loss of midsized FA, but not to the same extent as add-back of WT vinculin (Fig. 6, C and D). Together, these data demonstrate that both vinculin activation and F-actin binding are required for promoting nascent FA and reducing mature FA.
To determine how activation and F-actin binding of vin-culin regulated the balance between nascent and mature FA, we imaged FA dynamics in Vcl-KO MEF expressing WT, PA, AB, or PA-AB EGFP-vinculin to label FA and mApple-actin to label lamellipodia by TIRF microscopy (Fig. 7 A and Videos 9 and 10). We first confirmed the suitability of EGFP-tagged vinculin mutants as markers for the analysis of nascent FA assembly and maturation by cotransfecting Vcl-KO MEF with EGFP-vinculin variants (WT, PA, AB, or PA-AB) and mApple-paxillin and testing the colocalization of paxillin and vinculin variants in TIRF image series of live cells (Fig. S5). Analysis of nascent FA assembly and maturation during lamel-lipodial protrusion showed that add-back reexpression of either WT or PA vinculin in Vcl-KO MEF rescued the effects of vin-culin loss, restoring both the high formation density and low maturing fraction of nascent FA to levels comparable to those
similar to controls (Fig. 5 B). In contrast, Vcl-KO MEF express-ing AB or PA-AB vinculin lacked the peak of paxillin in the lamellipodium, but exhibited a broad peak of paxillin across the lamellum comparable to nontransfected Vcl-KO MEF (Fig. 6 B). Quantification of individual FA area revealed that add-back of WT vinculin in Vcl-KO cells fully rescued the effects of Vcl-KO, decreasing the mean FA size to values similar to control (Fig. 6 C and Fig. 5 C) by gain of nascent FA and loss of midsized and large FA (Fig. 6 D). In contrast, add-back of either PA-AB vin-culin or the vinculin head domain lacking the F-actin binding tail (Vh; amino acids 1–821) to Vcl-KO MEF did not rescue the effects of loss of vinculin on FA size, with FAs exhibiting a signi-ficantly larger size compared with add-back of WT vinculin and size distribution that was indistinguishable from Vcl-KO MEF (Fig. 6, C and D). This is consistent with the notion that activated vinculin promotes enlarged FA (Humphries et al., 2007; Carisey et al., 2013), but further suggests that F-actin binding in the tail of activated vinculin is required for limiting FA size. Add-back of PA or AB vinculin to Vcl-KO partially rescued the effects of vinculin deficiency, reducing FA size via gain of nascent FA and
Figure 5. Vinculin promotes nascent FA for-mation and turnover in lamellipodia and slows FA growth in the lamellum. (A) Paxillin immuno-fluorescence and Alexa Fluor 488–phalloidin staining of F-actin in control and Vcl-KO MEF. Note abundant nascent FA in control (arrows) but not Vcl-KO (arrowhead) lamellipodia and prominent FA in the distal lamellum of Vcl-KO but not control MEF (asterisks). Bars, 10 µm. (B) Paxillin and F-actin (phalloidin) intensity distribution along line scans perpendicular to the leading edge (mean of 25 cells/condition). (C) Box and whiskerplot of mean FA size in n = 10 control and n = 10 Vcl-KO MEF. FA marker paxillin; means indicated; Student’s t test. (D) Box and whisker plot of FA size distribution in n = 10 (control) and n = 10 (Vcl-KO) MEF; FA marker paxillin; means indicated; *, P < 0.05, Student’s t test. (E) TIRF micrographs of live control and Vcl-KO MEF expressing EGFP-paxillin, showing FA at t = 0 s (green) and t = 92 s (purple). Lamellipodia borders outlined based on coexpressed mApple-actin (Video 7). Note the high density of newly formed na-scent FA in control compared to Vcl-KO MEF (asterisks) and the high number of nascent FA undergoing maturation in Vcl-KO compared to control MEF (arrows). 2-s frame rate. Bar, 2 µm. (F) Box and whisker plot of nascent FA for-mation density in protruding lamellipodia of control and Vcl-KO MEF; n = 30 (control) and n = 35 (Vcl-KO) protrusion sequences (6 cells/genotype); means indicated; *, P < 0.001, Student’s t test. (G) Maturation fraction among 55 (control) and 65 (Vcl-KO) nascent FA (6 cells/genotype). *, P < 0.001, Student’s t test. (H) SDC fluorescence time-lapse images of FA growth in control and Vcl-KO MEF; FA marker EGFP-paxillin; 10-s frame rate. Red line shows line scan positioning parallel to the long axis of FA for kymograph analyses (right panels) of FA growth (and local F-actin flow velocity; see Fig. 8 A). D, distance; T, time. Bar, 2 µm. (I) Box and whisker plot of FA (paxillin) growth rate in n = 10 (control) and n = 11 (Vcl-KO) MEF (6–10 FA/cell); means indicated; *, P < 0.001, Student’s t test.
JCB • VOLUME 202 • NUMBER 1 • 2013 170
the slow FA growth rate seen in control MEF (Fig. 7 D and Fig. 5, H and I). In contrast, add-back of AB or PA-AB vinculin to Vcl-KO MEF did not fully rescue the effects of vinculin loss on FA growth rate, but reduced it to levels significantly lower than in Vcl-KO MEF. Thus, vinculin activation and binding to F-actin are both required to promote the formation and turnover of a high density of nascent FA during lamellipodial protrusion, whereas vinculin–F-actin binding and activation are required but not sufficient for slowing the rate of FA growth during matura-tion in the lamellum.
in control (Fig. 7, B and C; Video 9; and Fig. 5, F and G). In contrast, add-back of either AB or PA-AB vinculin variants to Vcl-KO MEF did not rescue the effects of Vcl-KO on either formation density or maturing fraction of nascent FA (Fig. 7, B and C; and Video 10). Analysis of the growth rate of maturing FA on SDC time-lapse series of Vcl-KO MEF expressing EGFP-tagged WT, PA, AB, or PA-AB vinculin, or EGFP-paxillin (nonrescued Vcl-KO MEF) to label FA and mApple-actin showed that add-back expression of either WT or PA vinculin in Vcl-KO MEF rescued the effects of vinculin deficiency, restoring
Figure 6. Vinculin activation and F-actin binding are required for promoting nascent FA and reducing mature FA. (A) SDC fluorescence micrographs of Vcl-KO MEF expressing the indicated EGFP-vinculin cDNA, immunofluorescence-stained for cortactin and paxillin. Bars, 2 µm. (B) Paxillin intensity distribu-tion along line scans perpendicular to the leading edge of Vcl-KO MEF expressing the indicated EGFP-vinculin cDNA (mean of 20 cells/condition). (C) Box and whisker-plot of mean FA size in Vcl-KO MEF expressing the indicated EGFP-vinculin cDNA and immunofluorescence stained for paxillin as FA marker; n = 11 (nontransfected), n = 9 (WT), n = 9 (PA), n = 12 (AB), n = 10 (PA-AB), and n = 17 (Vh) cells/condition; means indicated; *, P < 0.05, Student’s t test. (D) Box and whisker plot of FA size distribution in Vcl-KO MEF expressing the indicated EGFP-vinculin cDNA and immunofluorescence stained for paxillin as FA marker; n = 11 (nontransfected), n = 9 (WT), n = 9 (PA), n = 12 (AB), n = 10 (PA-AB), and n = 17 (Vh) cells/condition; means indicated; *, P < 0.05, Student’s t test.
171Vinculin–actin interaction regulates actin and adhesion dynamics. • Thievessen et al.
rescued the effects of vinculin, whereas add-back of AB vinculin did not (Fig. 7 E). Interestingly, neither PA nor PA-AB vincu-lin or Vh increased FA persistence beyond levels seen in WT vinculin-expressing cells, suggesting that additional mechanisms besides vinculin activation and F-actin binding determine FA stability. Together, these data show that vinculin activation is critical for FA stabilization and that F-actin binding is dispens-able for FA stabilization when vinculin is activated. This suggests that a key role of the vinculin–F-actin interaction in stabilizing FA may be to facilitate vinculin activation or to keep it in an activated state. Together with our previous finding that F-actin binding of PA-vinculin was required to fully restore the growth rate of maturing FA in Vcl-KO MEF (Fig. 7 D), these results sug-gest that vinculin modulates FA maturation and stabilization by different mechanisms.
Vinculin regulates FA growth rate through effects on F-actin flowOur finding that FA grow fast (Fig. 5, H and I) and yet exert low ECM traction (Fig. 1, F and G) in cells lacking vinculin appears at odds with the controversial notion that FA maturation and
Recent studies have shown that overexpression of activated vinculin or vinculin lacking the F-actin binding tail domain pro-mote contractility-independent FA hypertrophy and stabilization (Humphries et al., 2007; Carisey et al., 2013), suggesting that vinculin activation and F-actin binding may promote FA matura-tion. Our finding that vinculin–F-actin binding inhibits the transi-tion of nascent FA to maturation and slows FA growth appears somewhat contradictory to these data. To determine the require-ment for the vinculin–F-actin interaction and vinculin activation in FA stabilization, we imaged Vcl-KO MEF expressing GFP-tagged WT, PA, AB, PA-AB vinculin, or isolated Vh by con-focal microscopy and quantified FA persistence as the fraction of initial FA that did not disassemble after 1 h of imaging (Fig. 7 E). FA persistence in Vcl-KO MEF was strongly reduced compared with Vcl-KO MEF expressing WT vinculin (Fig. 7 E), consistent with the role of vinculin in stabilizing FA. In addition, add-back expression of either PA vinculin or Vh also rescued the effects of vinculin loss, promoting increased FA persistence comparable to levels in Vcl-KO MEF expressing WT vinculin (Fig. 7 E), indi-cating that activation of vinculin is critical to FA stabilization. In line with this, add-back of PA-AB vinculin to Vcl-KO MEF
Figure 7. Vinculin activation and F-actin binding promote nascent FA formation and turnover, whereas vinculin–F-actin binding slows FA growth and vinculin activation is limiting for FA stabilization. (A) TIRF mi-crographs of live Vcl-KO MEF expressing the indicated EGFP-vinculin cDNA and mApple-actin (Videos 9–10), showing FA at t = 0 s (green) and t = 90 s (purple); 3-s frame rate. Bar, 2 µm. (B) Box and whisker plot of na-scent FA formation density in protruding lamellipodia of Vcl-KO MEF expressing the indicated EGFP-vinculin cDNA; n = 19 (nontransfected), n = 20 (WT), n = 12 (PA), n = 12 (AB), and n = 12 (PA-AB) protrusion sequences (6–10 cells/genotype); means indicated; *, P < 0.002, Student’s t test. (C) Maturation fraction among >200 nascent FA in protruding lamellipodia of Vcl-KO MEF expressing the indicated EGFP-vinculin cDNA; n = 19 (nontransfected, EGFP-paxillin), n = 20 (WT), n = 12 (PA), n = 12 (AB), and n = 12 (PA-AB) protrusion sequences (6–10 cells/genotype); means indicated; *, P < 0.0001, Student’s t test. (D) Box and whisker plot of FA growth rate in Vcl-KO MEF expressing the indicated EGFP-vinculin cDNA; n = 41 (nontransfected, EGFP-paxillin), n = 32 (WT), n = 22 (PA), n = 30 (AB), and n = 22 (PA-AB) FA of 9–16 cells/condition; means indicated; *, P < 0.002, Student’s t test. (E) Box and whisker plot of FA per-sistence (fraction of FA persistent for >1 h) of Vcl-KO MEF expressing the indicated EGFP-vinculin cDNA, re-corded by laser scanning confocal microscopy. EGFP-vinculin (variants) as FA marker; frame rate of 2 min; n = 9 (nontransfected, i.e., EGFP-paxillin transfected), n = 9 (WT), n = 8 (PA), n = 7 (AB), n = 8 (PA-AB), and n = 9 (Vh) cells/condition; means indicated; *, P < 0.005, Student’s t test.
JCB • VOLUME 202 • NUMBER 1 • 2013 172
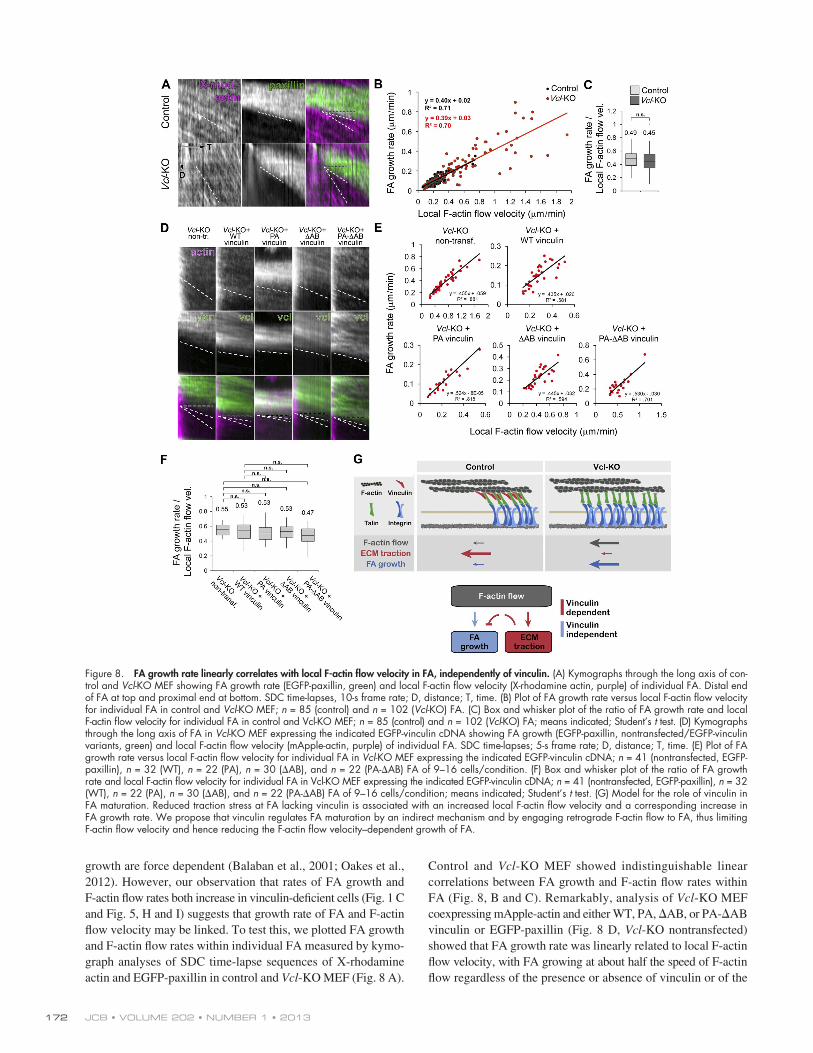
Control and Vcl-KO MEF showed indistinguishable linear correlations between FA growth and F-actin flow rates within FA (Fig. 8, B and C). Remarkably, analysis of Vcl-KO MEF coexpressing mApple-actin and either WT, PA, AB, or PA-AB vinculin or EGFP-paxillin (Fig. 8 D, Vcl-KO nontransfected) showed that FA growth rate was linearly related to local F-actin flow velocity, with FA growing at about half the speed of F-actin flow regardless of the presence or absence of vinculin or of the
growth are force dependent (Balaban et al., 2001; Oakes et al., 2012). However, our observation that rates of FA growth and F-actin flow rates both increase in vinculin-deficient cells (Fig. 1 C and Fig. 5, H and I) suggests that growth rate of FA and F-actin flow velocity may be linked. To test this, we plotted FA growth and F-actin flow rates within individual FA measured by kymo-graph analyses of SDC time-lapse sequences of X-rhodamine actin and EGFP-paxillin in control and Vcl-KO MEF (Fig. 8 A).
Figure 8. FA growth rate linearly correlates with local F-actin flow velocity in FA, independently of vinculin. (A) Kymographs through the long axis of con-trol and Vcl-KO MEF showing FA growth rate (EGFP-paxillin, green) and local F-actin flow velocity (X-rhodamine actin, purple) of individual FA. Distal end of FA at top and proximal end at bottom. SDC time-lapses, 10-s frame rate; D, distance; T, time. (B) Plot of FA growth rate versus local F-actin flow velocity for individual FA in control and Vcl-KO MEF; n = 85 (control) and n = 102 (Vcl-KO) FA. (C) Box and whisker plot of the ratio of FA growth rate and local F-actin flow velocity for individual FA in control and Vcl-KO MEF; n = 85 (control) and n = 102 (Vcl-KO) FA; means indicated; Student’s t test. (D) Kymographs through the long axis of FA in Vcl-KO MEF expressing the indicated EGFP-vinculin cDNA showing FA growth (EGFP-paxillin, nontransfected/EGFP-vinculin variants, green) and local F-actin flow velocity (mApple-actin, purple) of individual FA. SDC time-lapses; 5-s frame rate; D, distance; T, time. (E) Plot of FA growth rate versus local F-actin flow velocity for individual FA in Vcl-KO MEF expressing the indicated EGFP-vinculin cDNA; n = 41 (nontransfected, EGFP-paxillin), n = 32 (WT), n = 22 (PA), n = 30 (AB), and n = 22 (PA-AB) FA of 9–16 cells/condition. (F) Box and whisker plot of the ratio of FA growth rate and local F-actin flow velocity for individual FA in Vcl-KO MEF expressing the indicated EGFP-vinculin cDNA; n = 41 (nontransfected, EGFP-paxillin), n = 32 (WT), n = 22 (PA), n = 30 (AB), and n = 22 (PA-AB) FA of 9–16 cells/condition; means indicated; Student’s t test. (G) Model for the role of vinculin in FA maturation. Reduced traction stress at FA lacking vinculin is associated with an increased local F-actin flow velocity and a corresponding increase in FA growth rate. We propose that vinculin regulates FA maturation by an indirect mechanism and by engaging retrograde F-actin flow to FA, thus limiting F-actin flow velocity and hence reducing the F-actin flow velocity–dependent growth of FA.
173Vinculin–actin interaction regulates actin and adhesion dynamics. • Thievessen et al.
and for slowing FA growth rate during maturation. However, we uncovered distinct roles for vinculin activation and F-actin binding in FA stabilization. Previous findings showed that loss of vinculin resulted in small FA (Saunders et al., 2006), whereas constitutively activated vinculin (T12) or vinculin head induced enlarged, stable FA throughout the ventral cell surface (Humphries et al., 2007; Carisey et al., 2013), demonstrating vinculin’s role in FA stabilization. We found that although F-actin binding was required for FA stabilization in the absence of vinculin pre-activation, preactivation of vinculin relieved the requirement of F-actin binding in promoting FA stabilization (Fig. 7 E). This suggests that vinculin binding to F-actin stabilizes FA by facili-tating vinculin activation, rather than through the transmission of cytoskeletal forces to integrins, in agreement with the model of Carisey et al. (2013). Furthermore, our demonstration that vinculin inhibits FA maturation but promotes FA stabilization reveals that FA maturation and stabilization are mechanistically distinct processes.
By examining the rate of F-actin retrograde flow within growing FA, we surprisingly found that FA growth rate during maturation correlates with local F-actin flow speed, independent of vinculin or its activation or F-actin binding activities. Further-more, our data reveal that vinculin promotes strong force trans-mission but slows growth of FA. This contradicts the notion that FA grow and mature in response to force (Balaban et al., 2001). However, this notion has been challenged by recent findings that suggest FA growth is force independent but F-actin dependent (Oakes et al., 2012). This agrees with our current finding that FA growth does not correlate with force but depends on the speed of F-actin flow. Together with our previous demonstration that F-actin flow rate dictates ECM traction stress at FA (Gardel et al., 2008), our findings strengthen the notion that the velocity of retrograde F-actin flow is a major regulator of FA function. We propose that in addition to direct regulation by interaction with FA proteins, vinculin also regulates FA dynamics by an in-direct mechanism, i.e., by engaging retrograde F-actin flow to FA. Slowing F-actin flow rate by vinculin engagement of F-actin to FA could in turn reduce tension on ECM-bound integrins in nascent FA to promote their disassembly and turnover and could also reduce the F-actin flow-dependent growth rate of FA (Fig. 8 G). Together, our results show that in addition to vincu-lin’s well-established role in FAs vinculin also contributes to cell migration through regulation of leading edge F-actin organization and dynamics and highlight the importance of interdependent feedback between F-actin and FA in leading edge processes.
Materials and methodsIsolation of primary MEF and Vcl disruptionAnimals were maintained according to guidelines approved by the National Heart, Lung and Blood Institute Animal Care and Use Committee. Mice were kept on a C57J/BL6 background and PCR genotyped for loxP-modified Vinculin (Vcl fl; Zemljic-Harpf et al., 2007). E13.5 embryos from Vcl fl/flxVcl fl/fl timed matings were dissected and decapitated, and internal organs were removed. Tissue was cut into pieces and incubated 3× for 10 min in 0.25 mg/ml Trypsin/EDTA (Life Technologies). Single cells were transferred into DMEM/20% FBS after each incubation. Pooled suspensions were passed through 100-µm nylon mesh, and cells were pelleted (5 min at 1,200 rpm) and plated (DMEM/20% FBS) on cell culture dishes. Non-adherent cells
vinculin mutant expressed (Fig. 8, E and F). Thus, FA growth correlates with F-actin flow rate, independent of vinculin, suggest-ing that vinculin may attenuate FA growth indirectly by effects on F-actin flow.
DiscussionOur results show for the first time that the FA protein vinculin regulates leading edge F-actin organization and dynamics. Our characterization of a single amino acid substitution in vinculin that specifically disrupts F-actin binding allows the first test of the role of F-actin binding in vinculin functions. We show that the vinculin–F-actin interaction is required to attenuate F-actin retrograde flow in the lamellipodium and for functionally delin-eating the protrusive lamellipodium from the contractile lamel-lum (Ponti et al., 2004; Hu et al., 2007; Alexandrova et al., 2008; Shemesh et al., 2009). We demonstrate that through F-actin bind-ing vinculin slows leading edge F-actin retrograde flow at the onset of FA maturation. Together with our demonstration that vinculin promotes traction force at FA, this suggests that vinculin mediates conversion of forces generated in the cytoskeleton that drive retrograde flow into traction force on the ECM during FA maturation. These findings support previous studies showing that vinculin bears force between its head and tail domain (Grashoff et al., 2010) and that the vinculin tail domain associates with F-actin in cells (Humphries et al., 2007). Collectively, these stud-ies implicate vinculin as a component of the molecular clutch, and suggest that vinculin exerts its role in determining the archi-tecture of leading edge F-actin by engaging F-actin flow to the ECM at maturing FA.
Although our findings support the notion that vinculin par-ticipates in linking F-actin flow to FA, we observed a partial res-cue (50–70%) of F-actin and FA dynamics in Vcl-KO MEF by F-actin binding-deficient vinculin. Thus, vinculin may also regu-late F-actin dynamics by mechanisms independent of direct F-actin binding. Other vinculin binding partners that could medi-ate effects on F-actin dynamics include F-actin regulatory pro-teins such as Arp2/3 (DeMali et al., 2002) or VASP (Brindle et al., 1996) or partners such as paxillin that regulate signaling to Rho-GTPases (Turner et al., 1990; Deakin and Turner, 2008; Carisey et al., 2013). Residual F-actin binding of AB or PA-AB vinculin could also be responsible for the partial rescue, despite the strong reduction in vinculin–F-actin binding observed in vitro. Alternatively, changes in F-actin dynamics produced by vinculin loss could be a result of secondary effects of the highly curved leading edge and lobular lamellipodial morphology ob-served in the absence of vinculin. However, we found that lead-ing edge lamellipodial curvature and F-actin flow velocity were not correlated, independent of the presence of vinculin or its interaction with F-actin (unpublished data).
Our characterization of an F-actin binding point mutant also allowed us to tease out distinct roles for F-actin binding and vinculin activation in regulating FA dynamics. We found that both vinculin activation and F-actin binding are required for promoting the formation of a high density of nascent FA during lamellipodial protrusion, for inhibiting the transition of nascent to mature FA by stimulating nascent FA disassembly,
JCB • VOLUME 202 • NUMBER 1 • 2013 174
mApple-actin in control and Vcl-KO MEF on FN-coated coverslips. Pairs of EGFP and mApple images were taken every 2 s using a 100×/1.49 NA Apo TIRF objective and an evanescent field depth of 150 nm. TIRF mi-croscopy of EGFP-paxillin, EGFP-vinculin mutants, and mApple-actin in Vcl-KO MEF on FN coated coverslips was performed on an inverted microscope system (Eclipse Ti; Nikon). Pairs of EGFP and mApple images were taken every 3 s using a 100×/1.49 NA Apo TIRF objective and an evanescent field depth of 150 nm. Long-term time-lapse phase-contrast imaging of single MEF migrating on FN-coated coverslips was performed on an in-verted microscope (TE300; Nikon) using a 10×/0.25 NA Plan objective and 0.52 NA condenser. Images were taken every 10 min for 12 h. Differ-ential interference contrast imaging of MEF migrating on FN-coated cover-slips was performed on the same system using a 60×/1.49 NA Apo TIRF objective and 0.85 NA condenser. Paxillin immunofluorescence micro-graphs for FA size quantifications were acquired on the TIRF/SDC system described above (Shin et al., 2010) using 100× or 60×/1.49 NA Apo TIRF objective lenses or an SP5 laser scanning microscope system using a 100×/1.46 NA Plan Apo objective lens (LAS AF acquisition software; Leica). Epifluorescence images of cells stained for paxillin, cortactin, pS19MLC-2 or MLC-2, and/or Alexa Fluor 488–phalloidin staining were ac-quired on either the TIRF/SDC or the TE300-based Epifluorescence system described above using a 100×/1.49 NA Apo TIRF objective. All functions on the TIRF, SDC, and epifluorescence microscope systems were controlled using MetaMorph software (Molecular Devices); temperature was main-tained at 37°C (airstream incubator; Nevtek); and images were acquired using a cooled charge-coupled device (CoolSNAP-HQ2; Photometrics) op-erated in 14-bit read-out mode. Laser scanning confocal microscopy of EGFP-tagged vinculins for FA persistence quantification was performed on an SP5 microscope system (LAS AF acquisition software) at 37°C (whole stage incubation chamber; Leica) using a 63×/1.4 NA Plan Apo objective lens at a frame rate of 2 min. All live cell experiments were performed using Phenol red–free DMEM containing 5% FCS, 20 mM Hepes, and 10 U/ml oxyrase as imaging medium.
ImmunofluorescenceCells were fixed in 4% paraformaldehyde/PBS, permeabilized 5 min in 0.5% Triton X-100/PBS, and blocked (2% BSA and 0.02% Triton X-100/PBS) for 1 h at RT, followed by overnight incubation (4°C) with primary antibodies, 3× washing (PBS), and secondary antibody incubation (1 h at RT), before mounting in fluorescent mounting medium (Dako) or PBS (TIRF microscopy). Alexa Fluor 488–phalloidin (1:400; Invitrogen) was included in the second-ary antibody solution where indicated. Antibodies used were as follows: monoclonal anti-vinculin (1:250), anti-talin (1:200) and polyclonal rabbit anti-vinculin (1:100; Sigma-Aldrich); monoclonal anti-paxillin (1:100; BD); mono-clonal anti-FAK (1:250; Invitrogen); rat monoclonal anti-1integrin (9EG7; 1:100; BD); rabbit polyclonal anti-cortactin (1:100), anti-Vasp (1:100), anti-pS19 myosin light chain-2 (1:50), and monoclonal anti-myosin light chain-2 (1:50; Cell Signaling Technology). Rabbit polyclonal anti-zyxin (1:1,000) was provided by M. Beckerle (Huntsman Cancer Institute, Salt Lake City, UT). Anti–rabbit, –mouse, and –rat fluorophore conjugates (1:500) were obtained from Jackson ImmunoResearch Laboratories, Inc.
Image analysisCell area. Cells in phase-contrast images were manually outlined (Meta-Morph) and the segmented area was determined.
Cell migration velocity. Nuclei were manually tracked (MetaMorph) and instantaneous velocities (displacement per time between consecutive frames) were determined and averaged for each cell.
Spatial distribution of FA, F-actin, and pS19MLC2. Fluorescence inten-sity distributions of paxillin, Alexa Fluor 488–phalloidin, and pS19MLC2 were recorded along line scans (4–8-µm wide, orthogonal to leading edge); lead-ing edge position was defined by increase of Alexa Fluor 488–phalloidin intensity above extracellular background and extracellular background was subtracted. Paxillin images were additionally background flattened (7-pixel kernel) to compensate for cytoplasmic background.
FA size distribution. TIRF or SDC or laser scanning confocal images of paxillin immunofluorescence stainings were manually thresholded, bina-rized, and morphologically filtered (“open-close,” 2-pixel kernel) to include small FA. Segmented area of thresholded regions was then determined (MetaMorph).
Nascent FA formation density. TIRF image sequences of MEF express-ing EGFP-paxillin and mApple-actin during leading edge protrusion were analyzed for the number of newly assembling nascent FA within the boundaries of the protruding lamellipodium. Diffraction-limited (0.1 µm2)
were removed after 2 h. 50% of each culture was infected with GFP/cre- expressing adenovirus and 50% with GFP-expressing adenovirus (S. Gutkind, National Institute of Dental and Craniofacial Research, National Institutes of Health, Bethesda, MD). 15–20 h after infection GFP-expressing cells were FACS isolated and cultured for an additional 4 d to obtain vinculin-deficient cells (i.e., Vcl-KO) without GFP-cre and control cells without GFP. Cells were maintained in DMEM/20% FBS and passaged up to three times.
Cloning and construction of fluorescent protein conjugatesPCR products and restriction digests were purified using the QIAquick gel extraction kit (QIAGEN). Plasmid DNA was purified using the QIAprep Spin Miniprep kit (QIAGEN). Restriction endonucleases were purchased from Life Technologies or New England Biolabs, Inc. The complete sequences for all fluorescent protein constructs were confirmed by sequencing (Florida State University Bioanalytical and Molecular Cloning DNA Sequencing Labora-tory). All mApple mammalian expression vectors were constructed using C1 and N1 cloning vectors. Fluorescent protein cDNA was PCR amplified (Phusion Flash; Finnzymes) with a 5 primer encoding an AgeI site and a 3 primer encoding a BspEI (C1) or NotI (N1) site for C- or N-terminal fusions, respectively. Purified and digested PCR products were ligated into similarly digested EGFP-C1 and EGFP-N1 vector backbones (Takara Bio Inc.). Fusion target cDNA was PCR amplified with primers containing restriction enzyme sites and ligated into C1 or N1 cloning vectors. To generate fusion vectors, the appropriate cDNA target cloning vector and a mApple C1 or N1 clon-ing vector were digested with appropriate enzymes and ligated together after gel purification. mApple–paxillin fusion was generated with chicken-paxillin and EcoRI and NotI (A. Horwitz, University of Virginia, Charlottes-ville, VA; NCBI Nucleotide accession no. NM_204984.1). mApple fused to -actin was prepared with human -actin and NheI and BglII (Takara Bio Inc.; NCBI Nucleotide accession no. NM_001101.3). EGFP-tagged mu-tants (N773A/E775A and I997A) of avian vinculin (K. Yamada, National Institute of Dental and Craniofacial Research, National Institutes of Health, Bethesda, MD) were generated using QuikChange site-directed mutagene-sis (Agilent Technologies), with sequences verified by DNA sequencing. DNA for mammalian cell transfection was prepared using the Plasmid Maxi kit (QIAGEN). EGFP-tagged Vh 1–821 was obtained from G. Diez (Friedrich-Alexander-University of Erlangen-Nuremberg, Erlangen, Germany).
Western blotCells were scraped for 1 min in ice-cold Laemmli buffer containing protease inhibitors (Roche) and phosphatase inhibitors (Sigma-Aldrich), triturated 8–10× (25-gauge needle), and frozen in aliquots. 10 µg of protein/lane were SDS-PAGE separated and electro-blotted to PVDF membrane (EMD Mil-lipore). Membranes were blocked (5% nonfat dry milk or 3% BSA in TBS/0.1% Tween 20), immunoprobed with primary and HRP-conjugated secondary antibodies, and developed using ECL substrate (GE Healthcare). Antibodies used were as follows: monoclonal anti-vinculin (1:1,000), anti-talin (1:1,000) and anti-cre (1:1,000; Sigma-Aldrich); monoclonal anti-paxillin (1:1,000; BD); monoclonal anti-GAPDH (1:1,000; Cell Signaling Technology); and anti–mouse and –rabbit HRP conjugates (1:10,000; Jackson ImmunoResearch Laboratories, Inc.).
Microinjection and transfectionCytoplasmic microinjection of X-rhodamine–labeled actin (0.6 mg/ml; Gupton et al., 2005) and EGFP-paxillin cDNA (0.18 µg/µl) was performed on an inverted microscope (TE-200; Nikon) using a microinjector (FemtoJet; Eppendorf) under constant flow (0.3–0.4 psi). MEF were plated onto 10 µg/ml fibronectin (FN)-coated coverslips 15–18 h before microinjection and imaged 3–5 h after injection to ensure EGFP-paxillin expression. MEF for TIRF, SDC, and TFM were nucleofected (solution MEF2, program T20; Lonza) and plated on FN-coated coverslips (10 µg/ml) or FN-coupled polyacrylamide sub-strates (Sabass et al., 2008) 15–18 h before imaging or fixation.
MicroscopySDC-FSM of X-rhodamine actin or mApple-actin and EGFP-paxillin was performed on an inverted microscope system (TE2000E2; Nikon; Shin et al., 2010) using a 100×/1.49 NA Apo TIRF objective lens. Pairs of X-rhodamine or mApple-actin and EGFP images were captured every 10 s. The same system was used with a 60×/1.2 NA Plan Apo violet-corrected water immersion objective and 1.5× beam expansion for TFM of EGFP-paxillin expressing MEF on FN-coupled polyacrylamide substrates embed-ded with 0.15% red (580/605 nm) and far-red (660/680 nm) fluorescent beads (40 nm; Invitrogen). Image triplets of EGFP and the two bead colors were acquired before and after cell detachment via trypsin perfu-sion. The system was also used for TIRF microscopy of EGFP-paxillin and
175Vinculin–actin interaction regulates actin and adhesion dynamics. • Thievessen et al.
mutagenesis, with sequences verified by DNA sequencing. Vinculin protein expression and purification have been reported previously (Bakolitsa et al., 2004). In brief, Escherichia coli BL21(DE3)RIPL (Agilent Technologies) cells transformed with vinculin plasmids were grown in Lysogeny broth-rich media at 37°C to an A600 of 0.6. The cultures were cooled to 18°C before adding isopropyl -d-1-thiogalactopyranoside to a final concentration of 0.5 mM to induce vinculin expression overnight. Cells were pelleted (5,800 g, 30 min), resuspended in lysis buffer (50 mM Tris, 500 mM NaCl, 5 mM imidazole, and 5 mM -mercaptoethanol, pH 8.0), and sonicated. The lysates were clarified (25,000 g, 40 min) and the supernatant was loaded onto a nickel affinity column (QIAGEN) and washed twice with a nickel wash buffer (50 mM Tris, 500 mM NaCl, 10 mM imidazole, and 5 mM -mercaptoetha-nol, pH 8.0). Histidine-tagged vinculin protein was then eluted with a nickel elution buffer (50 mM Tris, 500 mM NaCl, 500 mM imidazole, and 5 mM -mercaptoethanol, pH 8.0). The His tag was removed by thrombin (Sigma-Aldrich) addition before further purification by anion exchange (Hiprep Q XL 16/10) fast protein liquid chromatography (GE Healthcare) and size exclusion using Sephacryl S-200 media (GE Healthcare). All vinculin vari-ants were examined by SDS-PAGE to assess purity and protein integrity be-fore being used for biochemical assays. Protein concentrations were determined before each experiment using the following methods. For actin, protein concentration was determined using the Bio-Rad Laboratories pro-tein assay. For vinculin, concentration was determined by measuring absor-bance at 280 nm and calculated using the extinction coefficient 17,990. IPA peptide was synthesized and a 1-M stock solution was made based on the molecular mass of the peptide.
F-actin cosedimentation assayF-actin binding/bundling properties of vinculin variants were assessed using an adapted F-actin cosedimentation assay (Shen et al., 2011). In brief, G-actin purified from rabbit muscle acetone powder (Pel-Freez Biologicals) was polymerized with an equal volume of 2× actin polymerization buffer (20 mM Tris, 200 mM KCl, 5 mM MgCl2, and 4 mM dithiothreitol, pH 7.5) at RT for 30 min. To assess F-actin binding of the vinculin variants, 100-µl samples in actin polymerization buffer containing actin at concentrations ranging from 0 to 30 µM,10 µM of vinculin protein, and 100 µM of IpaA peptide (Ac-NNIYKAAKDVTTSLSKVLKNIN-NH2) were incubated at RT for 1 h. The reported F-actin concentration was calculated using the concentra-tion of G-actin before polymerization. The samples were centrifuged at high speed (184,200 g) on a TLA 100 rotor (Beckman Coulter) for 30 min at 25°C. For bundling assays, 200-µl samples in actin polymerization buffer containing 20 µM of actin, 10 µM of vinculin protein, and 100 µM of IpaA peptide were incubated at RT for 1 h. Samples containing F-actin bundles were obtained by careful extraction of the supernatant after low speed cen-trifugation (5,000 g). The pellet was resuspended in 200 µl of 0.1% SDS buffer (0.1% SDS, 25 mM glycine, and 25 mM Tris, pH 8.3). Actin and vin-culin protein in supernatant and solubilized pellet were SDS-PAGE sepa-rated (15%) and densitometrically quantified using ImageJ software. Vinculin binding percentages were calculated using the following formula:
% vinculin bound = vinculin
vinculin + vinculinpellet
pellet ssupernatant.
Fluorescence microscopy of F-actin bundlesF-actin bundles induced by addition of WT or I997A vinculin were visualized using fluorescence microscopy as previously described (Shen et al., 2011). Samples were prepared following conditions described for the F-actin bun-dling assay. In brief, 20 µM of prepolymerized F-actin and IpaA petide were incubated with 0 or 10 µM WT or I997A vinculin at RT for 1 h. The mixture was diluted 20× with actin polymerization buffer (10 mM Tris, 100 mM KCl, 2.5 mM MgCl2, and 2 mM dithiothreitol, pH 7.5). Alexa Fluor 488–phalloidin (Invitrogen) was added to the mixture to a final concentration of 1.5 µM and then incubated at RT for 5 min. The sample was diluted to an actin concentra-tion of 50 nM. 5-µl aliquots were placed on a glass slide and covered with a coverslip. Fluorescence images were acquired on an Axiovert 200M micro-scope (Carl Zeiss) using a 60× objective and an ORCA-ERAG digital camera (Hamamatsu Photonics).
Statistical analysisNormally distributed data were analyzed using a two-tailed Student’s t test, unequal variance, and significance value specific for each analysis (0.05 if not mentioned). Non-normally distributed data were analyzed using a Mann-Whitney U test with significance value specific for each analysis
EGFP-paxillin fluorescence intensity maxima that were stable for >6–8 s were counted as nascent FA, whereas short-lived (2–4 s) diffraction-limited intensity maxima were excluded. The leading edge in the region of interest was outlined on each frame in the mApple-actin image to normalize adhe-sion counts per lamellipodial area gained.
Nascent FA assembly time and lifetime. EGFP-paxillin fluorescence in-tensity within nascent FA was recorded and local background was sub-tracted over time. Time elapsed between the onset of intensity increase and intensity maximum was defined as assembly time.
FA growth. SDC time-lapses of EGFP-paxillin expressing MEF were analyzed via kymographs aligned along the axis of adhesion elongation, and growth rate was calculated as elongation at the proximal FA tip over time.
Local F-actin flow velocity within maturing FA. The same kymograph used to determine the growth of individual FA was applied to the X-rhoda-mine/mApple channel to determine F-actin flow within the FA at the given time.
Lamellipodium width. Cortactin immunofluorescence intensity distribu-tions along line scans (perpendicular to leading edge through the lamelli-podium; 1.2-µm wide), placed at 15–20-µm intervals along the leading cell edge, were recorded in epifluorescence images. Extracellular back-ground was subtracted, and the width of the intensity distribution at Imax/2 was defined as lamellipodium width.
SDC-FSM of X-rhodamine actin/mApple-actin and EGFP-paxillin/EGFP-vinculin mutants. F-actin flow analysis was performed using fsmCenter software (MatLab; Mathworks) as described previously (Danuser and Waterman-Storer, 2006). Mean F-actin flow rates in lamellipodia and lamel-lae were quantified from F-actin speed maps of leading edge protrusion phases. Lamellipodia and lamelllae areas were manually outlined for each frame based on FSM F-actin images. Lamellipodia were defined as the re-gion of fast F-actin flow abutting the cell edge and lamelllae were defined as the region just proximal to the lamellipodia. Automated FA tracking and grouping of F-actin flow velocities based on their proximity to FA was based on a custom-written FA detection and tracking algorithm (see the computa-tional source code in the online supplemental material). In brief, EGFP-paxil-lin images of control and Vcl-KO MEF were filtered using a fourth order steerable filter (Jacob and Unser, 2004) and local maxima were extracted. An anisotropic Gaussian model was then fitted to each local maximum. A goodness-of-fit test on the residual of each fit and a Student’s t test on each estimated model parameter were performed to remove outliers (significance level P = 0.05). Detected features were then tracked using uTrack (Jaqaman et al., 2008), with gap closing and linear motion estimation modes enabled. Individual tracks were then grouped together to reconstruct FA over time. Grouping was achieved in a graph-matching procedure that globally maxi-mized a pairwise score function computed between tracks. The score func-tion evaluated the relative proximity of the two tracks and their alignment. Alignment was measured according to the orientation of the features pro-vided by the fitting step and the main direction of the tracks. Pairs of tracks were discarded if their mean pairwise distance was >400 nm within the first 2 µm away from the cell edge or >1.5 µm elsewhere. F-actin speed was then assigned to each detected FA by gathering all speckles lying within the vicin-ity of each adhesion. FA vicinity at each frame was defined as the set of pix-els falling into a 5-pixel (335 nm) radius around the detected adhesion. Lamellipodium–lamellum border for automated, region-specific F-actin speed measurements outside of segmented adhesions was defined based on la-mellipodium width measurements shown in Fig. 2 E and was set at a dis-tance of 1.7 µm from the leading edge as a common cutoff for both control and Vcl-KO MEF.
TFM. Fourier-transformed traction cytometry was used to reconstruct traction stresses from the displacement field (Sabass et al., 2008). Images of deformed and relaxed substrates were aligned to compensate for stage drift and movement of microspheres was quantified with sub-pixel accu-racy using custom-written MatLab software (Gardel et al., 2008; Sabass et al., 2008). To measure traction exerted by individual FA, the traction vectors in the vicinity of large, spatially separated FA were summed and normalized to FA area.
FA persistence. All FA present at the beginning of 1-h laser scanning confocal time-lapse series of EGFP-vinculin (variants) expressing cells were manually tracked over time to record the fraction of FA that did not disas-semble within 1 h. FA persistence was calculated as the ratio of persistent to total initial FA.
Vinculin protein expression and purificationFull-length chicken vinculin was cloned into a pET15b vector, and the I997A point mutation was generated using QuikChange site-directed
JCB • VOLUME 202 • NUMBER 1 • 2013 176
Chan, C.E., and D.J. Odde. 2008. Traction dynamics of filopodia on compliant substrates. Science. 322:1687–1691. http://dx.doi.org/10.1126/science .1163595
Choi, C.K., M. Vicente-Manzanares, J. Zareno, L.A. Whitmore, A. Mogilner, and A.R. Horwitz. 2008. Actin and alpha-actinin orchestrate the assembly and maturation of nascent adhesions in a myosin II motor-independent man-ner. Nat. Cell Biol. 10:1039–1050. http://dx.doi.org/10.1038/ncb1763
Cohen, D.M., H. Chen, R.P. Johnson, B. Choudhury, and S.W. Craig. 2005. Two distinct head-tail interfaces cooperate to suppress activation of vinculin by talin. J. Biol. Chem. 280:17109–17117. http://dx.doi.org/10.1074/jbc .M414704200
Danuser, G., and C.M. Waterman-Storer. 2006. Quantitative fluorescent speckle microscopy of cytoskeleton dynamics. Annu. Rev. Biophys. Biomol. Struct. 35:361–387. http://dx.doi.org/10.1146/annurev.biophys.35.040405 .102114
Deakin, N.O., and C.E. Turner. 2008. Paxillin comes of age. J. Cell Sci. 121:2435–2444. http://dx.doi.org/10.1242/jcs.018044
DeMali, K.A., C.A. Barlow, and K. Burridge. 2002. Recruitment of the Arp2/3 complex to vinculin: coupling membrane protrusion to matrix adhesion. J. Cell Biol. 159:881–891. http://dx.doi.org/10.1083/jcb.200206043
Dumbauld, D.W., K.E. Michael, S.K. Hanks, and A.J. García. 2010. Focal ad-hesion kinase-dependent regulation of adhesive forces involves vinculin recruitment to focal adhesions. Biol. Cell. 102:203–213. http://dx.doi .org/10.1042/BC20090104
Galbraith, C.G., K.M. Yamada, and M.P. Sheetz. 2002. The relationship be-tween force and focal complex development. J. Cell Biol. 159:695–705. http://dx.doi.org/10.1083/jcb.200204153
Gardel, M.L., B. Sabass, L. Ji, G. Danuser, U.S. Schwarz, and C.M. Waterman. 2008. Traction stress in focal adhesions correlates biphasically with actin retrograde flow speed. J. Cell Biol. 183:999–1005. http://dx.doi .org/10.1083/jcb.200810060
Grashoff, C., B.D. Hoffman, M.D. Brenner, R. Zhou, M. Parsons, M.T. Yang, M.A. McLean, S.G. Sligar, C.S. Chen, T. Ha, and M.A. Schwartz. 2010. Measuring mechanical tension across vinculin reveals regula-tion of focal adhesion dynamics. Nature. 466:263–266. http://dx.doi .org/10.1038/nature09198
Gupton, S.L., K.L. Anderson, T.P. Kole, R.S. Fischer, A. Ponti, S.E. Hitchcock-DeGregori, G. Danuser, V.M. Fowler, D. Wirtz, D. Hanein, and C.M. Waterman-Storer. 2005. Cell migration without a lamellipodium: transla-tion of actin dynamics into cell movement mediated by tropomyosin. J. Cell Biol. 168:619–631. http://dx.doi.org/10.1083/jcb.200406063
Hu, K., L. Ji, K.T. Applegate, G. Danuser, and C.M. Waterman-Storer. 2007. Differential transmission of actin motion within focal adhesions. Science. 315:111–115. http://dx.doi.org/10.1126/science.1135085
Humphries, J.D., P. Wang, C. Streuli, B. Geiger, M.J. Humphries, and C. Ballestrem. 2007. Vinculin controls focal adhesion formation by direct interactions with talin and actin. J. Cell Biol. 179:1043–1057. http://dx.doi.org/10.1083/jcb.200703036
Jacob, M., and M. Unser. 2004. Design of steerable filters for feature detec-tion using canny-like criteria. IEEE Trans. Pattern Anal. Mach. Intell. 26:1007–1019. http://dx.doi.org/10.1109/TPAMI.2004.44
Jaqaman, K., D. Loerke, M. Mettlen, H. Kuwata, S. Grinstein, S.L. Schmid, and G. Danuser. 2008. Robust single-particle tracking in live-cell time-lapse sequences. Nat. Methods. 5:695–702. http://dx.doi.org/10.1038/ nmeth.1237
Kanchanawong, P., G. Shtengel, A.M. Pasapera, E.B. Ramko, M.W. Davidson, H.F. Hess, and C.M. Waterman. 2010. Nanoscale architecture of integrin-based cell adhesions. Nature. 468:580–584. http://dx.doi.org/10.1038/ nature09621
Kuo, J.C., X. Han, C.T. Hsiao, J.R. Yates III, and C.M. Waterman. 2011. Analysis of the myosin-II-responsive focal adhesion proteome reveals a role for -Pix in negative regulation of focal adhesion maturation. Nat. Cell Biol. 13:383–393. http://dx.doi.org/10.1038/ncb2216
Lai, F.P., M. Szczodrak, J. Block, J. Faix, D. Breitsprecher, H.G. Mannherz, T.E. Stradal, G.A. Dunn, J.V. Small, and K. Rottner. 2008. Arp2/3 com-plex interactions and actin network turnover in lamellipodia. EMBO J. 27:982–992. http://dx.doi.org/10.1038/emboj.2008.34
Lin, C.H., and P. Forscher. 1995. Growth cone advance is inversely propor-tional to retrograde F-actin flow. Neuron. 14:763–771. http://dx.doi .org/10.1016/0896-6273(95)90220-1
Mierke, C.T., P. Kollmannsberger, D.P. Zitterbart, G. Diez, T.M. Koch, S. Marg, W.H. Ziegler, W.H. Goldmann, and B. Fabry. 2010. Vinculin facilitates cell invasion into three-dimensional collagen matrices. J. Biol. Chem. 285:13121–13130. http://dx.doi.org/10.1074/jbc.M109.087171
Oakes, P.W., Y. Beckham, J. Stricker, and M.L. Gardel. 2012. Tension is re-quired but not sufficient for focal adhesion maturation without a stress fiber template. J. Cell Biol. 196:363–374. http://dx.doi.org/10.1083/ jcb.201107042
(0.05 if not mentioned). Large samples gathered from automated measure-ments (Fig. 1 E) were subsampled by selecting 1,000 data points.
Online supplemental materialVideo 1 shows the morphology of live control and Vcl-KO MEF. Video 2 shows the random migration of control and Vcl-KO MEF. Video 3 shows F-actin dynamics in control and Vcl-KO MEF. Video 4 is an overlay of F-actin flow and FA in control and Vcl-KO MEF. Video 5 shows F-actin dynamics in Vcl-KO MEF expressing EGFP-WT or -PA vinculin. Video 6 shows F-actin dynamics in Vcl-KO MEF expressing EGFP-AB or EGFP-PA-AB vinculin. Video 7 shows nascent FA dynamics in control and Vcl-KO MEF. Video 8 shows FA maturation in control and Vcl-KO MEF. Video 9 shows nascent FA dynamics in Vcl-KO MEF expressing EGFP-WT or -PA vinculin. Video 10 shows nascent FA dynamics in Vcl-KO MEF expressing EGFP-AB or EGFP-PA-AB vinculin. Fig. S1 shows the generation and basic characterization of primary vinculin-deficient MEF from Vclfl/fl mice. Fig. S2 shows detection and tracking of local intensity maxima of nascent and maturing FA on SDC time-lapse sequences of EGFP-paxillin expressing MEF. Fig. S3 shows that loss of vinculin differently affects small peripheral FA and mature FA. Fig. S4 shows that reexpression of full-length vinculin restores nascent FA and normal FA organization in Vcl-KO MEF. Fig. S5 shows colocalization of EGFP-vinculin mutants with mApple-paxillin in nascent FA and comparable FA growth rates measured by FA labeling with mApple-paxillin and EGFP-vinculin mutants. The computational source code for FA detection and tracking algorithm with instructions is also included. Online supplemental material is available at http://www.jcb.org/cgi/content/full/jcb.201303129/DC1.
We thank the National Heart, Lung and Blood Institute (NHLBI) Flow Cytometry Core Facility, William Shin for microscopy expertise, Ben Fabry for helpful dis-cussion and access to microscopy at Friedrich-Alexander-University, Erlangen, Caitlin Tolbert for help with immunofluorescence, Gerold Diez for Vh expres-sion construct, Silvio Gutkind for adenovirus, Mary Beckerle for anti-zyxin anti-body, and Waterman laboratory members and Silvia Vergarajauregui for helpful discussion.
This work was supported by NHLBI Division of Intramural Research (C.M. Waterman, I. Thievessen, and S.V. Plotnikov), NHLBI grant PO1 HL 46345, project 3 (R.S. Ross and A. Zemljic-Harpf), National Institutes of Health grant T32GM008570 (K.M. Plevock and P.M. Thompson), National Institute of General Medical Sciences (NIGMS) grant RO1GM080568 (S.L. Campbell) and NIGMS grant U01 GM067230 (G. Danuser and S. Berlemont).
Submitted: 25 March 2013Accepted: 3 June 2013
ReferencesAlexandrova, A.Y., K. Arnold, S. Schaub, J.M. Vasiliev, J.J. Meister, A.D.
Bershadsky, and A.B. Verkhovsky. 2008. Comparative dynamics of ret-rograde actin flow and focal adhesions: formation of nascent adhesions triggers transition from fast to slow flow. PLoS ONE. 3:e3234. http://dx.doi.org/10.1371/journal.pone.0003234
Bakolitsa, C., D.M. Cohen, L.A. Bankston, A.A. Bobkov, G.W. Cadwell, L. Jennings, D.R. Critchley, S.W. Craig, and R.C. Liddington. 2004. Structural basis for vinculin activation at sites of cell adhesion. Nature. 430:583–586. http://dx.doi.org/10.1038/nature02610
Balaban, N.Q., U.S. Schwarz, D. Riveline, P. Goichberg, G. Tzur, I. Sabanay, D. Mahalu, S. Safran, A. Bershadsky, L. Addadi, and B. Geiger. 2001. Force and focal adhesion assembly: a close relationship studied using elastic micropatterned substrates. Nat. Cell Biol. 3:466–472. http://dx.doi .org/10.1038/35074532
Bourdet-Sicard, R., M. Rüdiger, B.M. Jockusch, P. Gounon, P.J. Sansonetti, and G.T. Nhieu. 1999. Binding of the Shigella protein IpaA to vinculin in-duces F-actin depolymerization. EMBO J. 18:5853–5862. http://dx.doi .org/10.1093/emboj/18.21.5853
Brindle, N.P., M.R. Holt, J.E. Davies, C.J. Price, and D.R. Critchley. 1996. The focal-adhesion vasodilator-stimulated phosphoprotein (VASP) binds to the proline-rich domain in vinculin. Biochem. J. 318:753–757.
Carisey, A., and C. Ballestrem. 2011. Vinculin, an adapter protein in control of cell adhesion signalling. Eur. J. Cell Biol. 90:157–163. http://dx.doi .org/10.1016/j.ejcb.2010.06.007
Carisey, A., R. Tsang, A.M. Greiner, N. Nijenhuis, N. Heath, A. Nazgiewicz, R. Kemkemer, B. Derby, J. Spatz, and C. Ballestrem. 2013. Vinculin regu-lates the recruitment and release of core focal adhesion proteins in a force-dependent manner. Curr. Biol. 23:271–281. http://dx.doi.org/ 10.1016/j.cub.2013.01.009
177Vinculin–actin interaction regulates actin and adhesion dynamics. • Thievessen et al.
Ponti, A., M. Machacek, S.L. Gupton, C.M. Waterman-Storer, and G. Danuser. 2004. Two distinct actin networks drive the protrusion of migrating cells. Science. 305:1782–1786. http://dx.doi.org/10.1126/science.1100533
Renkawitz, J., K. Schumann, M. Weber, T. Lämmermann, H. Pflicke, M. Piel, J. Polleux, J.P. Spatz, and M. Sixt. 2009. Adaptive force transmission in amoeboid cell migration. Nat. Cell Biol. 11:1438–1443. http://dx.doi .org/10.1038/ncb1992
Sabass, B., M.L. Gardel, C.M. Waterman, and U.S. Schwarz. 2008. High resolu-tion traction force microscopy based on experimental and computational advances. Biophys. J. 94:207–220. http://dx.doi.org/10.1529/biophysj .107.113670
Saunders, R.M., M.R. Holt, L. Jennings, D.H. Sutton, I.L. Barsukov, A. Bobkov, R.C. Liddington, E.A. Adamson, G.A. Dunn, and D.R. Critchley. 2006. Role of vinculin in regulating focal adhesion turnover. Eur. J. Cell Biol. 85:487–500. http://dx.doi.org/10.1016/j.ejcb.2006.01.014
Schiller, H.B., C.C. Friedel, C. Boulegue, and R. Fässler. 2011. Quantitative proteomics of the integrin adhesome show a myosin II-dependent recruit-ment of LIM domain proteins. EMBO Rep. 12:259–266. http://dx.doi .org/10.1038/embor.2011.5
Shemesh, T., A.B. Verkhovsky, T.M. Svitkina, A.D. Bershadsky, and M.M. Kozlov. 2009. Role of focal adhesions and mechanical stresses in the formation and progression of the lamellipodium-lamellum interface [corrected]. Biophys. J. 97:1254–1264. (published erratum appears in Biophys. J. 2009. 97:2115). http://dx.doi.org/10.1016/j.bpj.2009.05.065
Shen, K., C.E. Tolbert, C. Guilluy, V.S. Swaminathan, M.E. Berginski, K. Burridge, R. Superfine, and S.L. Campbell. 2011. The vinculin C-terminal hairpin mediates F-actin bundle formation, focal adhesion, and cell mechanical properties. J. Biol. Chem. 286:45103–45115. http://dx.doi .org/10.1074/jbc.M111.244293
Shin, W., R.S. Fischer, P. Kanchanawong, Y. Kim, J. Lim, K.A. Meyers, Y. Nishimura, S.V. Plotnikov, I. Thievessen, D. Yarar, et al. 2010. A ver-satile, multi-color total internal reflection fluorescence and spinning disk confocal microscope system for high-resolution live cell imaging. In Live Cell Imaging: A Laboratory Manual. R.D. Goldman, J.R. Swedlow, and D.L. Spector, eds. Cold Spring Harbor Laboratory Press, Cold Spring Harbor, NY. 119–138.
Turner, C.E., J.R. Glenney Jr., and K. Burridge. 1990. Paxillin: a new vinculin-binding protein present in focal adhesions. J. Cell Biol. 111:1059–1068. http://dx.doi.org/10.1083/jcb.111.3.1059
Volberg, T., B. Geiger, Z. Kam, R. Pankov, I. Simcha, H. Sabanay, J.L. Coll, E. Adamson, and A. Ben-Ze’ev. 1995. Focal adhesion formation by F9 embryonal carcinoma cells after vinculin gene disruption. J. Cell Sci. 108:2253–2260.
Wu, H., and J.T. Parsons. 1993. Cortactin, an 80/85-kilodalton pp60src substrate, is a filamentous actin-binding protein enriched in the cell cortex. J. Cell Biol. 120:1417–1426. http://dx.doi.org/10.1083/jcb.120.6.1417
Xu, W., H. Baribault, and E.D. Adamson. 1998a. Vinculin knockout results in heart and brain defects during embryonic development. Development. 125:327–337.
Xu, W., J.L. Coll, and E.D. Adamson. 1998b. Rescue of the mutant phenotype by reexpression of full-length vinculin in null F9 cells; effects on cell locomotion by domain deleted vinculin. J. Cell Sci. 111:1535–1544.
Zemljic-Harpf, A.E., J.C. Miller, S.A. Henderson, A.T. Wright, A.M. Manso, L. Elsherif, N.D. Dalton, A.K. Thor, G.A. Perkins, A.D. McCulloch, and R.S. Ross. 2007. Cardiac-myocyte-specific excision of the vinculin gene dis-rupts cellular junctions, causing sudden death or dilated cardiomyopathy. Mol. Cell. Biol. 27:7522–7537. http://dx.doi.org/10.1128/MCB.00728-07
Zhang, X., G. Jiang, Y. Cai, S.J. Monkley, D.R. Critchley, and M.P. Sheetz. 2008. Talin depletion reveals independence of initial cell spreading from integrin activation and traction. Nat. Cell Biol. 10:1062–1068. http://dx.doi.org/10.1038/ncb1765