Embed Size (px)
Citation preview

VimpelCom
Presentation of 2Q 2007Financial and Operating Results
August 30, 2007

2
Disclaimer
This presentation contains "forward-looking statements", as the phrase is defined in Section 27A of the Securities Act of 1933 and Section 21E of the Securities Exchange Act of 1934. These statements relate, in part, to the Company’s strategy and development plans in Russia and the CIS, development of the Company’s 3G network in Russia and the outcome of 2G license tenders in the Far East Region of Russia. The forward-looking statements are based on management's best assessment of the Company's strategic and financial position, and future market conditions and trends. These discussions involve risks and uncertainties. The actual outcome may differ materially from these statements as a result of risks and uncertainties relating to developments from competition, governmental regulations of the wireless telecommunications industry, general political uncertainties in Russia and the CIS, general economic developments in Russia and the CIS, challenges to 3G and Far East tenders, and/or litigation with third parties or our shareholders (including Telenor). The actual outcome may also differ materially if the Company is unable to obtain all necessary corporate approvals relating to its business (including approval of funding, specific transactions and payment of dividends), and other factors. There can be no assurance that these risks and uncertainties will not have a material adverse effect on the Company, that the Company will be able to grow or that it will be successful in executing its strategy and development plans. Certain factors that could cause actual results to differ materially from those discussed in any forward-looking statements include the risks described in the Company's Annual Report on Form 20-F for the year ended December 31, 2006 and other public filings made by the Company with the United States Securities and Exchange Commission, which risk factors are incorporated herein by reference. The Company disclaims any obligation to update developments of these risk factors or to announce publicly any revision to any of the forward-looking statements contained in this release, or to make corrections to reflect future events or developments.

3
Agenda
Welcome Remarks
Alexander Izosimov, CEO
Financial Overview
Elena Shmatova, CFO
Operational Overview
Alexander Izosimov, CEO
Q&A Session will be joined by:
Nikolay Pryanishnikov, Executive VP, General Director, Russia
Kent McNeley, CMO

4
Quarterly Financial Dynamics
Net Revenues, $ mln Net Income, $ mln
OIBDA, $ mln OIBDA Margin
+53.1%
9361,122
1,359 1,4511,488 1,717
1Q 06 2Q 06 3Q 06 4Q 06 1Q 07 2Q 07
+84.3%
359
277198268
195150
1Q 06 2Q 06 3Q 06 4Q 06 1Q 07 2Q 07
+59.7%
897
766
690718
562483
1Q 06 2Q 06 3Q 06 4Q 06 1Q 07 2Q 07
51.6% 50.1% 52.8% 47.5% 51.5%
52.2%
1Q 06 2Q 06 3Q 06 4Q 06 1Q 07 2Q 07

5
Continuing Increase of Operating Cash Flow
804
2,531
1,971
1,293
-1,512-1,553-1,635
-1,242
-438 -342
978
459
2004 2005 2006 2Q 07LTM
Operating Cash Flow, $ mln CAPEX, $ mln Free cash-flow before acquisitions
6
Strong Balance Sheet
* In cases when OIBDA is part of financial ratios it is deemed to be calculated in accordance with the reconciliation tables herein
13.2
16.2
10.7
0.60.60.7
1.0
1.3
0.8
0 . 0
6 . 0
1 2 . 0
1 8 . 0
Dec 31, '05 Dec 31, '06 J un 30, '07
- 0 . 4
- 0 . 2
0 . 0
0 . 2
0 . 4
0 . 6
0 . 8
1 . 0
1 . 2
1 . 4
OIBDA LTM/Interest LTM Debt/Equity Debt/OIBDA LTM
($ mln) Jun 30,'07 Dec 31,'06 Dec 31,'05
Cash and Cash Equivalents 951 344 364
Total Assets 9,211 8,437 6,307
Total Debt 2,598 2,489 1,998
-Short-term 427 424 421
-Long-term 2,171 2,065 1,577
Shareholders' Equity 4,312 3,943 2,741
LTM OIBDA* 3,071 2,452 1,571 - LTM Depreciation and amortization 1,266 1,055 593
- LTM Operating Income 1,805 1,397 978
LTM Interest 189 186 147
Debt/Assets 0.3 0.3 0.3
Net Debt 1,647 2,145 1,634

7
Operating Highlights: Russia
MOU, minARPU, US$
Active Subscriber Base, mln Subscriber Market Share*
*) Source: AC&M Consulting
37.4 38.2 38.8 38.6
40.139.8
1Q 06 2Q 06 3Q 06 4Q 06 1Q 07 2Q 07
7.8
9.0
10.610.9 10.9
12.3
1Q 06 2Q 06 3Q 06 4Q 06 1Q 07 2Q 07
132141
152158 161
193
1Q 06 2Q 06 3Q 06 4Q 06 1Q 07 2Q 07
31% 31%32%32%33%34%
35% 34% 34% 34% 33% 33%
20% 20%19%19%19%18%
16% 16%15%14%13% 15%
1Q 06 2Q 06 3Q 06 4Q 06 1Q 07 2Q 07VimpelCom MTS MegaFon Others
8
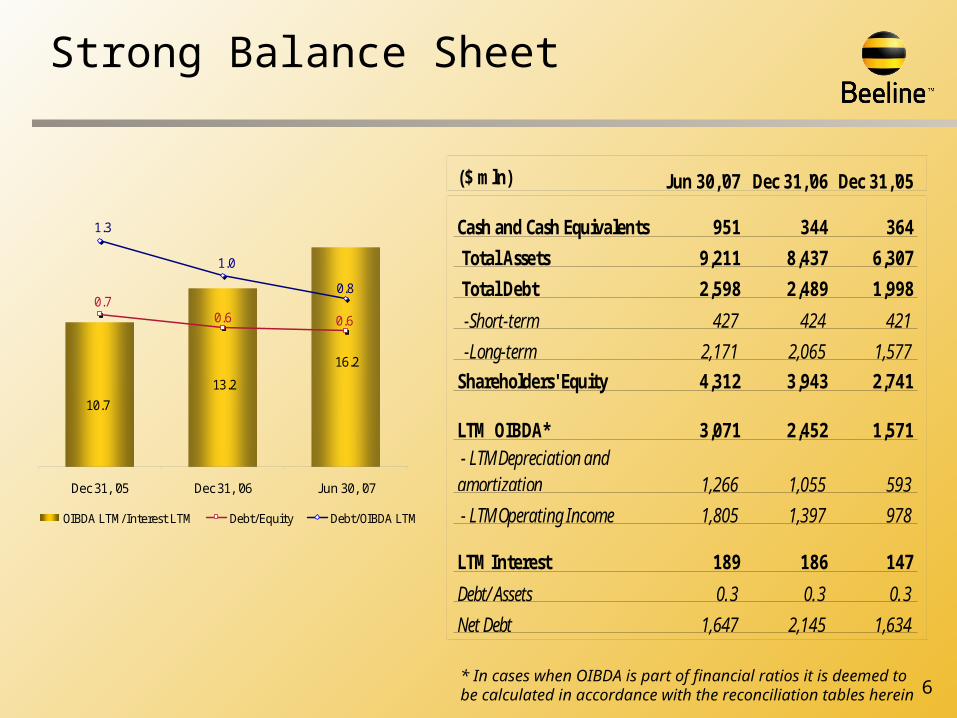
Financial Highlights: Russia
Net Revenues, $ mln OIBDA, $ mln
CAPEX, $ mln CAPEX / Revenue, LTM
+43.0%
1,459
1,2781,2811,228
1,021871
1Q 06 2Q 06 3Q 06 4Q 06 1Q 07 2Q 07
+47.2%
780
677645666
530462
1Q 06 2Q 06 3Q 06 4Q 06 1Q 07 2Q 07
189200
380
226
297
146
1Q 06 2Q 06 3Q 06 4Q 06 1Q 07 2Q 07
19.0%22.9%23.9%
32.5%36.1%
41.6%
1Q 06 2Q 06 3Q 06 4Q 06 1Q 07 2Q 07
9
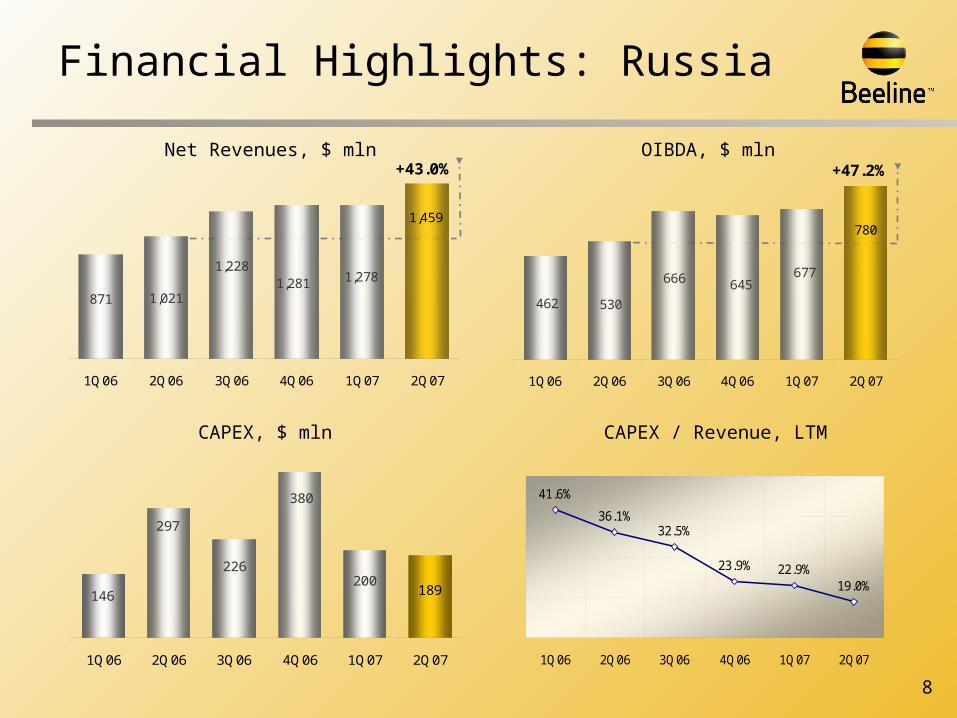
Status of 3G Development in Russia
License awarded
Commercial operations
Q2
Equipment certification
Equipment tender initiated
20072007 20082008
Q3 Q4 Q1 Q2 Q3 Q4
Tender
completed
Network construction begins
Trial operations
Q1
10
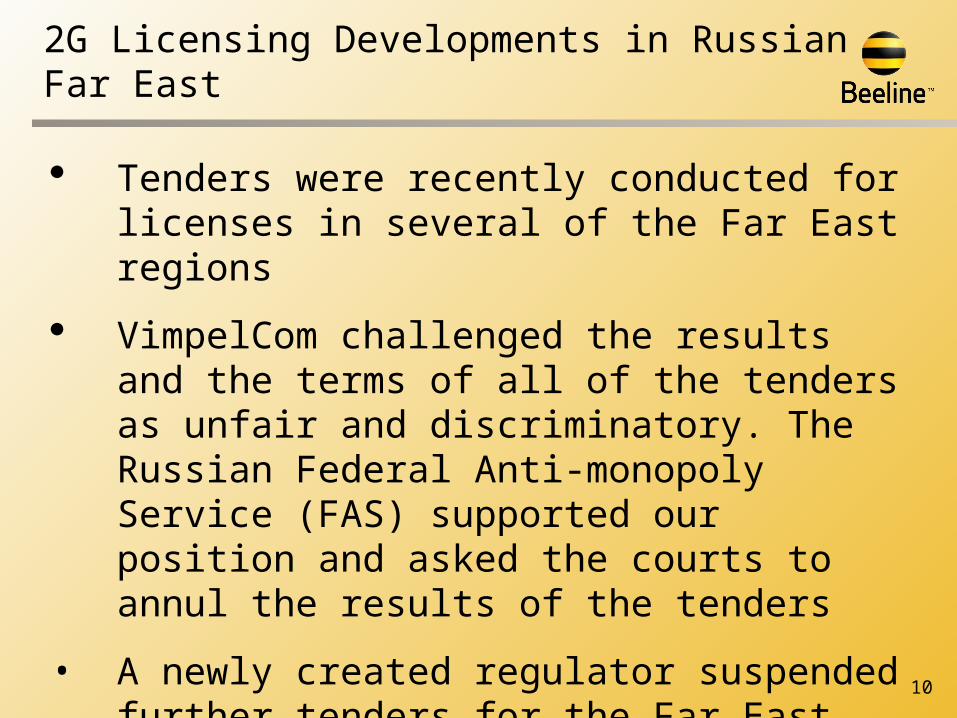
2G Licensing Developments in Russian Far East
Tenders were recently conducted for licenses in several of the Far East regions
VimpelCom challenged the results and the terms of all of the tenders as unfair and discriminatory. The Russian Federal Anti-monopoly Service (FAS) supported our position and asked the courts to annul the results of the tenders
• A newly created regulator suspended further tenders for the Far East licenses while reviewing their terms and conditions. New tenders are expected to take place in mid-October
11
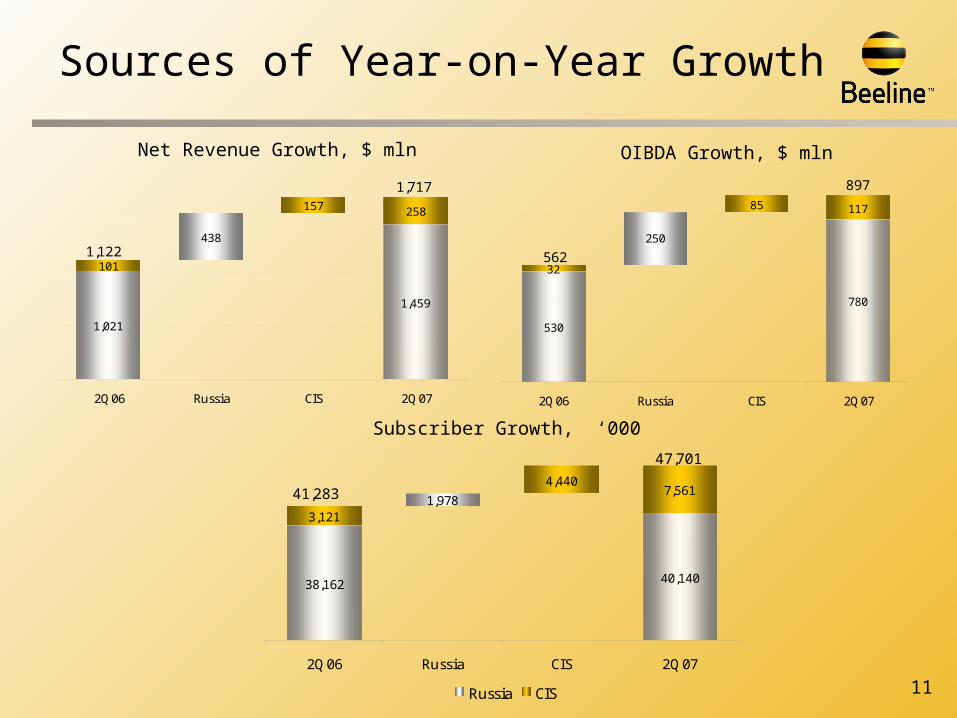
Sources of Year-on-Year Growth
Net Revenue Growth, $ mln OIBDA Growth, $ mln
Subscriber Growth, ‘000
1,717
1,122
1,459
101
157 258
1,021
438
2Q 06 Russia CIS 2Q 07
897
562
530
32
85 117
250
780
2Q 06 Russia CIS 2Q 07
47,701
41,283
38,162
3,121
7,5611,978
40,140
4,440
2Q 06 Russia CIS 2Q 07
Russia CIS

12
Operating Highlights: Kazakhstan
ARPU, US$ MOU, min
Active Subscriber Base, mln Subscriber Market Share*
2.63.1
3.5
2.1 2.2
3.9
1Q 06 2Q 06 3Q 06 4Q 06 1Q 07 2Q 07
8.8
12.614.4 13.8
12.213.6
1Q06 2Q06 3Q 06 4Q 06 1Q 07 2Q 07
45
66
8878
89
72
1Q 06 2Q 06 3Q 06 4Q 06 1Q 07 2Q 07
*) Source: AC&M Consulting
41% 44% 47%
55% 51% 48%
4% 5% 5% 5%
50% 49%49%
45% 46%46%
5%5%
1Q 06 2Q 06 3Q 06 4Q 06 1Q 07 2Q 07
VIP K'Cell Others

13
Financial Highlights: Kazakhstan
Net Revenues, $ mln OIBDA, $ mln
CAPEX, $ mln
CAPEX / Revenue, LTM
+85.5%
149
11911210480
54
1Q 06 2Q 06 3Q 06 4Q 06 1Q 07 2Q 07
+136.9%
2234
4936
6280
1Q 06 2Q 06 3Q 06 4Q 06 1Q 07 2Q 07
4631
4955
37
36
1Q 06 2Q 06 3Q 06 4Q 06 1Q 07 2Q 07
80.9%
69.3%64.2%
50.2%
41.2%37.3%
1Q 06 2Q 06 3Q 06 4Q 06 1Q 07 2Q 07

14
Operating and Financial Highlights: Ukraine
Active Subscriber Base, mln
ARPU (US$) and MOU (min)
4.23.4
5.96.7
4.2
3.0
160138149
168172
61
0
2
4
6
8
1Q 06 2Q 06 3Q 06 4Q 06 1Q 07 2Q 07
ARPU
($)
0
50
100
150
200M
OU
(m
in)
ARPU active base MOU active base
46
29
56
78
55
13
1Q 06 2Q 06 3Q 06 4Q 06 1Q 07 2Q 07
CAPEX, $ mln
Net Revenues, $ mln
+291.4%
22.7
15.714.3
11.5
5.82.1
1Q 06 2Q 06 3Q 06 4Q 06 1Q 07 2Q 07
0.10.5
0.8
1.5
1.82.0
1Q 06 2Q 06 3Q 06 4Q 06 1Q 07 2Q 07

15
Operating and Financial Highlights: Uzbekistan
Active Subscriber Base, mln
Net Revenues, $ mln
ARPU (US$) and MOU (min) CAPEX, $ mln
6.7
9.811.8
12.7
16.6
7.2
454
349305
269242
266
4
8
12
16
20
1Q 06 2Q 06 3Q 06 4Q 06 1Q 07 2Q 07
ARPU
($)
100
200
300
400
500M
OU
(m
in)
ARPU active base MOU active base
19
8
20
15
10
0
1Q 06 2Q 06 3Q 06 4Q 06 1Q 07 2Q 07
+54.0%
23.118.015.815.7
15.08.9
1Q 06 2Q 06 3Q 06 4Q 06 1Q 07 2Q 07
0.4 0.4 0.50.7
1.2
1.1
1Q 06 2Q 06 3Q 06 4Q 06 1Q 07 2Q 07

16
Operating and Financial Highlights: Armenia
* The 4Q 2006 data represent the results of operations for 1.5 months since the date of acquisition by VimpelCom
Net Revenues, $ mln
ARPU, US$ CAPEX, $ mln
19.8
16.9
34.235.210.5
23.1
4Q 06* 1Q 07 2Q 07
Fixed revenue Mobile revenue
17.0
14.5
17.3
19.318.8
18.5
4Q 06* 1Q 07 2Q 07
Mobile ARPU active base Fixed ARPU
20
59
4Q 06* 1Q 07 2Q 07
Active Subscriber Base, mln
0.6 0.6
0.4 0.4
0.6
0.5
4Q 06* 1Q 07 2Q 07
Fixed subscribers Mobile active subscribers
17
Operating and Financial Highlights: Georgia and Tajikistan
Georgia
• Operations launched at the end of Q1 and are still in a start-up phase
• Focus on roll-out and distribution network development
Tajikistan
• Sequential rapid growth continues:
81% revenue growth
41% increase in active subscribers
• OIBDA turned positive in Q2
• Market share increased from 11.2% to 15.2%
18
Summary
• Strong quarter-on-quarter and year-on-year growth of financial and operating results in all markets
• Overall business in Russia is continuing to grow and gain efficiency
• CIS becoming an increasingly important source of new subscribers, demonstrating impressive revenue growth and improvements in OIBDA margins

19
Questions and Answers
If you would like to ask a question, please press the star key followed by the digit one on your touch-tone telephone.
Due to time constraints, we ask that you limit yourselves to one question and one follow-up question.
If you are using a speakerphone, please make sure your mute button is turned off to allow your signal to reach the equipment.
----------Thank you for your interest in VimpelCom
For more information please visit www.vimpelcom.com or contact [email protected]

APPENDICES
21
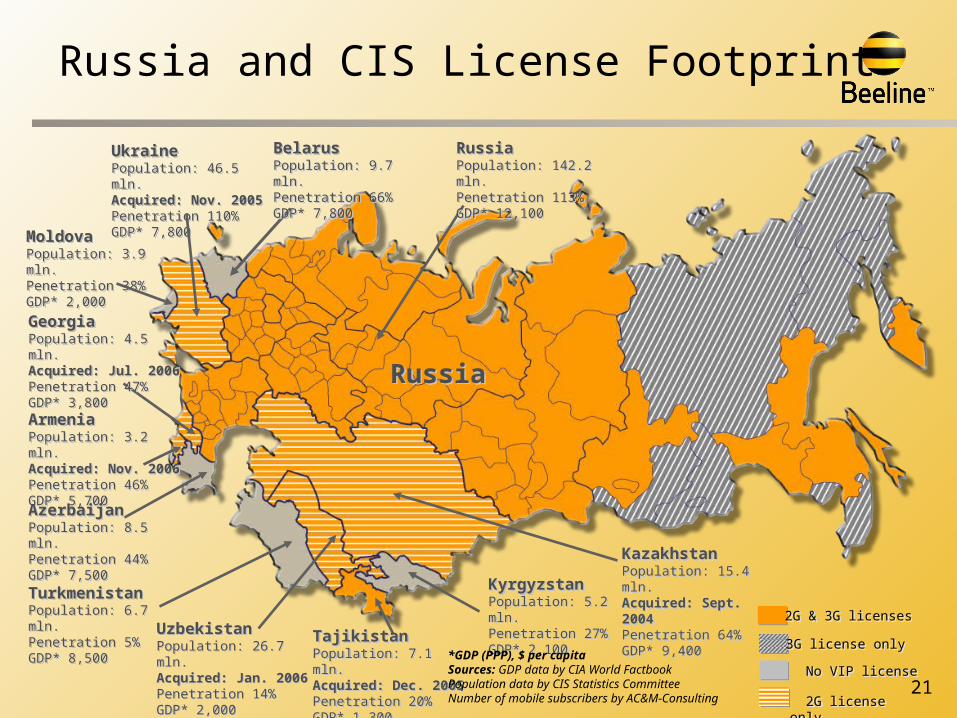
MoldovaPopulation: 3.9 mln.Penetration 38%GDP* 2,000
MoldovaPopulation: 3.9 mln.Penetration 38%GDP* 2,000
ArmeniaPopulation: 3.2 mln.Acquired: Nov. 2006Penetration 46%GDP* 5,700
ArmeniaPopulation: 3.2 mln.Acquired: Nov. 2006Penetration 46%GDP* 5,700
Russia and CIS License Footprint
2G & 3G licenses 2G & 3G licenses
No VIP license No VIP license
UkrainePopulation: 46.5 mln.Acquired: Nov. 2005Penetration 110%GDP* 7,800
UkrainePopulation: 46.5 mln.Acquired: Nov. 2005Penetration 110%GDP* 7,800
GeorgiaPopulation: 4.5 mln.Acquired: Jul. 2006Penetration 47%GDP* 3,800
GeorgiaPopulation: 4.5 mln.Acquired: Jul. 2006Penetration 47%GDP* 3,800
AzerbaijanPopulation: 8.5 mln.Penetration 44%GDP* 7,500
AzerbaijanPopulation: 8.5 mln.Penetration 44%GDP* 7,500
TurkmenistanPopulation: 6.7 mln.Penetration 5%GDP* 8,500
TurkmenistanPopulation: 6.7 mln.Penetration 5%GDP* 8,500
UzbekistanPopulation: 26.7 mln.Acquired: Jan. 2006Penetration 14%GDP* 2,000
UzbekistanPopulation: 26.7 mln.Acquired: Jan. 2006Penetration 14%GDP* 2,000
TajikistanPopulation: 7.1 mln.Acquired: Dec. 2005Penetration 20%GDP* 1,300
TajikistanPopulation: 7.1 mln.Acquired: Dec. 2005Penetration 20%GDP* 1,300
KyrgyzstanPopulation: 5.2 mln.Penetration 27%GDP* 2,100
KyrgyzstanPopulation: 5.2 mln.Penetration 27%GDP* 2,100
KazakhstanPopulation: 15.4 mln.Acquired: Sept. 2004Penetration 64%GDP* 9,400
KazakhstanPopulation: 15.4 mln.Acquired: Sept. 2004Penetration 64%GDP* 9,400
*GDP (PPP), $ per capitaSources: GDP data by CIA World FactbookPopulation data by CIS Statistics CommitteeNumber of mobile subscribers by AC&M-Consulting
BelarusPopulation: 9.7 mln.Penetration 66%GDP* 7,800
BelarusPopulation: 9.7 mln.Penetration 66%GDP* 7,800
RussiaPopulation: 142.2 mln.Penetration 113%GDP* 12,100
RussiaPopulation: 142.2 mln.Penetration 113%GDP* 12,100
RussiaRussia
2G license only 2G license only
3G license only 3G license only
Reconciliation Tables of non-U.S. GAAP Measures to Their Most Directly Comparable U.S. GAAP Financial
Measures
23
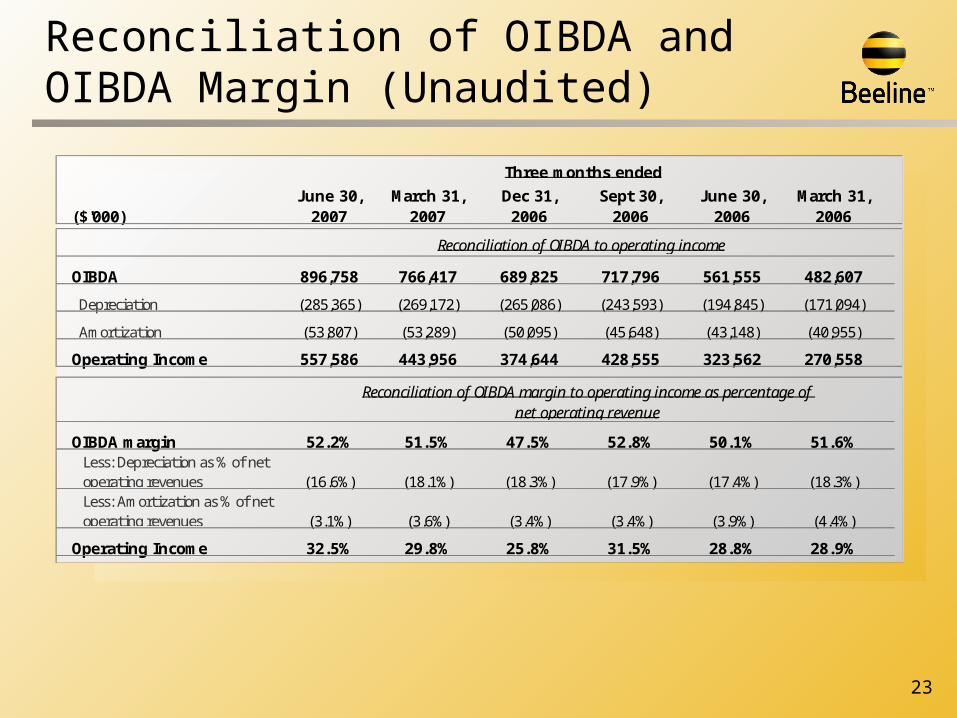
Reconciliation of OIBDA and OIBDA Margin (Unaudited)
($'000)June 30,
2007March 31,
2007Dec 31, 2006
Sept 30, 2006
June 30, 2006
March 31, 2006
OIBDA 896,758 766,417 689,825 717,796 561,555 482,607
Depreciation (285,365) (269,172) (265,086) (243,593) (194,845) (171,094)
Amortization (53,807) (53,289) (50,095) (45,648) (43,148) (40,955)
Operating Income 557,586 443,956 374,644 428,555 323,562 270,558
OIBDA margin 52.2% 51.5% 47.5% 52.8% 50.1% 51.6%Less: Depreciation as % of net operating revenues (16.6%) (18.1%) (18.3%) (17.9%) (17.4%) (18.3%)Less: Amortization as % of net operating revenues (3.1%) (3.6%) (3.4%) (3.4%) (3.9%) (4.4%)
Operating Income 32.5% 29.8% 25.8% 31.5% 28.8% 28.9%
Reconciliation of OIBDA margin to operating income as percentage of net operating revenue
Reconciliation of OIBDA to operating income
Three months ended

24
Reconciliation of OIBDA and ARPU in Russia (Unaudited)
($'000)June 30,
2007March 31,
2007Dec 31,2006
Sept 30, 2006
June 30, 2006
March 31, 2006
OIBDA 779,828 676,476 645,144 666,354 529,704 462,337
Depreciation (240,387) (232,681) (229,544) (221,973) (182,684) (161,936)
Amortization (28,478) (28,536) (27,091) (26,429) (25,657) (24,977)
Operating Income 510,963 415,259 388,509 417,952 321,363 275,424
Service revenue and connection fees 1,457,896 1,276,754 1,276,276 1,223,681 1,014,810 864,767
Less: Connection fees 164 169 308 410 622 404Less: Revenue from rent of fiber-optic channels 983 964 433 760 325 328
Service revenue used to calculate ARPU 1,456,749 1,275,621 1,275,535 1,222,511 1,013,863 864,035Average number of active subscribers ('000) 39,359 39,021 39,102 38,365 37,733 36,784ARPU (US$) 12.3 10.9 10.9 10.6 9.0 7.8
Reconciliation of OIBDA to operating income
Reconciliation of ARPU to service revenue and connection fees
Three months ended

25
Reconciliation of OIBDA and ARPU in Kazakhstan (Unaudited)
($'000)June 30,
2007March 31,
2007Dec 31,2006
Sept 30, 2006
June 30, 2006
March 31, 2006
OIBDA 80,317 62,007 35,744 49,023 33,908 21,907
Depreciation (17,537) (15,817) (21,142) (17,981) (9,363) (7,672)
Amortization (9,419) (9,154) (9,134) (9,550) (9,324) (8,785)
Operating Income 53,361 37,036 5,468 21,492 15,221 5,450
Service revenue and connection fees 149,326 119,399 112,963 104,208 80,301 54,382
Less: Connection fees 0 0 0 0 0 0Less: Revenue from rent of fiber-optic channels 0 0 0 0 0 0
Service revenue used to calculate ARPU 149,326 119,399 112,963 104,208 80,301 54,382Average number of active subscribers ('000) 3,655 3,271 2,728 2,412 2,120 2,070
ARPU (US$) 13.6 12.2 13.8 14.4 12.6 8.8
Reconciliation of OIBDA to operating income
Reconciliation of ARPU to service revenue and connection fees
Three months ended

26
Reconciliation of ARPU in Ukraine and Uzbekistan (Unaudited)
($'000)June 30,
2007March 31,
2007Dec 31,2006
Sept 30, 2006
June 30, 2006
March 31, 2006
UKRAINEService revenue and connection fees 23,436 16,158 14,652 12,320 5,948 2,103
Less: Connection fees 36 5 5 3 0 0Less: Revenue from rent of fiber-optic channels 0 0 0 0 0 0
Service revenue used to calculate ARPU 23,400 16,153 14,647 12,317 5,948 2,103Average number of active subscribers ('000) 1,847 1,781 1,170 611 338 208
ARPU (US$) 4.2 3.0 4.2 6.7 5.9 3.4
UZBEKISTANService revenue and connection fees 24,009 18,778 16,446 16,279 15,507 9,207
Less: Connection fees 0 0 0 0 0 0Less: Revenue from rent of fiber-optic channels 0 0 0 0 0 0
Service revenue used to calculate ARPU 24,009 18,778 16,446 16,279 15,507 9,207Average number of active subscribers ('000) 1,109 930 558 458 406 185
ARPU (US$) 7.2 6.7 9.8 11.8 12.7 16.6
Reconciliation of ARPU to service revenue and connection fees
Three months ended
27
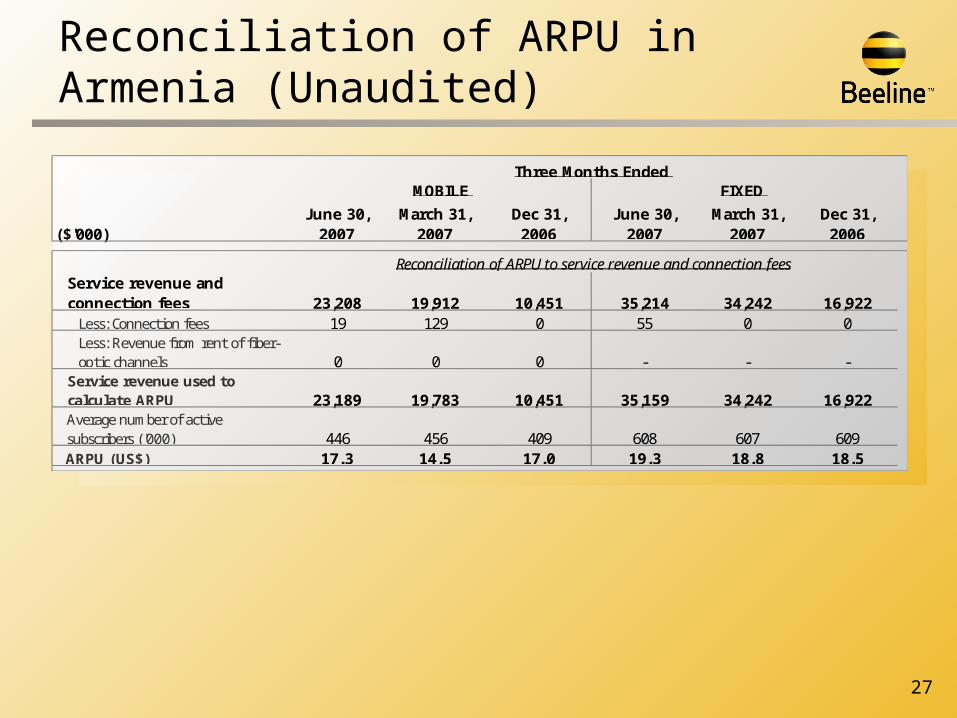
Reconciliation of ARPU in Armenia (Unaudited)
($'000)June 30,
2007March 31,
2007Dec 31, 2006
June 30, 2007
March 31, 2007
Dec 31, 2006
Service revenue and connection fees 23,208 19,912 10,451 35,214 34,242 16,922
Less: Connection fees 19 129 0 55 0 0Less: Revenue from rent of fiber-optic channels 0 0 0 - - -
Service revenue used to calculate ARPU 23,189 19,783 10,451 35,159 34,242 16,922Average number of active subscribers ('000) 446 456 409 608 607 609
ARPU (US$) 17.3 14.5 17.0 19.3 18.8 18.5
Three Months Ended
Reconciliation of ARPU to service revenue and connection fees
MOBILE FIXED

28
Definitions Registered subscriber is an authorized user of cellular services, using one SIM card (GSM/3G) with one or several selective numbers or one handset (DAMPS/CDMA) with one selective number. The number of subscribers includes employees using cellular services and excludes guest roamers and users of test SIM cards or handsets. Active subscribers are those subscribers in the registered subscriber base who were a party to a revenue generating activity in the past three months and remain in the base at the end of the reported period. Such activities include all incoming and outgoing calls, subscriber fee accruals, debits related to service, outgoing SMS, MMS, data transmission and receipt sessions, but do not include incoming SMS and MMS sent by our Company or abandoned calls. ARPU (Monthly Average Revenue per User), a non-U.S. GAAP financial measure, is calculated by dividing the Company’s service revenue during the relevant period, including roaming revenue and interconnect revenue, but excluding revenue from connection fees, sales of handsets and accessories and other non-service revenue, by the average number of the Company’s active subscribers during the period and dividing by the number of months in that period. Reconciliation of ARPU to service revenues and connection fees, the most directly comparable U.S. GAAP financial measure, is presented above in the tables section. The Company believes that ARPU provides useful information to investors because it is an indicator of the performance of the Company’s business operations and assists management in budgeting. The Company also believes that ARPU provides management with useful information concerning usage and acceptance of the Company’s services. ARPU should not be viewed in isolation or an alternative to other figures reported under U.S. GAAP.MOU (Monthly Average Minutes of Use per User) is calculated by dividing the total number of minutes of usage for incoming and outgoing calls during the relevant period (excluding guest roamers) by the average number of active subscribers during the period and dividing by the number of months in that period.Market share of subscribers for each country is calculated by dividing the estimated number of the subscribers of a particular company by the total estimated number of subscribers in that country. Market share data is published by consulting agencies specializing in the telecommunications industry in Russia and the CIS and generally based on registered subscribers. Net debt is calculated as a total interest-bearing debt minus cash and cash equivalentsFree cash flow is calculated as operating cash flow minus capital expenditures before acquisitions