Embed Size (px)
Citation preview

VILLE PURHONEN
ENGAGING BUSINESS USERS TO BUSINESS INTELLIGENCE
COMPETENCY CENTER
Master of Science Thesis
Prof. Tuomo Peltonen has been appointed as the
examiner at the Council Meeting of the Faculty
of Business and Technology Management on
June 16, 2010.

ii
ABSTRACT
TAMPERE UNIVERSITY OF TECHNOLOGY
Master‟s Degree Programme in Industrial Engineering and Management
PURHONEN, VILLE: Engaging Business Users to Business Intelligence Competency
Center
Master of Science Thesis, 69 pages, 2 appendices
August 2010
Major: Industrial management
Examiner: Professor Tuomo Peltonen
Keywords: Business Intelligence Competency Center, Business Intelligence, engaging,
business users, resistance to change
This thesis deals with the engagement of business users to Business Intelligence
Competency Center (BICC). The concept of BICC is still relatively young and it has not
been researched a lot. The benefits and the downsides of BICC presented in the existing
literature are also related to the engagement of business users to this more centralized
Business Intelligence (BI). New centralized BI offers different means and methods but
it also sets up different challenges considering the engagement.
The main objective of this thesis was to find out different means and methods to engage
business users to Business Intelligence Competency Center. The research was
conducted as applied case research on an assignment and it was focused on solving real
practical problems in the case environment. The qualitative research material was based
on the observations and the interviews of two different BI solution development cases.
The analysis of the research material was built on two descriptive narratives and their
categorization and summarization.
The results of this research show that the means and the methods of engaging business
users to BICC are familiar from the existing change management literature. However,
the importance of BI solution‟s superiority was notable compared to other ways of
engagement. Also the timing of introducing superior BI solution did not make any
difference in engagement as opposed to the indications of the existing literature. The
research also indicated that as the maturity of BICC increases the means and methods of
engagement should also change considering increased coverage and standardization,
and the dilution of personal touch. Also conducted research brought out different
challenges considering the engagement of business users to centralized BICC. As a
conclusion, this thesis is able to give managers a good overall understanding of
engaging business users to BICC. They can achieve better engagement with less effort
and consider how the characteristics of their own environment affect on the
engagement. For academics this research works as an opening for further research
related to engaging business users to Business Intelligence Competency Center.
iii
TIIVISTELMÄ
TAMPEREEN TEKNILLINEN YLIOPISTO
Tuotantotalouden koulutusohjelma
PURHONEN, VILLE: Bisneskäyttäjien sitouttaminen liiketoimintatiedon hallinnan
osaamiskeskukseen
Diplomityö, 69 sivua, 2 liitettä
Elokuu 2010
Pääaine: Teollisuustalous
Tarkastaja: professori Tuomo Peltonen
Avainsanat: liiketoimintatiedon hallinnan osaamiskeskus, BICC, liiketoimintatiedon
hallinta, sitouttaminen, bisneskäyttäjät, muutosvastarinta
Tämä työ käsittelee bisneskäyttäjien sitouttamista liiketoimintatiedon hallinnan
osaamiskeskukseen (BICC). Käsitteenä BICC on vielä suhteellisen nuori eikä
aihealuetta ole tutkittu paljoa. BICC:tä käsittelevässä kirjallisuudessa esitetyt hyvät ja
huonot puolet liittyvät myös bisneskäyttäjien sitouttamiseen keskitettyyn
liiketoimintatiedon hallintaan (BI). Uusi, keskitetty liiketoimintatiedon hallinta tarjoaa
erilaisia välineitä ja keinoja, mutta se myös asettaa erilaisia haasteita sitouttamiselle.
Tämän työn päätavoitteena oli löytää erilaisia välineitä ja keinoja, joilla bisneskäyttäjiä
voidaan sitouttaa liiketoimintatiedon hallinnan osaamiskeskukseen. Tutkimus
toteutettiin soveltavana casetutkimuksena toimeksiantona ja se keskittyi todellisten
ongelmien ratkaisemiseen caseympäristössä. Kvalitatiivinen tutkimusaineisto pohjautui
kahteen BI-ratkaisun kehityscaseen liittyviin haastatteluihin ja havaintoihin.
Tutkimusaineiston analyysi rakentui kahden kuvailevan tarinan ja aineiston
kategorisoinnin ja tiivistyksen varaan.
Tutkimuksen tulokset osoittavat että bisneskäyttäjien sitouttamisen välineet ja keinot
ovat tuttuja jo olemassa olevasta muutosjohtamisen kirjallisuudesta. Kuitenkin BI-
ratkaisun ylivertaisuuden merkitys oli huomattavaa verrattuna muihin sitouttamisen
keinoihin. Myös ylivertaisen BI-ratkaisun esittelyn ajoituksella ei havaittu olevan
merkitystä sitouttamisen kannalta toisin kuin olemasa oleva kirjallisuus esittää. Tehty
tutkimus myös osoitti, että BICC:n iän kasvaessa myös sitouttamisen välineet ja keinot
tulisi muuttua huomioiden BICC:n kasvaneen kattavuuden ja standardisoinnin sekä
henkilökohtaisen otteen vähenemisen. Lisäksi tehty tutkimus toi esiin erilaisia haasteita,
jotka liittyvät bisneskäyttäjien sitouttamiseen BICC:hen. Yhteenvetona tämä tutkimus
tarjoaa johtajille kattavan katsauksen loppukäyttäjien sitouttamisesta, jotta he voivat
saavuttaa paremman sitoutumisen vähemmällä vaivalla ja pohtia, kuinka heidän oman
ympäristönsä vaikuttaa loppukäyttäjien sitouttamiseen. Akateemikoille tämä tutkimus
toimii puolestaan päänavauksena tuleville tutkimuksille kyseisestä aiheesta.

iv
PREFACE
Things don‟t go as planned. Before I jumped at the chance of the assignment of this
thesis I was quite sure that my thesis‟ topic would cover management accounting in a
way or another. But no, I found myself in the jungle of change management and
Business Intelligence, themes that I was not earlier familiar with at all.
Despite the leap into the unknown my whole master‟s thesis process could be described
painless and even smooth when I regard it afterwards. I would like to express my
deepest gratitude for this to my supervisor, Ville Koskela, who not only put the
initiative for this research but also had time for my numerous questions during the
whole five-month process. His constant drive helped me to wrap up this thesis faster
than I expected. Thanks belong also for my other colleagues and partners at Metso
Automation who shared their expertise with me.
I would also like to thank the examiner of this thesis, Professor Tuomo Peltonen, for his
time and valuable ideas and comments. Although this thesis was also his very first at
Tampere University of Technology, the guidance was excellent and it did not let me to
take the easiest way out. Last but not least I would like to show my gratitude to my dear
friends and family who have always stood by me whenever I‟ve needed you.
Tampere, 10th of August 2010
Ville Purhonen

v
TABLE OF CONTENTS
ABSTRACT .................................................................................... ii
TIIVISTELMÄ ................................................................................. iii
PREFACE ...................................................................................... iv
TABLE OF CONTENTS .................................................................. v
ABBREVIATIONS AND NOTATION ............................................ viii
1. INTRODUCTION ....................................................................... 1
1.1. Towards centralized Business Intelligence ........................................... 1
1.2. Research problem, objectives and limitations ....................................... 2
1.3. Research methodology ......................................................................... 3
1.4. The structure of the thesis .................................................................... 5
2. CHANGE AND RESISTANCE .................................................. 7
2.1. Change in organizations ....................................................................... 7
2.1.1. Organizational change .............................................................. 7
2.1.2. Change process ....................................................................... 9
2.1.3. Magnitude of the change ........................................................ 11
2.1.4. Pace of the change................................................................. 13
2.2. Organization change resistance ......................................................... 14
2.2.1. Resistance to change ............................................................. 14
2.2.2. Obstacles of engagement and change ................................... 15
2.2.3. Sources of resistance ............................................................. 17
2.2.4. More detailed framework for managing change ..................... 20

vi
2.2.5. Engaging individuals ............................................................... 22
2.3. Dilemmas of change management research ...................................... 24
3. BUSINESS INTELLIGENCE AND BUSINESS INTELLIGENCE
COMPETENCY CENTER ............................................................. 25
3.1. Business Intelligence .......................................................................... 25
3.1.1. Definition ................................................................................ 25
3.1.2. BI components ....................................................................... 26
3.1.3. Strategic, tactical or operational BI? ....................................... 28
3.1.4. Different BI users .................................................................... 30
3.1.5. Towards collaborative BI ........................................................ 32
3.2. Business Intelligence Competency Center ......................................... 33
3.2.1. What is BICC for? ................................................................... 33
3.2.2. BICC organization .................................................................. 36
3.2.3. Benefits of BICC ..................................................................... 37
3.2.4. Downsides and obstacles of centralized BI ............................ 39
3.2.5. BICC implementation as an organizational change ................ 40
4. RESEARCH METHOD AND MATERIAL ................................ 42
4.1. Case method and research material ................................................... 42
4.1.1. Material collection ................................................................... 42
4.1.2. Interviews and observations ................................................... 43
4.1.3. Material analysis ..................................................................... 44
4.2. Case environment .............................................................................. 45
4.2.1. Metso Corporation and Metso Automation ............................. 45
4.2.2. Change from decentralized BI to centralized BICC ................ 47
4.2.3. How BICC is functioning ......................................................... 47

vii
4.2.4. The scope and the business users of case projects ............... 48
4.2.5. Other notable from the case environment .............................. 49
5. RESULTS ............................................................................... 50
5.1. Project narratives ................................................................................ 50
5.1.1. PAS management reporting ................................................... 50
5.1.2. FC management reporting ...................................................... 53
5.1.3. BICC’s effect on engaging business users ............................. 56
5.2. Three-stage approach to BI development projects ............................. 57
5.2.1. Means and methods of engaging ........................................... 57
5.2.2. Challenges of engagement ..................................................... 59
5.3. Discussion .......................................................................................... 60
6. CONCLUSIONS ...................................................................... 63
BIBLIOGRAPHY ........................................................................... 65

viii
ABBREVIATIONS AND NOTATION
BI Business Intelligence
BICC Business Intelligence Competency Center
BRT Metso Automation‟s Business Reporting Team
DW Data Warehouse / data warehousing
EET Metso‟s Energy and Environment Technology segment
ETL Extract, transform, and load. Process of data warehousing.
FC Flow Control, Metso Automation‟s Business Unit
GBI Metso Automation‟s global Enterprise Resource Planning
project
KPI Key Performance Indicator
MA Metso Automation, Metso‟s Business Line
OLAP Online Analytical Processing
PAS Process Automation Systems, Metso Automation‟s
Business Unit

1
1. INTRODUCTION
1.1. Towards centralized Business Intelligence
The importance of knowledge for the companies of today is undeniable. It is generally
acknowledged that knowledge is one of the most important resources of a company (i.e.
Prahalad & Hamel 1990; Kogut & Zander 1992; Quinn 1992; Conner & Prahalad
1996). The long-term and the strategic importance of knowledge are especially
highlighted: According to Prahalad and Hamel (1990) knowledge can be a source of
sustainable competitive advantage. Quinn (1992) as well emphasizes that organizations
and their strategies are more dependent on the development and the deployment of
intellectual resources than physical assets. It seems that high-quality information has
become a recognized asset that today‟s enterprises cannot do without. (Chew et al.
2007.)
Despite the recognized importance of knowledge, many companies have been unable to
exploit massive amounts of surrounding information in a satisfactory level. To handle
this issue, companies have invested a lot in Business Intelligence (BI) implementations
during the last years. (Chew et al. 2007.) In a nutshell, the goal of Business Intelligence
is to get the right information to the right people at the right time to enhance more
effective decision-making (Miller et al. 2006, p 3). Business has become even more
dependent on these solutions and new information systems as competition has tightened
(Feeny & Willcocks 1998). The current trend has been to deploy BI more broadly
across the organization to meet the demand of information (IBM 2009b).
However, in most cases there have been only a little or no coordination at all between
different BI implementations in organizations. This has resulted in shattered and
multiple local solutions. In these cases IT departments have been challenged to manage
and support all new tools and needed capabilities across the organizations. The
economies of scale have not realized and also the data quality has suffered which has
weakened the possibility of utilizing corporate-wide Business Intelligence. Also BI
development projects have been overlapping and there has been very little sharing of
best practices. (IBM 2009b.) According to Hitachi (2009), companies may receive some
benefits from their departmental BI solutions, but there are significant challenges in
making a larger, strategic impact.
There is a clear need for more coherent BI throughout the organizations. In the
beginning of 21st century, Business Intelligence Competency Center (BICC) has been
an answer to this question in many organizations. Miller et al. (2006, p. 9) defines a

2
BICC as “a cross-functional team with a permanent, formal organizational structure”.
The goal of BICC is to support and promote the effective use of Business Intelligence
across an organization (Miller et al. 2006). BICC implementations has been done to
reduce the total costs of ownership and to reach more effective BI implementations.
These goals require more centralized decision-making and standardizations in the field
of BI. (Cognos 2006.) According to researches done, BICC implementations have been
relatively successful and answered to the requirements set on it. Also the number of
BICC implementations has been increasing. (Computerworld 2006; BARC 2008.)
Although Business Intelligence Competency Centers are boosting the outcomes of BI
solutions in organizations, the concept has also its downsides. Increased standardization
and centralized coordination decreases the flexibility of business users considering BI
solutions. If the bureaucracy is high and there is little chance to adjust centralized
solutions to own needs, some departments with special needs may end up not having
their own crucial information or reports anymore. Also more centralized solutions may
decrease the overall commitment. To get the most out of the Business Intelligence,
business users of BI need to be engaged to this new concept of centralized and more
standardized BI. The question is how Business Intelligence Competency Centers can
enhance the engagement of business users despite reduced flexibility to get a flying start
and leave the incoherent departmental solutions behind?
1.2. Research problem, objectives and limitations
Business Intelligence Competency Center is relatively young concept, which is why it
has not been covered extensively in the existing literature. Only few researches and
questionnaires have been made focusing mostly on the diffusions of BICCs and how
they are managed in companies. Some literature exists about the obstacles of
implementing a BICC but there is a lack of information available about how the
business users, who are the decision-makers and who should be behind the initiatives of
BI actions, deal with the Business Intelligence‟s organization change towards more
centralized model.
It seems obvious that change resistance arises when Business Intelligence solutions are
centralized and earlier autonomous departments lose their flexibility and freedom due to
increased standardization and bureaucracy. However, there are a lot of opportunities and
media to dilute this resistance to change by engaging users during BI development
projects and during the kick-off of Business Intelligence Competency Center. The
research problem and objectives are derived from the needs of both literature and also
from the needs of the case company who put the initiative for this research.
The main research question of this thesis is:
1. How to engage business users to Business Intelligence Competency Center?

3
Other research questions can be written:
2. How the means and the methods of engagement change as company moves
towards centralized BICC?
3. What are the main challenges considering the engagement of business users to
BICC?
The objective number one is to find different methods and means to overcome the
resistance of change and therefore enhance business users‟ engagement to Business
Intelligence Competency Center. The variety of different ways is huge if we consider
organizational change management and engagement in general, but in case of BICC
some ways may be limited due to the organization itself and vice versa some ways may
be BICC specific. Because the research material is based on two separate but almost
identical BI development projects by their scope, there is a chance to compare how the
means and methods have changed as the company has moved towards more centralized
BICC between the projects. The objective of this kind of comparison is to bring out
possible advantages and disadvantages of BICC and therefore be more exploratory by
the nature. The third research question‟s objective is to find challenges related in
business user engagement focusing on BI development projects. Decreased flexibility
and increased standardization have been highlighted in the literature but there has been
only a little empirical evidence how they really affect on the business users‟
commitment and engagement.
Because particular case organization‟s Business Intelligence solutions and Business
Intelligence Competency Center organization are young, this research comes a little
short considering the day-to-day work of BICCs which is followed after BI solution
development projects. Some observations can be made on the basis of another project
but the research focuses mainly on the moment of the execution of two BI solution
development projects. The developed BI solutions, their informative value to business
users and related BI tools are discussed shortly leaving their functionalities and the
technical side of the solutions outside the scope. Another limitation is related to the field
of social science research. Although people‟s mutual interactions and relationships are
important considering change resistance and people‟s organizational engagement, these
are delimited outside this thesis due to the field of this study and the competence of the
researcher.
1.3. Research methodology
This research is made on an assignment of the case company, Metso Automation.
During the research process the researcher was a member of the case company and took
part in organization‟s daily work. This practical problem solving created a basis for
more applied research which targets on creating a solution to a real problem. According

4
to almost 20 year-old text by Kasanen et al. (1993), this kind of setting has been quite
typical to Master of Science theses in Finland‟s technical universities. Kasanen et al.
(1993) calls this constructive research approach according to the construction which is
created to solve a real practical problem. They also put that “problem‟s practical
relevance” is one of the main part of constructive research (Kasanen et al. 1993, p. 306).
However, the construction created in this thesis differs a little from typical normative
constructions being also a little descriptive due thesis topic‟s relative young age.
In this thesis case research is used as main research method which is very typical to
constructive research which aims to creating a certain construction (Kasanen et al. 1993,
p. 315). According to Yin (2009) case study is relevant method when there is a need to
explain things and answer “how” or “why” questions. Tellis (1997) put that case study
has three tenets of the qualitative method: describing, understanding and explaining.
The case approach can give extensive and in-depth description, which is good because
the concept of Business Intelligence Competency Center is relatively young and it has
not been researched intensively. Because many things are unique and complex in
organizational issues as well, true understanding of these phenomena requires a close
and holistic view, and especially in-depth view is crucial to create a problem solving
construction. Although the research field of sociology is usually associated strongly
with case study research, it fits well on this thesis‟ context of organizational change as
well. (Tellis 1997; Yin 2009.)
This case research focuses on two different BI development projects of one business
line of a large corporation. According to Yin‟s (2009) typology of case researches this
research is called holistic multiple-case research because two different cases are studied
in one unit. Because Business Intelligence Competency Center is relatively young in
case organization, chance is likely to occur in it during the research which makes the
environment quite dynamic. Also, the researcher is a member of the organization at the
time of research so it is not clear how researcher‟s intervention is promoting the
practices within the organization. It is important to be aware of these features of action
or interventionist research. However, being part of the organization gives a good access
to data and a good knowledge how the organization is really functioning. This combined
to long and close observation gives a great change to get rich qualitative data. (Saunders
et al. 2009.) Although observation is an important way of collecting the material of case
research, the first case description of BI solution development project from the time of
its planning and execution is needed to be done only on the basis interviews and
documentation without any observation. However, being part of organization created a
chance to establish trust between members of organization and therefore to obtain rich
information through interviews as well. The material of the further engagement of
business users after the first project‟s execution and the material from the whole second
project are obtained mainly by observing.

5
The goal of this research is not to construct totally new theory, which would describe
the particular phenomenon in general. This kind of basic research would require more
cases and comparison between them, or even totally different research method
(Eisenhardt 1989). Vice versa, this thesis is more applied research and therefore the goal
is to create a construction to the managers and to have a dialog with the theory
suggesting possible expansions or adjustments on it based on the research material.
Focusing intensively on two similar cases gives also a possibility to tell a „good story‟
based on rich qualitative which could be utilized in further researches covering the same
topic.
1.4. The structure of the thesis
According to Kasanen et al. (1993), the structure of this thesis follows quite well the
typical structure of the constructive researches done in diploma works: phrasing a
question, literature review, solving a real problem in case company and creating a
construction, and summary. The structure is visualized in Figure 1.1.
Figure 1.1: The structure of the thesis.
The introduction is followed by two chapters of literature review, which create basis for
both obtaining and processing of research material. The chapter number 2 consists of
the theory of organizational change and organization change resistance. Different
theoretical frameworks are presented to cover an organizational change and also some

6
models of change management and how to overcome change resistance are reviewed to
get the reflection surface for the empirical research material.
In the beginning of the chapter 3 the basics of Business Intelligence is reviewed to
create a sound understanding for the rest of the chapter and the thesis. After presenting
BI in a nutshell, chapter 3 focuses on the Business Intelligence Competency Center
concept. After introducing the concept of BICC, the functioning and the typical roles of
a BICC are presented to create an understanding how and who are dealing with BI
solutions and their development projects. In the end of chapter 3 the organization and
organizational alignment of a BICC are discussed.
Next, the fourth chapter is dedicated to the research method and the collection of
research material. First, the methods of obtaining and analyzing the research material
are presented and discussed. The rest of the chapter focuses on presenting the case
company and its environment. Next chapter deals the results of the research. Two
descriptive narratives are built after which the second research question is discussed.
Next the research material is categorized and summarized on which basis the first and
the third research questions are answered and discussed. The empirical material
discussed reflecting it to the existing theory and the validity and reliability of the
research is discussed. In the end, the conclusions are drawn and possible future research
suggestions are made.

7
2. CHANGE AND RESISTANCE
2.1. Change in organizations
2.1.1. Organizational change
It would be wrong to claim that the companies of today are dealing in a totally new
dynamic environment where change occurs. Change is not a new thing, it has always
been present. However, it is undeniable that the competition has tightened and the
pressure for companies to adapt and renew has increased. The change and the change
management became more popular and significant topics in the 1980s when more
pressure was put to both private- and public-sector organizations in order to survive.
Many corporate do change, at least they try, but some do not manage to do it. (Barr et
al. 1992; Yukl 2001; Robbins 2003.)
In a nutshell, change can be defined as making things different (Robbins 2003). Pardo
del Val and Martinez Fuentes (2003, p. 148) put that “organizational change is an
empirical observation in an organizational entity of variations in shape, quality or state
over time, after the deliberate introduction of new ways of thinking, acting and
operating”. This definition of the organizational change fits well in the theme of this
thesis, because the change is intentional and especially it covers the introduction of new
ways. Also, the definition of intentional change usually includes an idea that change has
a specific goal (Robbins 2003). However, some levels of change occur in organizations
even if they are not planned beforehand or even they are not intended at all. These
incautious changes are limited outside this thesis although in the most of the cases they
are as important as deliberate changes.
There are different reasons behind deliberate organizational changes. An ever-changing
environment forces companies to adapt themselves. For example, different changes in
legislation and edicts force companies to change their processes and adjust themselves
to be able to continue their operating. Other and the most typical initiative for
organizational change can be set from the behalf of the owners: companies need to
improve their performance. Good and recognized examples of performance
improvement changes are the multiple quality programs started in the 1990s by the
western car manufacturers. The reason behind these quality programs was the improved
quality of Japanese car manufacturers which had become a significant competitive
advantage. Naturally, every improvement changes are not catch-ups but many
companies try to create new competitive edge for example by launching new products
or by developing new Business Intelligence solutions to enhance better decisions.
8
Underlying reasons for incautious changes are quite the same, however, their initiative
lies somewhere in the subconscious. (Barr et al. 1992; Boeker 1997.)
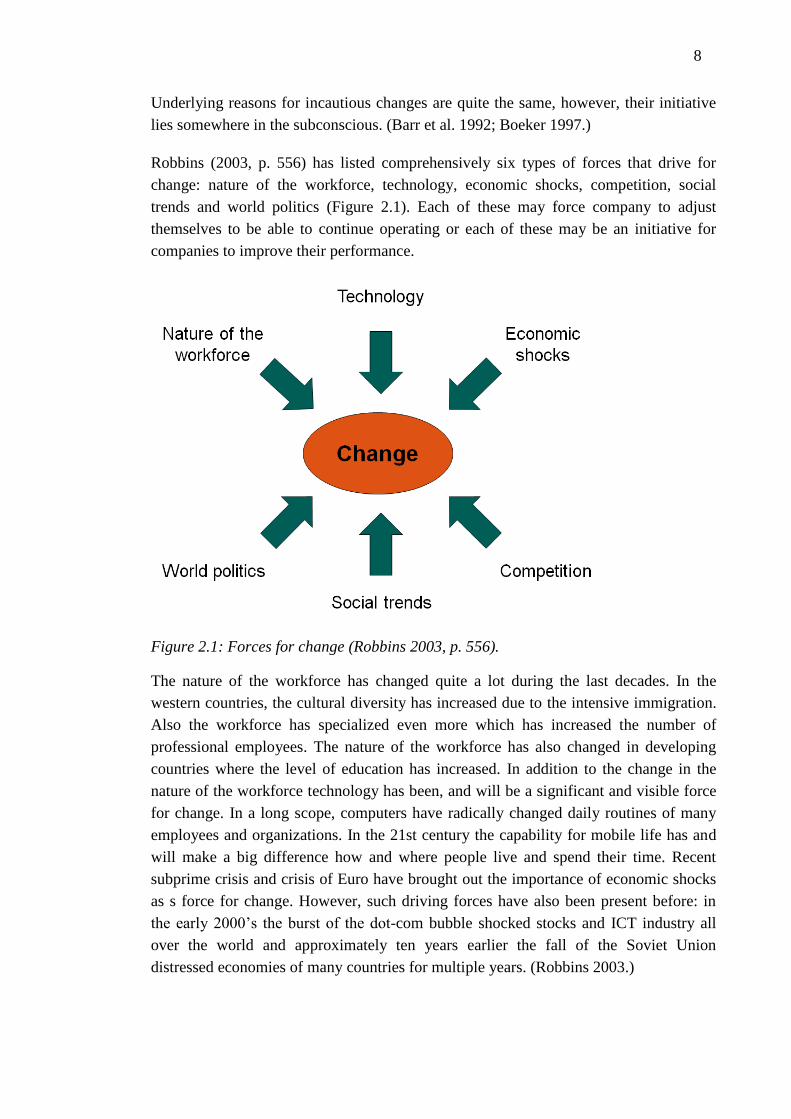
Robbins (2003, p. 556) has listed comprehensively six types of forces that drive for
change: nature of the workforce, technology, economic shocks, competition, social
trends and world politics (Figure 2.1). Each of these may force company to adjust
themselves to be able to continue operating or each of these may be an initiative for
companies to improve their performance.
Figure 2.1: Forces for change (Robbins 2003, p. 556).
The nature of the workforce has changed quite a lot during the last decades. In the
western countries, the cultural diversity has increased due to the intensive immigration.
Also the workforce has specialized even more which has increased the number of
professional employees. The nature of the workforce has also changed in developing
countries where the level of education has increased. In addition to the change in the
nature of the workforce technology has been, and will be a significant and visible force
for change. In a long scope, computers have radically changed daily routines of many
employees and organizations. In the 21st century the capability for mobile life has and
will make a big difference how and where people live and spend their time. Recent
subprime crisis and crisis of Euro have brought out the importance of economic shocks
as s force for change. However, such driving forces have also been present before: in
the early 2000‟s the burst of the dot-com bubble shocked stocks and ICT industry all
over the world and approximately ten years earlier the fall of the Soviet Union
distressed economies of many countries for multiple years. (Robbins 2003.)

9
As mentioned earlier, one of the major forces for organizational change is competition.
Competition has tightened locally but it also has become more global. The significance
of domestic sales has decreased as more sales of western companies come outside the
homeland‟s borders. The field of competition has changed a lot in many industries due
to multiple mergers and consolidations. For example, leading Business Intelligence
solution providers, such as Business Objects and Cognos were acquired by SAP and
IBM respectively (Kelly 2009). This is only one example how companies are expanding
their offerings and this way trying to offer their customers more integrated and
extensive solutions. Also the e-commerce has changed competition in the terms of cost
efficiency and new distribution channel. (Robbins 2003.)
Changes in social trends drive especially B2C companies for change. Internet has
become part of most people‟s everyday life in both developed and developing countries.
Newest trends such as social media and networks have drawn also B2B companies‟
attention for example in recruiting. Changes in demographic variables may be even
stronger force for change. In many western countries the retirement of baby boomers
will have major effect on the social structures of these countries. Increased interest in
urban living especially in developing countries is a driving force for organizational
change in many local and also global companies (Economist 2010). The last force in
Robbins‟ (2003, p. 556) classification is the change in world politics. Recently, many
rapidly developing countries, such as China, have opened their markets for foreign
companies. This has been a major driving force for companies to move their production
closer to expanding markets. Also treaties like NAFTA and EU have advanced the
globalization. (Robbins 2003.)
2.1.2. Change process
The change process has been under many examinations during the last six decades. One
of the most foundation-laying theories was created in the middle of the 20th century by
psychologist Kurt Lewin. His three-step framework of force field analysis is description
of people‟s tendency to resist change and the forces that are driving the change. The
model links also Lewin‟s earlier research of group dynamics to change process and how
the dynamics is affecting on individual‟s perception of change. The description of
framework‟s change process is regarded as oversimplifying, which may be one of the
reasons why the framework has been generally used and recognized. It divides the
change process into three stages: unfreezing, changing and refreezing (Figure 2.2).
Although the framework was not originally developed considering only organizational
change issues, it has become a useful tool for managers to understand the different
stages of change and how they should be dealt in order to in increase the likelihood of a
successful change. Despite the simplicity, one should not forget that the framework is
not just a simple change model with three separate stages but it was developed on the
basis of Lewin‟s earlier research which takes also group, organizational and societal
levels into account. (Pinnington & Edwards 2000; Yukl 2001; Burnes 2004.)

10
Figure 2.2: Lewin’s three-stage change process (Pinnington & Edwards 2000).
The first stage, unfreezing, is the phase where the readiness for change is created. From
the individual perspective this means that the need for particular change has to be
recognized. „Unfreezing‟ of an individual can happen unconsciously and independently
or like in many deliberate changes it can be promoted by the change agents. The
initiative for the recognition may also be the result of some earlier event or crisis. The
phase of unfreezing is critical in the sense of change management: without a proper
unfreezing the change is likely to meet very strong resistance and conversely, a good
unfreezing may ease the change management in further phases. (Pinnington & Edwards
2000; Yukl 2001.)
In the second stage of Lewin‟s the change itself must be executed. Unlike in many
changes, one should not only focus on individual factors. Many other things, such as
structural and political factors, must be regarded. From the individual perspective the
resisting forces of change must be overcome somehow. They can be reduced or the
change can be promoted by strengthening the driving forces. (Pinnington & Edwards
2000.) This juxtaposition of resisting and driving forces is discussed more deeply in
later subchapters.
The last step of the change process is refreezing. The change executed in second step
must be habituated. If the change cannot be embedded, the results can be seen only for a
while and the change may be reversed quickly. Many change processes have failed after
all because new habits or processes have not been able to implement into daily
processes. (Pinnington & Edwards 2000.) For example, the number of BI users may be
doubled but the actual usage and utilization of BI solutions in everyday processes is still
on the same level than before the change.
Although Kurt Lewin‟s change management theory is considered to be the ultimate
foundation for the further researches, his theory has been under heavy criticism. It has
been said to be inadequate to respond the rapid pace of change in today‟s environment
which companies confront. As the pace of change has speeded up, companies are left
less time for the refreezing stage of Lewin‟s model. A lot of conceptual models of
organizational change appeared in the last decades of 20th century in addition to
Lewin‟s model. (Frantz 2004.) For example, Weick and Quinn (1999) presented a
model for continuous change, which emphasize companies‟ need for constant adaption.

11
They replaced “change” phase in Lewin‟s model with “rebalance” trying to align the
model better with today‟s rapidly changing environment. (Weick & Quinn 1999.)
Lewin‟s model has been also criticized being too simplified. Different, more detailed
phase-models have been developed since of which Kotter‟s (1995) eight-step model is
introduced later in this thesis to get more detailed view of change and its management
(Armenakis & Bedeian 1999). However, despite all the criticism and becoming
unfashionable, Lewin‟s model has been proved to be relevant and practical if it is not
interpreted too concisely (Burnes 2004).
2.1.3. Magnitude of the change
It is important to be able to recognize different kinds of changes and their
characteristics. One of the most important dimensions to be considered is the scope of
the change. This variable affects on many aspects of change such as arising change
resistance and how resistance should be dealt with. The scope of the change can be
described in a continuum starting from low-scope changes ending to high-scope ones
(Figure 2.3). The true division is not that black-and-white but most of the changes fall
somewhere between these two extreme ends. (Pardo del Val & Martinez Fuentes 2003.)
Figure 2.3: The scope of the organizational change (Pardo del Val & Martinez Fuentes
2003).
Low-scope, also known as first order changes can be seen as evolutionary changes.
They are small incremental changes that aim for certain improvement and they are
happening all the time from deliberate initiatives or incautiously. Within these kinds of
changes the general framework of doing things is kept the same so the perceived
interruption is not that radical. For example, in accounting one may divide a certain
account into two accounts in order to get more detailed information. This kind of
change does not change daily processes radically which is why perceived benefits may
also be quite small. (Nadler & Tushman 1989; Goodstein & Burke 1991; Pardo del Val
& Martinez Fuentes 2003.)
High-scope, also known as second order changes are opposite to low-scope changes in
many ways. These are usually strategic changes that occur only from deliberate
initiatives. During the most revolutionary changes organization changes its essential
framework of doing things. By restructuring the way of working one can generate a
totally new base for organization‟s competition and affect on the capabilities of entire
organization. For example, a manufacturing company might move from traditional
make-to-stock (MTS) manufacturing to make-to-order (MTO) manufacturing. This kind

12
of transition may require huge changes in various daily processes and in way of doing
things through the whole organization. (Nadler & Tushman 1989; Pardo del Val &
Martinez Fuentes 2003.)
How one can say whether a change is low-scope or high-scope? Weick and Quinn
(1990) suggest that the contrast between these two levels of change reflects differences
in the perspective of the observer. If one takes distance and looks things from the macro
level, daily repetitive actions and routines can be seen as occasional episodes of a
revolutionary change. However, these same daily actions can be seen as ongoing
adaption and adjustment from the closer, micro level look. The perspective of the
observer should be considered carefully because people do perceive changes differently.
For one the change may not be a big deal while for another it may feel like
revolutionary and cause significant reactions. (Weick & Quinn 1999.)
The presented scope of the change is a linear point of view with two ends. It covers both
„broadness‟ and „depth‟ of the change by summarizing them together. However, de Wit
and Meyer (2005) divide this view of the scope into two different dimensions: scope of
the change and the amplitude of the change. According to these two dimensions, one
can create a fourfold table which classifies four different magnitudes of change. This is
presented in Figure 2.4.
Figure 2.4: The magnitude of the change (de Wit & Meyer 2005).
A revolutionary change is close to a high-scope change presented by Pardo del Val and
Martinez Fuentes (2003). However, especially in large companies one might have to
consider the broadness of the change in more detail. The example of transition to MTO
manufacturing might consider only one division or even one factory of a larger

13
corporate. This kind of “focused radical change” in de Wit‟s and Meyer‟s (2005)
taxonomy may require significantly different resources and may have totally different
coordination than broad, “revolutionary change”. Controversially, adding a more
detailed chart of accounts has different outcomes whether it is done locally
(evolutionary change) or globally (comprehensive moderate change). The linear view of
Pardo del Val and Martinez Fuentes (2003) is adequate for most, but it still cannot make
this important difference between company-wide and more focused change whether the
amplitude of change is low or high.
2.1.4. Pace of the change
Besides the magnitude of the change, the pace of the change is one of the most
important dimensions which should be taken into account especially when resistance to
change is considered. Sometimes the pace of the change is used to define a
revolutionary and an evolutionary change in addition to the scale dimension. The
Evolutionary changes are then claimed to develop slowly and gradually and
revolutionary swiftly and widely. (Greenwood & Hinings 1996.) However, in this thesis
evolutionary and revolutionary are defined only by the magnitude of the change leaving
the pace of change as a separate dimension. As mentioned already in this thesis,
organizations meet today more rapidly changing environment than ever before which
sets them pressure to change themselves even more rapidly. However, how the pace of
the change affects the transformation process after all and whether the change should be
fast of slow have not been researched a lot and therefore the effects are certainly not
conclusive. (Amis et al. 2004.)
The pace of the change is usually examined with the magnitude of the change. Some
authors (e.g. Tushman et al. 1986) claims that big, revolutionary changes should be
implemented rapidly to obtain synergy by pulling all parts of the organization in the
same direction. They also defend a rapid pace by emphasizing uncertainty and
instability which may arise as the change process gets longer. Slowly developing
change may create growing „pockets of resistance‟ which are even harder to overcome.
However, sometimes changes just must be fast e.g. in order to response to changed
legislation. (Tushman et al. 1986.) The advocates of slower change conversely stress
that the adaption to change should happen gradually or incrementally on a small scale in
order to build momentum for further adoptions and to demonstrate the benefits of
change (e.g. Kotter 1995). In a radical change slow speed is also less disruptive and
more manageable. Establishing trust among the stakeholders of the change is crucial.
However, in some occasions this may take a lot of time, which supports the lower pace
of the change. (Amis et al. 2004.)
The on-going debate between the advocates of fast and slow pace might indicate that the
optimal pace of the change is dependent on multiple variants and therefore the optimal
pace depends on particular case and its environment. Sometimes it might be necessary

14
to advance or postpone the change. For example, if there are two overlapping projects
they might have to adjust the pace of the change according to the other. As said, the
pace is not the only thing to be considered. Many other things, such as sequence of the
actions have significant impact on success of the change process. As well, Amis et al.
(2004) found that no matter the pace of the change, high-impact elements in the
beginning of the change process send a clear message of change being implemented to
different stakeholders. The pace, the sequence and the magnitude of the actions within a
change process should not be handled separately.
2.2. Organization change resistance
2.2.1. Resistance to change
Successful changes in organizations are rarer than failures. This appears in many
researches. For example, according to Maurer (1996) over half of the major change
efforts in companies tend to fail. The change does not have to be even major to fail: a
survey of 1536 executives indicates that over 60 % of total change initiatives were not
successful (Isern & Pung 2007). There are multiple reasons for these failures but many
researches show that the ultimate reason can be found in resistance to change (e.g.
Lawrence 1954; Strebel 1994; Maurer 1996; Waddell & Sohal 1998). To get the most
out of the change process, one must understand the change resistance, which is one of
the most important topics in change management (Pardo del Val & Martinez Fuentes
2003). Although the change process would not be a total failure or even the change
would be considered to be successful, resistance to change hinders people‟s adoption
and the progress of change (Robbins 2003). Waddell and Sohal (1998) say that
managers‟ theoretical understanding of resistance to change is good. However, this
understanding has not impacted on the common perceptions of management which is
why change resistance has stayed one of the major reasons of change failure. Maurer
(1996) has even less positive view: he claims that resistance is little recognized in
companies overall even though it is important contributor to the failure.
Resistance to change is a term used in everyday life and people seem to have a shared
understanding of its meaning. However, in literature many authors have presented the
concept of change resistance without giving an exact definition for it. Resistance of
change is just presented as a list of different causes affecting on it and how these causes
may be overcome. This supports a view that people do not resist change per se, but they
rather resist the uncertainties and the possible outcomes, such as loss of status or loss of
pay, caused by the change. (Waddell & Sohal 1998; Dent & Goldberg 1999.) The
significance of individual resistance is obvious, but for example Kotter (1995) says that
pure individual resistance is rare. The source of resistance may lie in the organizational
structure or in the practices, such as in the appraisal system. However, in the end the
resistance is concretized in the actions of individuals no matter what is the ultimate
source. In this thesis, like in most literature, no exact definition of resistance to change

15
is given. Whether the resistance to change is more individual and mental model or a
system‟s concept as Kurt Lewin introduced it, it does not change the fact that it should
be overcome to enable the change and engagement of individuals. (Dent & Goldberg
1999.)
Resistance to change can appear in many ways: it can be overt, implicit, immediate or
deferred. However, resistance does not appear in standardized ways. It varies case by
case depending on many aspects such as individual, for example personality, or change
aspects, for example the pace or the scope of particular change. Resistance to change is
easiest to handle with when it is overt and immediate. People express their feelings
openly and right on time which makes it easier for managers to deal with it. However,
implicit resistance is more subtle. Loss of loyalty, loss of motivation or absenteeism due
to sickness are just some signs to be mentioned which are relatively hard to notice
quickly. They may inhibit the change process and in a worst case these reactions can
build up and explode with dramatic outcomes. (Robbins 2003.)
As said, resistance is one of the most significant reasons why changes fail. This is why
it is understood as undesired phenomenon which is harmful to organizational health. In
most of the times, resistance to change causes increased costs and delays the intended
change. Every individual perceives change in their own way, which is only one of the
reasons that make the resistance of change very complex issue. Although the negative
effects of resistance have been recognized, resistance has also its ignored upside: people
learn from it. Every individual may learn something new from themselves, but above
all, resistance to change is a useful source of information from both the organization and
individuals to managers (Lawrence 1954; Piderit 2000). Resistance to change may result
in healthy debates and better decisions. It also gives managers a chance to learn how to
deal with the resistance to change in the future. One can also claim that resistance to
change provides a certain level of stability and predictability to behavior in
organizations. Otherwise organizational behavior would be chaotic and random.
(Waddell & Sohal 1998; Pardo del Val & Martinez Fuentes 2003; Robbins 2003.)
2.2.2. Obstacles of engagement and change
Strebel (1994) has developed a model which is based on the juxtaposition of change and
resistance forces originally presented by Lewin in the middle of the 20th century. Both
the change and the resistance forces have many forms but the key is which ones of these
are dominant. If the resisting forces are strong and the change forces are weak at the
same time, status quo agents1 are likely to dominate and no change occurs. This can be
seen in the top left-hand corner of Figure 2.5. In general, these kinds of situations may
be present in regulated markets and bureaucratic governmental organizations where
1 Status quo agent = A person who is willing to keep status quo, acts as inhibitor (Robbins 2003).

16
change forces are typically weak. A reversed case, where the change forces are strong
and the resistance is weak, results in continuous change. In these kinds of environments
change agents2 dominate the small number of status quo agents and people are generally
used to change. According to Strebel (1994), this description fits well into new
companies or independent business units of bigger companies. (Strebel 1994.) However,
if the business units are not totally independent and change initiative is put outside the
particular organization, the change resistance may be even stronger.
Figure 2.5: Change Arena model according to Strebel (1994).
In the bottom left-hand corner both the resistance and the change forces are weak but
relatively equal. The boundary between no change and continuous change can be easily
crossed. Small change events can alter the balance between resisting and driving forces.
At these turning points the status quo agents change their side and turn to be change
agents. This is called sporadic change. Controversially, in the top right-hand corner both
the resistance and the change forces are strong. If change occurs in this kind of
situation, it will be massive and sudden shift where the status quo agents are defeated by
2 Change agent = A person who is responsible for managing change activities, acts as catalyst (Robbins
2003).

17
the change agents. This kind of discontinuous change needs a breaking point. (Strebel
1994.)
To make a change happen, driving forces must exceed resisting forces. Usually the
problem is not the lack of driving forces, but conversely the emerging resisting forces. It
is often noted that adding a driving force produces an immediate resisting counterforce
which tries to maintain the equilibrium. Because of this the change is more likely to
occur when one removes resisting forces away from the way of already existing driving
forces. (Schein 1996.)
2.2.3. Sources of resistance
Resistance to change is natural to human beings. Organizations which consist of human
beings are very conservative by their nature and they actively resist change. (Schein
1985; Robbins 2003.) As mentioned in the previous chapter, people do not resist change
per se, they rather resist the uncertainties and other possible outcomes caused by change
(Waddell & Sohal 1998; Dent & Goldberg 1999). The sources or the causes of
resistance to change have been under many researches during decades. Although
classification or grouping of the sources varies in the literature, today authors agree
quite well on the sources of resistance. Dent and Goldberg (1999, p. 28) have made a
review of five different textbooks from the beginning of the 1990s. Although they are
almost 20 year-old, a lot has not changed so far. These causes or sources of resistance to
change are presented in Table 2.1.
Table 2.1: The causes of resistance to change according to textbook review by Dent and
Goldberg (1999, p. 28).
Authors
Kreitner (1992)
Griffin (1993)
Aldag & Stearns (1991)
Schermerhorn (1989)
Dubrin & Ireland (1993)
Sources of resistance
Surprise x
Inertia x
Misunderstanding x x x x
Emotional side effects x x x x
Lack of trust x x x x
Fear of failure x x
Personality conflicts x x x x
Poor training x
Threat to job status/security x x x x x
Work group breakup x x x x
Fear of poor outcome x
Faults of change x
Uncertainty x x x
18
Dent and Goldberg‟s (1999) list is undeniably comprehensive but it has the same
problem than many of other lists. Some sources such as work group breakup and poor
training are very concrete and therefore they are on different level than for example
uncertainty and emotional side effects. Uncertainty may result for example from poor
training. However, this overlapping and cross-dependency is hard to be avoided if one
wants to create a comprehensive list.
The review by Dent and Golberg (1999) is useful for managers just like that. However,
it does not pay attention whether the source of resistance is likely to be more individual
or more organizational. This division may help managers to find a right approach and
action to overcome the resistance to change. By overcoming organizational resistance
one can advance change more extensively, and conversely, some sources of resistance
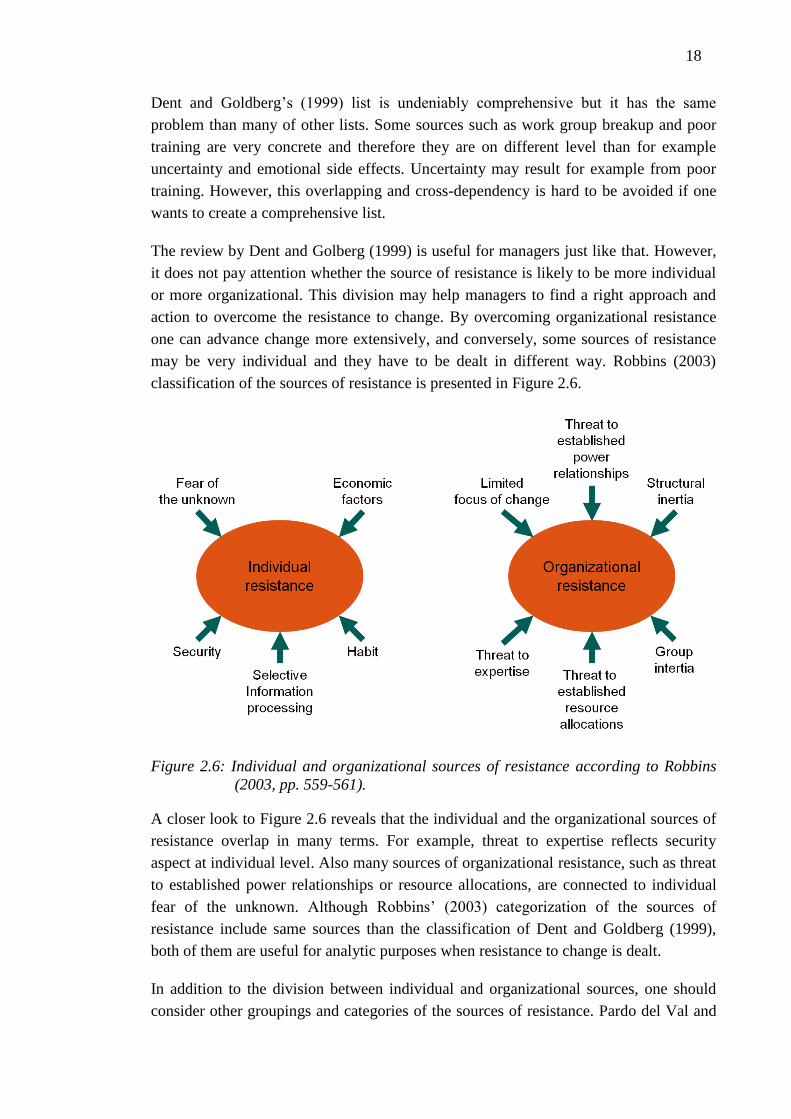
may be very individual and they have to be dealt in different way. Robbins (2003)
classification of the sources of resistance is presented in Figure 2.6.
Figure 2.6: Individual and organizational sources of resistance according to Robbins
(2003, pp. 559-561).
A closer look to Figure 2.6 reveals that the individual and the organizational sources of
resistance overlap in many terms. For example, threat to expertise reflects security
aspect at individual level. Also many sources of organizational resistance, such as threat
to established power relationships or resource allocations, are connected to individual
fear of the unknown. Although Robbins‟ (2003) categorization of the sources of
resistance include same sources than the classification of Dent and Goldberg (1999),
both of them are useful for analytic purposes when resistance to change is dealt.
In addition to the division between individual and organizational sources, one should
consider other groupings and categories of the sources of resistance. Pardo del Val and

19
Martinez Fuentes (2003) have made also a comprehensive literature review of the
change resistance. Besides, they have grouped the sources of resistance or inertia
according to the stage they exist in organizational change. This kind of division helps
managers to focus their actions correctly in the timeline of particular change. This also
helps to position the sources of resistance to different stages of Lewin‟s three-stage
model although the model should not be considered to be linear. The resistance in
formulation stage can be categorized into three groups: 1) distorted perception,
interpretation barriers and vague strategic priorities, 2) low motivation, and 3) lack of a
creative response. These categories and the sources of resistance in formulation stage
can be seen in Table 2.2.
Table 2.2: The sources of resistance in the formulation stage (Pardo del Val & Martinez
Fuentes 2003, p. 150).
Distorted perception, interpretation barriers and vague strategic priorities
Myopia Denial Perpetuation of ideas Implicit assumptions Communication barriers Organizational silence
Low motivation
Direct costs of change Connibalization costs Cross subsidy comforts Past failures Different interests among employees and management
Lack of a creative response Fast and complex environmental changes Resignation Inadequate strategic vision
Many of the sources of resistance may exist also in change‟s implementation stage. In
addition to the sources in formulation stage, Pardo del Val and Martinez Fuentes (2003)
have categorized the sources in implementation stage into two groups: political and
cultural deadlocks and other sources. These sources can be seen in Table 2.3.
Table 2.3: The sources of resistance in the implementation stage (Pardo del Val &
Martinez Fuentes, p. 150).
Political and cultural deadlocks
Implementation climate and relation between change values and organizational values Departmental politics Incommensurable beliefs Deep rooted values Forgetfulness of the social dimension of changes
Other sources
Leadership inaction Embedded routines Collective action problems Capabilities gap Cynicism
20
If one can recognize and predict in which stage of the change process resistance occurs
and whether the source is more individual or organizational, overcoming the resistance
to change is much easier. For example, a manager can put efforts to overcome an early-
stage source of resistance if it is likely to be cumulated. Also grouping and categorizing
different sources may help managers to find right tools and media to handle and
overcome the resistance.
2.2.4. More detailed framework for managing change
Waddell and Sohal (1998) put that when resistance to change is minimal, the change
itself is managed well. However, some resistance exists always and it cannot be totally
diluted and overcome even by good managers, but with good management of change
one can significantly improve the outcomes. In chapter 2.1.2 Lewin‟s three-stage model
was introduced but for some managers and authors it is a bit too general and simplifying
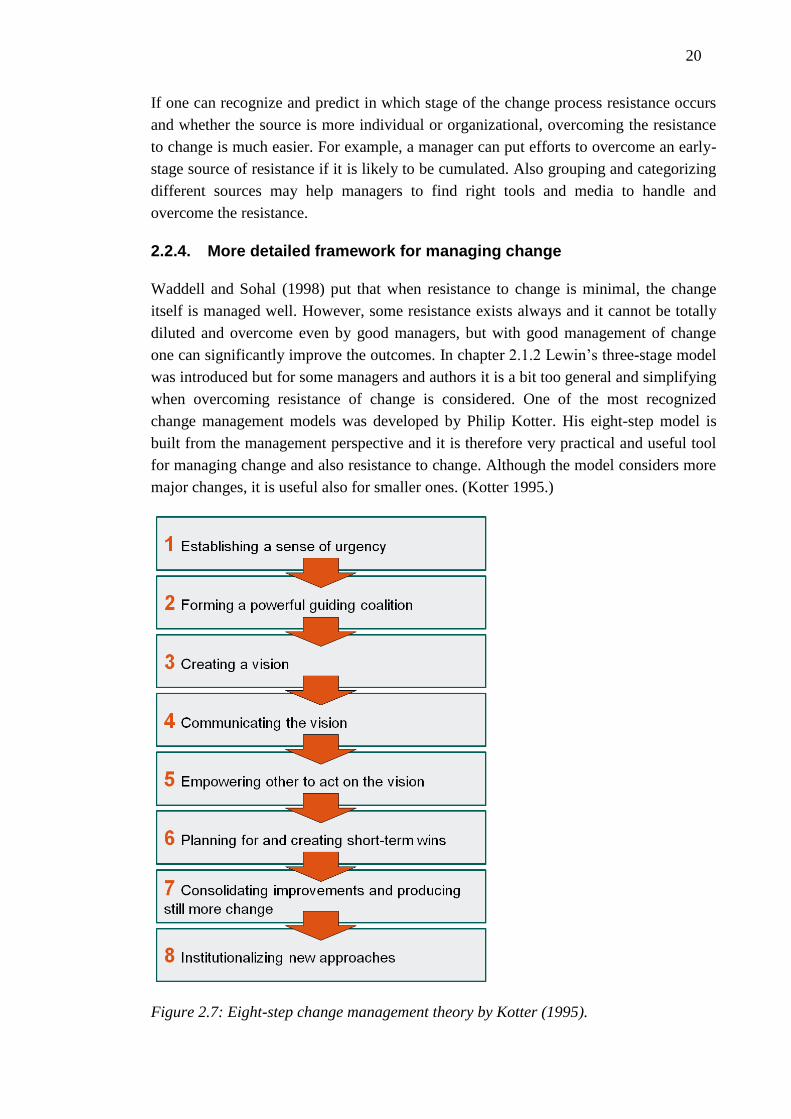
when overcoming resistance of change is considered. One of the most recognized
change management models was developed by Philip Kotter. His eight-step model is
built from the management perspective and it is therefore very practical and useful tool
for managing change and also resistance to change. Although the model considers more
major changes, it is useful also for smaller ones. (Kotter 1995.)
Figure 2.7: Eight-step change management theory by Kotter (1995).

21
The first step of Kotter‟s model is to establish a sense of urgency. This stage is similar
compared to Lewin‟s unfreezing step. Some people are more used to change than others
and some people are just more risk-averse willing to keep the status quo. In many
occasions people are just not aware of the crises or the opportunities which is why a
good communication is essential for triggering the sense of urgency. There is a dilemma
related to the urgency for change: in bad times, when company is losing money, there is
a need for change, however, there might not be enough resources to implement it.
Conversely, in good times there are adequate resources for change but the people might
be comfortable with status quo and therefore there is no urgency of change. (Kotter
1995; Pinnington & Edwards 2000.) Next step is to form a powerful guiding coalition.
The change should be guided by a group with enough power to lead the change efforts.
Depending on the case, the guiding group should consist of different kinds of
individuals who have different titles, information and expertise, reputation and
especially relationships. The variety of people brings different points of view to
discussion and it also signals the organization about the wide-range commitment to
change. The people of the guiding coalition should personally be committed to the
change. It would be absurd that a part of guiding group itself would resist the change.
(Kotter 1995.)
Third and fourth steps are related to creating a vision and communicating it. A clear
vision of change helps to direct the change efforts and in major changes it helps to
create strategies for achieving the vision. Without a proper vision the change can
dissolve into a distinct confusing and incompatible efforts and projects. The vision
should also be easily communicated and appealing because people are not tend to
engage if they do not know exactly what is the goal of the change. Even if people are
unhappy, they are not ready to make sacrifices if they do not believe that a useful
change is possible to be executed. If the change of urgency is established well,
absorption of vision communication will be better. In any case, it is important to reach
as many people as possible by using different communication channels. (Kotter 1995.)
In most cases, the change cannot be successful without the contribution of other people.
Fifth step of Kotter‟s model is empowering other to act on the vision. In the concrete
level this means getting rid of the obstacles that are resisting change. Obstacles may
exist in different forms: it may be organizational structure that is inhibiting the change
or it may be for example the rewarding system that does not encourage people to drive
the change. The blocker can also be a person or a group of persons who is resisting the
change because of individual reasons. These people should be treated fairly to prevent
the possible spread of resistance. (Kotter 1995.) One of the most disregarded things in
major and long-term changes is to plan and create short-term wins. Performance
improvements should be made visible early because people tend to give up easily and
join the ranks of resisting forces. Making improvements visible means a communication
and also rewarding employees of performance improvements. Short-term wins are also

22
an evidence of doing right things to the guiding or steering group. (Schaffer & Thomson
1992; Kotter 1995.)
The last two steps of Kotter‟s model are equivalent to the last stage of Lewin‟s model,
refreezing. Achieved improvements should be consolidated and producing change
should not be stopped. New employees, projects, themes and change agents should be
introduced instead of retiring on one‟s laurels. There is always a risk that the initiators
of change go overboard and join the resistors. This can quickly stop the change if early
victory celebration is done for nothing. The last of eight steps is to institutionalize new
approaches. This means articulating employees the connection between the new
behaviors introduced by change and the success of the company. Still, one should
ensure that the development and the succession of change keep going. The ultimate goal
is to root the change until it is “the way we do things around here”. (Kotter 1995.)
2.2.5. Engaging individuals
The models of general change management, such as Kotter‟s (1995), are very useful
frameworks for managers. They enhance better overall change management which
correlates with lower change resistance and better engagement. However, sometimes
managers need to take more individual view for change resistance and overcoming it.
As presented in chapter 2.2.3, the sources of resistance to change can be divided into
individual and organizational. Although these sources may overlap, there may be totally
personal things related to organizational change that are not shared by any other. For
example, during changes people are treated and encountered differently which may
create totally different kinds of reactions. (Folger & Skarlicki 1999.)
There have been a lot of practical studies outside the general change management
frameworks how to overcome the resistance of change. One of the most critical success
factors in these researches has been a good communication (e.g. Waddell & Sohal
1998). The importance of communication the vision of the change and the daily change
communication has been emphasized also in Kotter‟s (1995) model. However,
communication is understood too often as a one-way channel. Employees should be
provided an opportunity to give feedback personally whenever they feel so. Responding
to the feedback in any way is crucial because employees should not feel that their
feedback is falling on deaf ears. Among the communication, the participation of
employees is another critical success factors regarding the resistance of change and the
engagement of employees. When employees are participated in the change process, they
feel more committed as they have a chance to affect on the outcomes of the change.
People may be participated for example by consulting them in questions that are related
to their expertise or by participating them in planning and designing the change that
accounts them. (Waddell & Sohal 1998.)

23
In their textbook review, Dent and Goldberg (1999, p. 28) have listed different
strategies and ways to overcome the resistance of change (Table 2.4). Notable in this
review was that all of the means were not „soft‟. Diluting the resistance may need
forcing in some instances. For example, if a company has decided to change one of their
software to another, they may stop the maintenance and the support of the old one or
even reject the access to it. Usually, when people have no choice, the resistance is
diluted but general dissatisfaction may increase. (Dent & Goldberg 1999.)
Table 2.4: The strategies to overcome the resistance to change according to textbook
review by Dent and Goldberg (1999, p. 28).
Authors
Kreitner (1992)
Griffin (1993)
Aldag & Stearns (1991)
Schermerhorn (1989)
Dubrin & Ireland (1993)
Strategies for overcoming
Education x x x x
Participation x x x x x
Facilitation x x x x
Negotiation x x x x x
Manipulation x x x x x
Coercion x x x x
Discussion x
Financial benefits x
Political support x
The variety of different means and methods of engagement is rich but managers need to
find the right ways to encounter the particular resistance of change. The used means
should meet the individual aspects as well the constraints of organization. The
participation may turn to have even negative outcomes if employees do not have enough
time for taking part. This may increase the dissatisfaction towards the management of
change and also people‟s contribution may even slow down the progress of change if
they have to make decisions in rush. (Waddell & Sohal 1998.)
In the best occasion when change is managed well, resistance to change may even turn
to be a good thing. Consulting and participating employees, a good communication and
taking feedback may increase the overall commitment and the engagement to the
change and also to further changes. Turning a head of a status quo agent may be an
initial to a bigger wave of turnovers and this may create a breaking point of change
(Strebel 1994). This is one example why Lewin‟s model should not be treated as a
simple model of categorizing the actions of change process but the actions and the
resistance should be considered in their broader context that takes their mutual
dynamics into account.

24
2.3. Dilemmas of change management research
The change and its management in organizations are very complex issues in the field of
research. Pettigrew et al. (2001) have listed different challenges of studying
organizational change and development which have been present in already conducted
research and will been present in the future as well. Multiple context and levels of
organizational change, unique history and international comparability are just few
challenges to be mentioned that researchers face. The study of organizational change
and development is also very close to social sciences which sets even more challenges
for the conduction of the researches. (Pettigrew et al. 2001.)
Many different themes or issues have been discussed in change management literature
both separately and together. Armenakis & Bedeian (1999) have categorized these
issues into four groups: substance of contemporary organizational changes, contextual
issues such as conditions and forces of environment, change processes and criterion of
organizational change. In additions to these, the social science research has covered also
monitoring the affective and the behavioral reactions to change. This wide range of
different topics and issues has resulted in huge number of different more or less
complex theories trying to response the contemporary organizational demands and
trying to cover as many of these issues as possible. However, many theories and
frameworks have been criticized of having too little empirical evidence and being only
bits of advice. (Armenakis & Bedeian 1999; Pettigrew et al. 2001.)
On this thesis a couple of process models of change management have been presented
starting from the fundamental model of Kurt Lewin. Although Lewin‟s model has been
under major criticism since 1980s, for example being too simplifying, assuming that
organization work in stable environment and being management-driven top-down
model, its significance cannot be denied. (Burnes 2004.) Many other process models,
for example Kotter‟s (1995), are derived from Lewin‟s original being more detailed and
trying to be suitable for today‟s world. Despite the limitations of Lewin‟s model, it has
been proven to be still relevant. For example, Fiol (2002) has used Lewin‟s three-stage
model successfully as a basis of her widely referred research. Burnes (2004) also
concludes in his examination of the Lewin‟s model it is still relevant to the modern
world considering change process and its management.

25
3. BUSINESS INTELLIGENCE AND BUSINESS
INTELLIGENCE COMPETENCY CENTER
3.1. Business Intelligence
3.1.1. Definition
Business Intelligence (BI) is a term which is used very widely and in various meanings.
Howard Dressner, today a well-known authority and the lecturer of particular topic, was
the first one to use term BI in 1989. He defined Business Intelligence as “an umbrella
term to describe different concepts and methods to improve business decision-making
by using fact-based support”. (Burstein & Holsapple 2008, p. 176; Gartner 2010.) The
initial definition is quite broad why it is able to cover many other later definitions under
it.
Burstein and Holsapple (2008) define Business Intelligence in more detail as “systems
that combine data gathering, data storage, knowledge management with analysis for
presentation to planners and decisions makers with objective to improve timeliness and
quality of the input decision-making”. In a nutshell, analogy for Business Intelligence
can be found from the logistics: getting information to the right location in the right
time in the right form. (Bustein & Holsapple 2008, p. 176; Stevenson 2009.) Miller et
al. (2006) count also on the „triple rights of information‟ definition and emphasize that
goal of the Business Intelligence is to enhance more effective decision-making. Ranjan
(2008, p. 461) as well emphasizes the decision support function of BI and brings out an
important aspect in his definition, which is that BI is business-driven. In Figure 3.1 the
role of Business Intelligence in decision-making is demonstrated.
Figure 3.1: Business Intelligence’s supporting role in decision-making (Rytkölä 2010).

26
Although different definitions of BI share many similar points and aspects, there is clear
disagreement whether external information is included to Business Intelligence.
Burstein and Holsapple (2008) state that traditionally BI has focused more on
companies‟ internal information but in many occasions it is combined with the external
environment to expand the scope and therefore to support decision-making more
efficiently. However, usually this information gathering, analyzing and managing of
external environment is considered to be a distinct subject called Competitive
Intelligence (CI) (Burstein & Holsapple 2008). Ranjan (2008, p. 461) does not either
draw a line between the internal and external environment defining the BI input “from
any and all data sources”.
In any case, the importance and the business justification of Business Intelligence is
undeniable. As mentioned in the introduction, the quality and the timeliness of the
decision-making input is crucial in competitive and increasingly uncertain world. Miller
et al. (2006, p. 4) say that transforming raw data to actionable intelligence offers
innumerable competitive advantages. According to Ranjan (2008, p. 461), BI is the
question of survival and bankruptcy and therefore it does not guarantee a competitive
advantage any more. Because Business Intelligence is very broad topic, there are almost
as many definitions as there is people and perspectives. No matter whether the
definition of Business Intelligence covers the information about external environment or
whether Business Intelligence is a source of competitive advantage, authors agree that
the goal of BI is to enhance better decision-making. Because Business Intelligence is
fueled by the utilization of the information it provides, the initiative should therefore lie
in business who is making the crucial decisions in the end.
3.1.2. BI components
Although the scope of this thesis is not to focus on technical side of Business
Intelligence, it is necessary to explain the basics of different processes to create a sound
understanding of the environment. The definition of Business Intelligence is close to the
definition of decision support systems (DSSs) but the difference is that BI is data-driven
and it emphasizes the analysis of large volumes of data. (Burstein & Holsapple 2008.)
The data used by Business Intelligence is originated from different data sources:
operational systems such as Enterprise resource planning (ERP) or Customer
relationship management (CRM), historical and possibly some external data sources
(Ranjan 2008).
One of the most significant keys to a successful BI system is the integration of data
from multiple sources. In this thesis the focus is on the data consolidation leaving for
example the data federation and data propagation outside the scope. In data
consolidation the target data is pulled from different sources into a single enterprise data
warehouse (EDW) or data warehouse (DW). In this thesis the latter term is used to
cover data warehousing. The process is presented in Figure 3.2. The data in original

27
sources is in most cases very shattered, heterogeneously formatted and governed more
or less well. This is why the data needs to be reformatted, transformed and cleaned
before the consolidation. Extract, transformation, and load (ETL) is generally used
technology in this purpose to pull the data from the sources and to push it to the data
warehouse in decent and uniform format. In data warehouse the data is arranged to
different data marts which are collections of subject areas such as finance or marketing.
The idea behind this is to organize a huge data warehouse to better decision-support.
(Inmon 1999; White 2006; Ranjan 2008.)
Figure 3.2: A typical BI environment modified from Ranjan (2008, p. 466).
After the consolidated data is loaded to DW it is ready to be analyzed by different tools.
The variety of tools and methods is huge and it is most important to select a right one
for right purpose and user. Different terms of analytic techniques, methods, tools and
applications are mixed in the literature but they all serve the same purpose: to enable
better decisions. Basic statistics, data and text mining, forecasting, visualization,
querying, reporting and multidimensional analysis with online analytical processing
(OLAP) are some to be mentioned. (Burstein & Holsapple 2008; Ranjan 2008.)
According to Ranjan (2008, p. 461) one of the major goals of BI is to automate and
integrate as many steps and functions as possible all way from pulling the data from
different sources to the final analytics. Many of these processes such as ETL can be
automated but it is obvious that analytics require some level of human input and also an
organizational structure to support it (Burstein & Holsapple 2008). Building these
automated processes, adjusting them to changing environment and also designing tools
and applications need input from various people every day.

28
3.1.3. Strategic, tactical or operational BI?
Decisions can be divided into three levels. Strategic decisions are the highest level
decisions focusing aiming to the long-term goals. These decisions answer for example
questions like where a company should operate geographically and which products it
should keep in its portfolio. Tactical decisions support strategic decisions and they tend
to be medium-term decisions. An example of a tactical level decision could be a choice
between company‟s own Business Intelligence servers and outsourced servers.
Operational decisions, like which rights are given to certain BI user group, are made
every day and they support tactical decisions. (Bhushan & Rai 2004.) Business
Intelligence can be divided in the same terms to answer the information needs of
making different decisions. In Table 3.1 the business focus, the primary users, the time
frame and the data type are presented for three types of Business Intelligence.
Table 3.1: The three types of BI according to White (2006).
STRATEGIC BI TACTICAL BI OPERATIONAL RIGHT-TIME BI
Business focus
Achieve long-term business goals
Manage tactical initiatives to achieve
strategic goals
Manage and optimize daily
business operations
Primary users Executives and
business analysts
Senior managers, business analysts,
and LOB3 managers
LOB managers, LOB users, and
operational systems
Time-frame Months to years Days to weeks to
months Intra-day
Data Historical metrics
(KPIs4)
Historical metrics Right-time metrics
The level on which corporate‟s Business Intelligence operates is usually related to the
maturity of the existing BI solutions. Usually organizations which are just getting
started focus more on ensuring that tactical information needs are met. After this is
guaranteed they start to move towards more strategic approach of BI. (Hostmann 2007.)
According to Friedmann and Hostmann (2004) it is crucial for BI or any other IT
investment‟s success that it supports the strategic goals and the objectives. The strategic
BI is usually connected to a buzzword Business Performance Management (BPM),
3 LOB = Line of business
4 KPI = Key business statistics, which measure a firm‟s performance in critical areas (BusinessDictionary
2010).

29
which originates in the beginning of the 2000s. In a nutshell, the basic idea is to find out
how well business is doing and what it could do to act better. Burstein and Holsapple
(2008) support a longer-term view emphasizing that information should be interpreted
in the terms of strategic and tactical objectives. These reasons may be why operational
approach to BI has been set aside in the first wave of Business Intelligence solutions.
(Burstein and Holsapple 2008.)
However, integrated data and analytics are needed in operational environment as well.
The operational BI has a strong linkage to another buzzword, Business Activity
Monitoring (BAM). BAM focuses in the other hand more on the operational
performance and the actions. (Burstein & Holsapple 2008.) The requirements of
operational BI are more demanding to the technical execution. For operational decisions
it is crucial that the data is up-to-date and therefore the data warehouses which BI uses
should be in the real time. The requested extracts from the operational systems should
be kept to a minimum at the same time because the operational work should not be
interrupted. With today‟s solutions the data latency is a real problem of operational BI.
Also there might be problems with the quality and the integration of data because there
might not be time to validate the data at a desired level before using it. (McKnight
2007.)
There are distinct views whether Business Intelligence should answer operational needs
of decision-makers. Some authors say that BI should adapt to different needs, no matter
if they require real time information or not. They usually emphasize decision-makers‟
needs of immediate information. (McKnight 2007; Burstein and Holsapple 2008.)
Sherman (2004) questions the need of real time analytics. He points out that most
people are reviewing trends over a period, and in these cases frozen data is adequate.
Because real-time approach would increase the noise and decrease the quality of data,
he doubts that if the decision-makers could act reasonably based on real-time data.
(Sherman 2004.) As shown in Table 3.1, the primary users of operational BI are LOB or
operational system users. Therefore the number of operational BI users is remarkably
higher than in strategic or tactical BI. Increased number of users demands more resource
from the BI and increases different costs such as licenses, maintenance and education.
Massive amounts of operational data may also result in a way of thinking that all the
data is needed store in the data warehouse. However, business users care only their own
needs, not anything other. If business initiative of BI is forgotten, the data warehousing
may end up being very costly. (Sherman 2004.)
It is clear that one cannot dump the long-term or the real time operational view of
Business Intelligence. However, usually the limited and small resources of BI are
focused more on the strategic decision-making. This statement is supported by the
results of different BI surveys. For example, according to the research made by BARC
(2008), BI solutions were least used in operational departments such as purchasing,
logistics and production.
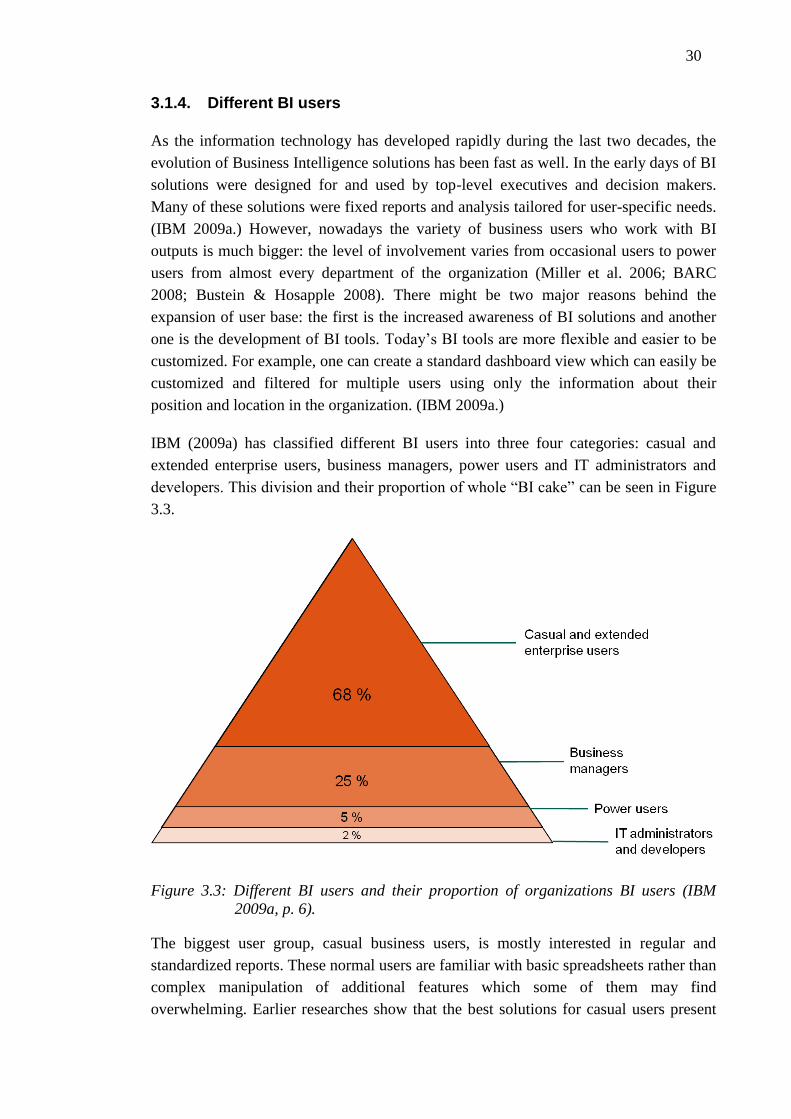
30
3.1.4. Different BI users
As the information technology has developed rapidly during the last two decades, the
evolution of Business Intelligence solutions has been fast as well. In the early days of BI
solutions were designed for and used by top-level executives and decision makers.
Many of these solutions were fixed reports and analysis tailored for user-specific needs.
(IBM 2009a.) However, nowadays the variety of business users who work with BI
outputs is much bigger: the level of involvement varies from occasional users to power
users from almost every department of the organization (Miller et al. 2006; BARC
2008; Bustein & Hosapple 2008). There might be two major reasons behind the
expansion of user base: the first is the increased awareness of BI solutions and another
one is the development of BI tools. Today‟s BI tools are more flexible and easier to be
customized. For example, one can create a standard dashboard view which can easily be
customized and filtered for multiple users using only the information about their
position and location in the organization. (IBM 2009a.)
IBM (2009a) has classified different BI users into three four categories: casual and
extended enterprise users, business managers, power users and IT administrators and
developers. This division and their proportion of whole “BI cake” can be seen in Figure
3.3.
Figure 3.3: Different BI users and their proportion of organizations BI users (IBM
2009a, p. 6).
The biggest user group, casual business users, is mostly interested in regular and
standardized reports. These normal users are familiar with basic spreadsheets rather than
complex manipulation of additional features which some of them may find
overwhelming. Earlier researches show that the best solutions for casual users present

31
information clearly by using simple business terms rather than technical jargon. Their
BI solutions should be easy to access, easy to use and they should fit their users‟ daily
work without an additional effort. The integration with company‟s internal search
engines or familiarity of web-based interfaces are just few things to be mentioned how
to lower the barrier of using new solutions. (Sherman 2003a; Sherman 2003b; Burstein
& Holsapple 2008; IBM 2009a.)
The second biggest user group, business managers, has different needs than casual
users. The business managers need both high-level but also lower, more detailed-level
information. They are usually interested to observe their numbers from different angles
and dimensions, such as business type or product group and drill down from higher
level to lower level information. Although the business managers need more analytical
reports and tools, their needs have remained quite the same over a time. (IBM 2009a.)
IBM (2009a) put executives in the same category with business managers because their
needs are quite close including standardized but a little more analytical reports. Of
course the reports of executives are usually more custom-coded and specified for their
particular needs. However, Sherman (2003b) puts that most executives have their own
efficient and dynamic BI tools, their staff. This implies that executives would only need
high-level information related to their key initiatives via dashboards. Neither of these
views is wrong, it just depends on habits of the executives: there are executives who are
more technically-orientated and more interested to do their own analysis and there are
also executives who are totally satisfied with the standardized high-level information.
Power users, as the name indicates, are the users who use BI applications daily and
demand usually the most sophisticated BI solutions. Typical power users are business
analysts, controllers and some product managers who have Profit & Loss Statement
(P&L) responsibility. These people need to go beyond the basic reporting and find the
correlations and answer “why?” and “what if?” questions. These analyses need more
sophisticated tools like OLAP cubes and scenario modeling of which an average
business user could not care less. The power users also include other analysts like
statistical and financial analysts who need tools for example for their data and text
mining. (Sherman 2003a; IBM 2009a.) As the development of BI tools has been rapid,
Sherman (2003a) questions the true need of them in some occasions. He claims that
sometimes the power user may be too interested in the tools than the real business
needs. This is why the department answering for the tools should be aware of different
possibilities and what they really need.
The last and the least user group includes the IT administration and the BI developers
who are in responsible of the Business Intelligence solutions. This group might have
some self-service reporting, which however may be neglected as the needs of the
business users must be answered. (IBM 2009a.) However, BI‟s self-reporting is
important because reporting service should be controller as well. Many times the
number of different reports explodes as BI department tries to answer all arising

32
business needs. The needs and demands of different tools should be carefully examined
because people do not always actually know what they really need to meet their
objectives. According to Eckerson (2003), 75 % of users of historical data principally
use only routine reports that describe what happened. This figure gives an insight to the
true needs of most BI users.
3.1.5. Towards collaborative BI
As mentioned already in the introduction, Business Intelligence implementations in
many organizations are often done separately and therefore these solutions lack the
mutual integration. In large corporations there can be multiple BI systems each having
for example their own tools, processes and data architectures (Wu et al. 2007). Another
problem that BI often encounters is a lack of business initiative. In these
implementations Business Intelligence is decoupled and in desynchronization from the
business and operational systems where actually the initiative of BI should lay. Only
independent knowledge workers are in responsible of BI activities and the results do not
satisfy the needs of business. (Veryard 2005.)
A step towards a better BI is taken when different BI enquiries are taken as services.
This perspective emphasizes the importance of decision-making support and internal
service role of Business Intelligence. Veryard (2005) defines this as “Embedded BI”.
Next step is “Integrated BI” when a company can coordinate different BI activities with
one another and synchronize them with the business and the operations as well. In this
case the resources of BI can be used more efficiently and for example overlapping
projects can be avoided. To get the most out of the Business Intelligence, its functioning
should be well orchestrated and the collaboration between knowledge workers should
be smooth. This level of BI Veryard (2005) calls “Collaborative BI”. These four levels
of BI are summarized in Table 3.2.
Table 3.2: Four levels of BI according to Veryard (2005).
synchronized with business and operational
systems
internal coordination
between enquiries
federated management or
governance structure
STAND-ALONE BI
EMBEDDED BI X
INTEGRATED BI x x
COLLABORATIVE BI x x x
Veryard‟s categorization is following quite well how the BI is organized in companies
in practice. The stand-Alone and the embedded BI describe well a traditional case where
is multiple separated departmental BI solutions have been implemented. Depending on

33
the business initiative, the level of business synchronization may vary but there is
usually no or only little coordination between different BI solutions. However, these
implementations may answer needs of business users‟ well because they are often
custom-built for users‟ particular needs. The integrated and the collaborative BI
solutions demand more centralized BI organizations. Centralizing at least IT
infrastructure one can achieve cost reductions but to get even more results from the
collaborative BI one must have to centralize BI-related decision-making. The standards
and the best practices of the analysis tools and the investments, broader coverage of BI
utilization and reduced costs are just few benefits to be mentioned. However, there is
always a trade-off between business users‟ flexibility and efficiency when the
implementation of centralized BI organization such as Business Intelligence
Competency Center is regarded. Business users will not easily embrace the
consolidation which is why the change management will add more costs and require
more time. (Sherman 2004; Ballard et al. 2005.) The centralized concept of Business
Intelligence Competency Center will be discussed in more detail next.
3.2. Business Intelligence Competency Center
3.2.1. What is BICC for?
Originally the name of “Business Intelligence Competency Center” concept was used
by research group Gartner in the beginning of 2000‟s. Like mentioned in previous
chapter, Business Intelligence Competency Center (BICC) is a centralized organization
specialized in running and supporting the BI functions. Most authors and organizations
refer BICC to a cross-functional team consisting of analysts, business subject matter
experts and technology or IT staff. This was also a part of original definition of BICC
by Gartner (e.g. Miller et al. 2006; Graham 2008a; Baars et al. 2009 Hitachi 2009; IBM
2009b). The fundamental idea is to combine different competencies and skills with
BICC (Figure 3.4). In the literature, BICC has established itself as the generally used
name but still it is known for example as Centre of Excellence (COE), Competency
Center (CC), Center of Knowledge or misspelled as Business Intelligence Competence
Center or Centre. (Cognos 2006.)

34
Figure 3.4: BICC combines different competences (Miller et al. 2006).
There are two main ideas which the concept of BICC builds on. The first is to combine
organization‟s different BI efforts together to obtain more efficient and effective
Business Intelligence. With a BICC organization the goal is to have repeated BI
deployments which are tied together as a BI program rather than the sum of separate BI
projects (Cognos 2006; Hitachi 2009). The benefits of these are discussed in more detail
later. The second idea is to complete different competencies of the human capital to
obtain a better support of decision-making. (Miller et al. 2006.) In most of the times the
initiatives and the coordination of Business Intelligence solutions have been based on
the IT department (Miller et al. 2006). This creates a good technical competence base
for Business Intelligence solutions which is without a question an important thing but IT
specialists tend to lack the understanding of the particular business. Usually the attitude
against the IT department is also initially wrong and technical jargon used by IT does
not help the promotion of BI either. (Bashein & Markus 1997.) A formal organization of
BICC tries to answer this problem complementing different competencies of IT,
business and analysts by putting them to work together. Ranjan (2008, p. 463) has said
that one of the reasons “behind a successful BI is a tie between business and
information technology”. This view is widely accepted for example by Sherman
(2003b) who says that “good relationship between IT and business users is important”
and by Miller et al. (2006) who put that a BICC works as linking pins between the user
side and the infrastructure provision.
Miller et al. (2006, p. 36) have listed comprehensively the functional areas in the BICC
(Figure 3.5). All of these eight functional areas are covered and agreed by many authors
and faces (e.g. Strange & Hostmann 2003; Cognos 2006; Graham 2008a; Hitachi 2009;
HP 2009; IBM 2009b) although the categorizing and the naming practices varies a little.
In practice, very few Business Intelligence Competency Centers are covering all of
these functionalities and the centralized functions usually vary case by case. Anyhow,
all of these functions should be cover in some way in every organization no matter who
is in responsible after all. (Miller 2006.)

35
Figure 3.5: Functional areas in the BICC (Miller et al. 2006, p. 36).
Business Intelligence Program is the primary function of BICC which oversees and
coordinates the BI activities so that the BI strategy is executed and the objectives are
met. It is the interface to the business units by defining the needs and also by sharing BI
knowledge throughout the organization. Data stewardship and data acquisition are
related more technical side including data warehousing, administering metadata,
integrating data and being responsible over the data quality. BI delivery includes taking
care of different tools and applications to deliver and distribute the information. This
actually transforms the data in warehouses into Business Intelligence that can be utilized
by the business users. Support function covers supporting different BI problems. In
most of the time the problems are not related to BI so they are usually passed forwards
to the general service desk or the software vendors. Training function is in responsible
of training business users both BI concepts and applications. In some organizations
training function may be in responsible of the certifications as well. Last function is to
handle license- and contract-related issues which are remarkable part of BI because it is
so IT-orientated all the way from the data warehousing to the interface with business
users. (Miller et al. 2006.)
The diffusion of BICCs has been studied mostly by the advocates of it. In 2005
BetterManagement‟s survey referred by Miller et al. (2006) showed that 23 % of
companies had implemented a BICC. In 2006, according to Computerworld‟s (2006)
survey 20 % of enterprises with more than $500 million in revenue had implemented a
BICC where only 6 % of companies with less than $500m in revenue had it. Chew &
Fuchs (2007) approximated a year later that 20 to 30 % of large and medium-sized
companies have a formal Business Intelligence Competency Center. Although the
diffusion of BICC has been quite good, according to research done by BARC in 2008,
42 % of 271 respondents were not familiar at all with the concept of BICC before the

36
study. This strong duality is remarkable considering that BICC has been proved to
improve BI efforts in many cases (e.g. Barlow 2006; Computerworld 2006; BARC
2008). It may be that many respondents and organizations behind the surveys share
different names or definitions of BICC although they are talking fundamentally about
the same thing. Another possibility is that BICC has been ignored among many other
hype terms related to Business Intelligence and Performance Management during the
last decade (Bitterer et al. 2007). The measurement of Business Intelligence and its
efforts‟ on ROI is not straightforward as well, which may increase suspicion towards the
results of BICC implementations (Lönnqvist & Pirttimäki 2006).
3.2.2. BICC organization
The key thing that distinguishes BICC from other embedded, integrated or collaborative
BI attempts is its formal organization. Graham (2008a) emphasizes that for sustainable
information empowerment one needs to have a formal organizational structure because
the information requires ongoing maintenance and support. According to surveys, in
most of the times BICC is an established department under IT department or a virtual
but formal cross-department group working together. Established separate departments
are more popular in bigger companies what is understandable considering their bigger
resources. Embedding BICC to company‟s organizational structure may also differ:
BICC members may vary project by project or BICC may be a staff function.
(Computerworld 2006; BARC 2008.) In most of the occasions BICC organizations are
established initially with part-time roles filled by individuals who have other
responsibilities. This may put a label of some department on BICC and default its
neutrality if the roots are strongly based on one department. These part-time roles
usually evolve into full-time positions over a time if the early efforts of BICC have been
successful and there is a clear need to expand formal and permanent BICC. (Graham
2008a; BARC 2008.)
Because BICC is a cross-functional group, many authors recommend it should have
executive or Vice President -level sponsorship (e.g.; Miller et al. 2006; Henschen 2008;
Hitachi 2009; HP 2009; IBM 2009). This sponsorship should ultimately guarantee that
new actions have business initiative. A high-level sponsorship also improves
organization‟s buy-in of BI and makes sure that the BI actions have alignment with
organizations strategic goals as well. In traditional profile of BICC the executive level
sponsor is either CIO or CFO who is also a member of the steering group or committee
that controls the work of BICC. The steering group should also have other high-level
business decision maker members who are used to rely on analytic information and are
ready to act as sponsors and the change agents of BICC. (Cognos 2006; Henschen 2008;
HP; 2009; IBM 2009.) The idea of including key consumers in the steering group from
all the areas such as finance, operations and marketing is tempting but in practice the
efficiency of decision-making suffers as the headcount of steering group increases. One

37
should try to find another ways to get sponsors and change agents behind the BICC of
those groups who have been left outside the steering group.
The staffing of Business Intelligence Competency Center depends mostly on the
objectives and the functional areas that BICC is wanted to cover. Like other staffing
questions, in BICC it is not only about the skills and knowledge which people have but
about the overall competence which covers also the behavior of individuals. (Miller et
al. 2006.) An ignored issue in the literature considering the staffing of BICC is the
background of individuals. Selling the new concept of centralized BI to business is
easier if people from both parties share similar work experience or they have done
business together. Conversely, earlier disagreements or power struggles may create a
rocky road to success.
The literature suggests many different roles to BICC‟s own organization and some
supporting roles from out of it (e.g. Miller et al. 2006; Graham 2008b; HP 2009). One
thing they have in common is the need to answer the recognized necessity of IT and
business alignment (Rockart et al. 1996; Bashein & Markus 1997; Reich & Benbasat
2000). Understanding the business, such as their currently pressing issues and KPIs,
helps BICC to answer the needs of business users better and therefore promote their
commitment. Another thing the literature agrees on is the need for clear leadership of
BICC. This person has obviously overall responsibility of BICC‟s functions but first of
all he or she makes sure that the centralized BI actions are coordinated with one another
and BI strategy is followed. (Miller et al. 2006.) Once again, to make sure that BICC
has business initiative, some authors suggest that the BI team leader should have a
business background with strong technological understanding (Graham 2008b).
3.2.3. Benefits of BICC
Although the concept of BICC is almost a decade old, it has not been under intensive
academic research. The benefits of BICC have been brought out mostly by the
advocates of BICC but there are also a few research results of BICC implementations
available. However, most benefits of BICC are self-evident and understandable with
common sense, at least if BICC would function ideally.
The first and already earlier emphasized benefit of BICC is its capability to have a
wider strategic impact. A common plan for BI deployments helps in the prioritization of
projects and therefore helps in steering a big ship into the right direction. With BICC the
standardization of KPIs through the whole organization is much easier than with
separate departmental BI solutions. This standardization helps business to response to
external changes more effectively. (Barlow 2006; Cognos 2006; Ranjan 2008; Hitachi
2009; IBM 2009.) Baars et al. (2009, p. 10) put that for decentralized BI organizations it
is not impossible to enforce enterprise-wide stipulations to have a strategic impact, it is
just much harder to do so. However, the strategic benefit of BICC does not come out

38
from the few surveys made of BICC (Computerworld 2006; Miller et al. 2006; BARC
2008).
A self-evident benefit of BICC which is also proven by surveys is reduced costs
(Computerworld 2006; Miller et al. 2006; BARC 2008). In most BI environments there
are multiple BI systems each having their own tools, overlapping projects and IT
infrastructure. As BI covers all business functions and managerial levels, the technical
and the organizational complexity increase as well. (Wu et al. 2007; Baars et al. 2009.)
A BICC makes it easier to reduce the redundancy of on-going investments and therefore
reduce overhead costs. Other functions and services are also cheaper to produce
centrally because these are usually very labor-intensive operations under small load.
With centralized BI the negotiation power and the economies of scale are better when
the software and the license contracts are made. If the processes are standardized and
the best practices have been taken in use, one may also obtain cost reductions due to the
smaller lead time of BI deployments and projects. (Cognos 2006; SAS 2006; Hitachi
2009; IBM 2009.)
Business users, the customers of BICC, are more interested in the better outputs than
decreased costs. Data quality issues, such as master data management and data validity,
often improve when a step towards BICC is taken. This results in fewer information
disagreements and in best case the single version of the truth may be obtained instead of
multiple truths on which business users are hard to count. When the data is mastered
well, it gives BI developers also possibilities to use it more efficiently and therefore to
offer new possibilities for analytics. (Baars et al. 2009; Hitachi 2009; IBM 2009.) In
addition to better quality of data, implementing common terms and definitions help
business to communicate with each other (Graham 2008b). Another visible
improvement to business users with BICC are smaller lead times of BI deployments and
projects. Sharing the best practices also improves the quality of deployments and may
decrease the risk associated with new implementations (Ranjan 2008). As mentioned in
earlier chapters, most of the BI users appreciate the ease of use of BI applications. Tools
may remain the same but standardization of different tools usually improves the support
from BICC but also from the colleges which is why end-users learn tools faster and
become productive more quickly (Ranjan 2008; IBM 2009).
Many of these improvements, such as the strategic impact, reduced costs and better
outputs feel rational but after all of their true impacts are hard to be measured or
quantified. Because determining the exact ROI of BICC implementation is impossible
in practice, Chew and Fuchs (2007) have listed few success factories that are related
moving towards centralized BI and which are easy to measure. A high degree of the
number of reports and analyses in relation to the number of business users indicate the
efficiency of BICC and redundancy removed compared to previous departmental
solutions. Also, one can easily measure the costs of producing BI outputs and decreased
number of different tools and service providers which usually indicate decreased costs
39
as well. The strategic impact and also the quality of BI outputs can be mapped by the
number of business users using the BICC facilities. (Chew & Fuchs 2007.)
3.2.4. Downsides and obstacles of centralized BI
The downsides of moving towards centralized BICC are mostly well ignored in the
existing literature because the authors of BICC have been also the advocates of it. The
advocates of BICC have approved the fact that one size does not fit all (e.g. Cognos
2006) but they have not brought out the point that in some occasions it may be smarter
to keep the current state of decentralized and departmental BI. Baars et al. (2009) says
that it is still unclear under which conditions a BICC should be preferred over a
decentralized approach. To find the right balance between the centralization and the
decentralization, Ruddy (2006) listed “rightshoring” as one of ten BI trends already few
years ago. The idea is to determine the right mix of onsite, offsite and offshore work in
particular case.
It is clear that more centralized solutions and increased standardization of tools, reports
and processes reduce the flexibility of end users of BI. With a local departmental BI
solution a business user can get more easily a custom-made and user-specified report
that answered his or her needs perfectly. In transition to BICC this end user may have to
relinquish this report or at least the technical support of it. In the worst case, the
standardizations and the reduced number of available reports may result in even worse
decisions. In most occasions also different tools for local needs have been implemented
over the time. Again, the standardization may reduce flexibility and business users may
even lose crucial functionalities in transition to corporate-wide tools. Sometimes one
may face problems with managers who resist providing new tools to their subordinates.
The total costs of ownership and the hidden costs should be carefully considered and
examined: for example training and learning a new tool take always both time and
money. First of all, one should think how the standardization affects on the business
users‟ capabilities to do their daily job. It is obvious that they are not going to embrace
the consolidation easily: change resistance and change management will increase costs
and need more time. (Sherman 2004; De Voe & Neal 2005.)
There are other challenges than the standardization related to full deployment of BI
through BICC. Setting up a competency center requires skilled and available people.
Although previous BI decentralized efforts have needed their resources as well, the
competencies of these people may not meet the demands of running a centralized BICC.
Also many resources may be strongly tool- or process-related which make it hard to
embed them to BICC. There might also appear some cultural resistance within
departmental BI units: concerns about the future and the changes in the way of doing
things are just few to be mentioned. There are also big technical challenges in
integrating and consolidating data warehouses: for example the data may not be timely
correct or it may not be clean after consolidating it. Problems with data quality may

40
results in loss of credibility with end users if they are used to the single version of truth
and clean data. Rebuilding trust is a major challenge just like with external customers.
The last major challenge faced in transition to BICC is unclear results. Showing a clear
cause-and-effect relation to the managers is difficult and getting remarkable visible
results may take a lot of time. (De Voe & Neal 2005.)
3.2.5. BICC implementation as an organizational change
BICC implementations and transitions to centralized BI solutions have not been under a
heavy academic research as mentioned before. However, multiple BICC advocates have
written about the implementation process and how the organizational change should be
dealt. These guidelines of BICC implementations follow quite closely the points that
more general research of organizational change and change management have
presented: high-level sponsorship, careful planning, creating and communicating a
vision, expanding the scope and sponsorship after successful smaller steps etc. (Cognos
2006; Miller 2006; Chew & Fuchs 2007; Henschen 2008; Hitachi 2009; IBM 2009.)
Millet et al. (2006) have even created a three-stage framework for BICC
implementation which follows Kurt Lewin‟s model almost identically. However, two
things are remarkable considering the existing BICC literature: only little has been
written about establishing a readiness for a change and institutionalizing the change, and
very few authors have considered the resisting and the change promoting forces from
the perspective of the end users of BI applications.
Kotter‟s (1995) or Lewin‟s model (Pinnington & Edwards 2000) both start with a stage
of creating readiness for a change. BICC literature argues well the justification of
centralized BI and how it should be sold as support organization to top-level managers
but it does not consider how business users‟ sense of urgency should be established. De
Voe & Neal (2005) among many other authors just focus on emphasizing the
importance of effective communication and argumentation for why the change is worth
of efforts but they do not bring out any concrete arguments to be used. The three-stage
BICC implementation model created by Miller et al. (2006) has even own phase for
creating readiness of change but again it deals almost only with creating the sense of
urgency among top-level managers.
Chew and Fuchs (2007) suggest that BICC needs quick results in its early stages but if
earlier BI solutions have been adequate it is much harder to convince why the step
towards centralized BI should be taken. Cognos (2006) suggests that a pilot project
should be executed and then possible positive results should be communicated. It may
still be hard to argue the very first steps of moving towards centralized BI if there is not
too much to be complained about the status quo. Therefore in a pilot project one should
be able to create a superior BI solution to business users that overcomes their
expectations. However, developing a new BI solution may be hard to be funded if
earlier solutions were adequate for business. (Cognos 2006.)

41
HP (2009) is one of the only faces who pay attention to the importance of group
dynamics and individuals in creating the readiness and institutionalizing the change
towards centralized BICC. They suggest that BICC‟s team members from business
should become sponsors of the change initiatives and change agents who drive the
cultural change and try to overcome the resistance. BICC‟s team members from
business should represent key consumers of information from finance, operations, and
sales and marketing. (HP 2009.) This kind of participation and engagement is familiar
from the literature of more general change management but it has not been widely
discussed in the literature of BICC and centralized BI. In addition to participating
different key consumers of information, HP (2009) suggests that senior HR
representative is often overlooked resource during the change process who could help
for example with culture change issues.
The extensive literature review of chapters 2 and 3 has covered both the change
resistance and the change management research, and it has also discussed the basics of
Business Intelligence and centralized Business Intelligence Competence Center to
create an understanding of case environment‟s different characteristics. The literature
review of BICC showed that the existing theory of BICC does not answer the question
of end user engagement very comprehensively, and especially it lacked concrete means
and methods which could be used to enhance the engagement in transition to centralized
BI. However, more mature change management literature with its multiple theories and
researches gives a good basis for examination of business user engagement to BICC
through the research material.

42
4. RESEARCH METHOD AND MATERIAL
4.1. Case method and research material
4.1.1. Material collection
As mention in the introduction, the constructive research approach was taken to answer
the questions of more applied research. A case study gives a chance to get rich
qualitative research material which helps answering the practical “how” research
questions in the case context. Participating the daily work in the case company and
especially dealing with the problems that are very close to the research questions
offered a great chance to get rich material by observation. The personal interaction with
business users helped in creating mutual trust which enabled also completing
observations with unstructured and informal interviews and questions. The dual
practitioner-researcher role not only gave a good access to data but also gave the
knowledge of organization which helped in collecting material through observation and
interviews and creating the case descriptions. However, as a practitioner-researcher
some actions may have been promoted during the observations which may have caused
little biased research material.
The research material of this thesis is divided into two as the material is based on two
different BI solution development projects: PAS management reporting and FC
management reporting (Figure 4.1). The researcher had a dual participant-observer role
as he was a member of case organization since March 2010 when the second examined
project was kicked off. Although there was a possibility to continue observations even
after the project, research material collection was cut in the end of July due to tight time
scale of the research. At this time the testing of FC‟s developed BI solutions was just
about end. The material and description of the first project, PAS management reporting,
is based on the unstructured interviews of particular project‟s manager. The first project
was run in 2009 which is approximately one year before the second project. One-year
time span between the project and the interviews may result in an incomplete case
description where something is missing or forgot. Since March 2010 the observations
were made by the researcher considering the daily post-project actions.

43
Figure 4.1: The projects and the collection of the research material.
The second project, FC management reporting, was carried out in 2010 about a year
after the first one. Because the researcher was the project manager himself, most of the
notes were made immediately as they occurred during the training sessions. Multiple
notes and memos were also saved from different meetings. When needed, the notes
were completed by asking different business users and stakeholders certain questions in
the next meeting, by phone or by email. The researcher participated as project manager
almost everything that was related to the project which made possible to collect very
rich research material. Being a member of organization and working daily with
particular issues made the access to the data and information really good. According to
Yin (2009) this creates a good base to obtain holistic and in-depth view of the case.
4.1.2. Interviews and observations
The material of the execution of PAS management reporting project and the day-to-day
actions until March 2010 was obtained completely by interviewing the manager of
particular project, present reporting manager of Metso Automation. The project
manager himself was also one of the future solution‟s business users at the time of the
development project which made possible to get end in-depth end user‟s point of view.
One major interview was made and it was filled later with multiple informal
discussions. The interview itself was also very informal structuring on open-ended
questions which were verging on casual discussion sometimes. An extract from the
interview notes can be seen in Appendix 1. There was also almost daily interaction
between researcher and the project manager which made possible to double-check
issues and complete the case description if needed. Because PAS management reporting
project was carried out only by two persons of whom another one had changed his
employer before the time of the interviews, the first case description could not be
completed with other interviews. Another factor that weakens the reliability of the
research is the fact that there was over a year between the execution of PAS
management reporting project and the interviews. Some things may have been forgotten
or some unique things may have been emphasized too much.
The research material of FC management reporting project was collected during the
project meetings and the training sessions of business testers. In multiple project
meetings a Business Controller, who was also a future end user of particular project‟s
solution, was asked single questions as they arose. Notes were made also during the

44
training sessions on the basis of observation and single questions. Because the training
sessions during the research process were arranged only for people who were attending
the testing, the attendees represented only one homogenous group of future business
users: the testers were Controllers being responsible for different areas, product lines or
sales and service reporting in general. The total number of trained end users during the
research process was eleven. Because most of the interviewed people and people who
were participating the meetings and the training sessions were already or the future
business users, one could get a good end users‟ point of view for the research material
of both PAS and FC management reporting projects.
Observation notes were also made during multiple miscellaneous meetings covering
topics of reporting in general, other development projects, working methods of BICC
and data warehousing. An extract from these notes can be found in Appendix 2. These
meetings were attended by mostly data warehouse architects and report developers but
also by some business representatives who were already using developed management
reporting solution or who were going to be use it in the first place. The notes from these
meetings encompassed day-to-day work of Business Reporting Team rather than single
development projects. Therefore these notes completed the research material of both
PAS and FC management reporting projects.
Typical methodological limitations are related to the interviews and the observations of
this thesis. For interviews there is a chance that poor questions have been asked.
Because the researcher was a new member of particular organization, there is a chance
of reflexivity of both the interviews and observations: the presence might have caused
change in what people did or what they said. Also, as the time went by and the
organization became more familiar to the researcher, some basic questions might have
been forgotten to be asked or during the observation some facts might have been missed
as they have seemed too obvious or common. The documentation tools were not very
highly structured to build consistency and quality control. However, constant direct
observation gave a chance to record the events in their real context and also in real time
which is definitely a clear benefit of the used research method.
4.1.3. Material analysis
The analysis of qualitative data is considered to be a demanding process and there is no
standardized procedure to do it. However, there are multiple ways available to get
something out of the collection of non-numerical and non-standardized data. Saunders
et al. (2009) have divided them into three main types: summarizing data, categorizing
data or structuring data using narrative. Data summarizing aims to bring out the key
points and themes and possibly identify relationships between them. Another way is to
categorize chunks of data into predefined or self-created categories and then recognize
relationships or develop the categories further. Data can be structured using narrative
that organizes the data temporally and with regard to its social or organizational context.

45
These main procedures can be used on one‟s own or they can be combined to support
the interpretation of qualitative data. (Saunders et al. 2009.)
In this thesis, the shattered data from observations and interviews is first put in the form
of stories. Two narratives are built from the perspective of project manager to give a
rich description how the BI development projects proceeded, which methods of
engagement were used and which challenges were met. Because there is very little
written about BI solution development projects, these stories give a great chance to
compare two separate but almost quite identical projects and to compare how the means
and methods differ as company moves towards centralized BICC.
After the narratives the data of both projects are put together categorizing it using earlier
presented Lewin‟s change process framework. Although the framework is not just
simple three-stage model for change management, it can be used to categorize the
means and methods used during the projects and daily work of BICC into three
categories. Another goal in addition to categorizing the data is to find out relationships
between taken engagement actions and reflect it to the existing literature.
4.2. Case environment
4.2.1. Metso Corporation and Metso Automation
Metso Corporation is a globally operating Finnish technology and service supplier
specialized in mining, construction, power generation, oil and gas, recycling, and pulp
and paper industries. In 2009 Metso‟s net sales was 5,016 million euros declining 22 %
from the figures of 2008 due to the global economic crisis (Figure 4.2). Over 40 % of
net sales came from services. In over 300 units in more than 50 countries Metso has a
little over 27,000 employees. A little less than 50 % of net sales and a little more than
50 % of personnel came from entities of Europe. (Metso 2010.)
Figure 4.2: Metso’s 2009 net sales by customer industry (Metso 2010).

46
Metso has divided its business in its latest major organization restructure into three
segments: Mining and Construction Technology (MCT), Energy and Environment
Technology (EET), and Paper and Fiber Technology (PFT). This thesis‟ case
organization, Metso Automation (MA or ABL), is one of three business lines of EET.
Its products and services consist of energy and process industry automation and
information management application networks and systems, production process
measurement systems and analyzers, and more traditional control valves and smart shut-
off valves. In 2009 Metso Automation had 675 million euros in revenue. (Metso 2010.)
Metso Automation has two product lines: Process Automation Systems (PAS) and Flow
Control (Figure 4.3). In organization structure Flow Control Global is still divided into
Flow Control (FC) and Flow Control North America (FC NA). The biggest difference
between FC and PAS is the business type: PAS‟s business is project and service
business whereas Flow Control has also a lot of day-to-day sales business. Also a
significant difference between FC and PAS considering the topic of this thesis is the
physical location in Finland: most of the PAS business is located in Tampere whereas
FC is in Helsinki.
Figure 4.3: Metso Automation Business Line organization structure.
Both product lines share common marketing and communication and technology
functions. PAS, FC and FC NA are also tied together with regional teams. Finance and
administration, Business development and Human resources are also commonly shared
Metso Automation‟s support functions. Under Finance and administration, and Business
development one can find the essential roles of BICC: IT and Business Reporting Team
respectively.

47
4.2.2. Change from decentralized BI to centralized BICC
Until 2007 Metso Automation‟s Business Intelligence had been in its infancy. Most of
the people were not aware of more sophisticated BI tools and methods such as data
warehouses or OLAP cubes. BI solutions were mostly built on financial management
software and its Excel plug-ins which made them hard to update and coordinate. Also
multiple Notes Databases had been created locally of which existence most people were
not even aware of. People were in responsible of their own solutions which had no
centralized support or maintenance at all. Few a little more sophisticated solutions had
been created by FC North America but they had been left aside from bigger audience.
At first, there was no bigger decision for renewal of Business Intelligence in Metso
Automation. The initiative was taken in 2007 by PAS‟s contemporary Vice President of
Business Controlling and one Business Controller who both had earlier experience of
centralized and developed BI solutions. They started to create awareness of new
opportunities, methods and tools among PAS‟s personnel. After a while, in 2008,
Business Intelligence solutions were suggested to be taken under the control of these
two advocates when global Enterprise Resource Planning (GBI) project was in design
phase. However, this proposal was not taken into action and report requirements and
other BI needs of GBI project decided to be taken care of by separate BI and DW team
and different subject experts of the project.
In spring 2009 a green light was shown by Senior Vice President of Finance and
Administration to a separate pilot BI project proposal made by contemporary PAS‟s VP
of Business Controlling and Business Controller. The pilot project was focused on the
PAS‟s financial management data and reporting. The project‟s acceptance was great: it
was taken into use by PAS‟s management and also regional managers. After the
successful project forming static BI organization instead of uncoordinated doings was
suggested. The permission was granted and in January 2010 Business Reporting Team
(BRT) was formed under commonly shared Metso Automation‟s Finance and
administration department. In the spring GBI project‟s separate BI and DW team started
co-operation with BRT which could be considered to be the beginning of Metso
Automation‟s Business Intelligence Competency Center.
4.2.3. How BICC is functioning
The organization of Metso Automation‟s BICC is not yet completely formal although
Business Reporting Team and former BI and DW, present DW team, are co-operating
daily. Together the two teams cover all but advanced analytics of BICC‟s functional
areas presented earlier in Figure 3.5. Although MA‟s BICC is divided under two distinct
departments, Finance & administration‟s IT department and Business development, and
it has not common leader, BICC is controlled by a unified steering group led by Senior
Vice President of Finance and Administration. Other members of steering group are the

48
Vice President of Financial Development, leader of BRT, Vice Presidents of Business
Controlling of both PAS and FC, Metso Automation‟s head office‟s Senior Business
Controller, Metso Automation‟s IT director, PAS‟s project department director and the
leader of BICC‟s DW team. Steering group decides on project prioritization, resources
and funding of projects and daily work. So far the decisions considering funding affect
only on Business Reporting Team, and therefore only on the BI tools and Analytics
described earlier in Figure 3.2.
Because Metso Automation‟s BICC has not been operating for long time and there have
not been decent BI solutions available for business users, most of BICC‟s time is taken
by new BI projects which expand the business user base of BICC. Besides these
development projects BICC has to take care of the daily support and maintenance of
already completed and existing BI solutions and tools. This sets remarkable challenges
for time and resource allocation: on the other hand one should be able to complete
development projects faster to expand the user base and therefore increase BI usage in
organization. On the other hand, however, one should be able to guarantee with good
day-to-day actions that projects are not done for nothing and BI solution
implementations have been taken into use. In the future one should also be able to
convince business users that existing BI solutions and tools are maintained and
developed further.
4.2.4. The scope and the business users of case projects
The objectives of both PAS and FC management reporting projects were quite similar:
to make data of financial management consolidation tool available for analysis and
reporting via new reporting tool. In both PAS and FC financial figures were earlier
reported and analyzed through financial management consolidation tool with
spreadsheet program‟s plug-ins. This had had few problems, for example with reports‟
version management, availability and accessibility of reports and a lot of manual work.
The idea of new management reporting was not to refine or add any new data, but just
to make the same figures available in more user-friendly and in more functional
environment. New solution was also able to provide its users both the strategic and the
tactical BI by giving more possibilities to plot and filter the data. For PAS‟s project this
considered two different financial management models where as for FC the original
scope was about only one model.
In the first place predefined users of new reporting were the members of both business
lines‟ expanded management teams which included the business line presidents and
managers of product lines, sales and service, different regions, operations, logistics and
HR. Also some Business Controllers of particular responsibility areas were in the
original scope. These people are the ones whose engagement is under the closer
examination in this research. The idea was to provide these users few visualizing
dashboards including most important reports and OLAP cubes based on their specific

49
needs. On this basis one could say that the magnitude of the change was evolutionary
because both the scope and the amplitude of the change were relatively small. The pace
of the change was also relatively slow considering the magnitude of the change and the
used time.
4.2.5. Other notable from the case environment
One thing that should be considered more carefully regarding the case environment of
this thesis is the running global ERP project (GBI). As mentioned earlier, present DW
team of BICC plays a double role while they are still the BI and DW team of particular
project. During the GBI project this team has been responsible of building data
warehouse for the basis of reporting. These reporting needs has been collected
uncoordinatedly and there has been very little prioritization and long-term view by BI
and DW answering these needs. This has resulted in a situation where business needs
have been answered case-by-case creating custom-made solutions. However, in late
spring 2010 a decision was made that all further report needs from GBI project should
be channeled to BICC.
Although BICC is answerable for GBI project‟s future reporting needs, DW is still tied
to finish what they have started earlier. This ties valuable and finite resources from
other BICC‟s development projects. Also a global ERP project takes a lot of time from
different people from business. This makes it harder to find right resources and time for
business testing and training of new BI development projects.

50
5. RESULTS
The goal of this research was to find out different means and methods to overcome the
resistance of change and therefore enhance business users‟ engagement to Business
Intelligence Competency Center. The following narratives of both cases bring out
answers to all three research questions: how to engage business users to Business
Intelligence Competency Center, how means and methods of engagement differ
between BI development projects as company moves towards centralized BICC, and
what are the main challenges considering the engagement of business users to BICC.
The narratives give also a rich description from managerial view to BI development
projects of which have not been written much. After the narratives the second research
question is discussed. Then Lewin‟s three-stage framework is used to sum up the project
descriptions categorizing then arisen means and methods and reveal their mutual
dynamics. After that the third research question is dealt and the conducted research and
its results are discussed.
5.1. Project narratives
5.1.1. PAS management reporting
PAS management reporting project was a pilot project for centralized Business
Intelligence in Metso Automation: no other BI solution development projects had not
been done or was not in the sight yet excluding single report demands considering the
implementation stage of GBI project. The original initiative for PAS management
reporting project was made by PAS‟s contemporary Vice President of Business
Controlling and contemporary PAS‟s Sales and Service Business Controller, later the
manager of Business Reporting Team, based on their earlier experience on data
warehouse based reporting and its opportunities and potential. The project was mainly
run and managed by the Business Controller where the Vice President of Business
Controlling played more the role of a change agent. The project manager had earlier
experience of managing same kinds of DW based reporting projects which increased the
credibility of the project management in the eyes of the end users. The funding for this
new investment was applied from and approved by the president of PAS business line.
This ensured a good support from the top management for particular project.
The project was kicked off in late February 2009. Data warehousing, star-schemas,
framework models and reporting layer was created in co-operation with external
consultants. Actually the only additional person who participated from PAS during the
development phase of the project was the General Controller of PAS who had been the

51
process owner for PAS‟s financial management consolidation tool. She consulted the
project team in questions related to data structures and hierarchies that were used in
earlier reporting. She was also responsible of extracting the data from financial
management tool during the project. Despite her General Controller role, she was not
much in contact with PAS‟s expanded management team for who the reporting was
initially designed, and although she would have been more in contact, she did not have
chance to use the outcomes of the project. This may have created some dissatisfaction.
Most of the communication during the project to the expanded management team was
done by the Vice President of Business Controlling who was also a member of
particular management team. He informed the team in the beginning of the project about
what will be done in which timeframe, and during the project about how the project is
proceeding. He had a strong earlier experience and background related to business
reporting. On that basis one could assume that he was a credible change agent. In
addition, he had a chance for more personal encounter with the future business users as
a member of expanded management team.
By the end of May 2009 the financial management data was available for the new tool.
The tool was tested and the data was verified by the project manager himself. Based on
this data management dashboards were designed by project‟s manager and PAS‟s Vice
President of Business Controlling. In addition, comments for the design of dashboards
were asked from two other Business Controllers who were supposed to use both
dashboards and OLAP cubes by the time project was closed.
The dashboards and the OLAP cubes were received favorably and they were wanted to
be taken into use as quickly as possible. The functionalities and the possibilities of the
dashboards and the OLAP cubes, such as flexible drilling in hierarchical structure or
trend charts comparing different scenarios, offered users much more than they were
earlier provided. At the time new BI solution was introduced, most of the users were
positively surprised of its capabilities. Earlier some of the managers were only provided
fixed reports by their controllers but now they had a chance to take a look at the
numbers by themselves and create easily different kinds of reports with dynamic filters.
The training of the new tool was made-to-order rather than coordinately and together.
Only little training was provided to users and one counted on that users would contact
for more training due to close relation if they needed it. The functionalities of simpler
dashboards were gone through quickly in a meeting of the management team by Vice
President of Business Controlling and more complex OLAP cubes designed for
Controllers were trained separately by the project manager. Learning a new tool was not
a problem for business users because there had not been new tools to be adopted for a
long while and the tool was made to be used as easily as possible. Vice versa, people
were willing to adopt a new one that had better functionalities and capabilities than
previous solution with spreadsheet program‟s plug-ins. The adoption of a new tool was

52
even less painful because it had also a possibility to export reports and charts in familiar
spreadsheet program‟s format. Although the tool itself was made easy to adopt, it still
required a visit to another web page. This new Metso Automation‟s reporting portal was
made familiar-looking using Metso‟s default colors and logo to enhance its adoption.
However, it still lacked integration with other commonly used pages.
PAS management reporting project was closed in the end of May 2009 when
dashboards and OLAP cubes were in daily use of PAS‟s expanded management team.
The project was run in its original schedule taking a bit more than three months. Despite
a warm welcome and flexible report filtering according to users‟ rights and interests, the
user base of PAS management reporting did not expand much. Only a few people from
service business were trained and given access to the new reporting tool. The only
change in other close stakeholders was in the responsibility of data extractions from the
financial management tool, which was assigned to another Controller outside the user
base of new management reporting. This work is quite mechanic and it only adds a little
burden to the one concerned without giving any payback. Again, this may create some
dissatisfaction which may spread by word of mouth.
In the beginning of 2010 another model used in management reporting became invalid
and it was replaced with a new one which was common to whole EET segment. This
transition made some dashboards‟ list reports useless since newest data from 2010 was
not updated anymore. These reports were not vital for business because they were also
available from previously used finance management consolidation tool. However,
although this could not be considered to be normal maintenance of existing solutions, it
was likely to have a negative impact on satisfaction because new EET financial model
was still not yet supported in the end of July 2010. Also other further development of
PAS‟s management reporting has been frozen because BICC‟s other development
projects has taken all the time and resources. Despite the lack of another financial model
and development initiatives PAS‟s management reporting is under daily use and basic
support.
Because PAS‟s management reporting project was a pilot BI project in Metso
Automation a lot of uncertainties were related to it. One could not sell the project easily
because advocates of particular project and BICC could not assure that this new
reporting system will fly. One also did not have any concrete experiences or results
from other projects on which one could have rely on. However, after the project was
finished and a permission to launch other projects and to form a Business Reporting
Team was granted, users of PAS management reporting solution started to get a
confirmation that this could be the way how things are done in future. As a pilot project
one could also specify the content easily because it was started from a scratch.

53
5.1.2. FC management reporting
The decision of Flow Control business line‟s management reporting project was made at
the same time with the decision of forming Metso Automation‟s Business Reporting
Team. After a successful PAS‟s management reporting pilot project the Senior Vice
President of Finance and Administration of Metso Automation and EET segment, the
head of BICC‟s steering group, decided to expand new business reporting to Flow
Control business line. The purpose was to create same kind of management reporting
that was created earlier for PAS, but to include also a specified report folder which
could be used to automate monthly reporting. Because this was one of the first projects
of centralized BI, FC management reporting project had to follow the footsteps of
PAS‟s particular project so chasing the advantages of centralized solutions could be
started immediately. The funding was granted by President of Metso Automation and
EET segment which guaranteed FC management reporting project a true top-level
support.
Unlike in the case of PAS management reporting, some business users had seen and
heard from the previous reporting project. When the formation of BICC was granted, a
reporting workshop was arranged where mostly miscellaneous Controllers from both
PAS and FC were informed of the new reporting tool and solutions that were already
available and those that will be developed in near future. Few Business Controllers and
the VP of Business Controlling from FC management reporting preliminary user base
were attending the workshop. The workshop was called by Senior Vice President of
Finance and Administration which guaranteed again the top-level support. This
reporting workshop not only opened the way for new reporting but also strengthened the
feeling that this will be the tool and the way how reporting will be carried out in the
future in Metso Automation. In addition to this workshop, Service Business Controller
who was in preliminary user base of FC management reporting attended also another
BICC‟s development project considering new GBI reporting which was supposed to use
same tools. This constantly increasing coverage of new BI solutions is in important role
of institutionalizing the change. Wider coverage and expanded user base increased
people‟s awareness by word of mouth communication. However, on-going GBI project
and its separate report development from centralized BI may have had created confusion
of Metso Automation‟s BI practices and future development.
In the beginning of FC management reporting project the project manager, the
researcher of this thesis, was a novice considering business reporting issues. This could
have created some uncertainty among the business users when some questions about the
system and future reporting arose during the project that could not be answered
immediately and with confidence. Also the communication during the project faced a
challenge whether to inform business users earlier when things were more uncertain or
later when questions could be answered certainty but business users had to wait being
uninformed. Due to the inexperience of the project manager, he was supported by PAS

54
management reporting project manager so one could utilize the lessons learned from
PAS‟s management reporting project. For the first time, a framework and guidelines of
BI development project in Metso Automation‟s BICC was used in case of running FC
management reporting project.
Almost immediately after the approval for the project was granted, FC management
reporting was kicked off officially in the beginning of the March 2010. From Flow
Control business line a Business Controller and a business line‟s General Controller
were selected into the project team. A certain amount of their following months‟ time
was allocated also to the project. FC‟s Vice President of Business Controlling was also
participating some of the meetings which considered the scope of the project. In
addition to these meetings he was informed among the rest of the steering group of
BICC once in two weeks. Much of the work in the beginning of the project was done in
co-operation with FC‟s general Controller who was process owner of particular
financial management model and had the knowledge of business dimensions and the
access to extract the data from the original system. However, in April the General
Controller was not available for the project anymore. Since this FC‟s Business
Controller was the primary contact person and the responsibility of data extraction from
source was moved to Metso Automation‟s General Controller who was out of the
project‟s scope. Like in PAS management reporting, a person who did not benefit from
the project got new workload.
Data warehousing, star schemas, framework models and reporting layer was done in co-
operation with external consultants just like in the previous project. The testing of built
solutions was divided into two: project manager‟s testing and two phases of business
testing. In business testing some Controllers from the business user base were picked to
verify and validate the content of the dashboards and OLAP cubes. They were selected
so they represented the user base as well as possible covering the viewpoints of product
lines, area management and service business management. First they were trained for
the new tool and then they were given free hands and enough time taking their routines
to test the content of a new solution. Additional time for testing was needed to be given
because testing would have overlapped with Controller‟s busiest monthly reporting
period and with their holidays. Although this stretched whole project‟s timetable, it was
crucial because if too little time would have been given, dissatisfaction and resistance
may have arisen. Conversely, the additional time made possible to get more ideas from
business testers to develop existing BI solutions even better. Five different controllers
participated the first phase of business testing, and five more was included in the second
phase. An enthusiastic Area Controller who was left aside from this phase was even
asking why she was not able to participate the first phase of testing as she had heard
about the project somewhere else. This describes well the eagerness of end users that
was related taking the new BI solution into use.

55
Business users were engaged to the new tool participating them already in the testing
phase when they were given a chance to make suggestions and therefore to influence on
the functionalities and the content of their future tool. The change to influence on the
content was important because the reporting layer, which is actually the only visible part
to end users, was originally specified on the base of PAS‟s solution. Unlike PAS
management reporting project, this project encountered the trade-off between the
customization of solution and the standardization. These questions considered
everything from naming practices, for example whether to use Year-to-date or
Cumulative, to the actual content of the dashboards. Because FC‟s project was the first
one that was executed under centralized BI, in the end only little FC-specific
customization changes were made to PAS‟s solution. Despite this, the superiority of
new BI solution to the old ones was one of the major driving forces which made
project‟s selling to FC‟s business users really easy. Whenever and whoever new
solution was introduced, acceptance was warm and enthusiastic. The adoption and the
learning of new tool were also painless due to the same reasons than in the case of PAS:
there had not been new tools to be learnt for a while and the integration with the
existing systems was smooth.
During the testing when the content of the dashboards and the cubes were discussed
arose a need for operations‟ financial management model because a general EET wide
model was not able to answer operations‟ information demand. Although preliminary
user base for this new model was rather small, it was taken under the project to be
implemented. This kind of project‟s expansion created confidence in that information
demands are really listened and satisfied also in the future. On the other hand, there laid
a risk that the whole project would have been delayed if new model‟s implementation
encountered any unexpected problems.
Communication towards business users during the project was done from two sources.
The first contact was always made by FC‟s Business Controller so users got a feeling
that this project was not just another development project which had no business
initiative at all. After that the project manager was contacting business users to ensure
that they were given adequate trainings and they had straight communication channel to
the development. Informing about new management reporting had been still quite
unofficial within FC business line taking a place only in internal meetings between
Controllers.
At the time of FC management reporting project also other BI development projects
were kicked off and a clearer image of the future state of reporting in Metso Automation
could be pictured. Ever more people became aware of new solutions which increased
some of their expectations and lowered the chance of positive surprises. A concrete and
communicated vision considering FC management reporting was that in future data
would be extracted straight from the source system leaving the old financial
management consolidation useless for new reporting. Although the old system was not

56
deserted this would mean that some processes should change and therefore some
people‟s job descriptions would change. Because people deal with these things
differently, one should be careful with communicating future visions. Expanding new
business reporting may also create uncertainty among business users who are taking
apart to development projects. They might fear that increased number of projects
increase their workload as they would be used in future for example in testing phase.
Smooth co-operation with other stakeholders plays a significant role in diluting resisting
forces of change. At the time of FC management reporting project the fragmented
responsibility regarding reporting and data warehousing was more or less confusing
because BI/DW team was answering the reporting needs of GBI project where as other
reporting was centralized. This division and sometimes a little juxtaposition may have
confused and affected negatively on the business users. It is also possible that some
negative word of mouth could have spread from BI/W team about new centralized BI
solutions.
5.1.3. BICC’s effect on engaging business users
Observation of two different projects reveals that engagement process stays anything
but fixed as the maturity of BICC increases. Engagement change regarding projects, its
environment and the maturity of BICC. Changes, such as other projects, may affect on
how change should be managed and what kind of resistance arises. The differences in
engagement as the maturity of BICC increases are listed in table Table 5.1.
Table 5.1: BICC’s effect on engaging business users.
Change as maturity increases Effect on engagement
More established organization
Decreased need for creating awareness Public communication
Greater coverage
Increased number of users
Decreased need for institutionalizing the change Increased credibility
Clearer future state
Less customized solutions Increased need for creating sense of ownership
Decreased personal touch
The change unfreezing i.e. creating readiness for change is different process under
Business Intelligence Competency Center. People‟s awareness and consciousness of BI
solutions are better because information about projects and BI solutions is
communicated in more public and because of greater coverage of centralized BI
solutions the information is spread more efficiently. As the maturity of BICC increases
the organization itself becomes more established and therefore recognized. This also
decreases the need of creating awareness among business users. However, increased

57
awareness decreases the chance of a positive surprise which could be otherwise used as
a method of engagement.
As the number of BI users increase as the maturity increases, centralized BI solutions
has wider coverage. This gives people the feeling that “this is the way we do things
around here” and people are engaged stronger after they have taken the solutions in use.
As more established and recognized organization BICC‟s credibility increases as well
which gives people a feeling that they can trust their BI solutions and they will be
provided support also in the future. Young BICC may have smaller resources and
unofficial organization which does not encourage long-term engagement. The future
state of BI gets also clearer and trusted as BI strategy is executed as the maturity of
BICC increases.
However, creating readiness to change may become harder because centralized BICC
solutions scope may be defined stricter and business users do not have that good chance
to affect on the specifications because of increased standardization. As the maturity
increases the BICC becomes more faceless and personal touch may be lost because BI
solutions are designed also for others than the closest business partners. The co-
operation may also be less intensive if internal customer is not familiar earlier. On the
other hand, less familiar customer must communicate more in order to create a sound
understanding to developers. All in all, standardized solutions and decreased personal
touch together decrease business users‟ sense of ownership of BI solutions.
5.2. Three-stage approach to BI development projects
5.2.1. Means and methods of engaging
Different means and methods of engaging considering research‟s two BI development
project are summarized in Figure 5.1. The same means and methods in more detail were
presented earlier in two narratives. Lewin‟s three-stage framework was used to give a
compact managerial view of managing change process and engagement, and also to
reveal dynamics between the means and methods of engagement. The means and
methods are categorized according to their alignment to three stages of Lewin‟s change
process model whether they are related to creating readiness for change (unfreeze),
executing the change itself (change) or institutionalizing the change (refreeze). They are
also tagged whether they appeared on pre-BICC project (PAS), BICC project (FC) or
both (PAS & FC).

58
Figure 5.1: Means and methods of engaging business users to Business Intelligence
Competency Center.
The research material of both projects indicated strongly that the superiority of
developed BI solution is the key to engaging business users. Every business user who
was presented the functionality and the content of the new solution welcomed it warmly
and the solution was not needed to be sold later. The enthusiasm carried on all the way
from presenting it the first time until the solution was implemented and taken into daily
use, and no resistance to change was confronted. Due to the superiority of the developed
solution one did not have to put so much effort on engaging the business users later: the
tool was taken into daily use immediately after introducing it in production
environment.
Although the importance of a new tool and a solution cannot be denied one still needs
other means and methods to ensure the engagement of business users. Without top
management support projects and change attempts tend to fail as literature has shown it.
Also two-way communication has very crucial role in all three stages covering
everything from sharing information of other‟s projects results and further development
projects to listening business users in terms of their needs and suggestions for
improvements.
Other major key to business users‟ engagement is to make them take part in a
development project. Participation itself increases the sense of ownership but it
strengthens well the other means and methods of engagement: developing better
solutions, better two-way communication and more extensive training to guarantee
painless implementation. One can take only a few people in the project management
team but more people may be participated in the testing of a BI solution.

59
The refreezing of the change i.e. keeping the engagement of the business users is less in
interconnected with creating the urgency of change and implementing the change itself.
Keeping the users engaged requires convincing them that the big wheels keep on
turning. This covers the maintenance of the existing solutions but also the further
development. New development projects signal that BICC is the way of doing things
and already existing solutions may be developed even further. Although the business
users would adopt and take a new solution in use easily due to its superiority,
engagement of business users should be maintained just like other customer relations.
5.2.2. Challenges of engagement
Different challenges of engaging business users arisen from project narratives are
summarized in Figure 5.2. The challenges are also categorized according to their
alignment to three stages of Lewin‟s change process model whether they are related to
creating readiness for change (unfreeze), executing the change itself (change) or
institutionalizing the change (refreeze). This way the challenges can be linked to earlier
presented means and methods, and the dynamics between different challenges can be
examined. Challenges are tagged whether they appeared on pre-BICC project (PAS),
BICC project (FC) or both (PAS & FC).
Figure 5.2: Challenges of engaging business users to Business Intelligence Competency
Center.
Communication is crucial in engaging business users but the timing of it is challenging
in dynamic environment. Early project-related communication increases the awareness
but it is uncertain whether the message will change in future. Conversely, the message is
more sure later but business users are longer uninformed. Creating awareness by good
informative communication may reduce a chance to create a positive surprise when a
solution is finally introduced but there lays a risk that the effect of a positive surprise
does not overcome the resistance and dissatisfaction created by bad communication
during the project. One should be able to find a way to keep the communication in
satisfactory level and also to overcome the expectations when the solution is finally
introduced.

60
More significant challenge is related to the scope and the content of the BI solution. In
centralized BICC standardization limits the flexibility in BI solutions and their
development projects. Business users do not get tailored solutions that satisfy their
specific needs in best way which they might have got before when BI solutions and
development projects were not centralized. The benefits of BICC should be carefully
balance at BI solutions‟ expense because the superiority of BI solution is one of the key
ways of engaging business users.
Different challenges of engagement are related to the participation of business users.
One should be able to reserve adequate time of business users who are taking part to
project. Especially business testers whose working time is not officially allocated to a
project should be given enough time. In addition to time one should also be able to
provide users something in exchange for their time. Business members who are not in
the scope of particular project and have to give their effort may become easily frustrated
and dissatisfied. There is also a chance that these people will turn to be resist agents
who spread negative word of mouth. In addition to business users, one should also try to
keep good relationships with other stakeholders. IT department, who in most occasions
creates the basis for the reporting but does not work in the user interface, may end up to
resist change if they feel they are overloaded and not engaged in developing BI
solutions.
Once project is closed and developed BI solution is in use, one should be able to
provide further development and maintenance, and also to expand project‟s original user
base to institutionalize the change as well as possible. However, this may fail if
resources are booked for other projects. This is likely especially if centralized BI
solutions are not extensive yet and a broader coverage of BI is set as a major target.
Other BI development projects and BI solutions from other faces set up a challenge to
institutionalize the change. Especially when centralized BICC is tried to push through,
these competing attempts may dilute the trust in centralized BI. In the worst case there
might be overlapping solutions which offer business users confusing different versions
of truth.
5.3. Discussion
The palette of the means and methods of engaging business users to Business
Intelligence Competency Center found in this research was not especially surprising.
The existing literature of more general change management had brought out earlier the
same points from top-management literature to participation of stakeholders in a way or
another. The literature of BI and BICC had brought out some points in more general
level but before this it had lacked concrete means and methods which could be utilized
in engaging business users. In anyway, the results show that theories of overcoming
resistance to change can be extended and generalized to cover also business user
engagement to BICC.

61
However, what was really stunning was the significance of superior BI solution
although it has been said that BI is fueled by the utilization of the information it
provides. After business users were introduced the new solution the execution of the
project was smooth encountering almost no resistance of change. Although the original
goal was not to focus on the importance of distinct factors, the significance of superior
BI during the projects was remarkable and worth of highlighting. The earlier research
combining the magnitude, the pace and the sequence of the chance has showed that
high-impact elements should be introduced in the beginning of the chance. This is
interesting, because a finding that came up from this research was that the timing,
whether the solution was introduced to users already during the project or only just
before the trainings, did not seem to make any difference in engaging business users to
BICC. There lays a risk that this major single finding has been emphasized too much
and the significance other means and methods has been diluted. However, all the notes
of the interviews and the observations were made at the moment they occurred, which
decreases the change of this risk. The final impact of introducing a superior BI solution
is hard to be examined with this research material but in any case it can be considered to
be really significant. If one element arises over the others this clearly, both academics
and managers should carefully pay attention to it.
The objective of the research questions was to bring out how increased maturity affects
on the engaging of business users to BICC. The results from one and half year period
show that the engaging process should not stay fixed. One should focus on overcoming
strengthening resisting forces that are created as standardization increases and business
users‟ flexibility is lost as the maturity of BICC increases. Also the increased benefits of
centralized BICC were confirmed: wider coverage and more extensive solutions
increase the awareness for change and make the institutionalizing easier. However,
extending the coverage of BICC, like in the case organization, ties resources to BI
development projects and the maintenance and support is not the priority number one.
In the literature this is often forgotten because the formation of BICC is considered to
happen as the consolidation of earlier BI efforts. The evolutions, and also the structures
of BICCs are undeniably different which make every single case unique. However, the
case BICC of this research covers all but one functional areas of BICC which makes it a
good point of comparison and more generalizable. Also the examined BI solution
development projects included the basic components from data warehousing to creating
the reporting layer and training the business users. Although this thesis revolves around
the concept of BICC, managers and academics can consider also other forms of
centralized Business Intelligence as the literature review showed that they have many
things in common with BICC. The time scale of the examinations was one and half year
which is long enough to bring out changes in engagement processes because the pace of
the change considering the development of BICC was rapid. However, this research is
not able to answer how the means and the methods of engagement would change in
longer time period or when a BICC would have been established for longer time.
62
The third research question focused on to reveal challenges related to engaging business
users to BICC. One self-evident, already presented challenge is business users‟ lost
flexibility due to increased standardization. Again, combined to the importance of
designed BI solution it should be carefully considered how much flexibility should be
given at the expense of the economies of scale obtained by BICC. The optimum is
surely dependent on the case but some theories could be developed in further
researches. Communication was another significant and complex challenge that was
faced in the case environment. The timing of formal communication and especially the
importance of word of mouth communication should be taken into account in engaging
business users. It came out from multiple dealings with different people that their
awareness and naturally even some opinions were based on what they had heard from
others. The field of social research is closely linked to the spread of word of mouth, but
it also covers the dynamics of the resisting and the change promoting forces. Although
the social examination was limited outside of this thesis, it should not be left aside from
the discussion of engaging business users to BICC. People‟s statuses and their links to
other people are just few things to be considered in the dynamics.
The validity, or in other words trustworthiness, in qualitative research aims for more
credible and defensible results which may lead to the generalizability of the research.
The one of the most important questions related to evidence of case research is the
selection of the cases. The original idea of this research was not to have a big number of
cases to do a macroscopic study but rather to have cases that represent the sample.
Again, the idea was not to generalization to populations but to expand and generalize
existing theories in which can be considered to be successful. As mentioned earlier,
both the BICC and the BI development projects represent quite well the typical cases.
The projects of this thesis were almost identical between in terms of their scope but the
execution of them varied, naturally. However, a bigger question regarding this research
is related to the collection of research material from cases: most of the first project‟s
material was collected by interviews and the majority of the second project‟s material
was obtained through observing. However, the data triangulation of both cases increases
the credibility of the research.

63
6. CONCLUSIONS
The main objective of this research was to find different methods and means to engage
business users to Business Intelligence Competency Center. The spectrum of the means
and methods founded in the research followed well the mature existing literature of
general organizational change management and the literature of Business Intelligence
and BICC. Although new means or methods were not found, it turned out that the
importance of developed BI solution in remarkable. Once a superior BI solution was
offered to the business users, only little effort had to be put on their further engagement
and diluting change resistance. Also the comparison of two different cases revealed that
the timing of the solution‟s introduction did not make any difference which is opposite
to existing literature which suggests that high-impact elements should be introduced in
the beginning of the change process. However, it also appeared that one major mean of
engagement needs other means and methods to support the engagement and maintaining
the engagement in the future as well.
The other two objectives of this thesis were to find out how the increased maturity of
BICC affects on the engagement and what challenges are related to engagement of
business users. It was found out that as the maturity of BICC increases the means and
the methods should change as well. Increased coverage of centralized BI solutions helps
in creating the awareness and institutionalizing the change, but it other challenges of
engagement arise as the standardization decreases the flexibility of end users and
personal touch is lost. At the same time the communication is set up new challenges
which have to be overcome.
This applied research was able to meet its objectives and therefore cover the topic of
engaging business users to BICC quite widely. Due to the practical approach this
research was able to provide managers different guidelines and viewpoints to engaging
business users to centralized BI. The descriptive narratives of two different BI
development projects give both managers and academics a good exploratory view to BI
development project management which has not been written much about. The
generalizability of the results is relatively weak due to the case research method but the
research showed that the topic itself is worth of further research. To increase the
credibility of the results more research should be conducted using different methods or
perhaps triangulation.
This research showed that offering a superior BI solution one can create very good base
for change that prevents the further pain and makes the change management easier.
However, one cannot generalize that superior solution is always the key to success.

64
Because cases, environments and methods vary a lot, one should try to find out which
means and methods of engaging are most powerful under different conditions. The
spectrum of change management means and methods is so huge that managers start to
be confused with all the variety of the ways. More efforts should be put to examine
engagement people in more detailed contexts.
During this research the particular BICC was relatively young and it was still putting
most of its efforts to expand the user base. However, as the time goes by and the
maturity of BICC increases the user base will expand and BICC‟s coverage will get
bigger and more people are offered sophisticated BI solutions. One can suppose that the
awareness of BI solutions increases in organization but the standardization has to be
even stricter and people‟s expectations will increase. How would the engagement of
business users differ in those conditions? This research was able to reveal the change
only during the time of one and half year. The change of engaging business users as the
maturity of BICC increases should be researched during longer periods and also in more
mature environments. Like Kurt Lewin proposed already over 50 years ago,
interpersonal relationships and social interaction are very important things to be
considered during the change process. People‟s awareness, readiness and different
opinions of the change spread well by word of mouth. The research of engaging
business users to BICC should not be limited only in the research field of organizational
change management but it should be covered also by social study researches.

65
BIBLIOGRAPHY
Aldag, R.J. & Stearns, T.M. 1991. Management (Second edition). Cincinnati, South-
Western Publishing.
Amis, J., Slack, T., Hinings, C.R. 2004. The Pace, Sequence, and Linearity of Radical
Change. The Academy of Management Journal. Vol. 47, No. 1, pp. 15-39.
Armenakis, A.A. & Bedeian, A.G. 1999. Organizational Change: A Review of Theory
and Research in the 1990s. Journal of Management. Vol. 25, No. 3, pp. 293-315.
Baars, H., Zimmer, M., Kemper, H-G. 2009. The Business Intelligence Competence
Centre as an Interface Between IT and User Departments in Maintenance and
Release Development. 17th European Conference on Information Systems,
Verona, 2009, 12 p.
Ballard, C., White, C., McDonald, S., Myllymäki, J., McDowell, S., Goerlich, O.,
Neroda, A. 2005. Business Performance Management… Meets Business
Intelligence. IBM International Technical Support Organization. Red Book. July
2005. 204 p.
BARC. 2008. Organization of Business Intelligence. BARC Institute, Wurzburg.
Barlow, S. 2006. Virtual Business Intelligence. Best Practices in Business Intelligence
2006 Awards Program.
Barr, P.S., Stimpert, J.L., Huff, A.S. 1992. Cognitive change, strategic action, and
organizational renewal. Strategic Management Journal. Vol. 13, special issue,
pp. 15-36.
Bashein, B.J. & Markus, M.L. 1997. A Credibility Equation for IT Specialists. Sloan
Management Review. Vol. 38, No. 4., pp. 35-44.
Bhushan, N. & Rai, K. 2004. Strategic Decision-making. London, Springer, 200 p.
Bitterer, A., Schlegel, K., Hostmann, B. et al. 2007. Hype Cycle for Business
Intelligence and Performance Management. Gartner Research. Published 23
July 2007, ID Number: G00149421.
Boeker, W. 1997. Strategic change: the influence of managerial characteristics and
organizational growth. Academy of Management Journal. Vol. 40, No. 1, pp.
152-170.
Burnes, B. 2004. Kurt Lewin and the Planned Approach to Change: A Re-appraisal.
Journal of Management Studies. Vol. 41, No. 6, pp. 977-1002.
Burstein, F. & Holsapple, C.W. 2008. Handbook On Decision Support Systems 2.
Berlin, Springer, 800 p.
BusinessDictionary. 2010. Online Business Dictionary. Available:
http://www.businessdictionary.com/definition/key-performance-indicators-
KPI.html. Referred 14 April 2010.
Chew, R., Ericsson, L.M., Fuchs, G. 2007. Enterprise-Level BI. BIReview. September
2007, pp. 6-9.
Cognos. 2006. BI Centres of Excellence. DWAA QLD Meeting 01/06/2006. Available:
www.dwaa.org.au/Papers/Cognos___BICC.pdf. Referred 23 March 2010.
Computerworld. 2006. How Companies Are Implementing Business Intelligence
Competency Centers (BICCs). White Paper.

66
Conner, K. R. & Prahalad C. K. 1996. A Resource-Based Theory of the Firm:
Knowledge versus Opportunism. Organization Science. Vol. 7, No. 5, pp. 477-
501.
De Voe, L. & Neal, K. 2005. When Business Intelligence Equals Business Value.
Business Intelligence Journal. Vol. 10, No. 3, pp. 57-63.
de Wit, M. & Meyer, R. 2005. Strategy Synthesis: Resolving Strategy Paradoxes to
Create Competitive Advantage (Concise Version). Singapore, Seng Lee Press,
295 p.
Dent, E.B. & Golberg, S.G. 1999. Challenging “Resistance to Change”. The Journal of
Applied Behavioral Science. Vol. 35, No. 1, pp. 25-41.
Dubrin, A.J. & Ireland, R.D. 1993. Management and organization (Second edition).
Cincinnati, South-Western Publishing.
Eckerson, W. 2003. Understanding Business Intelligence. The Data Warehousing
Institute. 17 October. Available:
http://www.tdwi.org/research/display.aspx?ID=6838. Referred: 14 June 2010.
Economist. 2010. Migration in China: Invisible and heavy shackles (Print edition). May
2010, pp. 8-14.
Eisenhardt, K. M. 1989. Building theories from case study research. Academy of
Management Review. Vol. 14, No. 4, pp. 532-550.
Feeny, D.F. & Willcocks, L.P. 1998. Core IS Capabilities for Exploiting Information
Technology. Sloan Management Review. Vol. 39, No. 3, pp. 9-21.
Fiol, C.M. 2002. Capitalizing on Paradox: The Role of Language in Tranforming
Organizational Indetities. Organization Science. Vol. 13, No. 6, pp. 653-666.
Folger, R. & Skarlicki, D.P. 1999. Unfairness and resistance to change: hardship as
mistreatment. Journal of Organizational Change Management. Vol. 12, No. 1,
pp. 35-50.
Frantz, D.W. 2004. Change management. Encyclopedia of Leadership. Thousand Oaks,
Sage Publications, 1927 p.
Friedman, T. & Hostmann, B. 2004. The Cornerstones of Business Intelligence
Excellence. Research Note. 26 April 2004.
Gartner. 2010. The Gartner Fellows: Howard Dresner‟s Biography. Available:
http://www.gartner.com/research/fellows/asset_79427_1175.jsp. Date of access:
April 13, 2010.
Goodstein, L.D. & Burke, W.W. 1991. Creating successful organization change.
Organizational Dynamics. Vol. 19, No. 4, pp. 5-17.
Graham, P. 2008a. Organizational Considerations for Information Empowerment, Part
1. DM Review. June 2008, p. 31.
Graham, P. 2008b. Organizational Considerations for Information Empowerment, Part
2. DM Review. July 2008, pp. 30-31.
Greenwood, R. & Hinings, C.R. 1996. Understanding Radical Organizational Change:
Bringing together the Old and the New Institutionalism. The Academy of
Management Review. Vol. 21, No. 4, pp. 1022-1054.
Griffin, R. W. 1993. Management (Fourth edition). Boston, Houghton Mifflin.
Henschen, D. 2008. Seven Steps to Successful BI Competency Centers. Intelligent
Enterprise. 24 August 2008. Available: http://intelligent-
enterprise.informationweek.com/showArticle.jhtml;jsessionid=JMU1E4UO1ZU
ODQE1GHOSKH4ATMY32JVN?articleID=210200396. Referred: 23 March
2010.
Hitachi. 2009. Establishing a Business Intelligence Competency Center (BICC). White
Paper.

67
Hostmann, B. 2007. Business Intelligence Trends, with Gartner analyst. 20 March 2007.
Available: http://searchbusinessanalytics.techtarget.com/podcast/Business-
intelligence-trends-with-Gartner-analyst-Bill-Hostmann. Referred 12 April
2010.
HP. 2009. Building the Business Intelligence Competency Center. White Paper.
IBM. 2009a. BI for business users: How IT can make business intelligence easy for
everyone. Whitepaper.
IBM. 2009b. Building a Business Intelligence Competency Center. White Paper.
Inmon, B. 1999. Data Mart Does Not Equal Data Warehouse. InfoManagement Direct.
November 1999. Available: http://www.information-
management.com/infodirect/19991120/1675-1.html. Referred April 17, 2010.
Isern, J. & Pung, C. 2007. Harnessing energy to drive organizational change. McKinsey
Quarterly. Vol. 17, No. 1, pp. 9-17.
Kasanen, E., Lukka, K., Siitonen, A. 1993. Konstruktiivinen tutkimusote
liiketaloustieteessä (in Finnish). Liiketaloudellinen aikakauskirja. 3/1991, pp.
301-329.
Kelly, J. 2009. IBM, Microsoft and Oracle top Gartner‟s business intelligence platform
rankings. SearchBusinessAnalytics.com. 29 Jan 2009. Available:
http://searchbusinessanalytics.techtarget.com/news/1507124/IBM-Microsoft-
and-Oracle-top-Gartners-business-intelligence-platform-rankings. Referred: 12
May 2010.
Kogut, B. & Zander, U. 1992. Knowledge of the Firm, Combinative Capabilities, and
the Replication of the Technology. Organization Science. Vol. 3, No. 3, pp. 383-
397.
Kotter, J.P. 1995. Leading Change: Why Transformation Efforts Fail. Harvard Business
Review. Vol. 73, No. 2, pp. 59-67.
Kreitner, R. 1992. Management (Fifth edition). Boston, Houghton Mifflin.
Lawrence, P.R. 1954. How to deal with resistance to change. Harvard Business Review.
May/June, pp. 49-57.
Lönnqvist, A. & Pirttimäki, V. 2006. The Measurement of Business Intelligence.
Information Systems Management. Vol. 23, No. 1, pp. 32-40.
Maurer, R. 1996. Using resistance to build support for change. The Journal for Quality
and Participation. Vol. 19, No. 3, pp. 56-66.
McKnight, W. 2007. Moving Business Intelligence to the Operational World, Part 1.
DM Review. Vol. 17, No. 8, p. 28.
Metso. 2010. The world shapes us - Annual report 2009. Available:
http://metso.com/corporation/ir_eng.nsf/WebWID/WTB-100305-2256F-
1D6C7/$File/metso_annual_report_2009_english.pdf. Referred: 28 June 2010.
Miller, G.J., Bräutigam, D., Gerlach, S.V. 2006. Business Intelligence Competency
Centers: A Team Approach to Maximizing Competitive Advantage (First
edition). New Jersey, John Wiley & Sons Hoboken Inc., 198 p.
Nadler, D.A. & Tushman, M.L. 1989. Organizational Frame Bending: Principles for
Managing Reorientation. The Academy of Management Executive. Vol. 3, No.
3, pp. 194-204.
Pardo del Val, M. & Martinez Fuentes, C. 2003. Resistance to change: a literature
review and empirical study. Management Decision. Vol. 41, No. 2, pp. 148-155.
Pettigrew, A.M., Woodman, R.W., Cameron, K.S. 2001. Studying Organizational
Change and Development: Challenges for Future Research. The Academy of
Management Journal. Vol. 44, No. 4, pp. 697-713.

68
Piderit, S.K. 2000. Rethinking Resistance and Recognizing Ambivalence: A
Multidimensional View of Attitudes toward an Organizational Change. The
Academy of Management Review. Vol. 25, No. 4, pp. 783-794.
Pinnington, A. & Edwards, T. 2000. Introduction to Human Resource Management
(Paperback). New York, Oxford University Press, 318 p.
Prahalad, C. K. & Hamel, G. 1990. The Core Competence of the Corporation. Harvard
Business Review. Vol. 68, No. 3, pp. 79-92.
Quinn, J. B. 1992. The intelligent enterprise a new paradigm. The Executive. Vol. 6,
No. 4, pp. 48-63.
Ranjan, J. 2008. Business justification with business intelligence. The journal of
information and knowledge management systems. Vol. 38, No. 4, pp. 461-475.
Reich, B.H. & Benbasat, I. 2000. Factors That Influence the Social Dimension of
Alignment between Business and Information Technology Objectives. MIS
Quarterly. Vol. 24, No. 1, pp. 81-113.
Robbins, S.P. 2003. Organizational Behavior (Tenth edition). New Jersey, Prentice
Hall, 675 p.
Rockart, J.F., Earl, M. J., Ross, J.W. 1996. Eight Imperatives for the New IT
Organization. Sloan Management Review. Vol. 38, No. 1, pp. 43-55.
Ruddy, J. 2006. Top 10 Trends in Business Intelligence, part 2. 18 October 2006.
Available: http://www.b-eye-network.co.uk/view/3444 Referred: 12 April 2010.
Rytkölä, T. 2010. IBM Cognos solution for Business Intelligence and Financial
Performance Management. Lecture slides. 30 March 2010. Not available.
SAS. 2006. Business Intelligence Competency Centers: Creating a successful business
intelligence strategy with SAS. White Paper.
Saunders, M., Lewis, P., Thornhill, A. 2009. Research Methods for Business Students
(Fifth edition). England, Pearson, 614 p.
Schaffer, R.H. & Thomson, H.A. 1992. Successful Change Programs Begin with
Results. Harvard Business Review. Vol. 70, No. 1, pp. 80-89.
Schein, E.H. 1985. Organizational Culture and Leadership. Finnish translation by
Liljamo, R. & Miettinen, A. 1987. Organisaatiokulttuuri ja johtaminen. Espoo,
Weilin+Göös, 356 p.
Schein, E.H. 1996. Kurt Lewin‟s change theory in the field and in the classroom: Notes
toward a model of managed learning. Systemic Practice and Action Research.
Vol. 9, No. 1, pp. 27-47.
Schermerhorn, J.R. 1989. Management for productivity (Third edition). New York,
John Wiley.
Sherman, R. 2003a. How to Satisfy Business Users Every Time and Make Them Beg
for More, Part 1. Information Management Online. Sep 25. Available:
http://www.information-management.com/news/7448-1.html. Referred: April
12, 2010.
Sherman, R. 2003b. How to Satisfy Business Users Every Time (Business User Myths),
Part 2. Information Management Online. Dec 4. Available:
http://www.information-management.com/news/7818-1.html. Referred: April
12, 2010.
Sherman, R. 2004. How to Satisfy Business Users Every Time (Business User Myths),
Part 3. Information Management Online. March 25 2004. Available:
http://www.information-management.com/news/1000666-1.html. Referred:
April 12, 2010.
Stevenson, W.J. 2007. Operations Management (Ninth edition). McGraw-Hill/Irwin,
New York, 903 p.

69
Strange, K.H. & Hostmann, B. 2003. BI Competency Center Is Core to BI Success.
Gartner Research. Published 22 July 2003, ID Number: AV-20-5294.
Strebel, P. 1994. Choosing the right change path. California Management Review. Vol.
36, No. 2, pp. 29-51.
Tellis, W. 1997. Introduction to Case Study. The Qualitative Report. Vol. 3, No. 2.
Available: http://www.nova.edu/ssss/QR/QR3-2/tellis1.html. Referred: 19 July
2010.
Tushman, M.L., Newman, W.H., Romanelli, E. 1986. Convergence and Upheaval:
Managing the Unsteady Pace of Organizational Evolution. California
Management Review. Vol. 29, No. 1, pp. 583-594.
Veryard, R. 2005. Service Orientated Business Intelligence 2. 22 September 2005.
Available: http://rvsoapbox.blogspot.com/2005/09/service-oriented-business-
intelligence_22.htm. Referred: 12 April 2010.
Waddell, D. & Sohal, A.S. 1998. Resistance: a constructive tool for change
management. Management Decision. Vol. 36, No. 8, pp. 543-548.
Weick, K.E. & Quinn, R.E. 1999. Organizational change and development. Annual
Review of Psychology. Vol. 50, No. 1, pp. 361-386.
White, C. 2006. The Next Generation of Business Intelligence: Operational BI. White
paper.
Wu, L., Barash, G., Bartolini, C. 2007. A service-oriented architecture for business
intelligence. IEEE International Conference on Service-oriented Computing and
Applications, SOCA 2007, pp. 279-285.
Yin, R.K. 2009. Case Study Research: Design and Methods. Fourth edition. California,
Sage Publications, 219 p.
Yukl, G.A. 2001. Leadership in Organizations (Fifth edition). New Jersey, Prentice
Hall, 508 p.

APPENDICES (2 pieces)
APPENDIX 1: Extract from PAS management reporting interview notes
28 June 2010, PAS management reporting (pilot BI project), project manager interview
notes
Original scope / timetable; how did the actual go against the plan?
- Started in February-March 2009, End of May in production
- HFM AUTOMMA & PASPG, nykyiset kuutiot ja dashboardit
- Initiative and promotion by project manager and VP of Business Controlling
Contact persons
- “PAS general Controller” (compare FC‟s corresponding; HFM know-how)
Users
- Expanded PAS management board (product lines, service, regions, HR, operations
logistics, product line controllers x3)
- Dashboards to all, cubes to controllers
- Later little expansion to service and countries
Earlier reporting
- Mailed / database Excels, PowerPoints by Controllers
Communications
- Promotion by initiators, personal touch and encounter
Trainings
- Not organized, only if needed
- Dashboard review at management board‟s meetings
- OLAP cubes were trained by project manager
Other
- People may fear the burden that they will have to carry when new solution is
implemented?
o ”General Controller” was the only one whose workload increased and at the
same time she did not personally benefit from the solution itself may cause
dissatisfaction
- After the project?
o There has not been time to do any further development or major expansion of
user base
- Contact person, who is he? Importance to organization? Opinion leader?
o VP of Business Controlling has very strong experience of reporting
- A new tool AGAIN? Has there been too much to learn or has the environment been
chaotic?
o No significant changes in near past

APPENDIX 2: Extract from miscellaneous observation notes of multiple meetings
9 March 2010, Reporting Workshop
- Training session for PAS and FC controllers to use reporting tool
- Information about future reporting (what will be done and when)
22 March 2010, GBI project operations module meeting
- Change resistance: old OLAP cubes and reports in North America implementation
- Importance of strong business management support: Quick stop to rival reporting - high
level support is needed
14 April 2010, Another project’s meeting
- Advance information is important, however there is a trade-off: one must be 100 % sure
that things will happen and there will be something concrete to show
- In global centralized projects processes can be forced in new shape because decision is
made on top-level, otherwise it can be hard to change processes (for example data
validation and analyze before data extractions)
16 April 2010, FC management reporting project meeting
- Engaging business users to testing phase has a challenge to be sure that users have
enough time. One must have clear “time reservations” to ensure that
- If every little thing starting from naming practices are standardized, how end users will
react?