Embed Size (px)
Citation preview
VILLAGE OF SHOREWOODWISCONSIN
Dashboards on a Shoestring
An Organic and Intimate Development
Leading to a Common Vision and Language for Collaborative Action
2
TextText
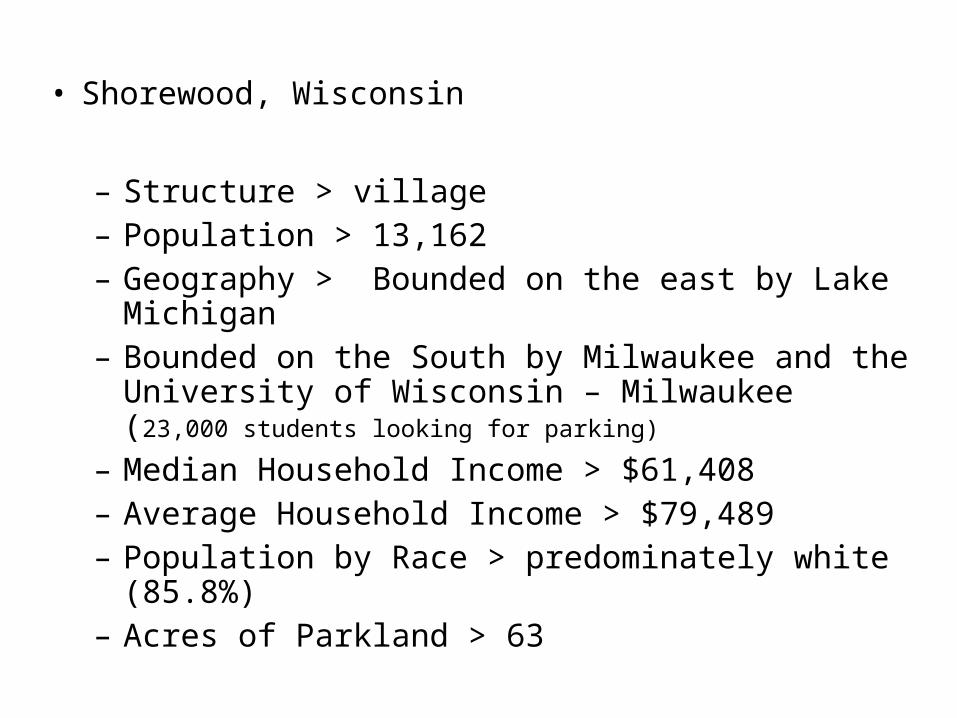
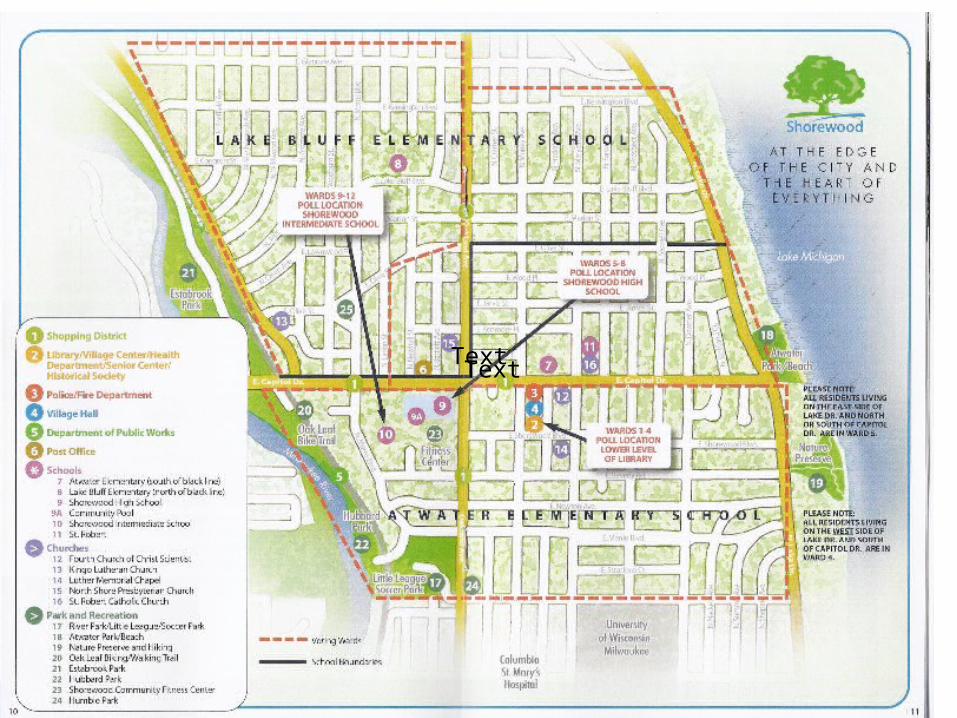
• Shorewood, Wisconsin
– Structure > village– Population > 13,162– Geography > Bounded on the east by Lake Michigan– Bounded on the South by Milwaukee and the University of
Wisconsin – Milwaukee (23,000 students looking for parking)
– Median Household Income > $61,408– Average Household Income > $79,489– Population by Race > predominately white (85.8%)– Acres of Parkland > 63
4
WHY A PERFORMANCE MEASUREMENT INITIATIVE?
Governments want better information and practices that will help them improve results. This means providing better ways to:
• understand public needs;
• identify and implement programs and services that will meet those needs;
•collect and analyze performance information;
• apply information to continuously improve results and become more efficient;
A Performance Management Framework for State and Local Government: From Measurement and Reporting to Management and Improving
National Performance Management Advisory Commission
5
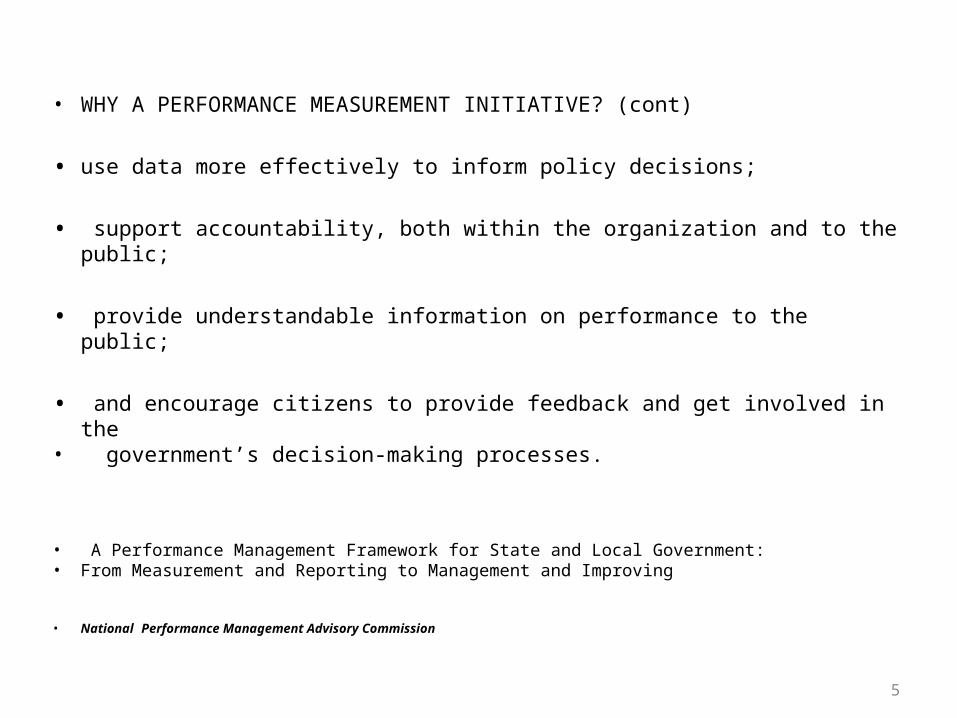
• WHY A PERFORMANCE MEASUREMENT INITIATIVE? (cont)
• use data more effectively to inform policy decisions;
• support accountability, both within the organization and to the public;
• provide understandable information on performance to the public;
• and encourage citizens to provide feedback and get involved in the • government’s decision-making processes.
• A Performance Management Framework for State and Local Government: • From Measurement and Reporting to Management and Improving
• National Performance Management Advisory Commission
6
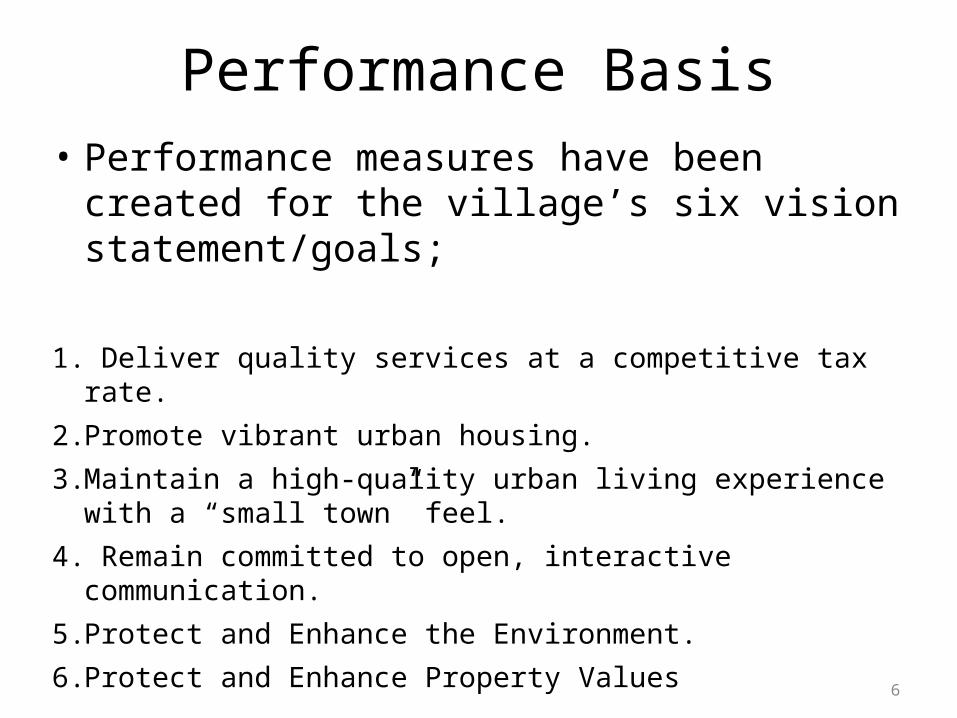
Performance Basis• Performance measures have been created for
the village’s six vision statement/goals;
1. Deliver quality services at a competitive tax rate.
2. Promote vibrant urban housing.
3. Maintain a high-quality urban living experience with a “small town” feel.
4. Remain committed to open, interactive communication.
5. Protect and Enhance the Environment.
6. Protect and Enhance Property Values
7
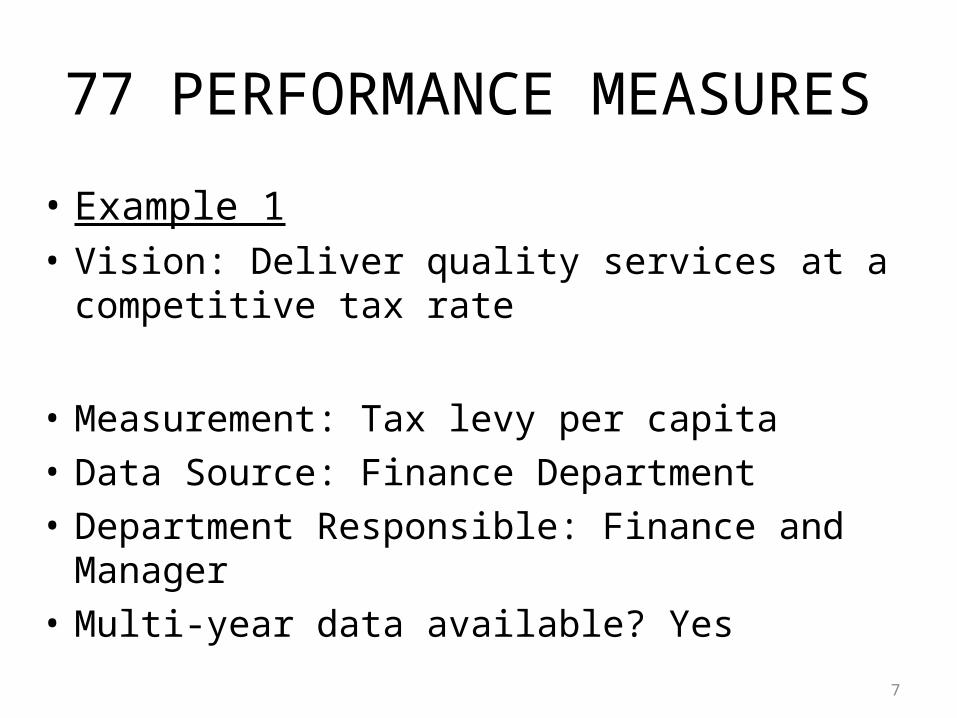
• Example 1• Vision: Deliver quality services at a competitive
tax rate
• Measurement: Tax levy per capita• Data Source: Finance Department• Department Responsible: Finance and Manager• Multi-year data available? Yes
77 PERFORMANCE MEASURES
8
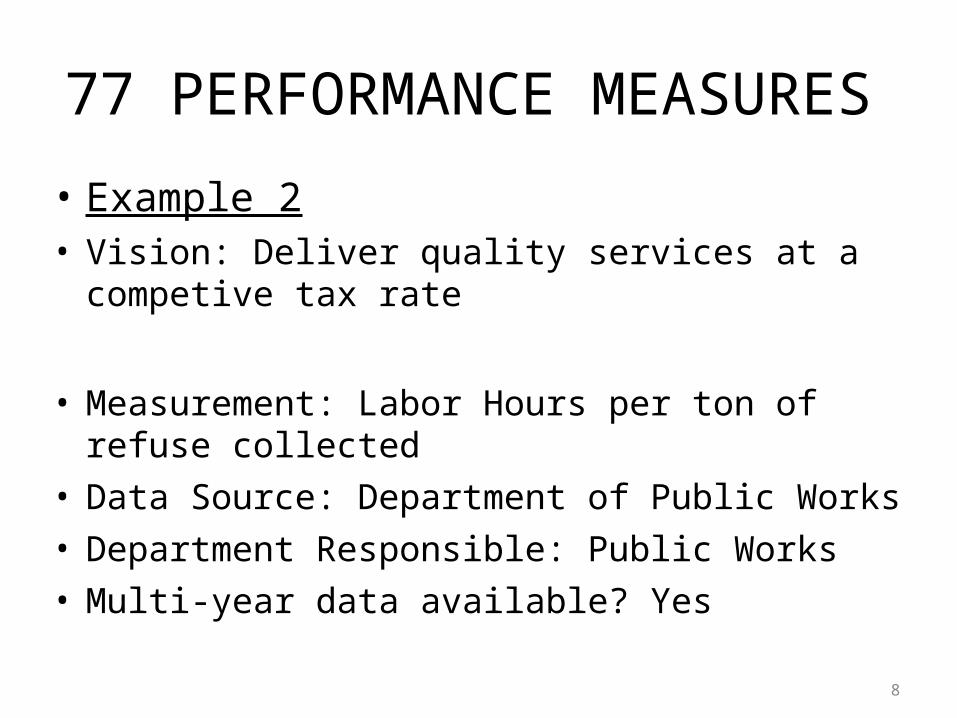
77 PERFORMANCE MEASURES
• Example 2• Vision: Deliver quality services at a competive tax rate
• Measurement: Labor Hours per ton of refuse collected
• Data Source: Department of Public Works• Department Responsible: Public Works• Multi-year data available? Yes
9
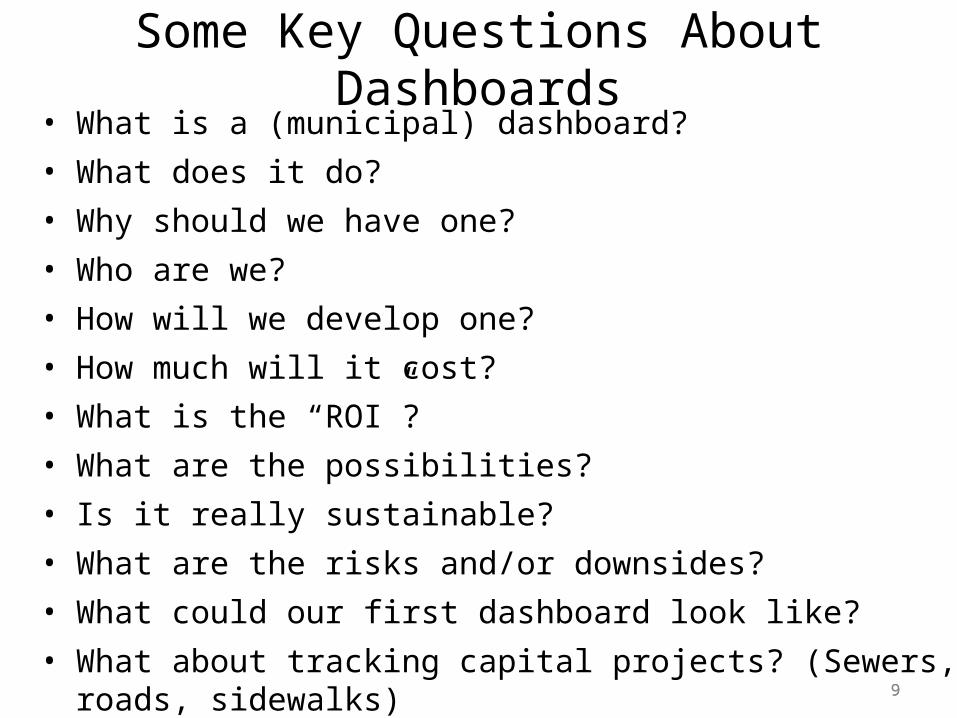
Some Key Questions About Dashboards• What is a (municipal) dashboard?• What does it do?• Why should we have one?• Who are we?• How will we develop one?• How much will it cost?• What is the “ROI”?• What are the possibilities?• Is it really sustainable? • What are the risks and/or downsides?• What could our first dashboard look like?• What about tracking capital projects? (Sewers, roads, sidewalks)
9
10
Dashboard Definitions
• A performance measurement dashboard approach provides timely data to relevant decision makers throughout an organization. The defining characteristic of dashboard systems is that information is simplified and filtered to provide only the most relevant data. Many dashboards convert performance data into charts and graphs or other forms of analysis such as a stop-light analysis.
10
11
• Dashboards allow governments to translate data from various systems into visually rich presentations using gauges, maps, charts and other graphical elements to show multiple results together.
• This feature makes it easy to identify and respond to critical, time-sensitive events as well as explore issues and trends. Accountability & performance management are of supreme importance to government agencies.
• Dashboards can be used to:• Monitor workloads• Track progress toward project goals• Observe financial information and budgets• Provide faster, more reliable service by sharing real-time
data across the organization
12
What do we mean by organic?
• Focus on natural growth and development• Developed by a learning organization• Developed by a learning community
• Dashboard Data Driven by– Village Long Range Financial Plan– Committee Needs– Resident Interests– Benchmarks– Competitive position
14
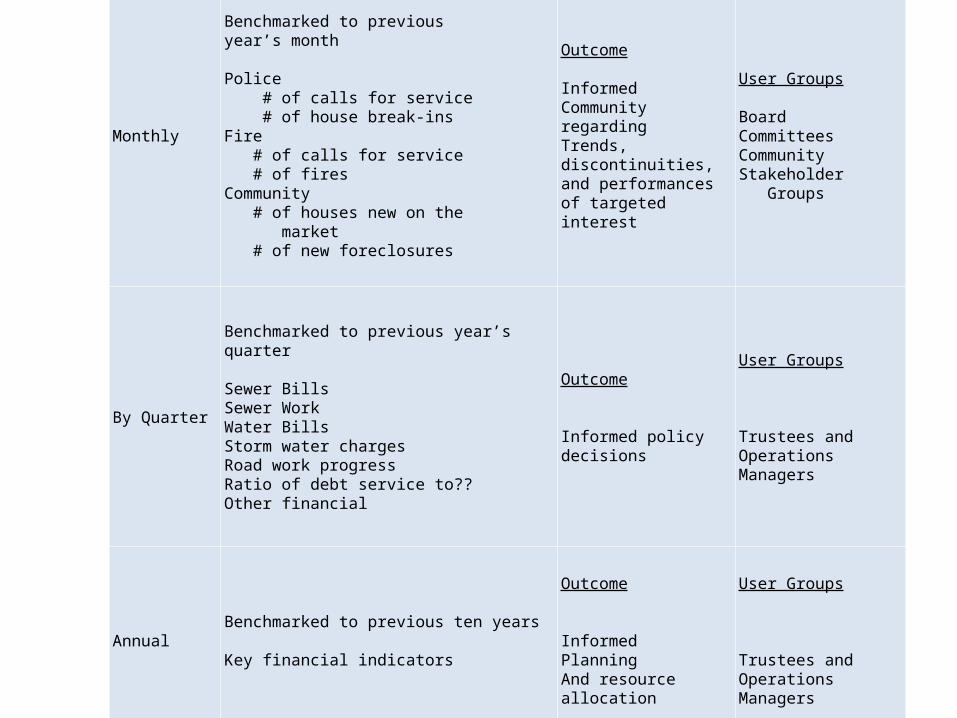
Monthly
Benchmarked to previous year’s month
Police # of calls for service # of house break-insFire # of calls for service # of firesCommunity # of houses new on the market # of new foreclosures
Outcome
InformedCommunity regardingTrends, discontinuities, and performances of targeted interest
User Groups
BoardCommitteesCommunity Stakeholder Groups
By Quarter
Benchmarked to previous year’s quarter
Sewer BillsSewer WorkWater BillsStorm water chargesRoad work progressRatio of debt service to??Other financial
Outcome
Informed policy decisions
User Groups
Trustees and OperationsManagers
AnnualBenchmarked to previous ten years
Key financial indicators
Outcome
InformedPlanningAnd resource allocation
User Groups
Trustees and Operations Managers
Shorewood’s Reasons for Doing Dashboards
– Citizen engagement
– Public accountability
– Setting Priorities
– Measuring progress
– Taking the pulse
– Early identification of problems
• Audiences– Village Board– Residents– Realtors– Potential Residents– Business– Staff
17
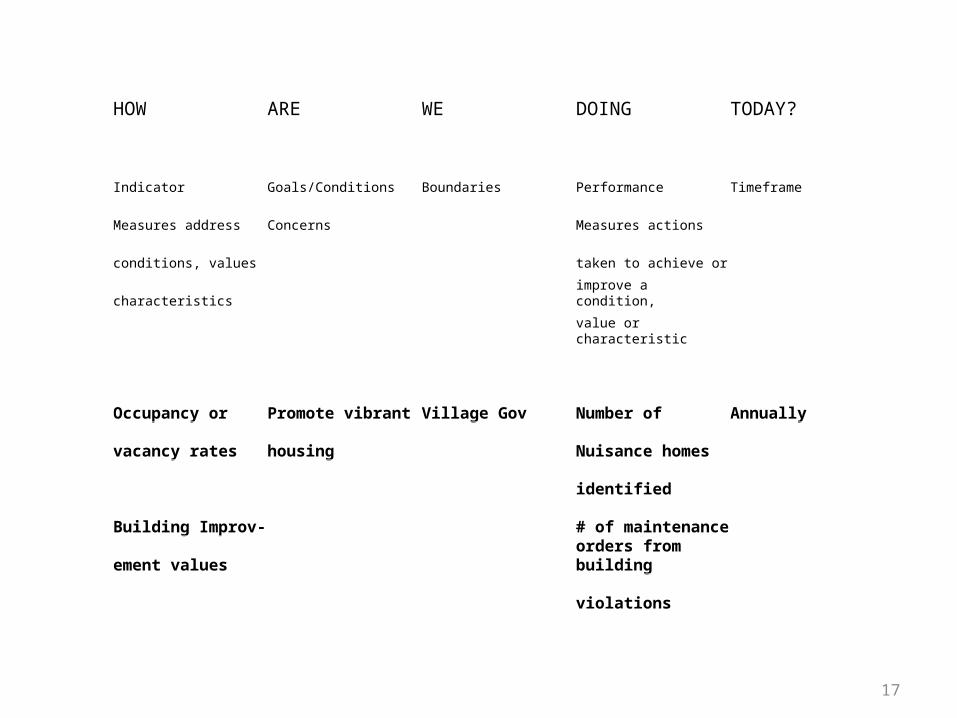
HOW ARE WE DOING TODAY?
Indicator Goals/Conditions Boundaries Performance Timeframe
Measures address Concerns Measures actions
conditions, values taken to achieve or
characteristics improve a condition,
value or characteristic
Occupancy or Promote vibrant Village Gov Number of Annually
vacancy rates housing Nuisance homes
identified
Building Improv- # of maintenance
ement values orders from building
violations
• Dashboards we have considered in developing ours
• Michigan municipalities• Wisconsin municipalities• North Carolina• Texas• Florida
19
20
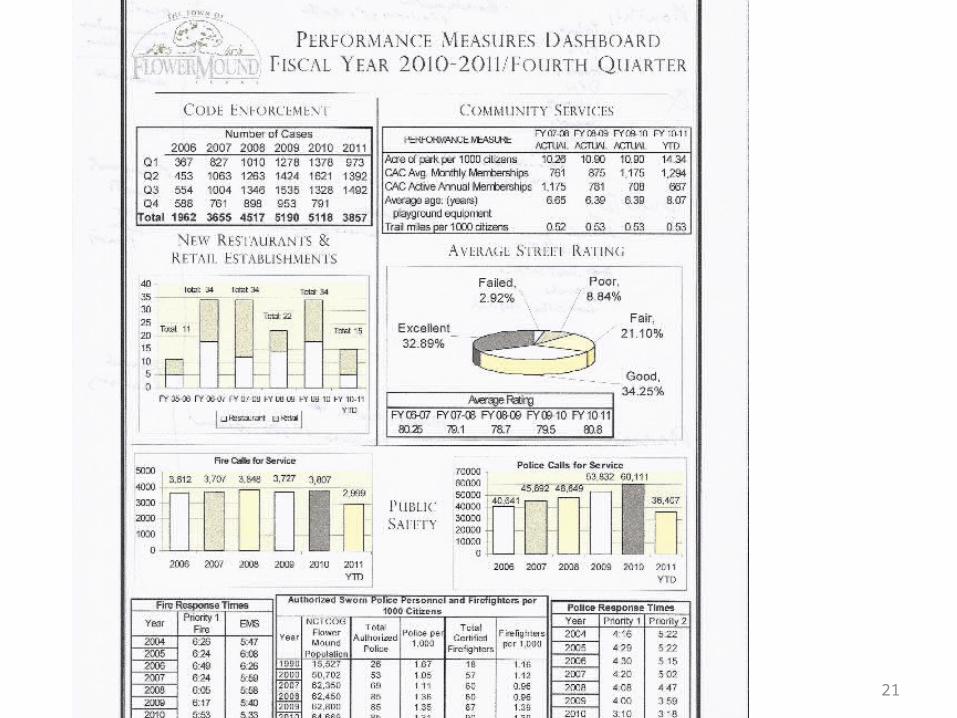
21
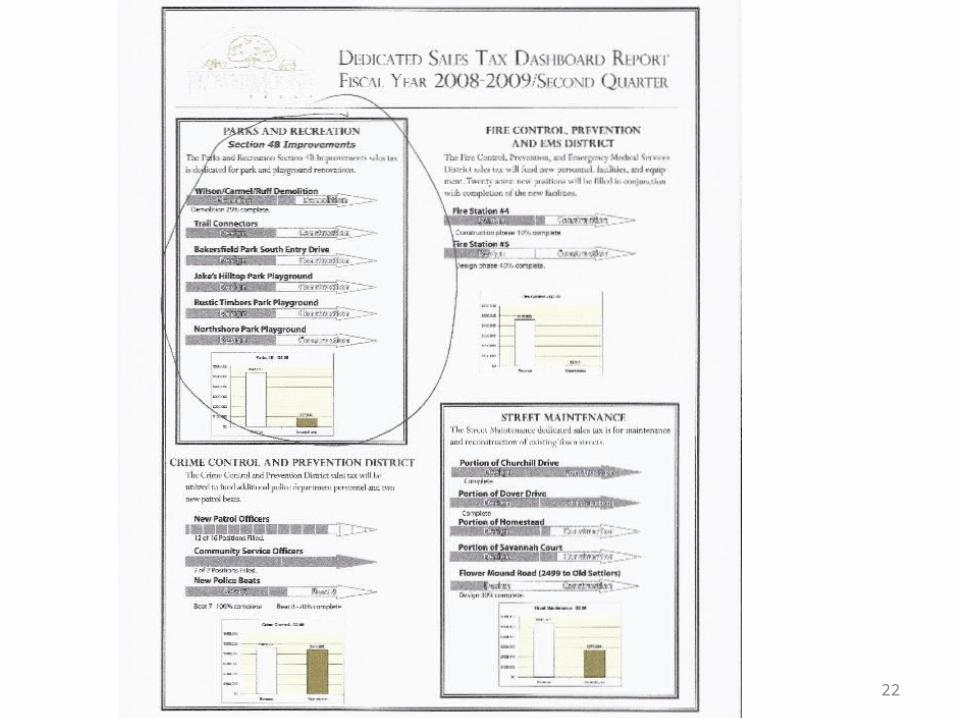
22
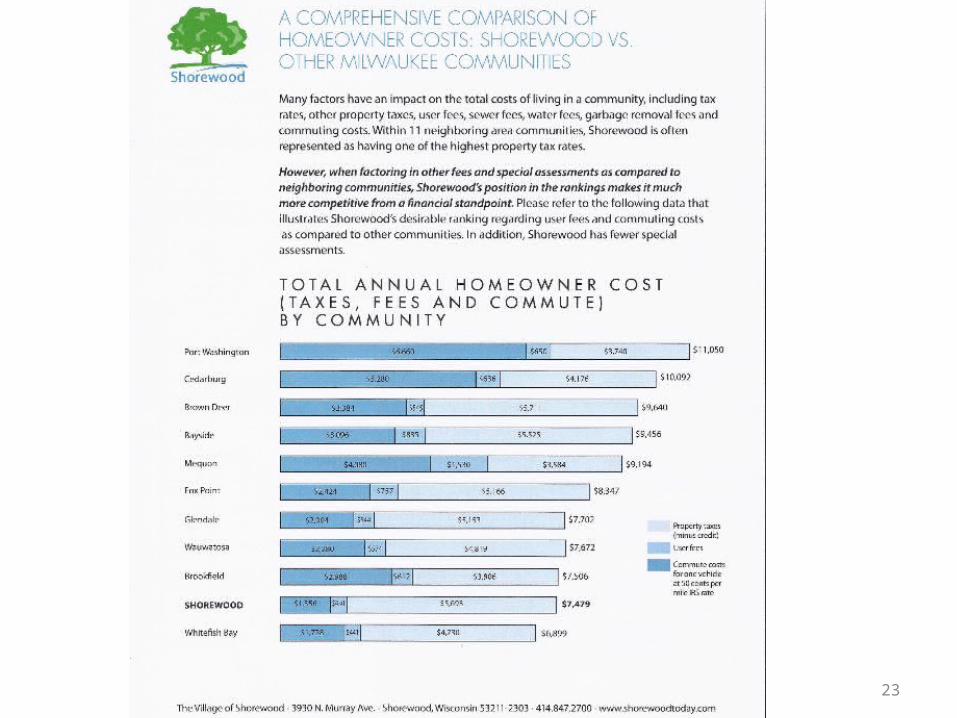
23
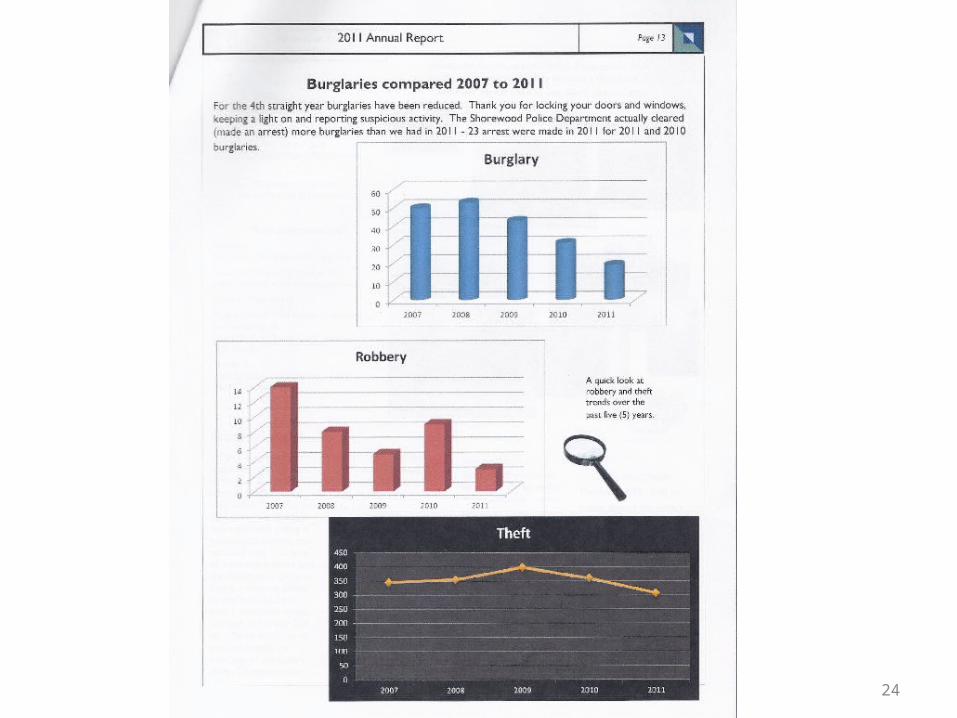
24
25
Collaboration
• Across Village Government Departments• Across Village Institutions
- Village Government- School District- Business Improvement District
• With other municipalities
26
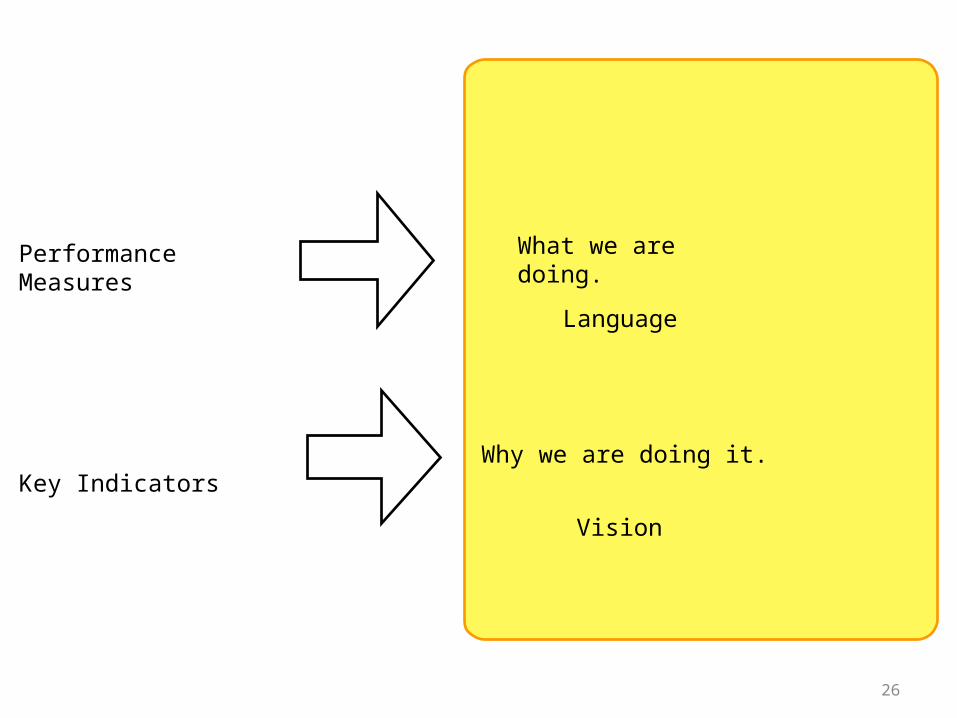
Performance Measures
Key Indicators
What we are doing.
Why we are doing it.
Language
Vision
27
Common Language
• Dashboards
• Establish Shared and Enduring Definitions
27
28
Common Vision
• Dashboards
• Tests Assumptions
• Measure Expectations
–Uncover Opportunities
29
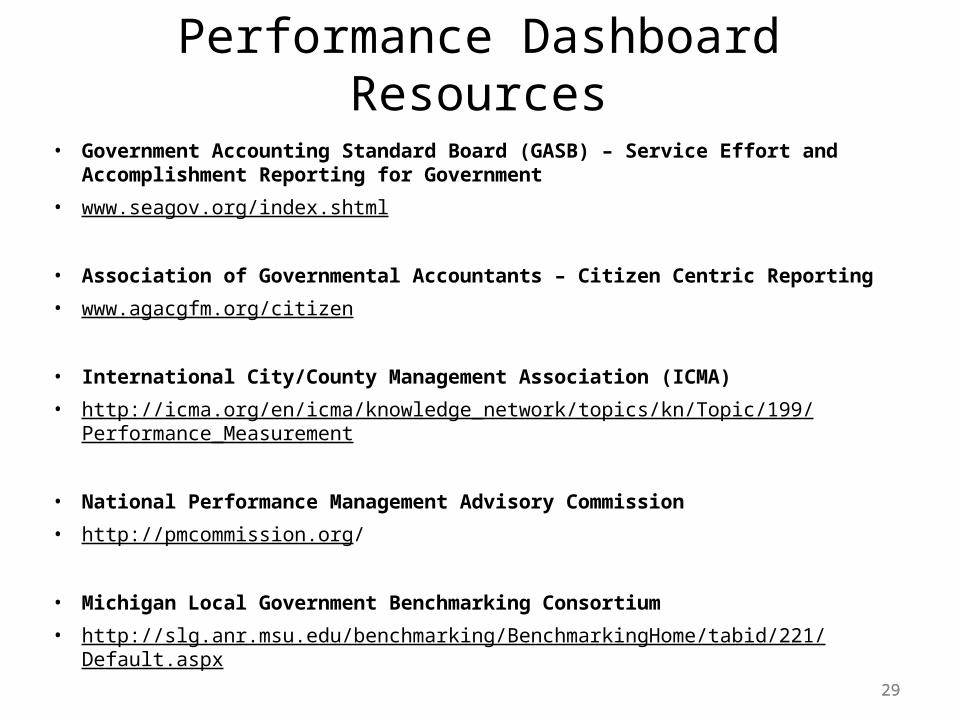
Performance Dashboard Resources
• Government Accounting Standard Board (GASB) – Service Effort and Accomplishment Reporting for Government
• www.seagov.org/index.shtml
• Association of Governmental Accountants – Citizen Centric Reporting
• www.agacgfm.org/citizen
• International City/County Management Association (ICMA)
• http://icma.org/en/icma/knowledge_network/topics/kn/Topic/199/Performance_Measurement
• National Performance Management Advisory Commission
• http://pmcommission.org/
• Michigan Local Government Benchmarking Consortium
• http://slg.anr.msu.edu/benchmarking/BenchmarkingHome/tabid/221/Default.aspx
• American Community Survey
29