Embed Size (px)
Citation preview
7 Candle Crescent, Kitchener Ontario, N2P 2K7
www.4roads.ca
Village of Newbury
Asset Management Plan
7 Candle Crescent,
Kitchener Ontario, N2P 2K7
Rpt_Newbury_amp_fin_20140427.docx
May 14, 2014
Village of Newbury 22910 Hagerty Road, PO Box 130, Newbury, Ontario, N0L 1Z0 Attention: Ms. Betty Gordon, Clerk Treasurer
Subject: Village of Newbury, Asset Management Plan Dear Ms. Gordon,
4 Roads Management Services Inc. (4 Roads), on behalf of CIMA+, is pleased to provide this Asset Management Plan to the Village of Newbury.
Report information and analysis is drawn from the following documents:
‘2013 Road Needs Study Report’ Stantec Consulting 2013
‘York Street Drainage Improvements’, CIMA Canada, 2013
‘State of the Infrastructure’, CIMA Canada, 2014
The Asset Management Plan references the above noted documents. Content is only repeated in this document as required. Given the nature of the Village of Newbury, we have adopted a simpler approach that we believe would better serve the provincial intent of requiring and Asset Management Plan without necessarily fulfilling all of the requirements. We trust that the information provided in this report will be beneficial to the Village of Newbury in the continuing evolution of their Asset Management Plans.
Please do not hesitate to call or email if you require any further information or discussion on any aspect of the report. Thank you for the opportunity to prepare this report. If 4 Roads Management Services Inc. may be of any further service, please do not hesitate to contact the undersigned.
Yours truly,
David Anderson, CET President, 4 Roads Management Services Inc. [email protected] 519 505 5065 Cc Tom Montgomery, P.Eng, Vice President Municipal Infrastructure, CIMA Canada Stuart Winchester, P.Eng, Partner, Manager, Municipal Infrastructure
7 Candle Crescent, Kitchener Ontario, N2P 2K7
www.4roads.ca
April 28, 2014
Village of Newbury
Asset Management Plan
Village of Newbury, Asset Management Plan April 28, 2014
Rpt_Newbury_amp_fin_20140427.docx
i
Executive Summary
In the fall of 2012, the Province of Ontario, introduced a requirement for an Asset Management Plan (AMP) as a prerequisite for municipalities seeking funding assistance for capital projects, from the province; effectively creating a conditional grant. To qualify for future infrastructure grants, an AMP has to be developed and approved by a municipal council by December 31, 2013. On April 26, 2013 the province announced that it had created a $100 million Infrastructure Fund for small, rural and northern municipalities.
The province requires AMP’s for Roads Structures, Water Collection and Distribution Facilities, Waste Water Collection and Treatment Facilities and Social Housing. The Village of Newbury (VoN) has responsibility for the local roads, water and waste water collection and distribution and waste water treatment. The VoN does not have any bridge or culvert structures with a greater than 3m span. Accordingly, the scope of this plan includes all of the aforementioned assets.
Project Overview and Approach
The Village of Newbury is located in Middlesex County in South West Ontario. The Village has very limited resources, both financial and staffing; the population is 439, and only one employee. The approach to this project is predicated upon these circumstances and as such, represents a higher level approach to the development of an Asset Management Plan that recognizes the immediate physical deficiencies that have to be addressed in the ten year horizon, and provides recommendations for fuller development of other aspects of a plan.
The following documents form the basis of the analysis and resultant plan:
‘2013 Road Needs Study Report’ Stantec Consulting, 2013
‘York Street Drainage Improvements’, CIMA Canada, 2013
‘State of the Infrastructure’, CIMA Canada, 2014
The scope of this report is to develop an AMP following the provincial guidelines producing an AMP with the following content
1. Executive Summary 2. Introduction 3. State of Local Infrastructure (SotI) 4. Desired Levels of Service 5. Asset Management Strategy 6. Financing Strategy
Village of Newbury, Asset Management Plan April 28, 2014
Rpt_Newbury_amp_fin_20140427.docx
ii
In order to develop the AMP, the following approach was adopted
1. Review of documentation that has been developed. 2. Development of Draft Asset Management and Financing Strategies 3. Village of Newbury staff review and comment on Draft 4. Presentation of Draft AMP to Council 5. Revision / Finalization of Asset Management and Financing Strategies 6. Final Report preparation 7. AMP presentation to, and adoption by, Council
State of the Infrastructure (SotI)
CIMA prepared a SotI Report Card in January 2014. The CIMA report integrates the findings of the Roads Needs Study, (Stantec Consulting 2013) with the other assets. The 2014 SotI provides an overview of the physical condition and replacement value of the assets the VoN is responsible for, in their entirety. The existing inventory data and condition ratings were used to develop programming and budgets. However, once an asset reaches the project design stage, further detailed review, investigation, and design will be required to address the specific requirements of each project. The York Street Drainage Improvements Report is an example of the detailed review and analysis that is required to reach the project stage.
For road assets, data and road condition ratings were completed generally in accordance with the Ministry of Transportation Ontario (MTO) Inventory Manual for Municipal Roads from 1991 during a survey in the summer of 2013 (Stantec Consulting Newbury 2013 Road Needs Study).
The remainder of the assets were evaluated in a report card format similar to what has recently been done by many different cities throughout Canada (such as Hamilton, Calgary, and Montreal). From the CIMA SotI report ‘The methodology used in preparing this analysis was based on the methodology developed by the American Society of Civil Engineers, which periodically prepares such a Report Card for American public infrastructure’. The SotI Report Card is shown as Table ES.1 immediately following the Executive Summary
In very general terms, the road and storm water assets are in the poorest condition and the thrust of the asset management plan will be to upgrade/replace the storm sewer drainage infrastructure in conjunction with the roads program over the next 10 years. The water and waste water and waste water treatment assets are relatively new and are believed to be in good condition.
The 2013 Road Needs Study (Stantec 2013) identifies that most road sections require drainage as there is minimal storm sewer servicing provided and most roads are built to a semi‐urban standard. The pavement condition itself is in fair condition, and could be sustained through regular resurfacing. However, the resurfacing cycle would be shortened due to the impact of the road bases not being drained. Adopting that approach would also not resolve the flooding problems that have been identified.
All Village of Newbury assets are in an Excel database. The 2013 Road Needs Study was developed in WorkTech Asset Manager Foundation and approximately 35 data fields were exported to Excel,
Village of Newbury, Asset Management Plan April 28, 2014
Rpt_Newbury_amp_fin_20140427.docx
iii
Asset Valuation
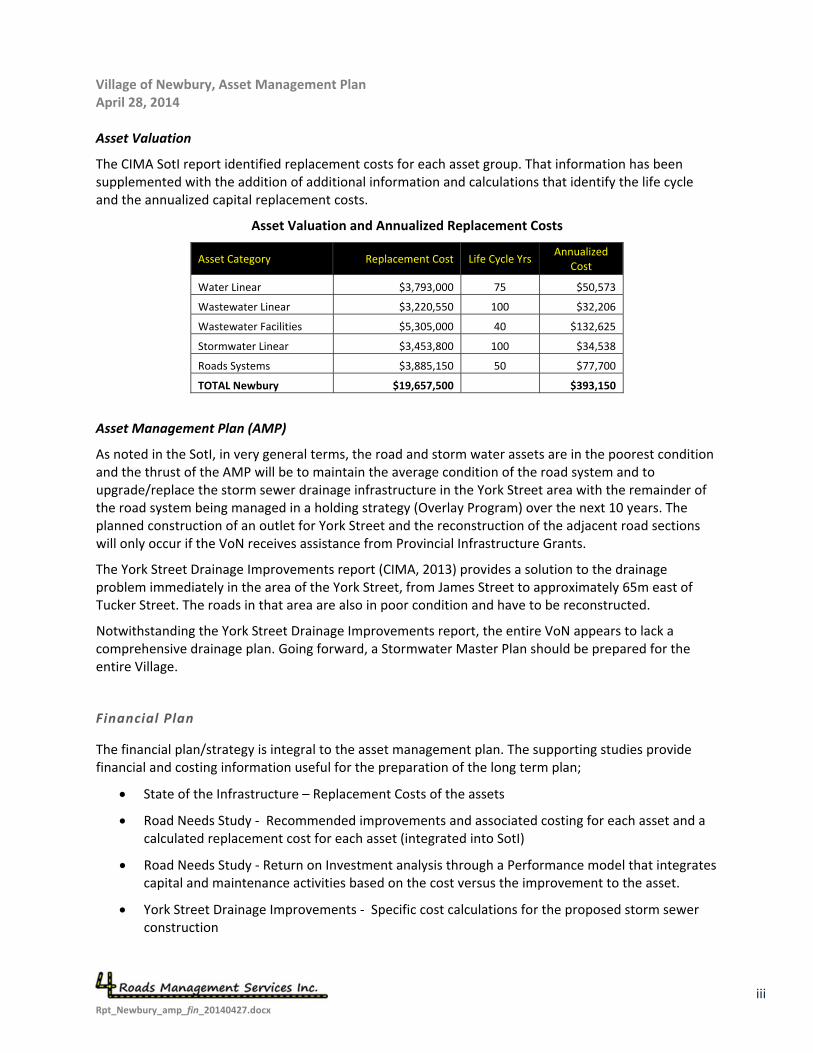
The CIMA SotI report identified replacement costs for each asset group. That information has been supplemented with the addition of additional information and calculations that identify the life cycle and the annualized capital replacement costs.
Asset Valuation and Annualized Replacement Costs
Asset Category Replacement Cost Life Cycle Yrs Annualized
Cost
Water Linear $3,793,000 75 $50,573
Wastewater Linear $3,220,550 100 $32,206
Wastewater Facilities $5,305,000 40 $132,625
Stormwater Linear $3,453,800 100 $34,538
Roads Systems $3,885,150 50 $77,700
TOTAL Newbury $19,657,500 $393,150
Asset Management Plan (AMP)
As noted in the SotI, in very general terms, the road and storm water assets are in the poorest condition and the thrust of the AMP will be to maintain the average condition of the road system and to upgrade/replace the storm sewer drainage infrastructure in the York Street area with the remainder of the road system being managed in a holding strategy (Overlay Program) over the next 10 years. The planned construction of an outlet for York Street and the reconstruction of the adjacent road sections will only occur if the VoN receives assistance from Provincial Infrastructure Grants.
The York Street Drainage Improvements report (CIMA, 2013) provides a solution to the drainage problem immediately in the area of the York Street, from James Street to approximately 65m east of Tucker Street. The roads in that area are also in poor condition and have to be reconstructed.
Notwithstanding the York Street Drainage Improvements report, the entire VoN appears to lack a comprehensive drainage plan. Going forward, a Stormwater Master Plan should be prepared for the entire Village.
Financial Plan
The financial plan/strategy is integral to the asset management plan. The supporting studies provide financial and costing information useful for the preparation of the long term plan;
State of the Infrastructure – Replacement Costs of the assets
Road Needs Study ‐ Recommended improvements and associated costing for each asset and a calculated replacement cost for each asset (integrated into SotI)
Road Needs Study ‐ Return on Investment analysis through a Performance model that integrates capital and maintenance activities based on the cost versus the improvement to the asset.
York Street Drainage Improvements ‐ Specific cost calculations for the proposed storm sewer construction
Village of Newbury, Asset Management Plan April 28, 2014
Rpt_Newbury_amp_fin_20140427.docx
iv
4 Roads understands that although there are established water and sewer rates, the current rates are subsidized through the levy supported budget.
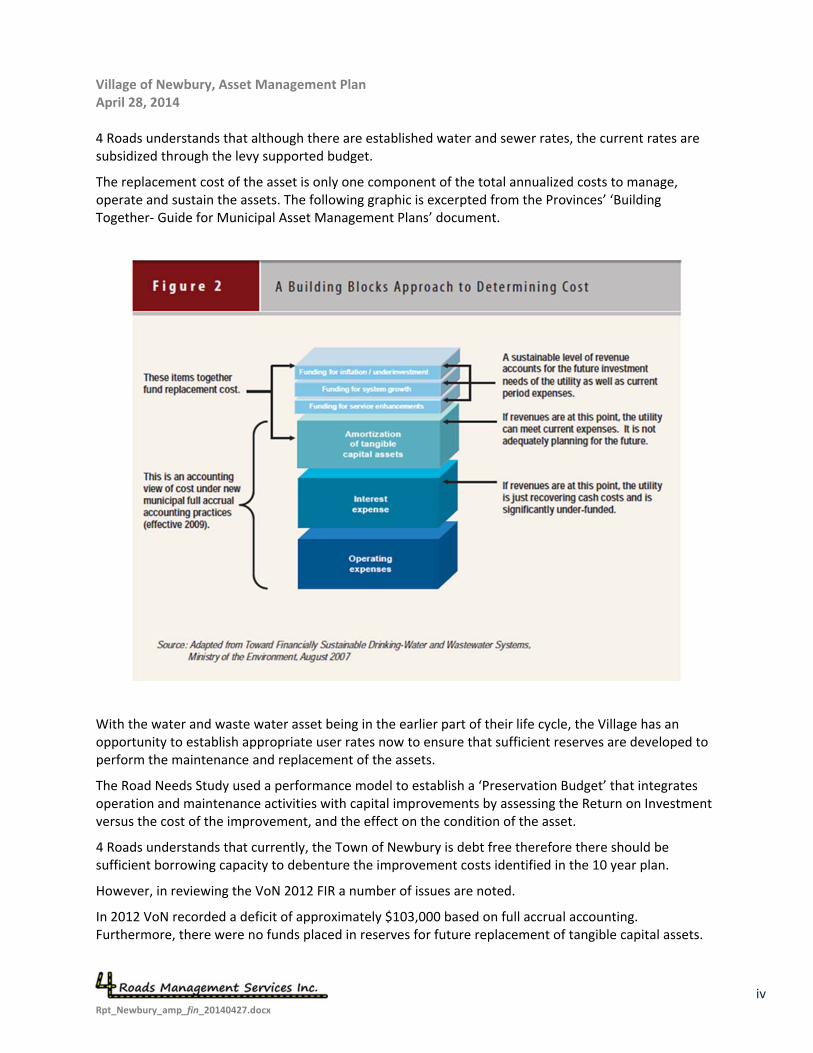
The replacement cost of the asset is only one component of the total annualized costs to manage, operate and sustain the assets. The following graphic is excerpted from the Provinces’ ‘Building Together‐ Guide for Municipal Asset Management Plans’ document.
With the water and waste water asset being in the earlier part of their life cycle, the Village has an opportunity to establish appropriate user rates now to ensure that sufficient reserves are developed to perform the maintenance and replacement of the assets.
The Road Needs Study used a performance model to establish a ‘Preservation Budget’ that integrates operation and maintenance activities with capital improvements by assessing the Return on Investment versus the cost of the improvement, and the effect on the condition of the asset.
4 Roads understands that currently, the Town of Newbury is debt free therefore there should be sufficient borrowing capacity to debenture the improvement costs identified in the 10 year plan.
However, in reviewing the VoN 2012 FIR a number of issues are noted.
In 2012 VoN recorded a deficit of approximately $103,000 based on full accrual accounting. Furthermore, there were no funds placed in reserves for future replacement of tangible capital assets.
Village of Newbury, Asset Management Plan April 28, 2014
Rpt_Newbury_amp_fin_20140427.docx
v
2012 year end reserve levels are approximately Water ‐ $33,000, Waste Water ‐ $14,000 and General ‐ $44,000. Annual amortization for 2012 was Water ‐ $39,000, Waste Water ‐ $133,000 and General ‐ $40,000. VoN should consider making annual contributions to replacement reserves to ensure sustainable financing into the future.
The 2012 FIR (Schedule 81) also indicates a maximum debt capacity of $583,000. This is based on a maximum annual debt payment limit of $131,000 (25% of own source revenues). While having capacity is beneficial, borrowing to the full capacity level would result in a major tax increase (Additional $133,000 on a base of $218,000). VoN should review its FIR debt capacity calculation as the 5 year term used in its calculation seems unreasonably short.
The Asset Management
Asset management strategies are critical to managing the performance of an asset group, more so, if funding is limited. Funding constraints should push the strategy toward those programs that extend the life cycle of the road by providing the correct treatment at the optimum time. For roads, resurfacing, rehabilitation, and preservation projects should be a higher priority than reconstruction projects. The objective is to “keep the good roads good”.
In addition to the budgetary recommendations, the following recommendations are provided for the management of the road and structures inventories;
1. The Village should develop an Asset Management Policy that may be adapted to all assets as plans for the other assets are developed.
2. Consider the Asset Management and budget recommendations included in this report to further
develop the longer term asset management plan in conjunction with a longer term financial
plan.
3. A Rate Study should be undertaken for the water and waste water assets to ensure that the
rates are sufficient to ensure long term viability of the water and waste water facilities.
4. The cycle for review of the road system should be continued, reviewing the entire system on a maximum four year cycle.
5. A Master Drainage Plan should be developed prior to reconstruction of the road network to
ensure that there is a legal, adequate outlet. The plan should be completed with consideration
to the Municipal Drain Systems.
6. Traffic counts should be undertaken to confirm the traffic volume and percentage of truck traffic
on roads in order to have adequate geometric and structural design and Regulation 239/02
classification.
7. Annual budget adjustments should account for inflation and increases for each asset group.
8. Capital reserves should be established for the road assets.
9. Capital Reserves Should be established for the rate supported assets
10. The asset management plan should be reviewed and revised annually from both condition and financial perspectives.
Village of Newbury, Asset Management Plan April 28, 2014
Rpt_Newbury_amp_fin_20140427.docx
vi
11. Programming for roads should be reviewed to ensure that resurfacing and preservation programs are optimized.
12. Traffic counts should be updated and repeated on a regular basis. The counting should include the percentage of truck traffic.
Village of Newbury, Asset Management Plan April 28, 2014
Rpt_Newbury_amp_fin_20140427.docx
vii
Summary Information
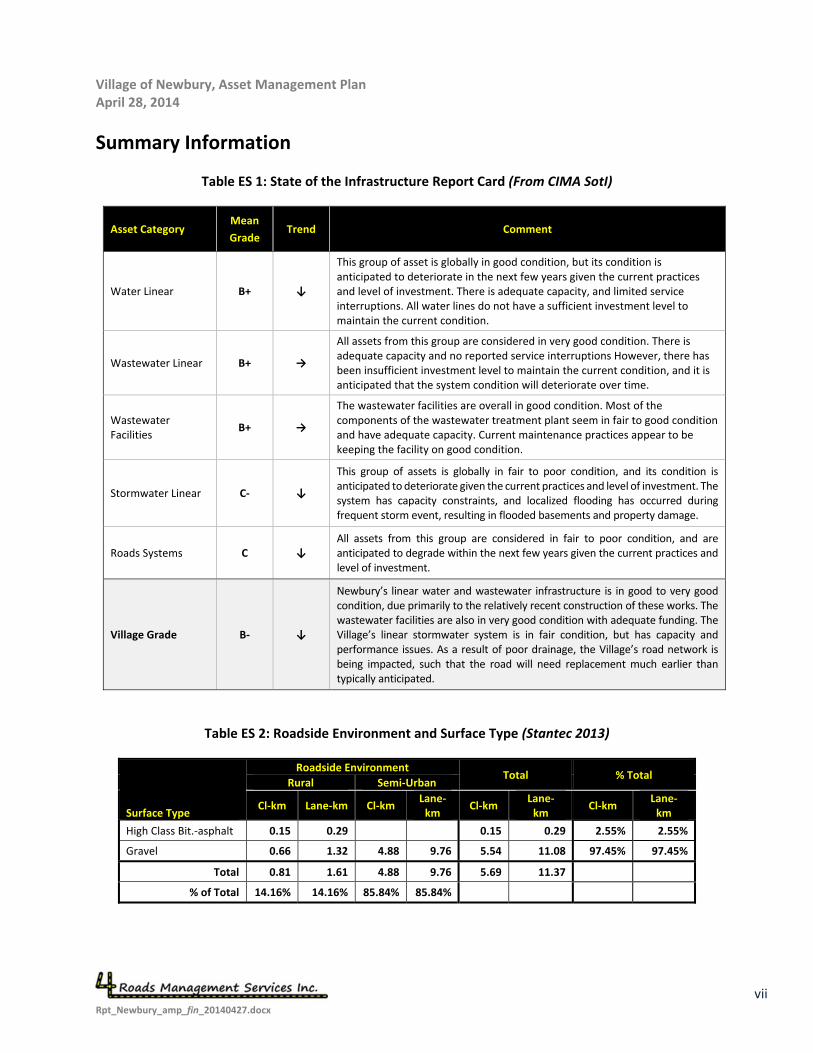
Table ES 1: State of the Infrastructure Report Card (From CIMA SotI)
Asset Category Mean
Grade Trend Comment
Water Linear B+ ↓
This group of asset is globally in good condition, but its condition is anticipated to deteriorate in the next few years given the current practices and level of investment. There is adequate capacity, and limited service interruptions. All water lines do not have a sufficient investment level to maintain the current condition.
Wastewater Linear B+ →
All assets from this group are considered in very good condition. There is adequate capacity and no reported service interruptions However, there has been insufficient investment level to maintain the current condition, and it is anticipated that the system condition will deteriorate over time.
Wastewater Facilities
B+ →
The wastewater facilities are overall in good condition. Most of the components of the wastewater treatment plant seem in fair to good condition and have adequate capacity. Current maintenance practices appear to be keeping the facility on good condition.
Stormwater Linear C‐ ↓
This group of assets is globally in fair to poor condition, and its condition is anticipated to deteriorate given the current practices and level of investment. The system has capacity constraints, and localized flooding has occurred during frequent storm event, resulting in flooded basements and property damage.
Roads Systems C ↓ All assets from this group are considered in fair to poor condition, and are anticipated to degrade within the next few years given the current practices and level of investment.
Village Grade B‐ ↓
Newbury’s linear water and wastewater infrastructure is in good to very good condition, due primarily to the relatively recent construction of these works. The wastewater facilities are also in very good condition with adequate funding. The Village’s linear stormwater system is in fair condition, but has capacity and performance issues. As a result of poor drainage, the Village’s road network is being impacted, such that the road will need replacement much earlier than typically anticipated.
Table ES 2: Roadside Environment and Surface Type (Stantec 2013)
Surface Type
Roadside Environment Total % Total
Rural Semi‐Urban
Cl‐km Lane‐km Cl‐km Lane‐km
Cl‐km Lane‐ km
Cl‐km Lane‐ km
High Class Bit.‐asphalt 0.15 0.29 0.15 0.29 2.55% 2.55%
Gravel 0.66 1.32 4.88 9.76 5.54 11.08 97.45% 97.45%
Total 0.81 1.61 4.88 9.76 5.69 11.37
% of Total 14.16% 14.16% 85.84% 85.84%
Village of Newbury, Asset Management Plan April 28, 2014
Rpt_Newbury_amp_fin_20140427.docx
viii
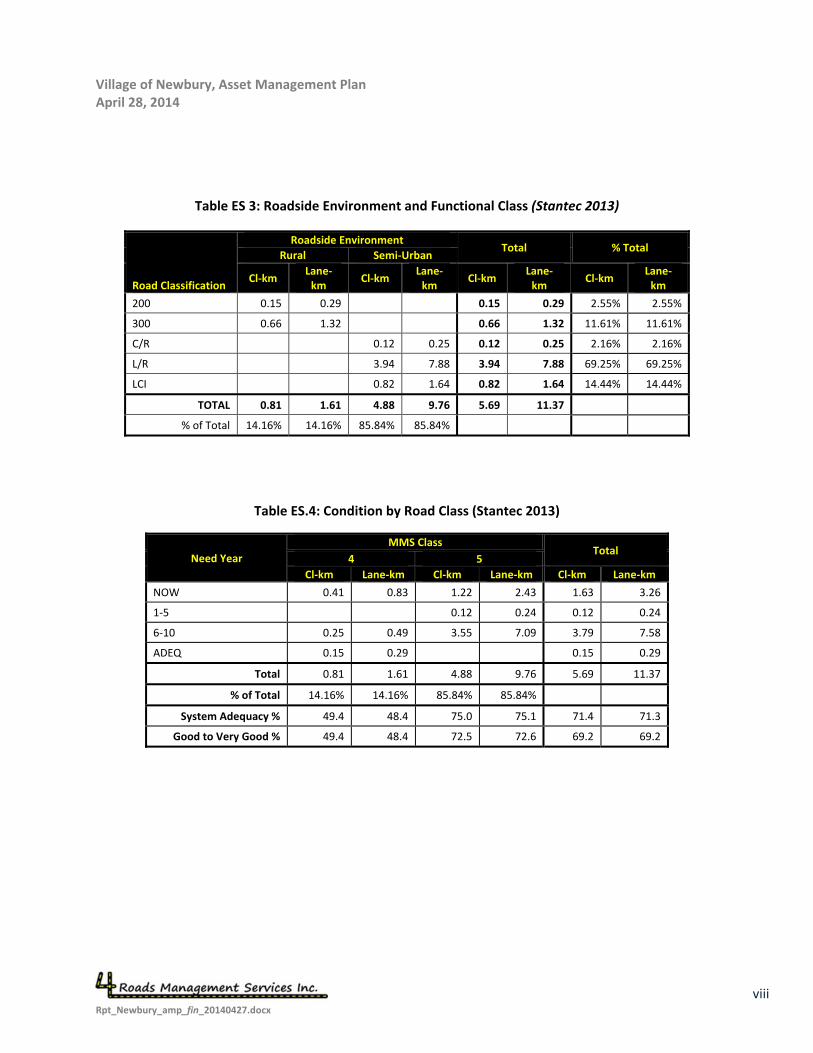
Table ES 3: Roadside Environment and Functional Class (Stantec 2013)
Road Classification
Roadside Environment Total % Total
Rural Semi‐Urban
Cl‐km Lane‐ km
Cl‐km Lane‐km
Cl‐km Lane‐ km
Cl‐km Lane‐ km
200 0.15 0.29 0.15 0.29 2.55% 2.55%
300 0.66 1.32 0.66 1.32 11.61% 11.61%
C/R 0.12 0.25 0.12 0.25 2.16% 2.16%
L/R 3.94 7.88 3.94 7.88 69.25% 69.25%
LCI 0.82 1.64 0.82 1.64 14.44% 14.44%
TOTAL 0.81 1.61 4.88 9.76 5.69 11.37
% of Total 14.16% 14.16% 85.84% 85.84%
Table ES.4: Condition by Road Class (Stantec 2013)
Need Year
MMS Class Total
4 5
Cl‐km Lane‐km Cl‐km Lane‐km Cl‐km Lane‐km
NOW 0.41 0.83 1.22 2.43 1.63 3.26
1‐5 0.12 0.24 0.12 0.24
6‐10 0.25 0.49 3.55 7.09 3.79 7.58
ADEQ 0.15 0.29 0.15 0.29
Total 0.81 1.61 4.88 9.76 5.69 11.37
% of Total 14.16% 14.16% 85.84% 85.84%
System Adequacy % 49.4 48.4 75.0 75.1 71.4 71.3
Good to Very Good % 49.4 48.4 72.5 72.6 69.2 69.2
Village of Newbury, Asset Management Plan April 28, 2014
Rpt_Newbury_amp_fin_20140427.docx
ix
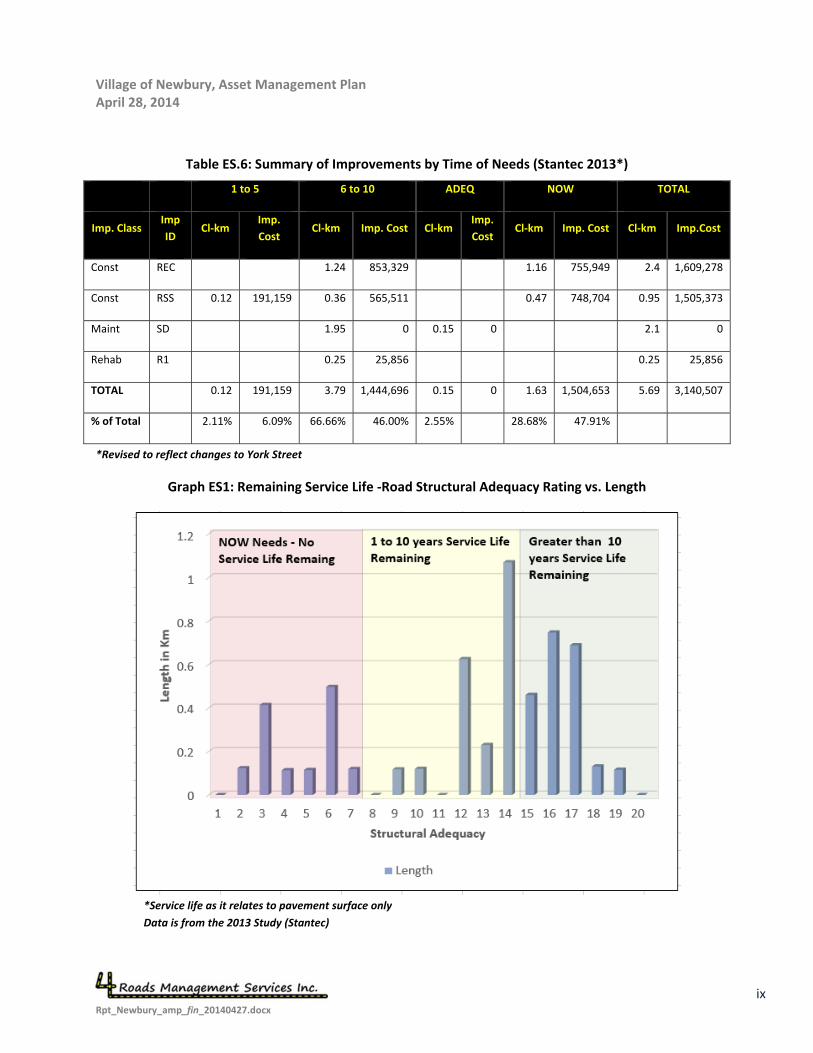
Table ES.6: Summary of Improvements by Time of Needs (Stantec 2013*)
1 to 5 6 to 10 ADEQ NOW TOTAL
Imp. Class Imp
ID Cl‐km
Imp.
Cost Cl‐km Imp. Cost Cl‐km
Imp.
Cost Cl‐km Imp. Cost Cl‐km Imp.Cost
Const REC 1.24 853,329 1.16 755,949 2.4 1,609,278
Const RSS 0.12 191,159 0.36 565,511 0.47 748,704 0.95 1,505,373
Maint SD 1.95 0 0.15 0 2.1 0
Rehab R1 0.25 25,856 0.25 25,856
TOTAL 0.12 191,159 3.79 1,444,696 0.15 0 1.63 1,504,653 5.69 3,140,507
% of Total 2.11% 6.09% 66.66% 46.00% 2.55% 28.68% 47.91%
*Revised to reflect changes to York Street
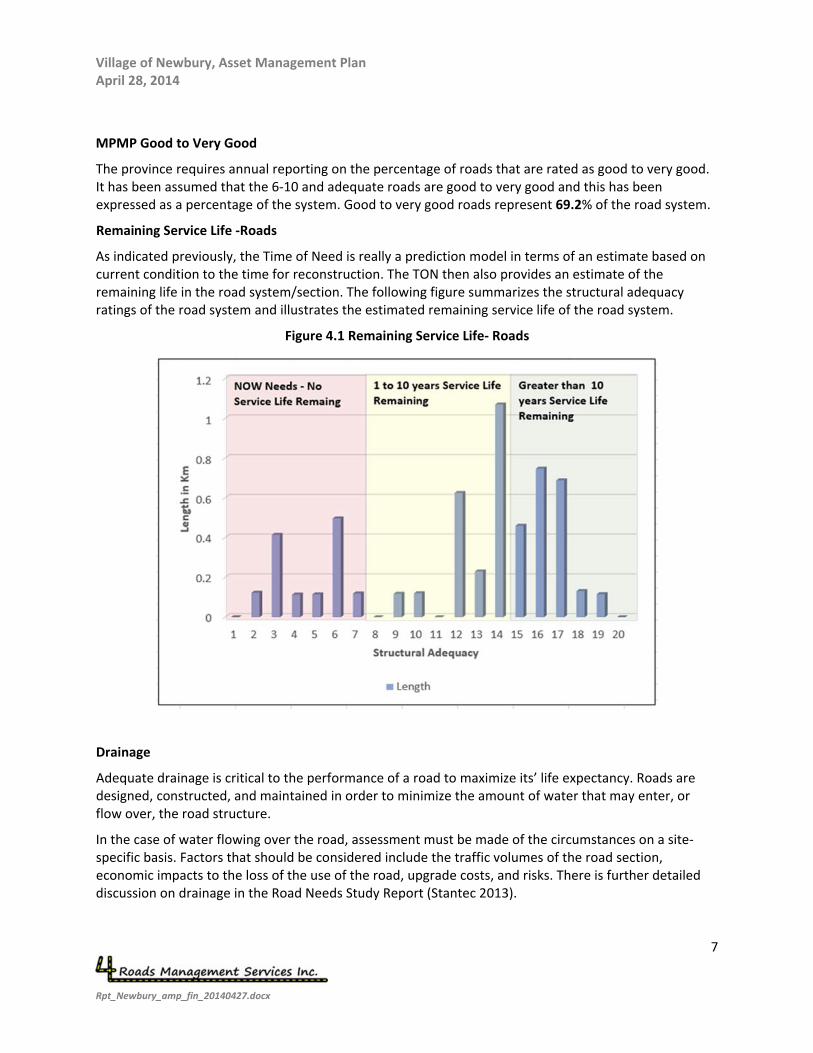
Graph ES1: Remaining Service Life ‐Road Structural Adequacy Rating vs. Length
*Service life as it relates to pavement surface only
Data is from the 2013 Study (Stantec)
Village of Newbury, Asset Management Plan April 28, 2014
Rpt_Newbury_amp_fin_20140427.docx x
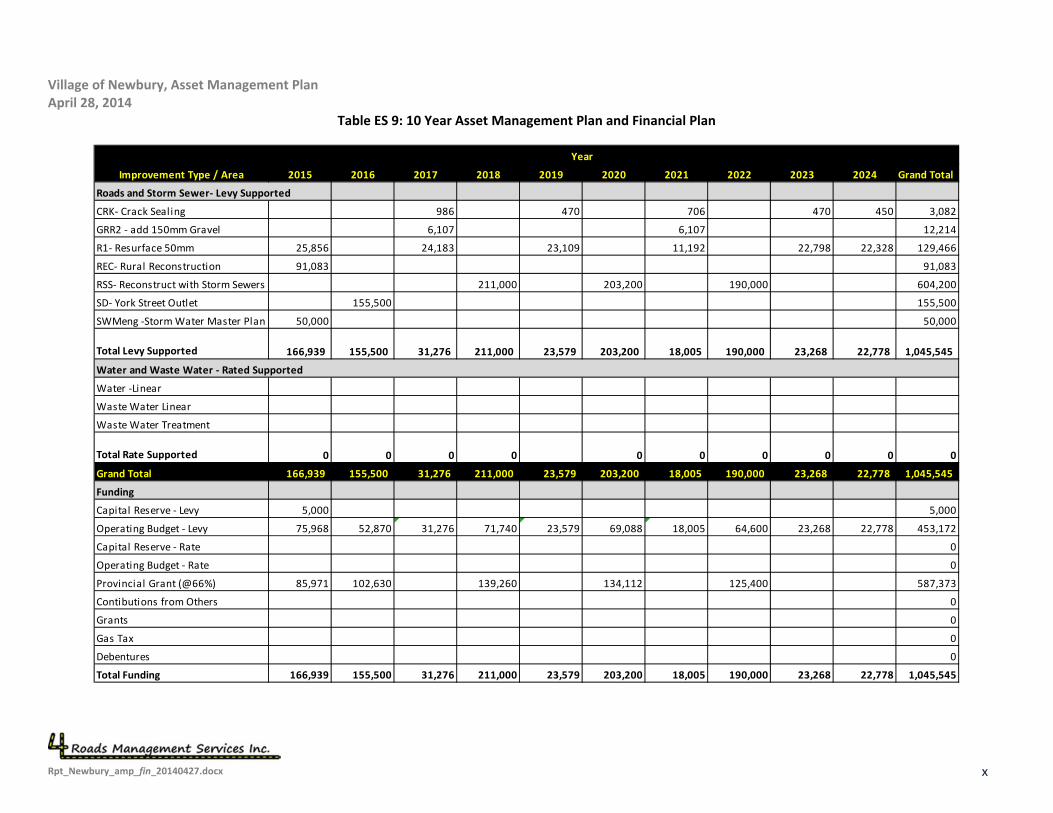
Table ES 9: 10 Year Asset Management Plan and Financial Plan
2015 2016 2017 2018 2019 2020 2021 2022 2023 2024 Grand Total
Roads and Storm Sewer‐ Levy Supported
CRK‐ Crack Sealing 986 470 706 470 450 3,082
GRR2 ‐ add 150mm Gravel 6,107 6,107 12,214
R1‐ Resurface 50mm 25,856 24,183 23,109 11,192 22,798 22,328 129,466
REC‐ Rural Reconstruction 91,083 91,083
RSS‐ Reconstruct with Storm Sewers 211,000 203,200 190,000 604,200
SD‐ York Street Outlet 155,500 155,500
SWMeng ‐Storm Water Master Plan 50,000 50,000
Total Levy Supported 166,939 155,500 31,276 211,000 23,579 203,200 18,005 190,000 23,268 22,778 1,045,545
Water and Waste Water ‐ Rated Supported
Water ‐Linear
Waste Water Linear
Waste Water Treatment
Total Rate Supported 0 0 0 0 0 0 0 0 0 0
Grand Total 166,939 155,500 31,276 211,000 23,579 203,200 18,005 190,000 23,268 22,778 1,045,545
Funding
Capital Reserve ‐ Levy 5,000 5,000
Operating Budget ‐ Levy 75,968 52,870 31,276 71,740 23,579 69,088 18,005 64,600 23,268 22,778 453,172
Capital Reserve ‐ Rate 0
Operating Budget ‐ Rate 0
Provincial Grant (@66%) 85,971 102,630 139,260 134,112 125,400 587,373
Contibutions from Others 0
Grants 0
Gas Tax 0
Debentures 0
Total Funding 166,939 155,500 31,276 211,000 23,579 203,200 18,005 190,000 23,268 22,778 1,045,545
Improvement Type / Area
Year
Village of Newbury, Asset Management Plan April 28, 2014
Contents
INTRODUCTION AND BACKGROUND .................................................................................................... 1
PROJECT APPROACH OVERVIEW ........................................................................................................... 2
ASSET CONDITION RATING METHODOLOGY ........................................................................................ 33.1 Asset Condition Rating Methodology ‐ Roads ...................................................................................... 3
3.1.1 Inventory Manual History ..................................................................................................... 33.2 Asset Condition Methodology – Water, and Waste Water, Collection and Distribution and Waste
Water Treatment .................................................................................................................................. 4
STATE OF THE INFRASTRUCTURE (SOTI) ............................................................................................... 54.1 State of the Infrastructure –Roads ........................................................................................................ 54.2 State of the Infrastructure – Water Linear (CIMA 2014) ...................................................................... 84.3 State of the Infrastructure ‐ Waste Water Linear (CIMA 2014) ............................................................ 84.4 State of the Infrastructure Waste Water Treatment (CIMA 2014) ....................................................... 9
RECORD OF ASSUMPTIONS –TON, IMPROVEMENT AND REPLACEMENT COSTS ............................... 10
REPLACEMENT COST VALUATIONS ..................................................................................................... 116.1 Replacement Cost Valuation –Roads (Stantec 2013) .......................................................................... 116.2 Replacement Cost Valuation – Water Linear (CIMA 2014) ................................................................. 116.3 Replacement Cost Valuation – Waste Water Linear (CIMA 2014) ...................................................... 116.4 Replacement Valuation – Storm Water Linear (CIMA 2014) .............................................................. 116.5 Replacement Cost Valuation – Waste Water Treatment (CIMA 2014) .............................................. 12
ASSET CONDITION ASSESSMENT AND PLAN UPDATES ....................................................................... 137.1 Condition Assessment Cycle Recommendation ‐ Roads ..................................................................... 137.2 Condition Assessment Cycle Recommendation – Waste Water Linear .............................................. 137.3 Condition Assessment Cycle Recommendation –Storm Water Linear ............................................... 137.4 Condition Assessment Cycle Recommendation – Water Linear ......................................................... 137.5 Condition Assessment Cycle – Waste Water Treatment Facilities ..................................................... 137.6 Asset Management Plan Updates ....................................................................................................... 13
LEVEL OF SERVICE (LOS) ...................................................................................................................... 148.1 LOS‐ Roads........................................................................................................................................... 148.2 LOS – Water and Waste Water ........................................................................................................... 14
PROGRAM FUNDING RECOMMENDATIONS ....................................................................................... 169.1 Overview ............................................................................................................................................. 169.2 Budget Recommendations ‐ Roads ..................................................................................................... 17
Village of Newbury, Asset Management Plan April 28, 2014
9.3 Budget Recommendations – Water and Waste Water, Collection, Distribution and Treatment ...... 189.4 Budget Recommendations – Storm Sewers ........................................................................................ 189.5 Performance Modeling‐ Budget Effect on Road System Performance and Proposed Storm Sewer
Upgrades ............................................................................................................................................. 199.5.1 Asset Management Plan and Strategy Analysis ................................................................. 199.5.2 Performance Model Overview ........................................................................................... 20
9.6 10 Year Program .................................................................................................................................. 20
ASSET MANAGEMENT STRATEGY ....................................................................................................... 2210.1Asset Management Overview ............................................................................................................. 2210.2Priority Rating vs. Condition Rating‐ Roads ........................................................................................ 2310.3Cross Asset Integration and Project Prioritization .............................................................................. 24
FINANCIAL STRATEGY AND PLAN ........................................................................................................ 2611.1Financial Plan Overview ...................................................................................................................... 2611.2Asset Management Plan / Financial Plan Decision Matrix .................................................................. 27
11.2.1 Non‐Infrastructure Solutions .............................................................................................. 2711.2.2 Maintenance Activities and Renewal / Rehabilitation Activities ....................................... 2711.2.3 Replacement Activities ....................................................................................................... 2811.2.4 Disposal Activities ............................................................................................................... 2811.2.5 Expansion Activities ............................................................................................................ 2811.2.6 Funding Sources ................................................................................................................. 28
11.3Asset/ Financial Plan ........................................................................................................................... 28
RECOMMENDATIONS .......................................................................................................................... 30
List of Tables Table 4.1: Surface Type Vs Roadside Environment ................................................................................... 5Table 4.2: Functional Classification vs Roadside Environment ................................................................. 5Table 4.3: MMS Class and Time of Need ................................................................................................... 6Table 4.4: Road Improvement Needs ....................................................................................................... 6Table 4.5: Water Linear (CIMA 2014) ........................................................................................................ 8Table 4.6: Waste Water Linear .................................................................................................................. 8Table 4.7: Waste Water Treatment (CIMA 2014) ..................................................................................... 9Table 6.1: Replacement Cost Valuations and Replacement Costs .......................................................... 11Table 11.1: Proposed AMP and Funding ................................................................................................... 29
Village of Newbury, Asset Management Plan April 28, 2014
List of Figures
Figure 4.1 Remaining Service Life‐ Roads .................................................................................................. 7Figure 9.1: Asset Life Cycle Costs (Building Blocks, MOI 2012) ................................................................ 16Figure 9.2: 10 Year Program – Annual Budget vs Average Budget .......................................................... 18Figure 10.1: Treatment Cost vs. Deterioration ........................................................................................... 24
List of Appendices
Appendix A: 10 Year Plan for Roads and York Street Drainage ...................................................................... Appendix B: York Street Outlet Plan ...............................................................................................................
Village of Newbury, Asset Management Plan April 28, 2014
1
Rpt_Newbury_amp_fin_20140427.docx
Introduction and Background In the fall of 2012, the Province of Ontario, introduced a requirement for an Asset Management Plan (AMP) as a prerequisite for municipalities seeking funding assistance for capital projects, from the province; effectively creating a conditional grant. To qualify for future infrastructure grants, municipalities are required to develop an AMP that is approved by council by December 31, 2013. On April 26, the province announced that it had created a $100 million Infrastructure Fund for small, rural and northern municipalities. Accessing these funds requires an asset management plan.
The province requires AMP’s for Roads, Structures, Water and Waste Water treatment collection and distribution and Social housing. The Village of Newbury (VoN) has responsibility for the local roads, water and waste water collection and distribution and waste water treatment. The VoN does not have any bridge or culvert structures with a greater than 3m span. Accordingly, the scope of this plan includes all of the aforementioned assets.
The provincial requirements for content of an AMP include;
1. Executive Summary 2. Introduction 3. State of the Local infrastructure 4. Expected Levels of Services 5. Asset Management Strategy and, 6. Financing Strategy
The Village of Newbury is located in Middlesex County in South West Ontario. The Village has very limited resources, both financial and staffing; the population is 439, and only one employee. The approach to this project is predicated upon these circumstances and as such, represents a higher level approach to the development of an Asset Management Plan that recognizes the immediate physical deficiencies that have to be addressed in the ten year horizon, and provides recommendations for fuller development of other aspects of a plan.
Key to the development of an AMP is a ‘State of the Infrastructure’ (SotI) review of the asset or asset group. Understanding the composition and replacement and maintenance costs of an asset group is essential to development of an AMP. This report incorporates the condition information from the following documents;
‘2013 Road Needs Study Report’ Stantec Consulting, 2013
‘York Street Drainage Improvements’, CIMA Canada, 2013
‘State of the Infrastructure’, CIMA Canada, 2014
Village of Newbury, Asset Management Plan April 28, 2014
2
Rpt_Newbury_amp_fin_20140427.docx
Project Approach Overview The VoN has been developing the background information for the preparation of the plan over the last 1 to 2 year period with the production of the Roads Needs Study, The State of the Infrastructure and the York Street Drainage Report. The provincial requirements for content of an AMP include are identified in Section 1 of this report.
In order to develop the AMP, the following approach was adopted
In order to develop the AMP, the following approach was adopted
1. Review of documentation that has been developed. 2. Development of Draft Asset Management and Financing Strategies 3. Village of Newbury staff review and comment on Draft 4. Presentation of Draft AMP to Council 5. Revision / Finalization of Asset Management and Financing Strategies 6. Final Report preparation 7. AMP presentation to, and adoption by, Council
Village of Newbury, Asset Management Plan April 28, 2014
3
Rpt_Newbury_amp_fin_20140427.docx
Asset Condition Rating Methodology
3.1 Asset Condition Rating Methodology ‐ Roads
The provincial requirements for AMP’s include asset condition assessment in accordance with standard engineering practices. The road section reviews follow the methodology of the Ministry of Transportation Inventory Manual for Municipal Roads, 1991.
The condition of the road system is mandated by provincial Legislation by the following:
Municipal Act 2001, Section 44 (1).The municipality that has jurisdiction over a highway or bridge shall keep it in a state of repair that is reasonable in the circumstances, including the character and location of the highway or bridge. 2001, c. 25, s. 44 (1).
Regulation 239/02 –Minimum Maintenance Standards for Municipal Highways ‐is a result of Section 44
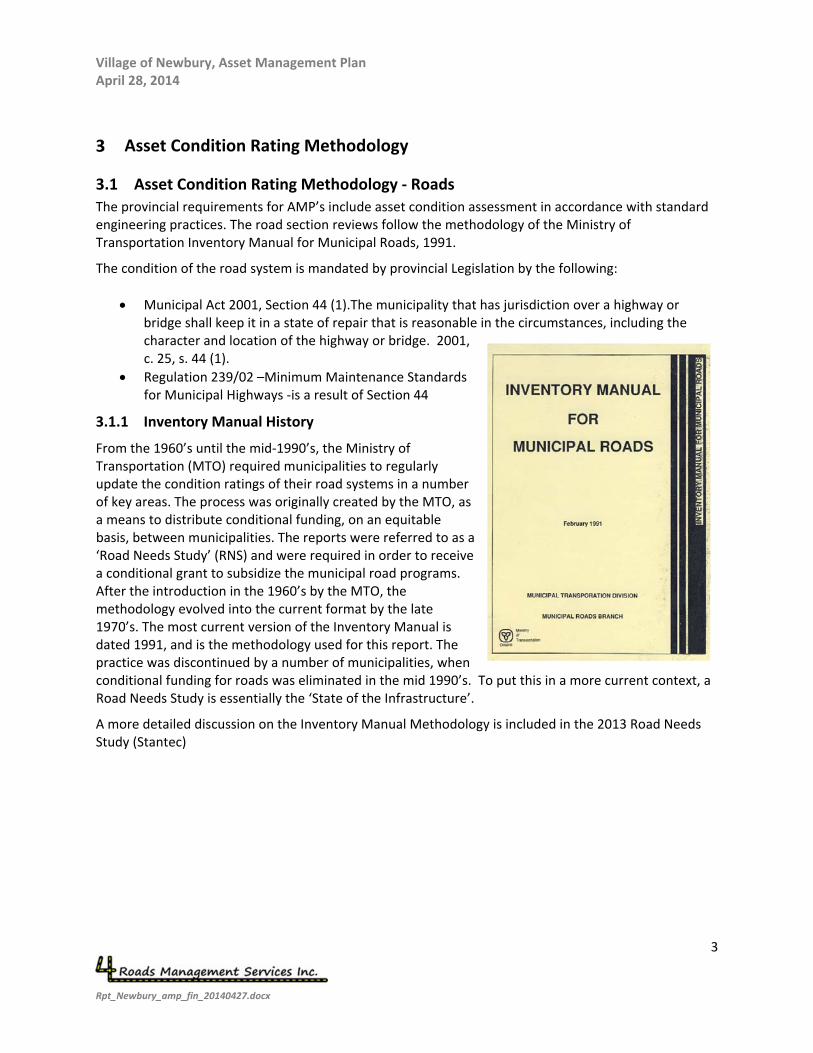
3.1.1 Inventory Manual History
From the 1960’s until the mid‐1990’s, the Ministry of Transportation (MTO) required municipalities to regularly update the condition ratings of their road systems in a number of key areas. The process was originally created by the MTO, as a means to distribute conditional funding, on an equitable basis, between municipalities. The reports were referred to as a ‘Road Needs Study’ (RNS) and were required in order to receive a conditional grant to subsidize the municipal road programs. After the introduction in the 1960’s by the MTO, the methodology evolved into the current format by the late 1970’s. The most current version of the Inventory Manual is dated 1991, and is the methodology used for this report. The practice was discontinued by a number of municipalities, when conditional funding for roads was eliminated in the mid 1990’s. To put this in a more current context, a Road Needs Study is essentially the ‘State of the Infrastructure’.
A more detailed discussion on the Inventory Manual Methodology is included in the 2013 Road Needs Study (Stantec)
Village of Newbury, Asset Management Plan April 28, 2014
4
Rpt_Newbury_amp_fin_20140427.docx
3.2 Asset Condition Methodology – Water, and Waste Water, Collection and
Distribution and Waste Water Treatment
The condition and performance of all aspects of water and waste water collection, distribution and
treatment is covered by Legislation and many Regulations. Standards for water and waste water quality
are set out in:
Safe Drinking Water Act, 2002
Ontario Regulation 169/03 (Water Quality Standards)
Ontario Regulation 170/03 (Drinking Water Systems)
Ontario Water Resources Act
Environmental Protection Act
The methodology used in preparing the analysis on the water and waste water infrastructure was based on the methodology developed by the American Society of Civil Engineers, which periodically prepares such a Report Card for American public infrastructure. The SotI report (CIMA 2014) indicates that this would be similar to the approach taken in other centres. A fuller description of the methodology is include in the CIMA SotI Report.
Village of Newbury, Asset Management Plan April 28, 2014
5
Rpt_Newbury_amp_fin_20140427.docx
State of the Infrastructure (SotI)
4.1 State of the Infrastructure –Roads
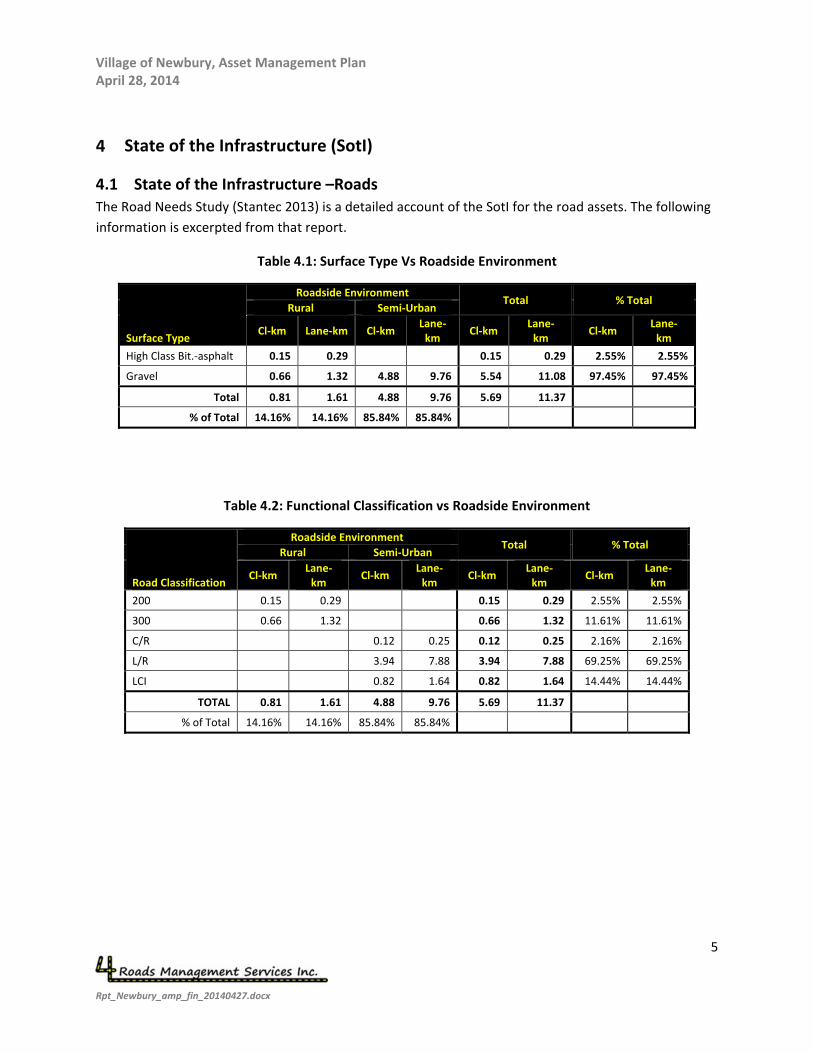
The Road Needs Study (Stantec 2013) is a detailed account of the SotI for the road assets. The following
information is excerpted from that report.
Table 4.1: Surface Type Vs Roadside Environment
Surface Type
Roadside Environment Total % Total
Rural Semi‐Urban
Cl‐km Lane‐km Cl‐km Lane‐km
Cl‐km Lane‐ km
Cl‐km Lane‐ km
High Class Bit.‐asphalt 0.15 0.29 0.15 0.29 2.55% 2.55%
Gravel 0.66 1.32 4.88 9.76 5.54 11.08 97.45% 97.45%
Total 0.81 1.61 4.88 9.76 5.69 11.37
% of Total 14.16% 14.16% 85.84% 85.84%
Table 4.2: Functional Classification vs Roadside Environment
Road Classification
Roadside Environment Total % Total
Rural Semi‐Urban
Cl‐km Lane‐ km
Cl‐km Lane‐km
Cl‐km Lane‐ km
Cl‐km Lane‐ km
200 0.15 0.29 0.15 0.29 2.55% 2.55%
300 0.66 1.32 0.66 1.32 11.61% 11.61%
C/R 0.12 0.25 0.12 0.25 2.16% 2.16%
L/R 3.94 7.88 3.94 7.88 69.25% 69.25%
LCI 0.82 1.64 0.82 1.64 14.44% 14.44%
TOTAL 0.81 1.61 4.88 9.76 5.69 11.37
% of Total 14.16% 14.16% 85.84% 85.84%
Village of Newbury, Asset Management Plan April 28, 2014
6
Rpt_Newbury_amp_fin_20140427.docx
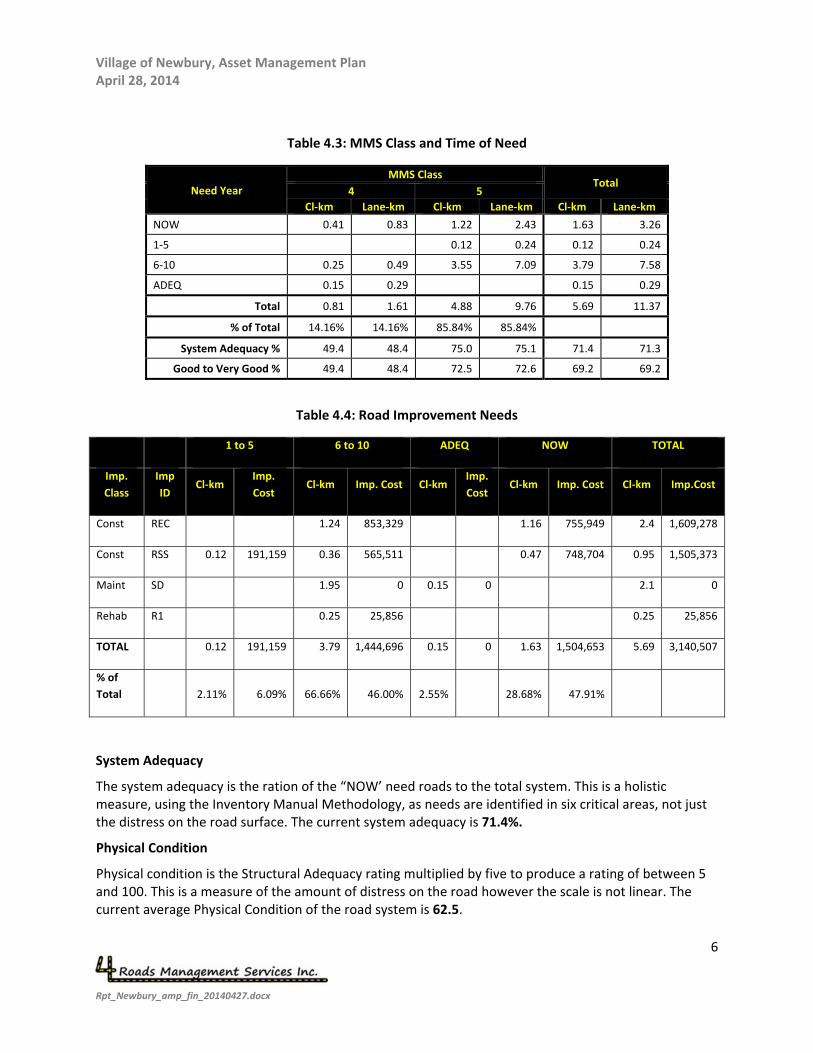
Table 4.3: MMS Class and Time of Need
Need Year
MMS Class Total
4 5
Cl‐km Lane‐km Cl‐km Lane‐km Cl‐km Lane‐km
NOW 0.41 0.83 1.22 2.43 1.63 3.26
1‐5 0.12 0.24 0.12 0.24
6‐10 0.25 0.49 3.55 7.09 3.79 7.58
ADEQ 0.15 0.29 0.15 0.29
Total 0.81 1.61 4.88 9.76 5.69 11.37
% of Total 14.16% 14.16% 85.84% 85.84%
System Adequacy % 49.4 48.4 75.0 75.1 71.4 71.3
Good to Very Good % 49.4 48.4 72.5 72.6 69.2 69.2
Table 4.4: Road Improvement Needs
1 to 5 6 to 10 ADEQ NOW TOTAL
Imp.
Class
Imp
ID Cl‐km
Imp.
Cost Cl‐km Imp. Cost Cl‐km
Imp.
Cost Cl‐km Imp. Cost Cl‐km Imp.Cost
Const REC 1.24 853,329 1.16 755,949 2.4 1,609,278
Const RSS 0.12 191,159 0.36 565,511 0.47 748,704 0.95 1,505,373
Maint SD 1.95 0 0.15 0 2.1 0
Rehab R1 0.25 25,856 0.25 25,856
TOTAL 0.12 191,159 3.79 1,444,696 0.15 0 1.63 1,504,653 5.69 3,140,507
% of
Total
2.11% 6.09% 66.66% 46.00% 2.55% 28.68% 47.91%
System Adequacy
The system adequacy is the ration of the “NOW’ need roads to the total system. This is a holistic measure, using the Inventory Manual Methodology, as needs are identified in six critical areas, not just the distress on the road surface. The current system adequacy is 71.4%.
Physical Condition
Physical condition is the Structural Adequacy rating multiplied by five to produce a rating of between 5 and 100. This is a measure of the amount of distress on the road however the scale is not linear. The current average Physical Condition of the road system is 62.5.
Village of Newbury, Asset Management Plan April 28, 2014
7
Rpt_Newbury_amp_fin_20140427.docx
MPMP Good to Very Good
The province requires annual reporting on the percentage of roads that are rated as good to very good. It has been assumed that the 6‐10 and adequate roads are good to very good and this has been expressed as a percentage of the system. Good to very good roads represent 69.2% of the road system.
Remaining Service Life ‐Roads
As indicated previously, the Time of Need is really a prediction model in terms of an estimate based on current condition to the time for reconstruction. The TON then also provides an estimate of the remaining life in the road system/section. The following figure summarizes the structural adequacy ratings of the road system and illustrates the estimated remaining service life of the road system.
Figure 4.1 Remaining Service Life‐ Roads
Drainage
Adequate drainage is critical to the performance of a road to maximize its’ life expectancy. Roads are designed, constructed, and maintained in order to minimize the amount of water that may enter, or flow over, the road structure.
In the case of water flowing over the road, assessment must be made of the circumstances on a site‐specific basis. Factors that should be considered include the traffic volumes of the road section, economic impacts to the loss of the use of the road, upgrade costs, and risks. There is further detailed discussion on drainage in the Road Needs Study Report (Stantec 2013).
Village of Newbury, Asset Management Plan April 28, 2014
8
Rpt_Newbury_amp_fin_20140427.docx
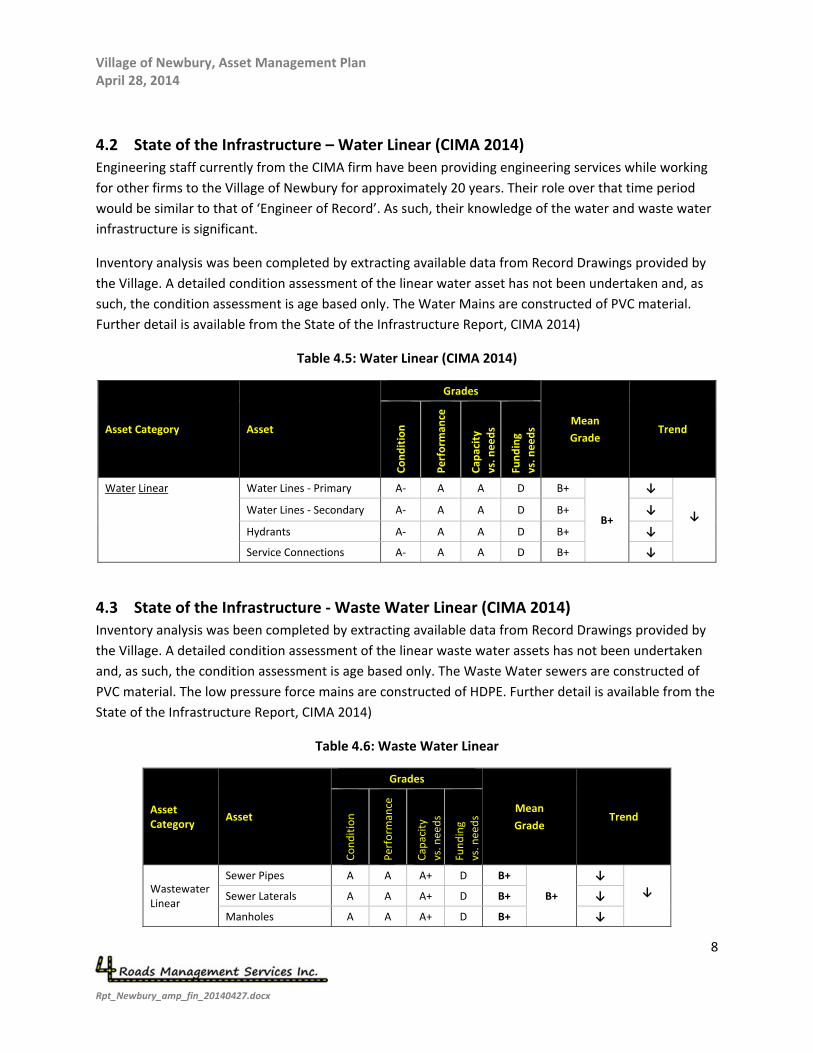
4.2 State of the Infrastructure – Water Linear (CIMA 2014)
Engineering staff currently from the CIMA firm have been providing engineering services while working
for other firms to the Village of Newbury for approximately 20 years. Their role over that time period
would be similar to that of ‘Engineer of Record’. As such, their knowledge of the water and waste water
infrastructure is significant.
Inventory analysis was been completed by extracting available data from Record Drawings provided by
the Village. A detailed condition assessment of the linear water asset has not been undertaken and, as
such, the condition assessment is age based only. The Water Mains are constructed of PVC material.
Further detail is available from the State of the Infrastructure Report, CIMA 2014)
Table 4.5: Water Linear (CIMA 2014)
Asset Category Asset
Grades
Mean
Grade Trend
Condition
Perform
ance
Cap
acity
vs. n
eeds
Funding
vs. n
eeds
Water Linear Water Lines ‐ Primary A‐ A A D B+
B+
↓
↓ Water Lines ‐ Secondary A‐ A A D B+ ↓
Hydrants A‐ A A D B+ ↓
Service Connections A‐ A A D B+ ↓
4.3 State of the Infrastructure ‐ Waste Water Linear (CIMA 2014)
Inventory analysis was been completed by extracting available data from Record Drawings provided by
the Village. A detailed condition assessment of the linear waste water assets has not been undertaken
and, as such, the condition assessment is age based only. The Waste Water sewers are constructed of
PVC material. The low pressure force mains are constructed of HDPE. Further detail is available from the
State of the Infrastructure Report, CIMA 2014)
Table 4.6: Waste Water Linear
Asset Category
Asset
Grades
Mean
Grade Trend
Condition
Perform
ance
Capacity
vs. needs
Funding
vs. needs
Wastewater Linear
Sewer Pipes A A A+ D B+
B+
↓
↓ Sewer Laterals A A A+ D B+ ↓
Manholes A A A+ D B+ ↓
Village of Newbury, Asset Management Plan April 28, 2014
9
Rpt_Newbury_amp_fin_20140427.docx
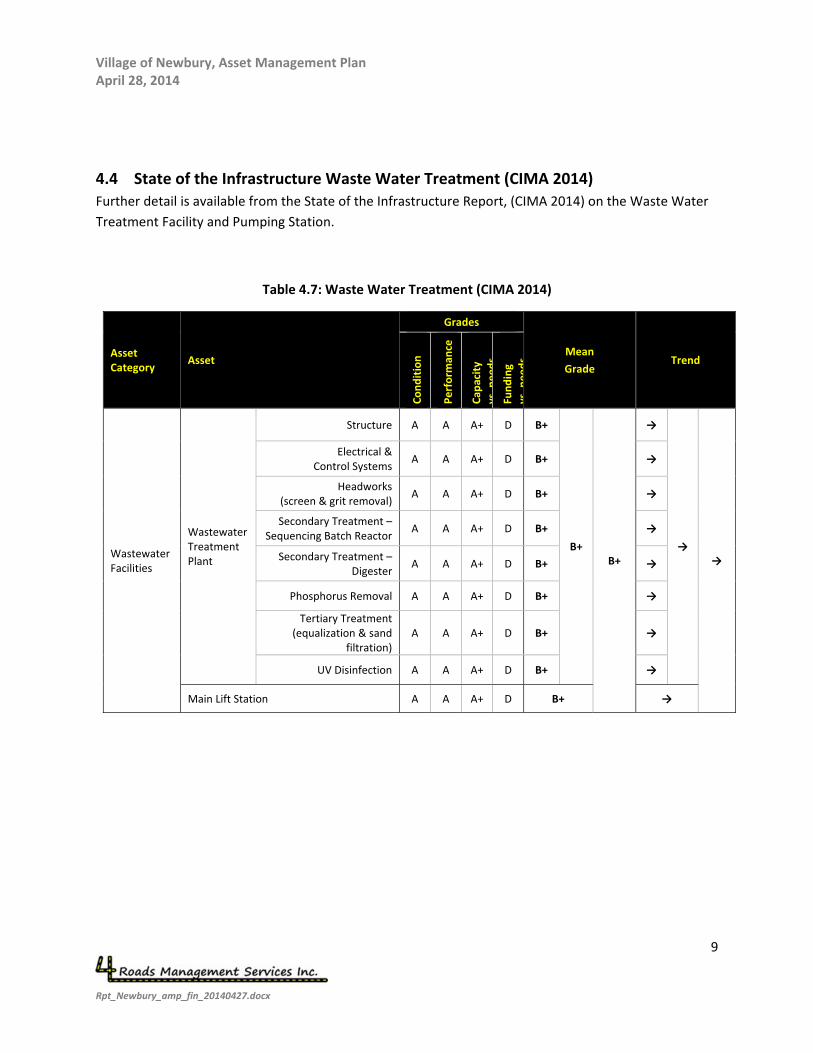
4.4 State of the Infrastructure Waste Water Treatment (CIMA 2014)
Further detail is available from the State of the Infrastructure Report, (CIMA 2014) on the Waste Water
Treatment Facility and Pumping Station.
Table 4.7: Waste Water Treatment (CIMA 2014)
Asset Category
Asset
Grades
Mean
Grade Trend
Condition
Perform
ance
Cap
acity
vsneeds
Funding
vsneeds
Wastewater Facilities
Wastewater Treatment Plant
Structure A A A+ D B+
B+ B+
→
→ →
Electrical & Control Systems
A A A+ D B+ →
Headworks (screen & grit removal)
A A A+ D B+ →
Secondary Treatment – Sequencing Batch Reactor
A A A+ D B+ →
Secondary Treatment – Digester
A A A+ D B+ →
Phosphorus Removal A A A+ D B+ →
Tertiary Treatment (equalization & sand
filtration) A A A+ D B+ →
UV Disinfection A A A+ D B+ →
Main Lift Station A A A+ D B+ →
Village of Newbury, Asset Management Plan April 28, 2014
10
Rpt_Newbury_amp_fin_20140427.docx
Record of Assumptions –TON, Improvement and Replacement Costs For the road system, the methodology of this report is such that a number of the Inventory Manual itself forms the basis of a large number of assumptions in terms of;
Dimensional requirements for the development of improvement and replacement costs
Structural requirements based on road classification
Time of needs based on the ratings and subsequent calculations
For life cycle and performance modeling, Appendix B includes a description of the deterioration curves that were utilized for development of the asset management plan.
For water and waste water infrastructure, assumption for replacement and life cycles are as shown Sections 6 of this report.
Village of Newbury, Asset Management Plan April 28, 2014
11
Rpt_Newbury_amp_fin_20140427.docx
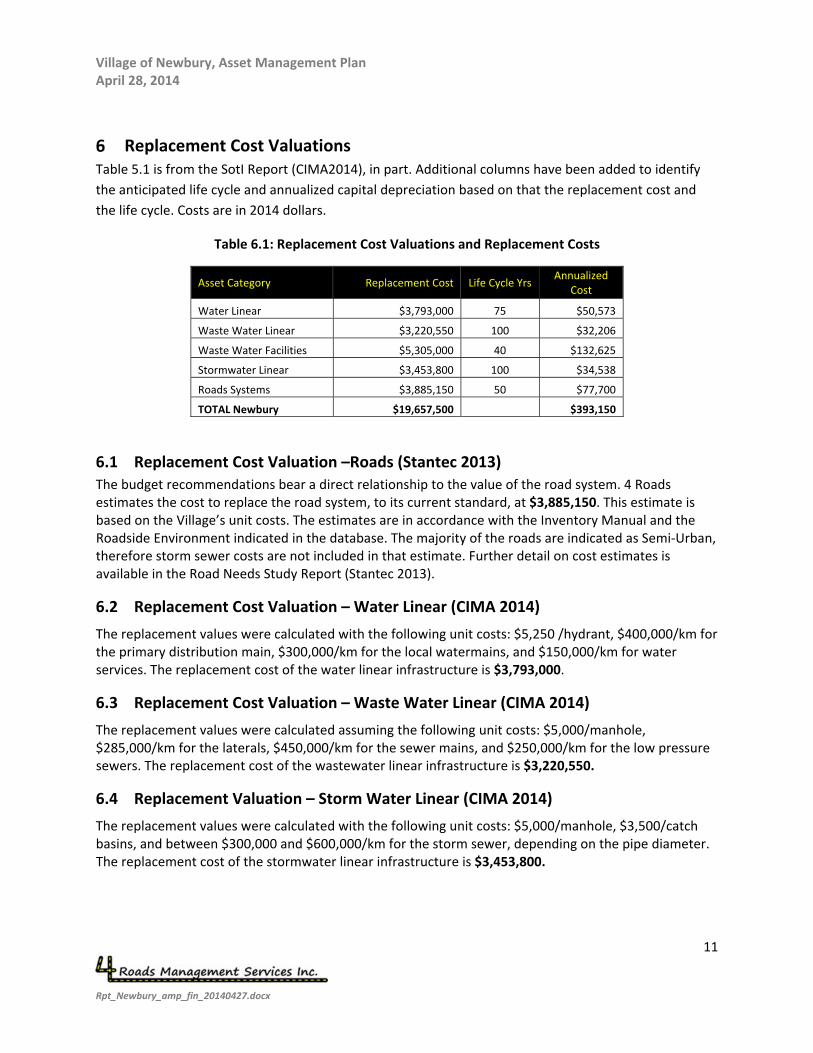
Replacement Cost Valuations Table 5.1 is from the SotI Report (CIMA2014), in part. Additional columns have been added to identify
the anticipated life cycle and annualized capital depreciation based on that the replacement cost and
the life cycle. Costs are in 2014 dollars.
Table 6.1: Replacement Cost Valuations and Replacement Costs
Asset Category Replacement Cost Life Cycle Yrs Annualized
Cost
Water Linear $3,793,000 75 $50,573
Waste Water Linear $3,220,550 100 $32,206
Waste Water Facilities $5,305,000 40 $132,625
Stormwater Linear $3,453,800 100 $34,538
Roads Systems $3,885,150 50 $77,700
TOTAL Newbury $19,657,500 $393,150
6.1 Replacement Cost Valuation –Roads (Stantec 2013)
The budget recommendations bear a direct relationship to the value of the road system. 4 Roads estimates the cost to replace the road system, to its current standard, at $3,885,150. This estimate is based on the Village’s unit costs. The estimates are in accordance with the Inventory Manual and the Roadside Environment indicated in the database. The majority of the roads are indicated as Semi‐Urban, therefore storm sewer costs are not included in that estimate. Further detail on cost estimates is available in the Road Needs Study Report (Stantec 2013).
6.2 Replacement Cost Valuation – Water Linear (CIMA 2014)
The replacement values were calculated with the following unit costs: $5,250 /hydrant, $400,000/km for the primary distribution main, $300,000/km for the local watermains, and $150,000/km for water services. The replacement cost of the water linear infrastructure is $3,793,000.
6.3 Replacement Cost Valuation – Waste Water Linear (CIMA 2014)
The replacement values were calculated assuming the following unit costs: $5,000/manhole, $285,000/km for the laterals, $450,000/km for the sewer mains, and $250,000/km for the low pressure sewers. The replacement cost of the wastewater linear infrastructure is $3,220,550.
6.4 Replacement Valuation – Storm Water Linear (CIMA 2014)
The replacement values were calculated with the following unit costs: $5,000/manhole, $3,500/catch basins, and between $300,000 and $600,000/km for the storm sewer, depending on the pipe diameter. The replacement cost of the stormwater linear infrastructure is $3,453,800.
Village of Newbury, Asset Management Plan April 28, 2014
12
Rpt_Newbury_amp_fin_20140427.docx
6.5 Replacement Cost Valuation – Waste Water Treatment (CIMA 2014)
The replacement value for the WWTP was calculated based on the 2003 cost with an allowance for escalation at 5% annually. The replacement cost for the lift station is based on current construction costs for similar stations. The replacement costs for Waste Water Treatment and Facilities is $5,305,000.
Village of Newbury, Asset Management Plan April 28, 2014
13
Rpt_Newbury_amp_fin_20140427.docx
Asset Condition Assessment and Plan Updates
7.1 Condition Assessment Cycle Recommendation ‐ Roads
4 Roads would recommend a four year cycle – maximum ‐ for review and update of road system condition ratings.
7.2 Condition Assessment Cycle Recommendation – Waste Water Linear
The gravity systems should be flushed and videoed every 10 to 15 years.
The low pressure system should be pressure tested every 10 to 15 years
7.3 Condition Assessment Cycle Recommendation –Storm Water Linear
The systems should be flushed and videoed every 10 to 15 years.
7.4 Condition Assessment Cycle Recommendation – Water Linear
Water Valves should be exercised and inspected annually.
Hydrant flows should be checked every 10 years
7.5 Condition Assessment Cycle – Waste Water Treatment Facilities
Waste water treatment facilities are complex facilities that include a number of different infrastructure
types that have varying lifecycle.
The waste water treatment facility should be reviewed every 5 years.
7.6 Asset Management Plan Updates
The Asset Management Plan should be reviewed annually to update the condition and financial
requirements to maintain the plan. This will ensure that fluctuations in market conditions and other
circumstances may be incorporated into the plan.
Village of Newbury, Asset Management Plan April 28, 2014
14
Rpt_Newbury_amp_fin_20140427.docx
Level of Service (LOS) Level of Service has a different meaning for different interests. For instance, the cost per unit may not have an impact to a ratepayer whose chief concern may be service delivery. Similarly, cost or expenditure per unit may not illustrate the condition of the asset to the end user. Further, municipalities are required to report on various Municipal Performance Measures (MPMP)
4 Roads believes that multiple service measures may be required to adequately relate the condition of an asset to the various user groups; condition, operating costs, and end user. The following sections identify various measurements of service of the road system
8.1 LOS‐ Roads
System Adequacy
The system adequacy is the ration of the “NOW’ need roads to the total system. This is a holistic measure, using the Inventory Manual Methodology, as needs are identified in six critical areas, not just the distress on the road surface. The current system adequacy is 71.4%.
The System Adequacy should be 60% as a minimum.
Physical Condition
Physical condition is the Structural Adequacy rating multiplied by five to produce a rating of between 5 and 100. This is a measure of the amount of distress on the road however the scale is not linear. The current average Physical Condition of the road system is 62.5.
The Average Physical condition should be 70 as a minimum
MPMP Good to Very Good
The province requires annual reporting on the percentage of roads that are rated as good to very good. It has been assumed that the 6‐10 and adequate roads are good to very good and this has been expressed as a percentage of the system. Good to very good roads represent 69.2% of the road system.
The good to very good roads should be 70% as a minimum.
8.2 LOS – Water and Waste Water
Water
The LOS targets for the water system are to provide uninterrupted service and have zero boil water advisories.
Waste Water
The LOS for the Waste Water Collection System is ensure the system has zero exfiltration and infiltration and that the linear assets have regular inspections to ensure rehabilitation to the system occur at the optimum time.
Village of Newbury, Asset Management Plan April 28, 2014
15
Rpt_Newbury_amp_fin_20140427.docx
Waste Water Treatment
The LOS targets for the Waste Water Treatment system are:
To be in compliance with the Certificate of Approval for operation of the plant.
To have zero bypass events
Village of Newbury, Asset Management Plan April 28, 2014
16
Rpt_Newbury_amp_fin_20140427.docx
Program Funding Recommendations
9.1 Overview
Budgetary recommendations in this report do not include items related to development and growth. The Village should consider those items as additional to the recommendations in this report. Generally, that type of improvement or expansion to the system would be funded from a different source, such as Development Charges.
Program funding recommendations are a function of the dimensional information, surface or material type, roadside environment, functional class of the individual assets and current unit costing. Recommended funding for an asset should ideally include sufficient capital expenditures that would allow the replacement of infrastructure as the end of design life is approached, in addition to sufficient funding for maintenance, to ensure that that full life expectancy may be realized. As a minimum, the funding level should be such the current average condition of the asset group may be maintained.
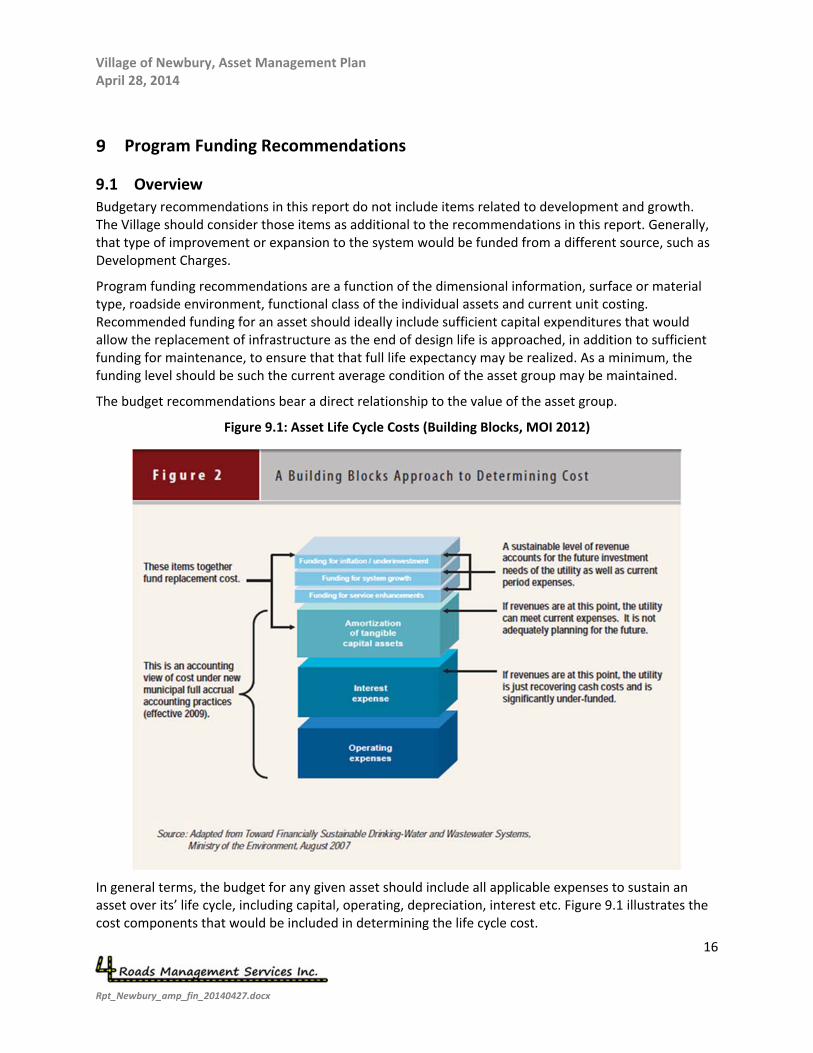
The budget recommendations bear a direct relationship to the value of the asset group.
Figure 9.1: Asset Life Cycle Costs (Building Blocks, MOI 2012)
In general terms, the budget for any given asset should include all applicable expenses to sustain an asset over its’ life cycle, including capital, operating, depreciation, interest etc. Figure 9.1 illustrates the cost components that would be included in determining the life cycle cost.
Village of Newbury, Asset Management Plan April 28, 2014
17
Rpt_Newbury_amp_fin_20140427.docx
There are alternate approaches that may be used to determine a budget that will sustain or improve the asset condition. For instance, a performance model that includes maintenance and capital improvements and treatments may also be used to develop a program and a sustainable budget.
In reviewing the VoN 2012 FIR a number of issues are noted. In 2012 VoN recorded a deficit of approximately $103,000 based on full accrual accounting. Furthermore, there were no funds placed in reserves for future replacement of tangible capital assets. 2012 year end reserve levels are approximately Water ‐ $33,000, Waste Water ‐ $14,000 and General ‐ $44,000. Annual amortization for 2012 was Water ‐ $39,000, Waste Water ‐ $133,000 and General ‐ $40,000. VoN should consider making annual contributions to replacement reserves to ensure sustainable financing into the future.
The 2012 FIR (Schedule 81) also indicates a maximum debt capacity of $583,000. This is based on a maximum annual debt payment limit of $131,000 (25% of own source revenues). While having capacity is beneficial, borrowing to the full capacity level would result in a major tax increase (Additional $133,000 on a base of $218,000). VoN should review its FIR debt capacity calculation as the 5 year term used in its calculation seems unreasonably short.
There may be additional financing schemes available such as local improvements, municipal drain programs, grants, fundraising and all alternatives should be actively pursued.
9.2 Budget Recommendations ‐ Roads
Based on the composition of the road system, budget recommendations have been developed for annual capital and maintenance programs as follows:
$77,700 for the roads capital/depreciation, excluding resurfacing, based upon a 50‐year life cycle. (this would be similar to the PSAB 3150 amortization value)
$28,100 for annual hot mix resurfacing, based upon a 20‐year cycle.
$2,200 annually for crack sealing
4 Roads has created a number of performance modeling scenarios for this project. The models are tied to a series of deterioration curves and maintenance and capital treatments that are required a certain condition levels. The improvement types include crack sealing, resurfacing either one or two lifts, and reconstruction.
The small size of the road system does not lend itself to a modeling scenario where the annual budget limit is the capital depreciation funding level. An annual budget cap of $77,000 would not permit the majority of projects to be completed as the reconstruction of a single block is typically greater than $77,700.
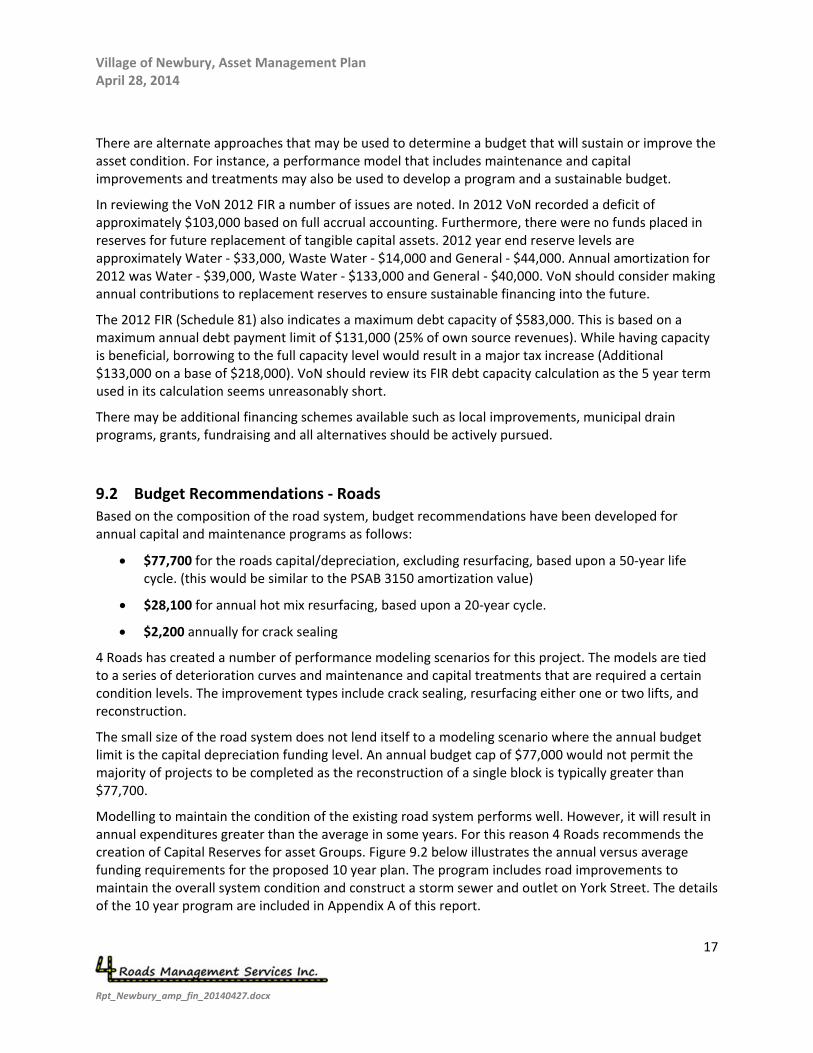
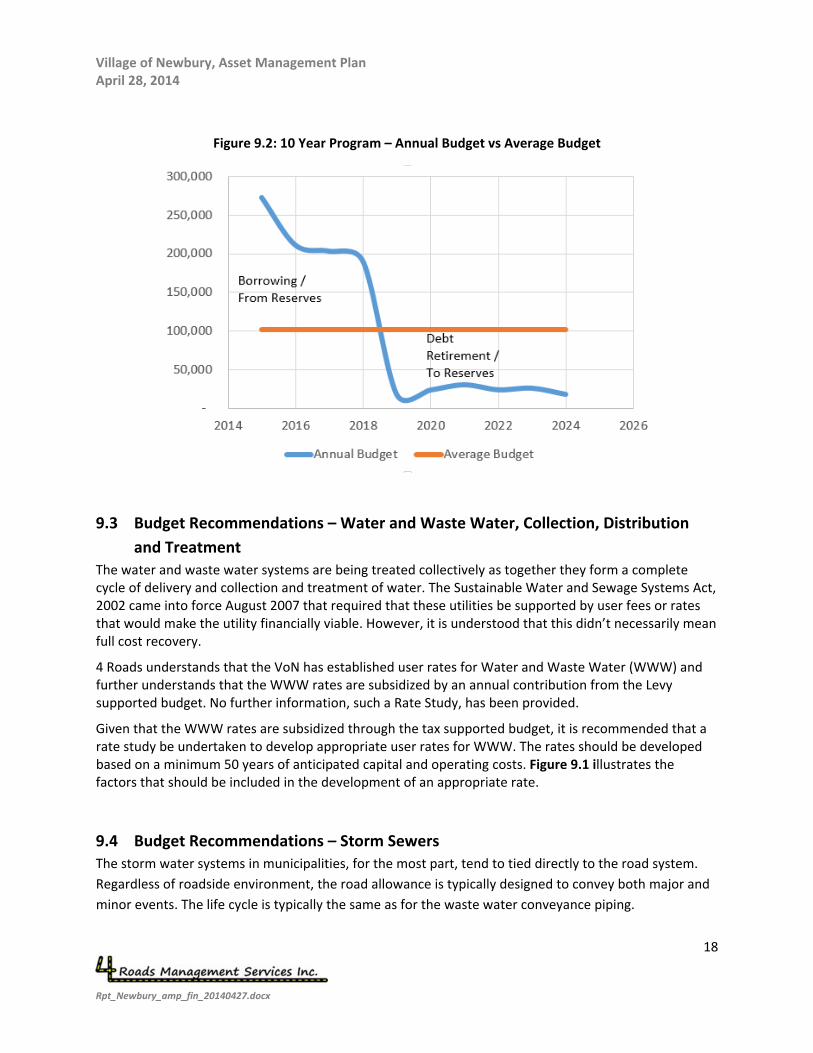
Modelling to maintain the condition of the existing road system performs well. However, it will result in annual expenditures greater than the average in some years. For this reason 4 Roads recommends the creation of Capital Reserves for asset Groups. Figure 9.2 below illustrates the annual versus average funding requirements for the proposed 10 year plan. The program includes road improvements to maintain the overall system condition and construct a storm sewer and outlet on York Street. The details of the 10 year program are included in Appendix A of this report.
Village of Newbury, Asset Management Plan April 28, 2014
18
Rpt_Newbury_amp_fin_20140427.docx
Figure 9.2: 10 Year Program – Annual Budget vs Average Budget
9.3 Budget Recommendations – Water and Waste Water, Collection, Distribution
and Treatment
The water and waste water systems are being treated collectively as together they form a complete cycle of delivery and collection and treatment of water. The Sustainable Water and Sewage Systems Act, 2002 came into force August 2007 that required that these utilities be supported by user fees or rates that would make the utility financially viable. However, it is understood that this didn’t necessarily mean full cost recovery.
4 Roads understands that the VoN has established user rates for Water and Waste Water (WWW) and further understands that the WWW rates are subsidized by an annual contribution from the Levy supported budget. No further information, such a Rate Study, has been provided.
Given that the WWW rates are subsidized through the tax supported budget, it is recommended that a rate study be undertaken to develop appropriate user rates for WWW. The rates should be developed based on a minimum 50 years of anticipated capital and operating costs. Figure 9.1 illustrates the factors that should be included in the development of an appropriate rate.
9.4 Budget Recommendations – Storm Sewers
The storm water systems in municipalities, for the most part, tend to tied directly to the road system.
Regardless of roadside environment, the road allowance is typically designed to convey both major and
minor events. The life cycle is typically the same as for the waste water conveyance piping.
Village of Newbury, Asset Management Plan April 28, 2014
19
Rpt_Newbury_amp_fin_20140427.docx
In South West Ontario, the Drainage Act is used to create legal outlets, usually for farmland but it has
been used to create outlets for developed lands also. 4 Roads understands that there is a number of
municipal drains in the VoN and that this is the storm sewer asset that has been identified in the SotI
Report (CIMA 2014).
Generally, Municipal Drains are not designed to a municipal standard for storm water and are therefore
much smaller in diameter than would be anticipated for drainage in an urban area. Further, municipal
drains are typically constructed of pipes with a butt joint to allow groundwater infiltration (to drain
farmland). Whereas the VoN appears to be serviced by a number of municipal drains, they do not
provide the same standard of service as a storm sewer. As roads within the VoN are reconstructed the
drainage system should be upgraded to a municipal standard.
Under the Drainage Act, the parties benefitting from the drainage afforded by the drain pay in
proportion to their benefit. This would be very similar to a ‘rate’ supported system except the costs are
not annualized, they are dealt with a required for maintenance and repairs.
A Master Drainage Plan is recommended for the VoN and the servicing of developed land that is
currently service by Municipal Drains be integrated into the Study.
9.5 Performance Modeling‐ Budget Effect on Road System Performance and
Proposed Storm Sewer Upgrades
9.5.1 Asset Management Plan and Strategy Analysis
The asset management plan is a function of the strategy and available financing. The development process for all elements is iterative, concurrent and holistic on a number of levels. It is complex.
The provincial guidelines for the preparation of an AMP indicate that the following must be considered;
Options must be compared on Lifecycle cost‐ the total cost of constructing, maintaining, renewing and operating an infrastructure asset throughout its service life. Future costs must be discounted and inflation must be incorporated.
Assessment of all other relevant direct and indirect costs and benefits associated with each option.
o Direct benefits and Costs Efficiencies and network effects Investment scheduling to appropriately time expansion in asset lifecycles Safety Environmental Vulnerability to climate change
o Indirect Benefits and Costs Municipal wellbeing and costs Amenity values Value of culturally or historically significant sites
Village of Newbury, Asset Management Plan April 28, 2014
20
Rpt_Newbury_amp_fin_20140427.docx
Municipal image
Assessment of Risks associated with all potential options. Each option must be evaluated based on its potential risk, using an approach that allows for comparative analysis. Risks associated with each option can be scored based on quantitative measures when reasonable estimates can be made of the probability of the risk event happening and the cost associated with the risk event. Qualitative measures can be used when reasonable estimates of probability and cost associated with the risk event cannot be made.
Significant effort (and expense) will be required to meet all of these requirements.
9.5.2 Performance Model Overview
A properly developed performance model will satisfy the majority of the requirements identified in the foregoing. Key elements of a Performance Model will include;
Deterioration Curves identifying anticipated deterioration of an appropriately constructed asset over the life cycle of the asset
‘Trigger’ points throughout the deterioration curve identifying appropriate treatments at condition ranges
Current costing for all treatments identified
To capture the essence of the provincial requirements, development and use of a Performance Model is recommended. Through modeling and the resultant outputs the following may be addressed;
Review of options and lifecycle effects based on a Return on Investment Analysis
Efficiencies and network effects
Budget requirements to achieve LOS goals
It is respectfully suggested that a 10 year AMP can be developed through a Performance model, however, 4 Roads is of the opinion a number of other requirements that the province has identified should not be addressed until they reach the project stage. Further, a number of those requirements would be addressed through a Class Environmental Assessment process.
Through performance modeling appropriate budget levels, programming and associated costs can be determined, delivering key elements of any plan that can be refined or revisited as circumstances change. Once a model is developed, then the effect of any alternatives may also be measured.
9.6 10 Year Program
4 Roads developed a model whose outcome is presented in this report as the 10 year capital plan. The model is designed to select maintenance and capital projects to maintain the system in its current condition and committed projects were identified to correct the York Street drainage problem. A Return on Investment (ROI) Performance Model scenario has been developed as the initial project selection process for the roads program. The details of the 10 year program are included in Appendix A of this report.
Village of Newbury, Asset Management Plan April 28, 2014
21
Rpt_Newbury_amp_fin_20140427.docx
The plan is predicated on the SotI report and the basic assumption that due to the WWW asset being at an early stage of their life cycle, there shouldn’t anything other than operating needs in the next 10 years.
Village of Newbury, Asset Management Plan April 28, 2014
22
Rpt_Newbury_amp_fin_20140427.docx
Asset Management Strategy
10.1 Asset Management Overview
Asset management has as almost as many definitions as there are agencies that manage assets. The American Association of State Highway and Transportation Officials (AASHTO) defines asset management as
“... a strategic approach to managing transportation infrastructure. It focuses on business processes for resource allocation and utilization with the objective of better decision‐making based upon quality information and well‐defined objectives.”
The document entitled Managing Public Infrastructure Assets, 2001, prepared by AMSA, AMWA, WEF, and AWWA, defines asset management as;
’managing infrastructure assets to minimize the total cost of owning and operating them, while continuously delivering the service levels customers desire, at an acceptable level of risk.’
The Province of Ontario’s document ‘Building Together‐ Guide for Municipal Asset Management Plans’ indicates
‘The asset management strategy is the set of actions that, taken together, has the lowest total cost‐ not the set of actions that each has the lowest cost individually’
Regardless of the source of the definition, the key themes that keep being repeated are;
Managing
Strategic
Effective
Efficient
$$$$$ !!
Service
Optimizing asset life cycle
Risk Management
As an absolute minimum, the objective of any asset management plan, or strategy, should be to ensure that the overall condition of an asset group does not does not diminish over time. The asset management strategy of an agency is heavily predicated, and inextricably linked to the available funding.
Focus should be on an asset management strategy that utilizes available funding on maintenance, preservation and rehabilitation programs as a priority. Reconstruction and replacement candidate will remain reconstruction and replacement candidates and cost increases will be incremental with inflation. Maintenance and Preservation opportunities that are missed will escalate in cost by several hundred percent depending on site specifics.
A similar approach should be considered for all asset groups
Develop the financial plan in order that there is sufficient funding to maintain the condition of, or make viable, the asset groups.
Village of Newbury, Asset Management Plan April 28, 2014
23
Rpt_Newbury_amp_fin_20140427.docx
Adjust / confirm the plan and funding requirements annually.
10.2 Priority Rating vs. Condition Rating‐ Roads
Information in a database may be sorted and analyzed in numerous ways. Understanding what information a data field represents, is key to the analysis. The Inventory Manual has many rated and calculated data fields and thus provides for many ways to sort data. Some commonly used representations, or sorting of information, from the database include:
Priority Rating
Priority Guide Number
Structural Adequacy (Condition)
Priority Rating is a calculated field in the Inventory Manual, and is a function of the traffic count and the overall condition rating of the road section. This approach adds weight to the traffic count of the section. Although the word ‘priority’ is included in the field name, a road section that has a higher calculated ‘Priority Rating’ is not necessarily a higher priority in the broader sense of asset management.
Similarly, a municipality may choose to sort the road sections based on condition and cost per vehicle. The Priority Guide Number data field would assist in providing that analysis, as sorting on that parameter would prioritize road sections that have higher traffic and thus a lower cost per vehicle.
Developing a road capital program around the Priority Rating or Priority Guide Number fields will likely result in programming that would lead to more rapid and widespread deterioration of the overall road system, as road sections with high traffic and in poor condition would be selected first, as opposed to selecting the best rehabilitation candidates at the appropriate time in their life cycles. The exception to this statement would be cases where rehabilitation funding is at a high enough level to ensure that the preservation program requirements can be met.
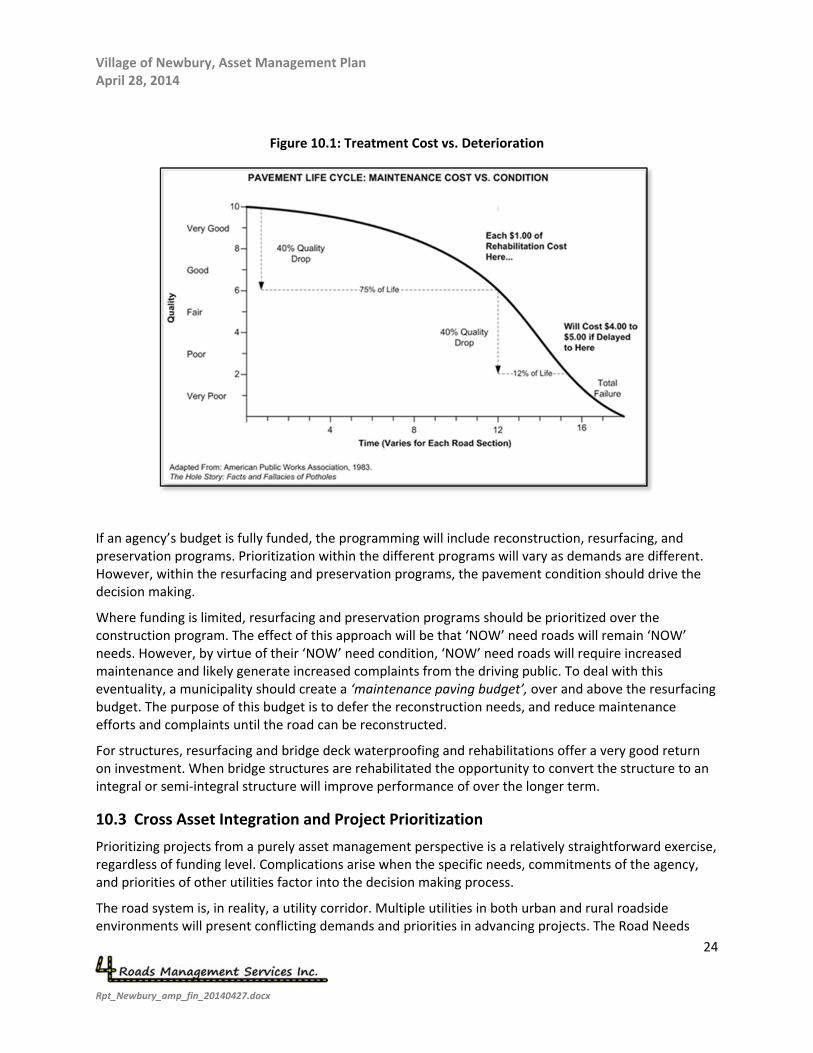
From a more current asset management perspective, project selection should be predicated by condition. (Structural Adequacy or PCI). Figure 10.1 clearly illustrates the financial advantages of managing the road system by performing the right treatment at the right time of the asset life cycle. If appropriate strategies are not undertaken at the correct time, there is a less effective usage of the available funding. Similar concepts may be applied to the structures inventory and other most assets
Village of Newbury, Asset Management Plan April 28, 2014
24
Rpt_Newbury_amp_fin_20140427.docx
Figure 10.1: Treatment Cost vs. Deterioration
If an agency’s budget is fully funded, the programming will include reconstruction, resurfacing, and preservation programs. Prioritization within the different programs will vary as demands are different. However, within the resurfacing and preservation programs, the pavement condition should drive the decision making.
Where funding is limited, resurfacing and preservation programs should be prioritized over the construction program. The effect of this approach will be that ‘NOW’ need roads will remain ‘NOW’ needs. However, by virtue of their ‘NOW’ need condition, ‘NOW’ need roads will require increased maintenance and likely generate increased complaints from the driving public. To deal with this eventuality, a municipality should create a ‘maintenance paving budget’, over and above the resurfacing budget. The purpose of this budget is to defer the reconstruction needs, and reduce maintenance efforts and complaints until the road can be reconstructed.
For structures, resurfacing and bridge deck waterproofing and rehabilitations offer a very good return on investment. When bridge structures are rehabilitated the opportunity to convert the structure to an integral or semi‐integral structure will improve performance of over the longer term.
10.3 Cross Asset Integration and Project Prioritization
Prioritizing projects from a purely asset management perspective is a relatively straightforward exercise, regardless of funding level. Complications arise when the specific needs, commitments of the agency, and priorities of other utilities factor into the decision making process.
The road system is, in reality, a utility corridor. Multiple utilities in both urban and rural roadside environments will present conflicting demands and priorities in advancing projects. The Road Needs
Village of Newbury, Asset Management Plan April 28, 2014
25
Rpt_Newbury_amp_fin_20140427.docx
Study provides ratings that deal strictly with the condition of various factors as they relate to the road section. Those factors have to be considered in conjunction with needs and priorities that may exist for other utilities or pending development. In fact, the condition of other infrastructure within the road allowance may be the key element in the prioritization. For example, a road rated as a reconstruction project may have a relatively low priority rating, but a trunk storm sewer servicing a greater area may require immediate installation. The priority of the road is then dictated by the other utility, and should be integrated into the capital plan, to best serve all interests.
Less tangible priorities may also be project prioritization tools for some agencies. For example, an agency may want to advance projects that also include bus routes or bike lanes.
As a municipal road program is developed, opportunities to complete work on smaller sections adjacent to the main project, at a lesser cost than if completed as a stand‐alone project, should be considered to realize economies of scale, and complete improvements that may otherwise be passed over.
Village of Newbury, Asset Management Plan April 28, 2014
26
Rpt_Newbury_amp_fin_20140427.docx
Financial Strategy and Plan
11.1 Financial Plan Overview
The financial plan/strategy is integral to the asset management plan.
The overall condition of the system was above the minimum target set by the province when prior to the removal of conditional grants in the mid 1990’s. This relates more to the history of construction that occurred approximately 20 years ago, more than it does to ongoing capital programming.
Approximately 20 years ago, the VoN was fortunate to have a hot mix resurfacing program, that allowed the VoN to resurface the majority of their streets. The asphalt is nearing the timeframe where it should be resurfaced. Most of the roads do not have adequate if any drainage. As such most of the road system is identified as having drainage and aged asphalt defects to some degree.
Shortly after the resurfacing of the roads, sanitary sewers and watermains were also installed in the VoN. Since that time, there really has not been a capital improvement program as all that should have been required would be maintenance.
Given the foregoing, it does not appear that there is an annual capital expenditure budget for any asset group.
It is not anticipated that there will be any WWW improvements required in the next 10 year period.
As such, the thrust of the AMP has to be to develop funding for the 10 year period to ensure that the road system is maintained in its current condition and the York Street Flooding problem is corrected. . The funding gap is significant, which leaves few alternatives other than debt financing and provincial assistance. 4 Roads understands that currently, the VoN is debt free therefore there should be sufficient borrowing capacity to debenture the new construction and improvement costs.
From the York Street Drainage Improvements (CIMA 2013), the gross cost of drainage works is $517,750 Roadworks to maintain the system in its current condition adds an additional $527,795, bringing the total funding requirement to $1,045,545. If the work were to be financed through debenture, assuming a 5% interest rate and a 10 year payback period, the annual debt repayment is $135,400 annually.
An additional $135,400 annually is a significant increase to the Village’s budget. Through discussions with staff it was agreed that the plan would be developed assuming a 66% grant on the major projects and that if the grant was not received, the projects would not proceed.
Asset management strategies are critical to managing the performance of an asset group, more so, if funding is limited. Funding constraints should push the strategy toward those programs that extend the life cycle of the road by providing the correct treatment at the optimum time. For roads, resurfacing, rehabilitation, and preservation projects should be a higher priority than reconstruction projects. There is saying for Asset Management of road assets and that is to “keep the good roads good”. This concept should be borne in mind for all assets.
Village of Newbury, Asset Management Plan April 28, 2014
27
Rpt_Newbury_amp_fin_20140427.docx
11.2 Asset Management Plan / Financial Plan Decision Matrix
The provincial guide for Municipal Asset Management Plans suggests that the detailed plan review include the following elements;
Non‐Infrastructure Solutions
Maintenance Activities
Renewal / Rehabilitation Activities
Replacement Activities
Disposal Activities
Expansion Activities
The VoN considers that an AMP is a dynamic document and will remain in a continuing state of evolution. As condition ratings, technology, site specific circumstances and funding levels change, the asset management plan will also. With respect to the above noted, the VoN will integrate those considerations as identified in the following discussion.
11.2.1 Non‐Infrastructure Solutions
The VoN adheres to the Class Environmental Assessment regulation when considering the advancement of projects as part of its standard service delivery practice. The Class EA provides for public notification and involvement and further requires the consideration and analysis of alternatives, as the final solution. Alternatives include analysis of whether an asset is still required and/or required for the same function and purpose.
11.2.2 Maintenance Activities and Renewal / Rehabilitation Activities
Maintenance and renewal /rehabilitation activities have been combined for this discussions as definitions can vary between agencies and may be a reflection of a cost threshold rather than the nature of the activity.
For development of appropriate funding levels, and system performance at varying funding levels, the VoN uses Worktech Asset Manager Foundation. The software’s performance modeling capabilities have been used to develop the initial program recommendations and provide information on the longer term effect on the overall road system.
Essentially, the model will provide a recommended treatment based on Return on Investment, current or projected condition of each asset, current recommendation, and current funding level. The analysis is based on the current unit costs for activities and the anticipated effect on the asset if the treatment is applied. Appendix F provides additional detail on the model.
Maintenance and renewal/rehabilitation activities for road assets include
crack sealing,
slurry sealing/ Microsurfacing
Renewal of the surface wearing course.
Removal and replacement of all asphalt, including minor drainage improvements
New technologies may be used in lieu of replacement of both layers of asphalt, such as cold in place recycling, or expanded asphalt
Village of Newbury, Asset Management Plan April 28, 2014
28
Rpt_Newbury_amp_fin_20140427.docx
Maintenance and renewal/ rehabilitation activities for Sewer Assets include
Video and flushing
Minor rehabilitations, at joints and in manholes where infiltration is occurring
Relining
Maintenance and renewal/ rehabilitation activities for Watermain Assets include
Valve Exercising and Inspection
Flushing
Relining
Flow monitoring and pressure testing
Cathodic Protection Checks
11.2.3 Replacement Activities
Replacement activities are different for the different asset groups; a bridge, culvert structure, sewer or watermain will have to be removed completely and replaced whereas there is usually some element of the road asset that may be salvageable.
11.2.4 Disposal Activities
As noted in 11.2.3 there is a distinct difference between road and structure assets in terms of disposal. The disposal of a road cannot be accomplished in the same manner as a piece of equipment; the road allowance is the road allowance and even as rehabilitation occurs, the road is never totally removed and rarely closed completely. Most other assets disposal is complete at the end of the service life.
11.2.5 Expansion Activities
In concert with the non‐infrastructure solutions, expansion requirements will be a consideration in the final project detail. The VoN will consider the Official Plan as an element of any project going forward. The Official plan may indicate a growth potential in the twenty to twenty five year planning horizon and this will be incorporated into the final decision at the project level on a site specific basis. The VoN has very limited expansion potential.
11.2.6 Funding Sources
Going forward, the VoN will consider all funding options in order to maintain and enhance the overall condition of the asset groups. Funding sources will include debentures, capital reserves, operating budgets, gas tax and grants.
11.3 Asset/ Financial Plan
Table 11.1 identifies the high level program and project costs for the 10 year plan. Appendix A of this
report proves the details of the plan.
.
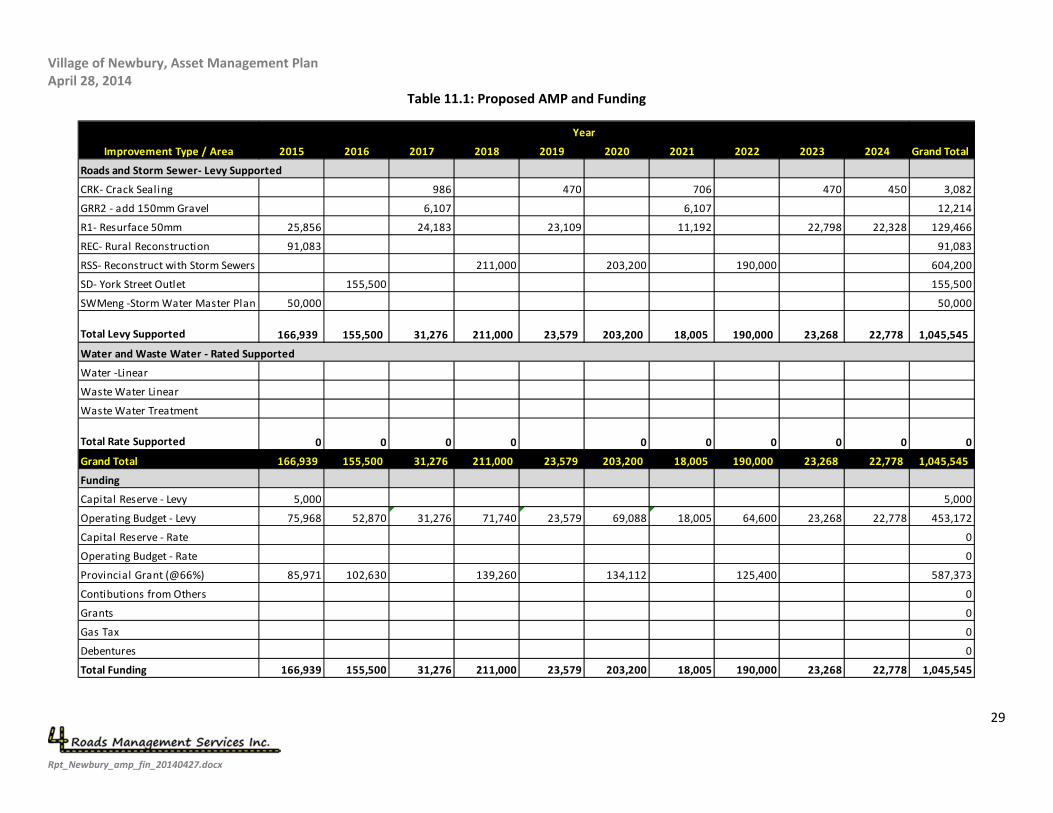
Village of Newbury, Asset Management Plan April 28, 2014
29
Rpt_Newbury_amp_fin_20140427.docx
Table 11.1: Proposed AMP and Funding
2015 2016 2017 2018 2019 2020 2021 2022 2023 2024 Grand Total
Roads and Storm Sewer‐ Levy Supported
CRK‐ Crack Sealing 986 470 706 470 450 3,082
GRR2 ‐ add 150mm Gravel 6,107 6,107 12,214
R1‐ Resurface 50mm 25,856 24,183 23,109 11,192 22,798 22,328 129,466
REC‐ Rural Reconstruction 91,083 91,083
RSS‐ Reconstruct with Storm Sewers 211,000 203,200 190,000 604,200
SD‐ York Street Outlet 155,500 155,500
SWMeng ‐Storm Water Master Plan 50,000 50,000
Total Levy Supported 166,939 155,500 31,276 211,000 23,579 203,200 18,005 190,000 23,268 22,778 1,045,545
Water and Waste Water ‐ Rated Supported
Water ‐Linear
Waste Water Linear
Waste Water Treatment
Total Rate Supported 0 0 0 0 0 0 0 0 0 0
Grand Total 166,939 155,500 31,276 211,000 23,579 203,200 18,005 190,000 23,268 22,778 1,045,545
Funding
Capital Reserve ‐ Levy 5,000 5,000
Operating Budget ‐ Levy 75,968 52,870 31,276 71,740 23,579 69,088 18,005 64,600 23,268 22,778 453,172
Capital Reserve ‐ Rate 0
Operating Budget ‐ Rate 0
Provincial Grant (@66%) 85,971 102,630 139,260 134,112 125,400 587,373
Contibutions from Others 0
Grants 0
Gas Tax 0
Debentures 0
Total Funding 166,939 155,500 31,276 211,000 23,579 203,200 18,005 190,000 23,268 22,778 1,045,545
Improvement Type / Area
Year
Village of Newbury, Asset Management Plan April 28, 2014
30
Rpt_Newbury_amp_fin_20140427.docx
Recommendations
In addition to the budgetary recommendations, the following recommendations are provided for the management of the road and structures inventories;
1. The Village should develop an Asset Management Policy that may be adapted to all assets as plans for the other assets are developed.
2. Consider the Asset Management and budget recommendations included in this report to further
develop the longer term asset management plan in conjunction with a longer term financial plan.
3. A Rate Study should be undertaken for the water and waste water assets to ensure that the rates
are sufficient to ensure long term viability of the water and waste water facilities.
4. The cycle for review of the road system should be continued, reviewing the entire system on a maximum four year cycle.
5. A Master Drainage Plan should be developed prior to reconstruction of the road network to
ensure that there is a legal, adequate outlet. The plan should be completed with consideration to
the Municipal Drain Systems.
6. Traffic counts should be undertaken to confirm the traffic volume and percentage of truck traffic
on roads in order to have adequate geometric and structural design and Regulation 239/02
classification.
7. Annual budget adjustments should account for inflation and increases for each asset group.
8. Capital reserves should be established for the road assets.
9. Capital Reserves Should be established for the rate supported assets
10. The asset management plan should be reviewed and revised annually from both condition and financial perspectives.
11. Programming for roads should be reviewed to ensure that resurfacing and preservation programs are optimized.
12. Traffic counts should be updated and repeated on a regular basis. The counting should include the percentage of truck traffic.
Village of Newbury, Asset Management Plan April 28, 2014
Rpt_Newbury_amp_fin_20140427.docx
Appendix A: 10 Year Plan for Roads and York Street Drainage
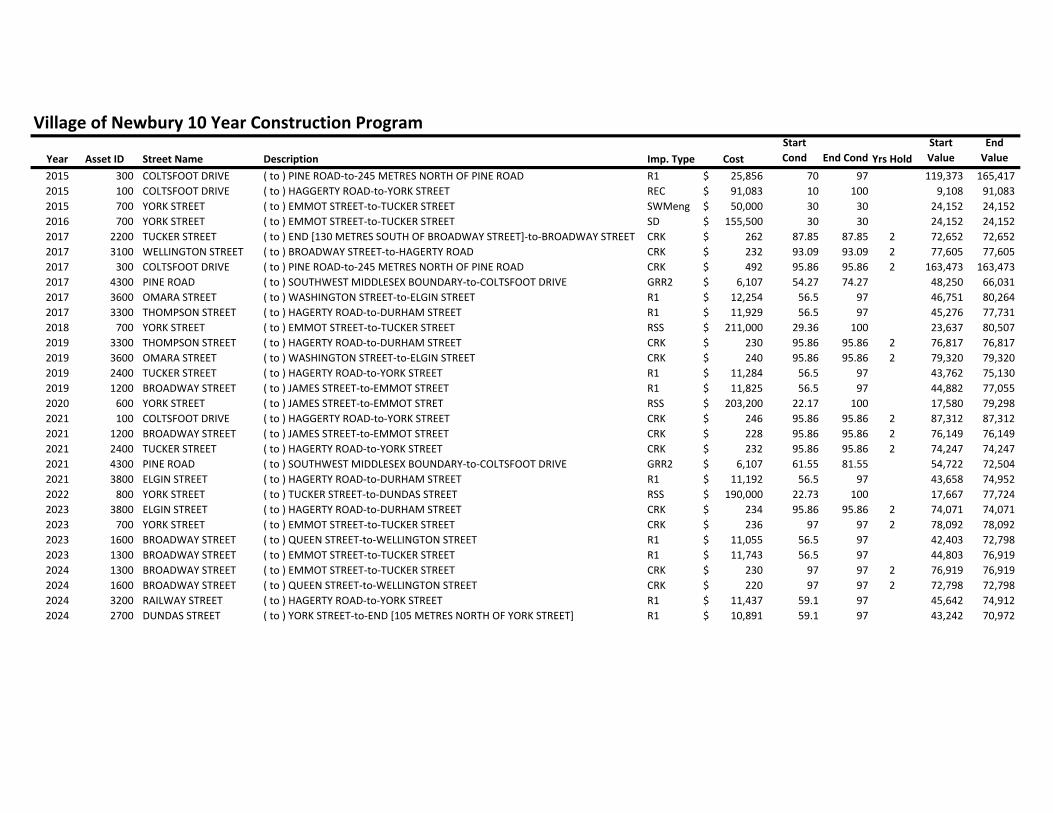
Village of Newbury 10 Year Construction Program
Year Asset ID Street Name Description Imp. Type Cost
Start
Cond End Cond Yrs Hold
Start
Value
End
Value
2015 300 COLTSFOOT DRIVE ( to ) PINE ROAD‐to‐245 METRES NORTH OF PINE ROAD R1 25,856$ 70 97 119,373 165,417
2015 100 COLTSFOOT DRIVE ( to ) HAGGERTY ROAD‐to‐YORK STREET REC 91,083$ 10 100 9,108 91,083
2015 700 YORK STREET ( to ) EMMOT STREET‐to‐TUCKER STREET SWMeng 50,000$ 30 30 24,152 24,152
2016 700 YORK STREET ( to ) EMMOT STREET‐to‐TUCKER STREET SD 155,500$ 30 30 24,152 24,152
2017 2200 TUCKER STREET ( to ) END [130 METRES SOUTH OF BROADWAY STREET]‐to‐BROADWAY STREET CRK 262$ 87.85 87.85 2 72,652 72,652
2017 3100 WELLINGTON STREET ( to ) BROADWAY STREET‐to‐HAGERTY ROAD CRK 232$ 93.09 93.09 2 77,605 77,605
2017 300 COLTSFOOT DRIVE ( to ) PINE ROAD‐to‐245 METRES NORTH OF PINE ROAD CRK 492$ 95.86 95.86 2 163,473 163,473
2017 4300 PINE ROAD ( to ) SOUTHWEST MIDDLESEX BOUNDARY‐to‐COLTSFOOT DRIVE GRR2 6,107$ 54.27 74.27 48,250 66,031
2017 3600 OMARA STREET ( to ) WASHINGTON STREET‐to‐ELGIN STREET R1 12,254$ 56.5 97 46,751 80,264
2017 3300 THOMPSON STREET ( to ) HAGERTY ROAD‐to‐DURHAM STREET R1 11,929$ 56.5 97 45,276 77,731
2018 700 YORK STREET ( to ) EMMOT STREET‐to‐TUCKER STREET RSS 211,000$ 29.36 100 23,637 80,507
2019 3300 THOMPSON STREET ( to ) HAGERTY ROAD‐to‐DURHAM STREET CRK 230$ 95.86 95.86 2 76,817 76,817
2019 3600 OMARA STREET ( to ) WASHINGTON STREET‐to‐ELGIN STREET CRK 240$ 95.86 95.86 2 79,320 79,320
2019 2400 TUCKER STREET ( to ) HAGERTY ROAD‐to‐YORK STREET R1 11,284$ 56.5 97 43,762 75,130
2019 1200 BROADWAY STREET ( to ) JAMES STREET‐to‐EMMOT STREET R1 11,825$ 56.5 97 44,882 77,055
2020 600 YORK STREET ( to ) JAMES STREET‐to‐EMMOT STRET RSS 203,200$ 22.17 100 17,580 79,298
2021 100 COLTSFOOT DRIVE ( to ) HAGGERTY ROAD‐to‐YORK STREET CRK 246$ 95.86 95.86 2 87,312 87,312
2021 1200 BROADWAY STREET ( to ) JAMES STREET‐to‐EMMOT STREET CRK 228$ 95.86 95.86 2 76,149 76,149
2021 2400 TUCKER STREET ( to ) HAGERTY ROAD‐to‐YORK STREET CRK 232$ 95.86 95.86 2 74,247 74,247
2021 4300 PINE ROAD ( to ) SOUTHWEST MIDDLESEX BOUNDARY‐to‐COLTSFOOT DRIVE GRR2 6,107$ 61.55 81.55 54,722 72,504
2021 3800 ELGIN STREET ( to ) HAGERTY ROAD‐to‐DURHAM STREET R1 11,192$ 56.5 97 43,658 74,952
2022 800 YORK STREET ( to ) TUCKER STREET‐to‐DUNDAS STREET RSS 190,000$ 22.73 100 17,667 77,724
2023 3800 ELGIN STREET ( to ) HAGERTY ROAD‐to‐DURHAM STREET CRK 234$ 95.86 95.86 2 74,071 74,071
2023 700 YORK STREET ( to ) EMMOT STREET‐to‐TUCKER STREET CRK 236$ 97 97 2 78,092 78,092
2023 1600 BROADWAY STREET ( to ) QUEEN STREET‐to‐WELLINGTON STREET R1 11,055$ 56.5 97 42,403 72,798
2023 1300 BROADWAY STREET ( to ) EMMOT STREET‐to‐TUCKER STREET R1 11,743$ 56.5 97 44,803 76,919
2024 1300 BROADWAY STREET ( to ) EMMOT STREET‐to‐TUCKER STREET CRK 230$ 97 97 2 76,919 76,919
2024 1600 BROADWAY STREET ( to ) QUEEN STREET‐to‐WELLINGTON STREET CRK 220$ 97 97 2 72,798 72,798
2024 3200 RAILWAY STREET ( to ) HAGERTY ROAD‐to‐YORK STREET R1 11,437$ 59.1 97 45,642 74,912
2024 2700 DUNDAS STREET ( to ) YORK STREET‐to‐END [105 METRES NORTH OF YORK STREET] R1 10,891$ 59.1 97 43,242 70,972
Village of Newbury, Asset Management Plan April 28, 2014
Rpt_Newbury_amp_fin_20140427.docx
Appendix B: York Street Outlet Plan
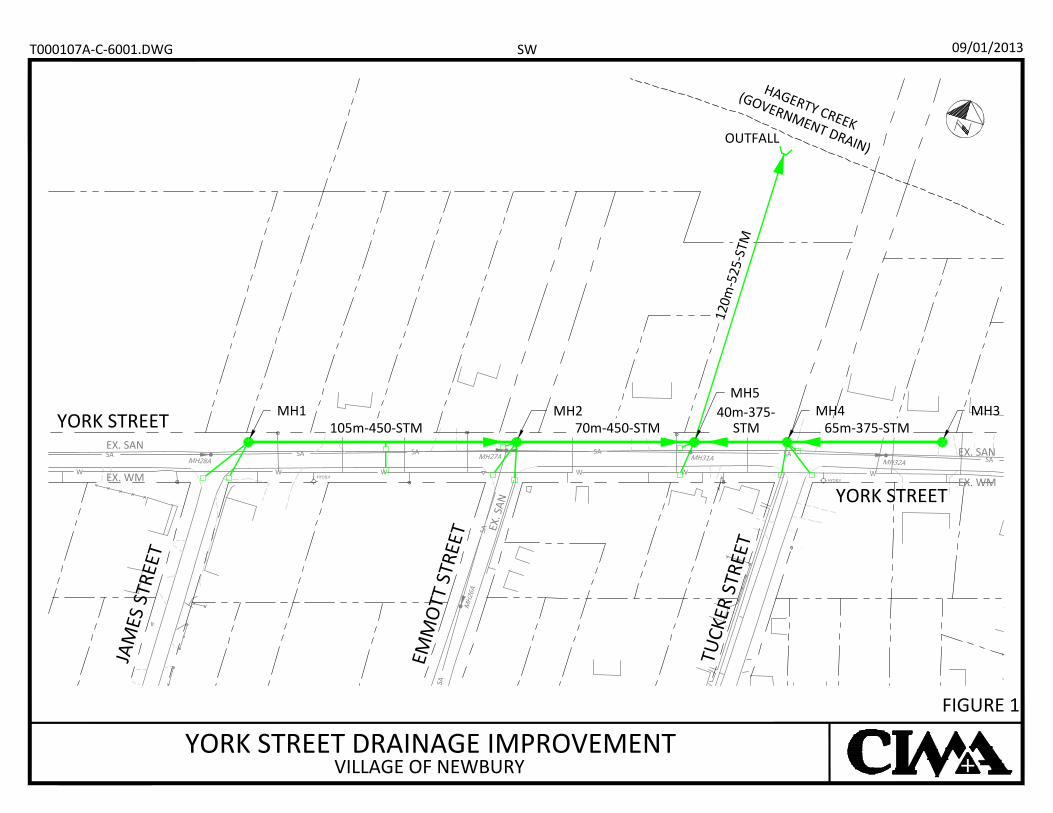
VILLAGE OF NEWBURY
T000107A-C-6001.DWG 09/01/2013
YORK STREET DRAINAGE IMPROVEMENTFIGURE 1
SW
105m-450-STM 70m-450-STM40m-375-
STM 65m-375-STM
120m
-525
-STM
YORK STREET
YORK STREET
JAM
ES S
TREE
T
EMM
OTT
STR
EET
TUCK
ER S
TREE
T
OUTFALL
HAGERTY CREEK
(GOVERNMENT DRAIN)
MH1 MH2MH5
MH4 MH3
EX. SAN
EX. WM
EX. SAN
EX. WMEX
. SAN