Embed Size (px)
Citation preview
NORTH DAKOTA CENSUS OFFICE POPULATION PROJECTIONS OF THE STATE, REGIONS AND COUNTIES 2016
Presented as of January 19, 2016 from the North Dakota Department of Commerce – Census Office
TABLE OF CONTENTS
Executive Summary .....................1
Methodology.................................4
Change in Population by Region...6
Change in Demographics.............7
Expected Migration Scenario........9
Low Migration Scenario .............15
High Migration Scenario..............21
This paper provides three scenarios of population change for the state of North Dakota. Each of the scenarios use the same inputs such as fertility rates by age of the mother or life expectancy with the expectation of the rate of migration into or out of a given county, region or the state. This paper is an attempt to present what is expected to be the population of each county, region and the state at the mid-point of each five year interval.
EXECUTIVE SUMMARY
The North Dakota Department of Commerce – Census Office prepared population projections for the state using high, expected and low rates of migration between now and 2040. Both the high and low projections are variations for the expected scenario, but vary on the number of individuals expected to migrate into the state. All three scenarios assume in-migration will exceed out-migration for the next several years.
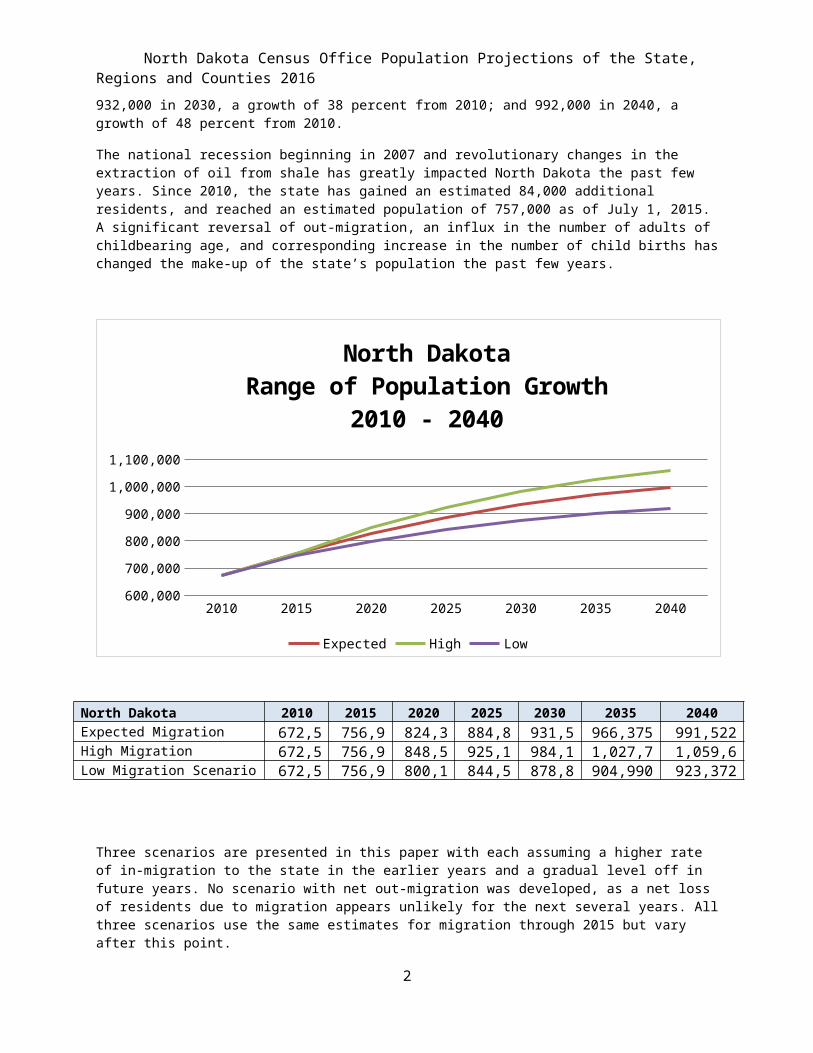
The state of North Dakota is projected to reach a population between 800,000 and 849,000 by 2020, of between 879,000 and 984,000 by 2030, and between 923,000 and 1,060,000 by 2040. The expected or most likely populations for the state are approximately 824,000 in 2020, a growth of 23 percent from 2010; 932,000 in 2030, a growth of 38 percent from 2010; and 992,000 in 2040, a growth of 48 percent from 2010.
The national recession beginning in 2007 and revolutionary changes in the extraction of oil from shale has greatly impacted North Dakota the past few years. Since 2010, the state has gained an estimated 84,000 additional residents, and reached an estimated population of 757,000 as of July 1, 2015. A significant reversal of out-migration, an influx in the number of adults of childbearing age, and corresponding increase in the number of child births has changed the make-up of the state’s population the past few years.
North Dakota Census Office Population Projections of the State, Regions and Counties 2016
2010 2015 2020 2025 2030 2035 2040600,000
700,000
800,000
900,000
1,000,000
1,100,000
North DakotaRange of Population Growth
2010 - 2040
Expected High Low
North Dakota 2010 2015 2020 2025 2030 2035 2040Expected Migration Scenario 672,591 756,927 824,344 884,874 931,506 966,375 991,522High Migration Scenario 672,591 756,927 848,563 925,164 984,147 1,027,760 1,059,672Low Migration Scenario 672,591 756,927 800,124 844,583 878,865 904,990 923,372
Three scenarios are presented in this paper with each assuming a higher rate of in-migration to the state in the earlier years and a gradual level off in future years. No scenario with net out-migration was developed, as a net loss of residents due to migration appears unlikely for the next several years. All three scenarios use the same estimates for migration through 2015 but vary after this point.
In-migration impacts the state’s future natural rate of growth just as it has in the recent past. The more individuals of childbearing ages that migrate into the state, the greater the number of child births that are expected to occur. In addition, in-migration of younger individuals appears to have a corresponding impact on out-migration of older residents. In the recent past, for those counties that have experienced the highest overall growth there appears to be a higher out-migration of older residents from these areas. Older residents appear to be migrating into the Bismarck and Fargo regions or out of state.
Many areas in the western region of the state have become “work place” destinations where the worker resides in a different region of the state or in a different state. The population numbers presented do not include non-resident workers anticipated to remain residents of other states or nations.
2
North Dakota Census Office Population Projections of the State, Regions and Counties 2016
A NOTE OF CAUTION
These projections are an attempt to provide the most likely outcome of population change expected in the state.
Past long-term projections have often been proven to be an inaccurate forecast of what North Dakota’s population has turned out to be. As an example, the 2005 Census Bureau state-level population projections indicated the state of North Dakota would continuously lose population and would have approximately 606,000 individuals by 2030. At this point, these projections appear highly unlikely.
Fluctuation in prices of the state’s exports will likely continue, as has been the case recently in both agricultural and mining sectors. It is impossible to forecast how these changes will play out or what impact they will have on the overall population of the state, regions or counties over time. In addition, the oil boom in western North Dakota appears to have reversed a decades’ long trend of out-migration. The pattern of migration that is believed to have
occurred since 2010 is likely to shift again with time. Given the dramatic shift in migration as a result of oil field development, the opportunity for these projections to be fallible must be considered.
In the end, the estimated rate of migration for each scenario is subjective. The projection of migration also depends upon the accuracy of the 2014 and 2015 population estimates which are expected to have some imprecision compared to an actual census. The projections of migration are based upon the best data that is currently available at this point in time.
In each of the three scenarios presented, the population of each county is summed to estimate the population of the region at a given point in time. Similarly, the region total under each scenario is used to project the total of the state at a given point in time. It is unlikely that the scenarios will play out uniformly, so, the total for the state and the regions will likely differ from what is presented here.
3
North Dakota Census Office Population Projections of the State, Regions and Counties 2016
METHODOLOGY
The process used in these projections is a modified version of the cohort survival component method – the most commonly used method of projections. State-level expected migration is distributed to county level based on the net state level migration possible under each scenario.
Projections are based upon the population by age and sex found in each county in 2010. The population of each county was “aged” forward to 2015 to determine the most likely population of each age group and sex if no migration had occurred. The resulting data was then prorated back to what differences would be expected to be found in the 2014 population estimate, by age and sex, to estimate the approximate 5-year cohort size for each age and sex in each county. The differences found between what would be expected if there was no migration in each 5-year age groups, and 53 counties (1,908 individual cells) were then compared to estimate migration numbers during this timeframe for each age group and sex in each county. These factors became the basis to determine the percentage of the state’s overall migration in or out for each age group and sex in each county, region and the state as a whole.
Fertility, rate of births and, age of the mother was determined from data provided by the North Dakota Department of Health’s records from 2008 through 2013. Results by county were smoothed to reduce anomalies in the number of births during this timeframe. Children projected to be born to women who recently migrated into the state are treated as part of the net migration for each of the five year periods.
Life expectancy is based upon data from the Social Security Administration without consideration for race. The tables by age group and sex for 2010 were used in the timeframe from 2010 to 2020, tables for 2020 were used for the timeframe 2020 to 2030 and tables for 2030 were used from 2030 to 2040. As a result of this application, life expectancy may be somewhat conservative in most counties but somewhat liberal in those with higher American Indian populations.
Migration is by far the most problematic factor to predict and the most important, as about three-fourth of the state’s net population change between 2010 and 2015 was a result of migration. The forecast number of economic migrants in the Regional Economic Model (REMI) Policy Insight Plus Model for North Dakota was used to forecast the overall number of migration for each 5-year period of time. Past REMI forecasts were compared to the Census Bureau’s estimate of net annual migration and used to predict state level totals for future years. There were substantial changes from REMI PI+ forecast for economic migrants in their release for 2014 and 2015. As a result, the two forecasts were averaged together. Because REMI’s forecast appeared higher than felt probable, the result was reduced by 30 percent for each 5-year period from 2015 through 2040 in the expected migration scenario.
The sex ratio of future migration is another area that is problematic. Data from the Census Bureau’s Population Program indicates, that so far this decade, the state has experienced a net gain of new residents as a result of migration at an approximate rate of 1.5 males for every for every female. We assumed future migration would be more balanced between the sexes, as the surge in male dominated jobs in the western part of the state has leveled off. These projections assume an equal number of males and females migrating into the state in all future years.
Three scenarios were considered, each based upon the rate of migration. Counties that have experienced out-migration since 2010 are likely to continue that trend. In the expected scenario 36 counties are expected to grow, with 17 losing population through 2040.
4
North Dakota Census Office Population Projections of the State, Regions and Counties 2016
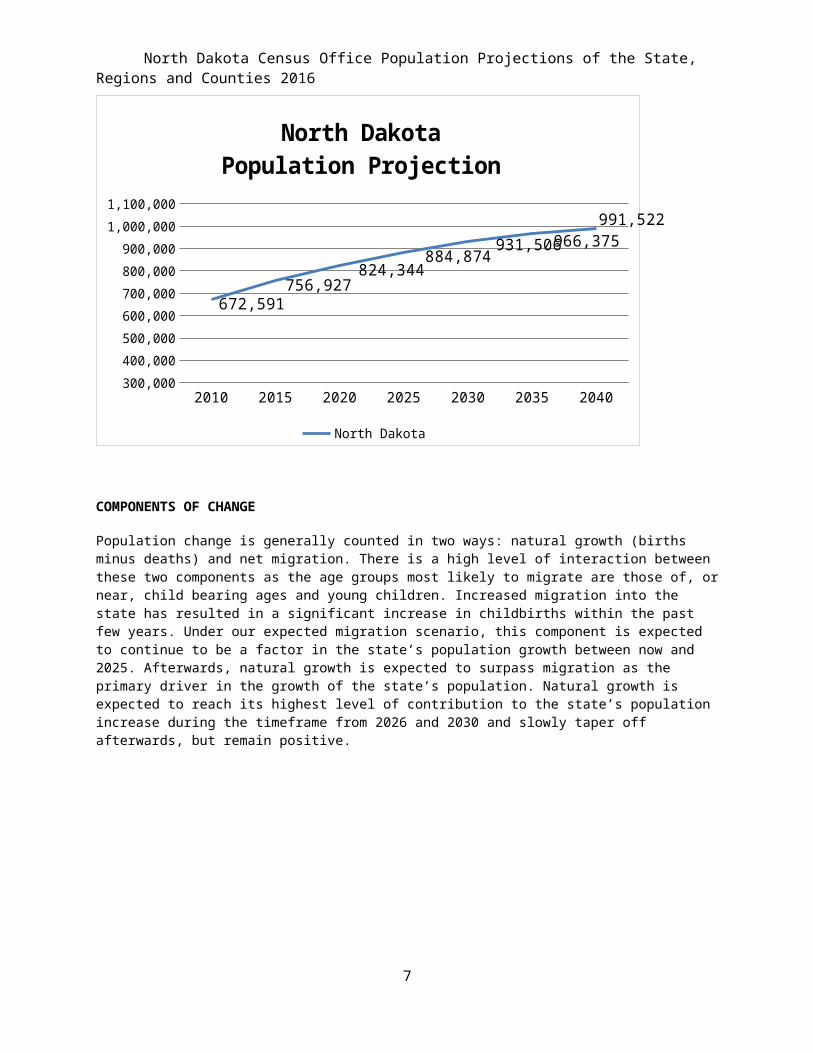
EXPECTED MIGRATION SCENARIO
The population of the state is expected to grow continuously from now to 2040, but begin to slow after 2030.
2010 2015 2020 2025 2030 2035 2040300,000
400,000
500,000
600,000
700,000
800,000
900,000
1,000,000
1,100,000
672,591756,927
824,344884,874
931,506 966,375991,522
North Dakota Population Projection
North Dakota
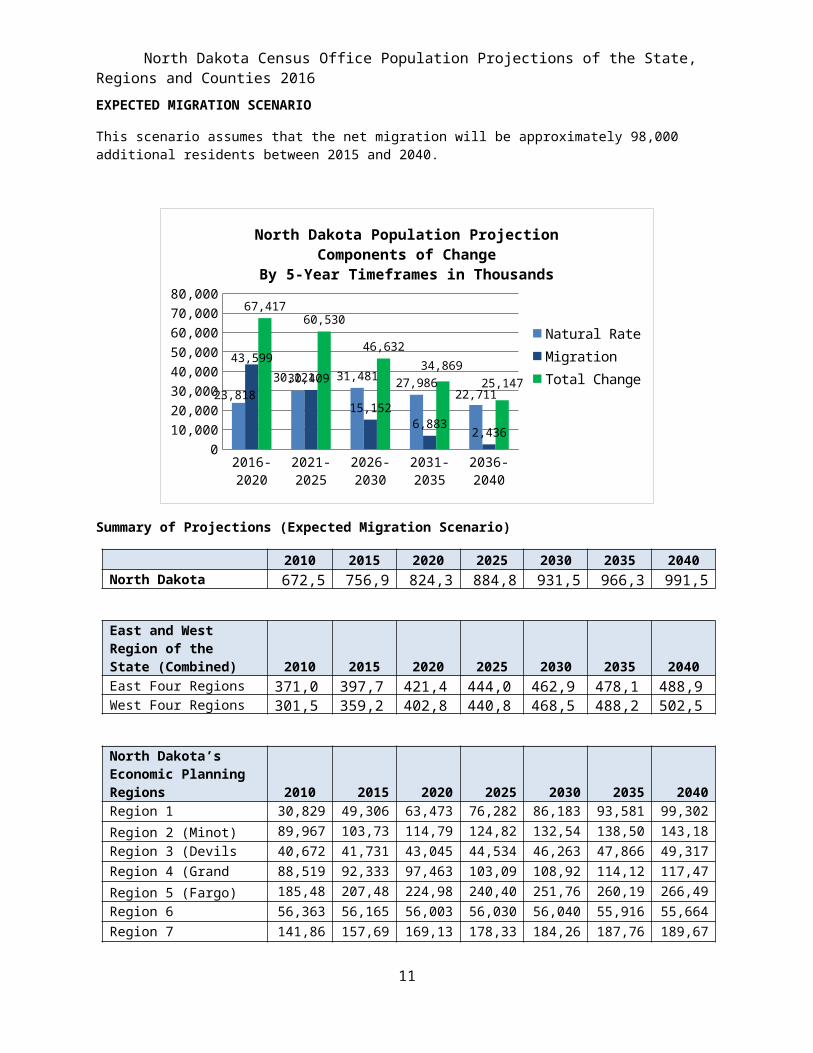
COMPONENTS OF CHANGE
Population change is generally counted in two ways: natural growth (births minus deaths) and net migration. There is a high level of interaction between these two components as the age groups most likely to migrate are those of, or near, child bearing ages and young children. Increased migration into the state has resulted in a significant increase in childbirths within the past few years. Under our expected migration scenario, this component is expected to continue to be a factor in the state’s population growth between now and 2025. Afterwards, natural growth is expected to surpass migration as the primary driver in the growth of the state’s population. Natural growth is expected to reach its highest level of contribution to the state’s population increase during the timeframe from 2026 and 2030 and slowly taper off afterwards, but remain positive.
5
North Dakota Census Office Population Projections of the State, Regions and Counties 2016
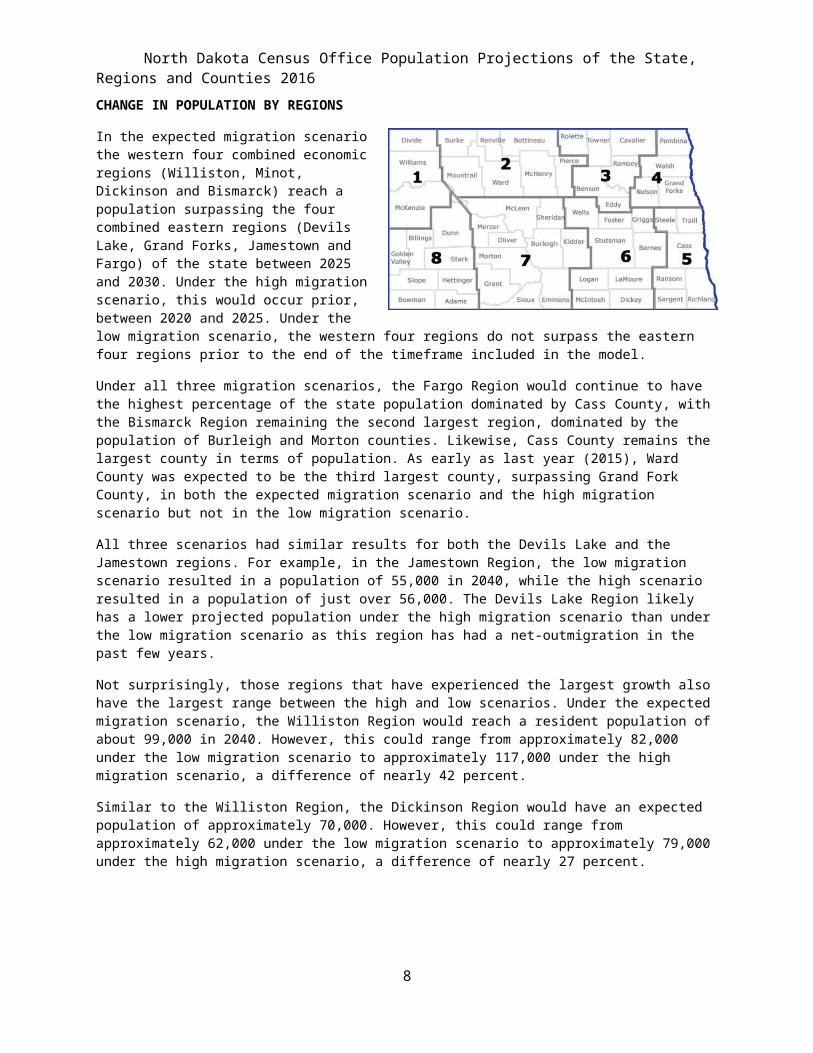
CHANGE IN POPULATION BY REGIONS
In the expected migration scenario the western four combined economic regions (Williston, Minot, Dickinson and Bismarck) reach a population surpassing the four combined eastern regions (Devils Lake, Grand Forks, Jamestown and Fargo) of the state between 2025 and 2030. Under the high migration scenario, this would occur prior, between 2020 and 2025. Under the low migration scenario, the western four regions do not surpass the eastern four regions prior to the end of the timeframe included in the model.
Under all three migration scenarios, the Fargo Region would continue to have the highest percentage of the state population dominated by Cass County, with the Bismarck Region remaining the second largest region, dominated by the population of Burleigh and Morton counties. Likewise, Cass County remains the largest county in terms of population. As early as last year (2015), Ward County was expected to be the third largest county, surpassing Grand Fork County, in both the expected migration scenario and the high migration scenario but not in the low migration scenario.
All three scenarios had similar results for both the Devils Lake and the Jamestown regions. For example, in the Jamestown Region, the low migration scenario resulted in a population of 55,000 in 2040, while the high scenario resulted in a population of just over 56,000. The Devils Lake Region likely has a lower projected population under the high migration scenario than under the low migration scenario as this region has had a net-outmigration in the past few years.
Not surprisingly, those regions that have experienced the largest growth also have the largest range between the high and low scenarios. Under the expected migration scenario, the Williston Region would reach a resident population of about 99,000 in 2040. However, this could range from approximately 82,000 under the low migration scenario to approximately 117,000 under the high migration scenario, a difference of nearly 42 percent.
Similar to the Williston Region, the Dickinson Region would have an expected population of approximately 70,000. However, this could range from approximately 62,000 under the low migration scenario to approximately 79,000 under the high migration scenario, a difference of nearly 27 percent.
6
North Dakota Census Office Population Projections of the State, Regions and Counties 2016
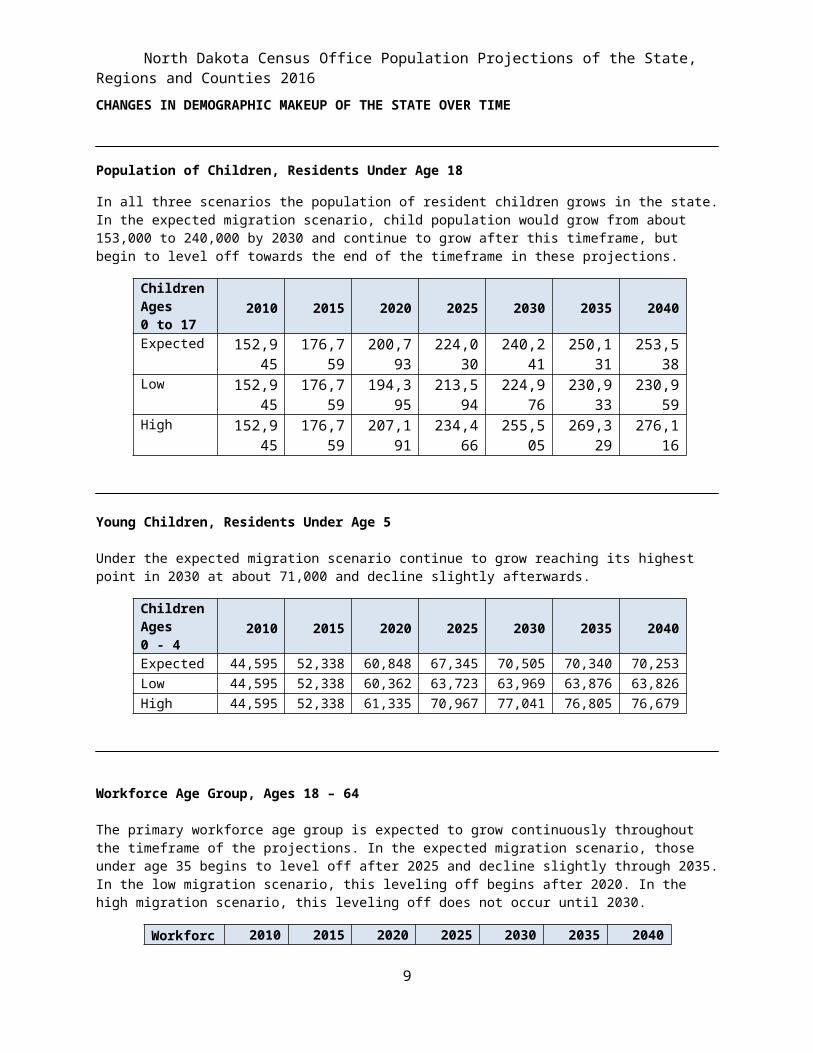
CHANGES IN DEMOGRAPHIC MAKEUP OF THE STATE OVER TIME
Population of Children, Residents Under Age 18
In all three scenarios the population of resident children grows in the state. In the expected migration scenario, child population would grow from about 153,000 to 240,000 by 2030 and continue to grow after this timeframe, but begin to level off towards the end of the timeframe in these projections.
ChildrenAges0 to 17
2010 2015 2020 2025 2030 2035 2040
Expected 152,945 176,759 200,793 224,030 240,241 250,131 253,538Low 152,945 176,759 194,395 213,594 224,976 230,933 230,959High 152,945 176,759 207,191 234,466 255,505 269,329 276,116
Young Children, Residents Under Age 5
Under the expected migration scenario continue to grow reaching its highest point in 2030 at about 71,000 and decline slightly afterwards.
ChildrenAges0 - 4
2010 2015 2020 2025 2030 2035 2040
Expected 44,595 52,338 60,848 67,345 70,505 70,340 70,253Low 44,595 52,338 60,362 63,723 63,969 63,876 63,826High 44,595 52,338 61,335 70,967 77,041 76,805 76,679
Workforce Age Group, Ages 18 – 64
The primary workforce age group is expected to grow continuously throughout the timeframe of the projections. In the expected migration scenario, those under age 35 begins to level off after 2025 and decline slightly through 2035. In the low migration scenario, this leveling off begins after 2020. In the high migration scenario, this leveling off does not occur until 2030.
Workforce Ages18 - 64
2010 2015 2020 2025 2030 2035 2040
Expected 422,169 473,329 501,430 521,097 538,448 561,274 584,250Low 422,169 473,329 483,801 491,146 501,299 520,629 541,317High 422,169 473,329 519,059 551,049 575,596 601,918 627,182
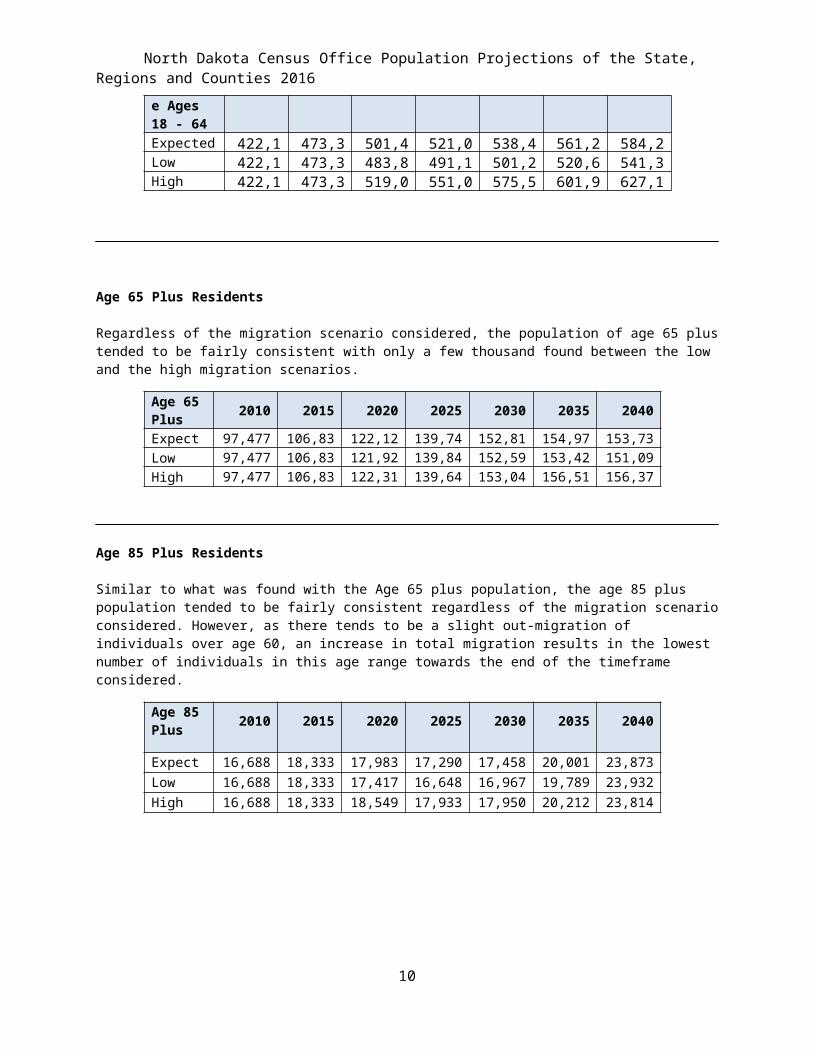
Age 65 Plus Residents
7
North Dakota Census Office Population Projections of the State, Regions and Counties 2016
Regardless of the migration scenario considered, the population of age 65 plus tended to be fairly consistent with only a few thousand found between the low and the high migration scenarios.
Age 65 Plus 2010 2015 2020 2025 2030 2035 2040
Expected
97,477 106,839 122,120 139,747 152,818 154,970 153,734
Low 97,477 106,839 121,928 139,844 152,590 153,428 151,095
High 97,477 106,839 122,313 139,649 153,046 156,513 156,373
Age 85 Plus Residents
Similar to what was found with the Age 65 plus population, the age 85 plus population tended to be fairly consistent regardless of the migration scenario considered. However, as there tends to be a slight out-migration of individuals over age 60, an increase in total migration results in the lowest number of individuals in this age range towards the end of the timeframe considered.
Age 85 Plus 2010 2015 2020 2025 2030 2035 2040
Expected
16,688 18,333 17,983 17,290 17,458 20,001 23,873Low 16,688 18,333 17,417 16,648 16,967 19,789 23,932High 16,688 18,333 18,549 17,933 17,950 20,212 23,814
8
North Dakota Census Office Population Projections of the State, Regions and Counties 2016
EXPECTED MIGRATION SCENARIO
This scenario assumes that the net migration will be approximately 98,000 additional residents between 2015 and 2040.
2016-2020 2021-2025 2026-2030 2031-2035 2036-20400
10,000
20,000
30,000
40,000
50,000
60,000
70,000
80,000
23,818
30,121 31,48127,986
22,711
43,599
30,409
15,152
6,8832,436
67,41760,530
46,632
34,869
25,147
North Dakota Population ProjectionComponents of Change
By 5-Year Timeframes in Thousands
Natural RateMigrationTotal Change
Summary of Projections (Expected Migration Scenario)
2010 2015 2020 2025 2030 2035 2040North Dakota 672,591 756,927 824,344 884,874 931,506 966,375 991,522
East and West Region of the State (Combined) 2010 2015 2020 2025 2030 2035 2040East Four Regions 371,035 397,713 421,491 444,060 462,994 478,102 488,954West Four Regions 301,556 359,215 402,853 440,813 468,512 488,273 502,568
North Dakota’s Economic Planning Regions 2010 2015 2020 2025 2030 2035 2040Region 1 (Williston) 30,829 49,306 63,473 76,282 86,183 93,581 99,302
Region 2 (Minot) 89,967 103,736 114,796 124,823 132,542 138,505 143,189
Region 3 (Devils Lake) 40,672 41,731 43,045 44,534 46,263 47,866 49,317
Region 4 (Grand Forks) 88,519 92,333 97,463 103,096 108,926 114,126 117,474
Region 5 (Fargo) 185,481 207,484 224,981 240,400 251,766 260,194 266,498
Region 6 (Jamestown) 56,363 56,165 56,003 56,030 56,040 55,916 55,664
Region 7 (Bismarck) 141,864 157,696 169,135 178,332 184,262 187,762 189,671
Region 8 (Dickinson) 38,896 48,476 55,449 61,377 65,523 68,425 70,407
9
North Dakota Census Office Population Projections of the State, Regions and Counties 2016
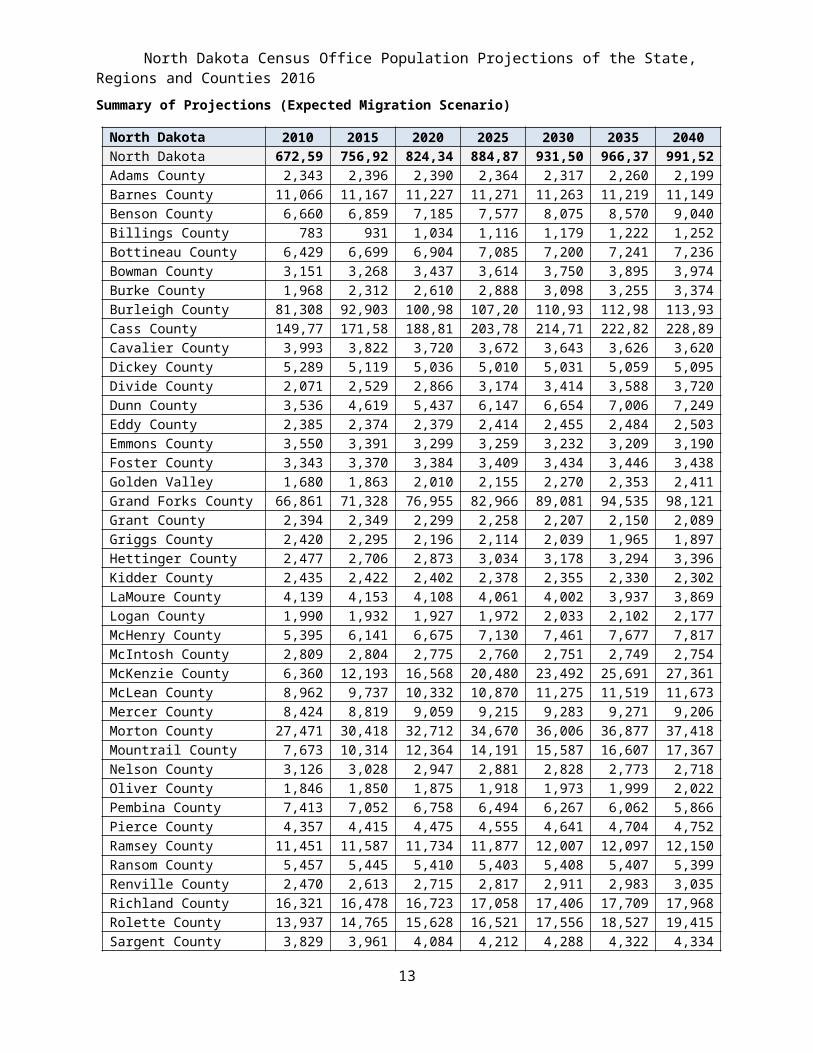
Summary of Projections (Expected Migration Scenario)
North Dakota Counties 2010 2015 2020 2025 2030 2035 2040North Dakota 672,591 756,927 824,344 884,874 931,506 966,375 991,522Adams County 2,343 2,396 2,390 2,364 2,317 2,260 2,199Barnes County 11,066 11,167 11,227 11,271 11,263 11,219 11,149Benson County 6,660 6,859 7,185 7,577 8,075 8,570 9,040Billings County 783 931 1,034 1,116 1,179 1,222 1,252Bottineau County 6,429 6,699 6,904 7,085 7,200 7,241 7,236Bowman County 3,151 3,268 3,437 3,614 3,750 3,895 3,974Burke County 1,968 2,312 2,610 2,888 3,098 3,255 3,374Burleigh County 81,308 92,903 100,986 107,205 110,932 112,983 113,937Cass County 149,778 171,588 188,810 203,784 214,719 222,826 228,895Cavalier County 3,993 3,822 3,720 3,672 3,643 3,626 3,620Dickey County 5,289 5,119 5,036 5,010 5,031 5,059 5,095Divide County 2,071 2,529 2,866 3,174 3,414 3,588 3,720Dunn County 3,536 4,619 5,437 6,147 6,654 7,006 7,249Eddy County 2,385 2,374 2,379 2,414 2,455 2,484 2,503Emmons County 3,550 3,391 3,299 3,259 3,232 3,209 3,190Foster County 3,343 3,370 3,384 3,409 3,434 3,446 3,438Golden Valley County 1,680 1,863 2,010 2,155 2,270 2,353 2,411Grand Forks County 66,861 71,328 76,955 82,966 89,081 94,535 98,121Grant County 2,394 2,349 2,299 2,258 2,207 2,150 2,089Griggs County 2,420 2,295 2,196 2,114 2,039 1,965 1,897Hettinger County 2,477 2,706 2,873 3,034 3,178 3,294 3,396Kidder County 2,435 2,422 2,402 2,378 2,355 2,330 2,302LaMoure County 4,139 4,153 4,108 4,061 4,002 3,937 3,869Logan County 1,990 1,932 1,927 1,972 2,033 2,102 2,177McHenry County 5,395 6,141 6,675 7,130 7,461 7,677 7,817McIntosh County 2,809 2,804 2,775 2,760 2,751 2,749 2,754McKenzie County 6,360 12,193 16,568 20,480 23,492 25,691 27,361McLean County 8,962 9,737 10,332 10,870 11,275 11,519 11,673Mercer County 8,424 8,819 9,059 9,215 9,283 9,271 9,206Morton County 27,471 30,418 32,712 34,670 36,006 36,877 37,418Mountrail County 7,673 10,314 12,364 14,191 15,587 16,607 17,367Nelson County 3,126 3,028 2,947 2,881 2,828 2,773 2,718Oliver County 1,846 1,850 1,875 1,918 1,973 1,999 2,022Pembina County 7,413 7,052 6,758 6,494 6,267 6,062 5,866Pierce County 4,357 4,415 4,475 4,555 4,641 4,704 4,752Ramsey County 11,451 11,587 11,734 11,877 12,007 12,097 12,150Ransom County 5,457 5,445 5,410 5,403 5,408 5,407 5,399Renville County 2,470 2,613 2,715 2,817 2,911 2,983 3,035Richland County 16,321 16,478 16,723 17,058 17,406 17,709 17,968Rolette County 13,937 14,765 15,628 16,521 17,556 18,527 19,415Sargent County 3,829 3,961 4,084 4,212 4,288 4,322 4,334
10
North Dakota Census Office Population Projections of the State, Regions and Counties 2016
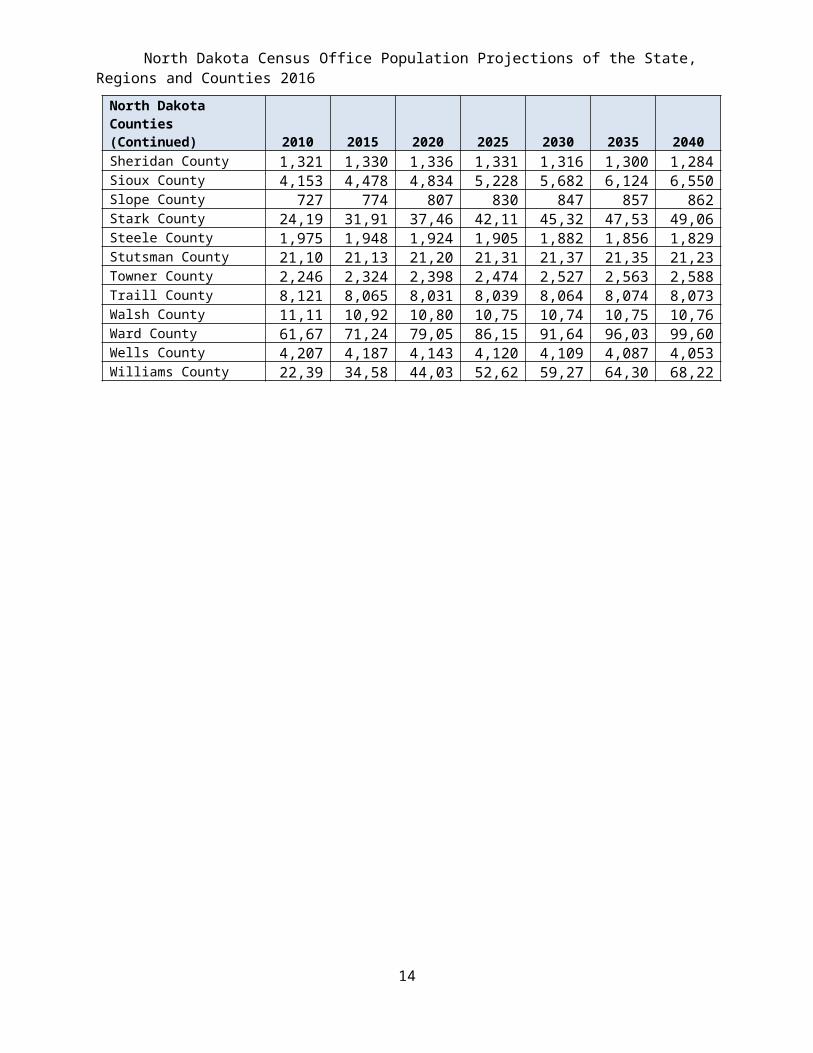
North Dakota Counties (Continued) 2010 2015 2020 2025 2030 2035 2040Sheridan County 1,321 1,330 1,336 1,331 1,316 1,300 1,284Sioux County 4,153 4,478 4,834 5,228 5,682 6,124 6,550Slope County 727 774 807 830 847 857 862Stark County 24,199 31,919 37,462 42,117 45,329 47,537 49,063Steele County 1,975 1,948 1,924 1,905 1,882 1,856 1,829Stutsman County 21,100 21,139 21,207 21,314 21,379 21,352 21,232Towner County 2,246 2,324 2,398 2,474 2,527 2,563 2,588Traill County 8,121 8,065 8,031 8,039 8,064 8,074 8,073Walsh County 11,119 10,925 10,803 10,755 10,749 10,756 10,769Ward County 61,675 71,243 79,053 86,157 91,644 96,037 99,607Wells County 4,207 4,187 4,143 4,120 4,109 4,087 4,053Williams County 22,398 34,583 44,039 52,628 59,276 64,302 68,221
11
North Dakota Census Office Population Projections of the State, Regions and Counties 2016
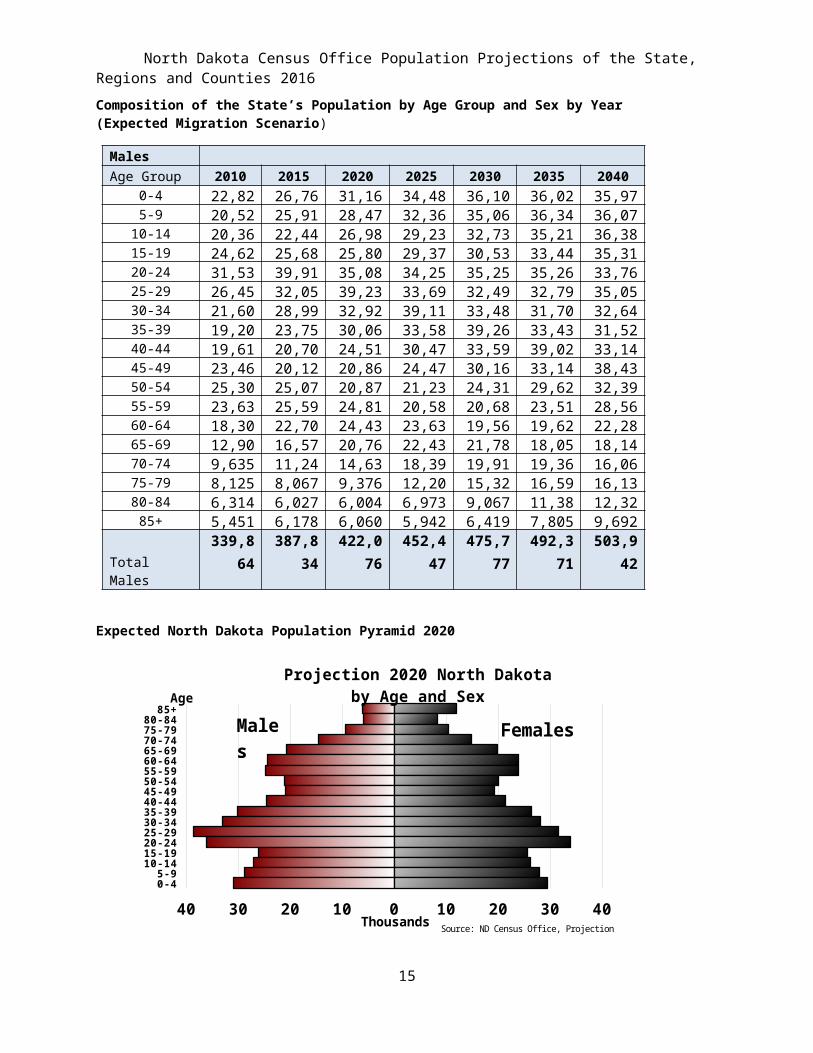
Composition of the State’s Population by Age Group and Sex by Year (Expected Migration Scenario)
MalesAge Group 2010 2015 2020 2025 2030 2035 2040
0-4 22,821 26,769 31,162 34,485 36,105 36,022 35,978 5-9 20,520 25,912 28,472 32,361 35,060 36,343 36,079
10-14 20,361 22,448 26,987 29,232 32,730 35,217 36,385 15-19 24,626 25,686 25,805 29,370 30,539 33,448 35,317 20-24 31,530 39,919 35,089 34,253 35,252 35,262 33,767 25-29 26,451 32,057 39,230 33,695 32,495 32,794 35,054 30-34 21,601 28,997 32,920 39,115 33,487 31,707 32,649 35-39 19,209 23,751 30,065 33,584 39,266 33,431 31,529 40-44 19,617 20,705 24,519 30,478 33,599 39,027 33,147 45-49 23,461 20,125 20,863 24,477 30,168 33,146 38,438 50-54 25,306 25,074 20,879 21,238 24,315 29,623 32,397 55-59 23,634 25,599 24,814 20,582 20,687 23,519 28,560 60-64 18,300 22,704 24,433 23,636 19,560 19,624 22,287 65-69 12,902 16,574 20,760 22,430 21,781 18,058 18,142 70-74 9,635 11,242 14,637 18,392 19,917 19,361 16,060 75-79 8,125 8,067 9,376 12,202 15,329 16,598 16,133 80-84 6,314 6,027 6,004 6,973 9,067 11,388 12,329 85+ 5,451 6,178 6,060 5,942 6,419 7,805 9,692
Total Males339,864 387,834 422,076 452,447 475,777 492,371 503,942
Expected North Dakota Population Pyramid 2020
0-45-9
10-1415-1920-2425-2930-3435-3940-4445-4950-5455-5960-6465-6970-7475-7980-84
85+
40 30 20 10 0 10 20 30 40
Projection 2020 North Dakota by Age and Sex
Thousands
Age
Males
Females
Source: ND Census Office, Projection
12
North Dakota Census Office Population Projections of the State, Regions and Counties 2016
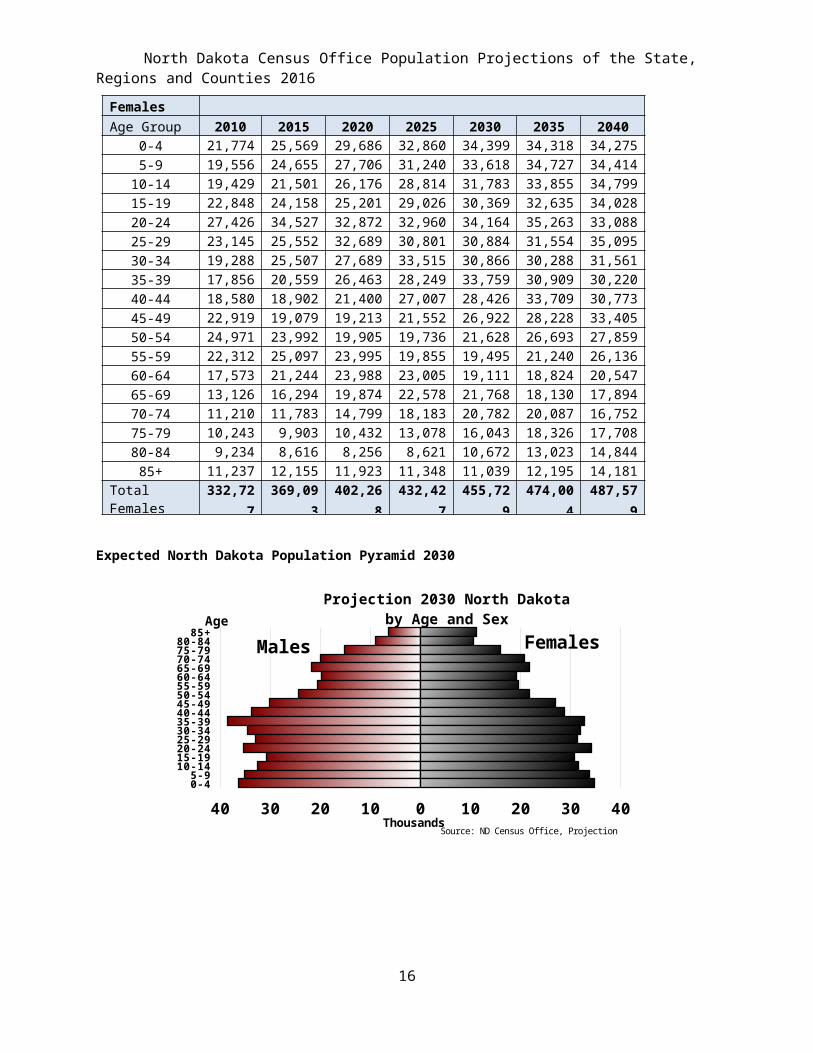
FemalesAge Group 2010 2015 2020 2025 2030 2035 2040
0-4 21,774 25,569 29,686 32,860 34,399 34,318 34,275
5-9 19,556 24,655 27,706 31,240 33,618 34,727 34,414
10-14 19,429 21,501 26,176 28,814 31,783 33,855 34,799
15-19 22,848 24,158 25,201 29,026 30,369 32,635 34,028
20-24 27,426 34,527 32,872 32,960 34,164 35,263 33,088
25-29 23,145 25,552 32,689 30,801 30,884 31,554 35,095
30-34 19,288 25,507 27,689 33,515 30,866 30,288 31,561
35-39 17,856 20,559 26,463 28,249 33,759 30,909 30,220
40-44 18,580 18,902 21,400 27,007 28,426 33,709 30,773
45-49 22,919 19,079 19,213 21,552 26,922 28,228 33,405
50-54 24,971 23,992 19,905 19,736 21,628 26,693 27,859
55-59 22,312 25,097 23,995 19,855 19,495 21,240 26,136
60-64 17,573 21,244 23,988 23,005 19,111 18,824 20,547
65-69 13,126 16,294 19,874 22,578 21,768 18,130 17,894
70-74 11,210 11,783 14,799 18,183 20,782 20,087 16,752
75-79 10,243 9,903 10,432 13,078 16,043 18,326 17,708
80-84 9,234 8,616 8,256 8,621 10,672 13,023 14,844
85+ 11,237 12,155 11,923 11,348 11,039 12,195 14,181
Total Females
332,727 369,093 402,268 432,427 455,729 474,004 487,579
Expected North Dakota Population Pyramid 2030
0-45-9
10-1415-1920-2425-2930-3435-3940-4445-4950-5455-5960-6465-6970-7475-7980-84
85+
40 30 20 10 0 10 20 30 40
Projection 2030 North Dakota by Age and Sex
Thousands
Age
Males Females
Source: ND Census Office, Projection
13
North Dakota Census Office Population Projections of the State, Regions and Counties 2016
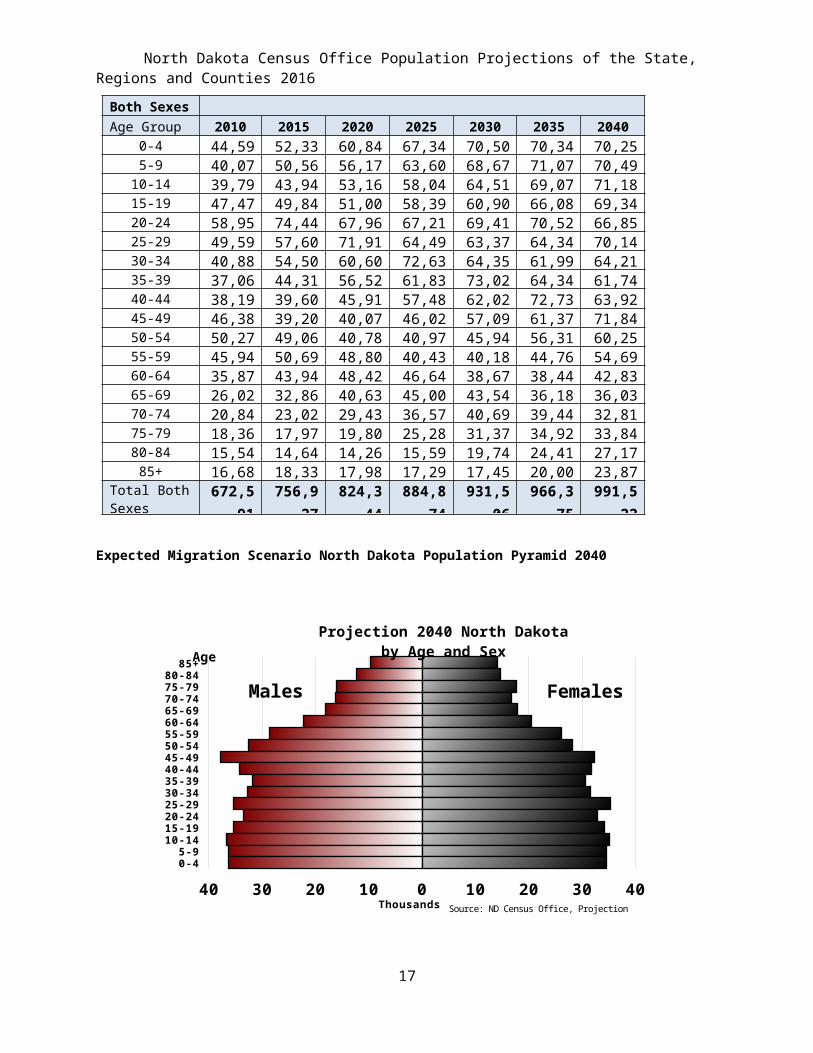
Both SexesAge Group 2010 2015 2020 2025 2030 2035 2040
0-4 44,595 52,338 60,848 67,345 70,505 70,340 70,253 5-9 40,076 50,566 56,178 63,601 68,678 71,070 70,494
10-14 39,790 43,949 53,163 58,047 64,513 69,072 71,184 15-19 47,474 49,843 51,006 58,396 60,908 66,083 69,345 20-24 58,956 74,446 67,961 67,213 69,415 70,525 66,855 25-29 49,596 57,609 71,919 64,496 63,379 64,348 70,149 30-34 40,889 54,504 60,609 72,630 64,353 61,994 64,210 35-39 37,065 44,310 56,529 61,833 73,025 64,340 61,749 40-44 38,197 39,607 45,918 57,485 62,025 72,736 63,920 45-49 46,380 39,204 40,076 46,029 57,090 61,374 71,843 50-54 50,277 49,066 40,784 40,974 45,944 56,316 60,256 55-59 45,946 50,696 48,809 40,437 40,182 44,760 54,696 60-64 35,873 43,949 48,421 46,641 38,671 38,448 42,834 65-69 26,028 32,868 40,634 45,008 43,548 36,188 36,036 70-74 20,845 23,026 29,435 36,575 40,699 39,447 32,811 75-79 18,368 17,970 19,808 25,280 31,372 34,923 33,841 80-84 15,548 14,642 14,260 15,594 19,740 24,411 27,173 85+ 16,688 18,333 17,983 17,290 17,458 20,001 23,873
Total Both Sexes
672,591 756,927 824,344 884,874 931,506 966,375 991,522
Expected Migration Scenario North Dakota Population Pyramid 2040
0-45-9
10-1415-1920-2425-2930-3435-3940-4445-4950-5455-5960-6465-6970-7475-7980-84
85+
40 30 20 10 0 10 20 30 40
Projection 2040 North Dakota by Age and Sex
Thousands
Age
Males Females
Source: ND Census Office, Projection
14
North Dakota Census Office Population Projections of the State, Regions and Counties 2016
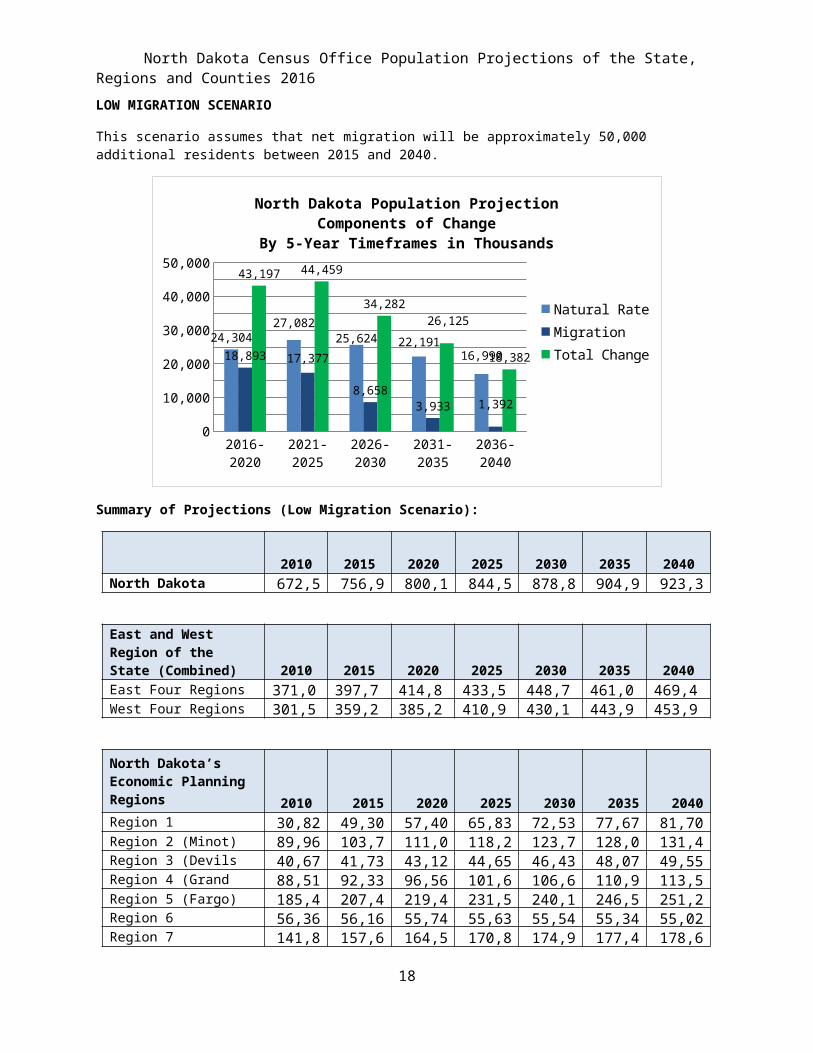
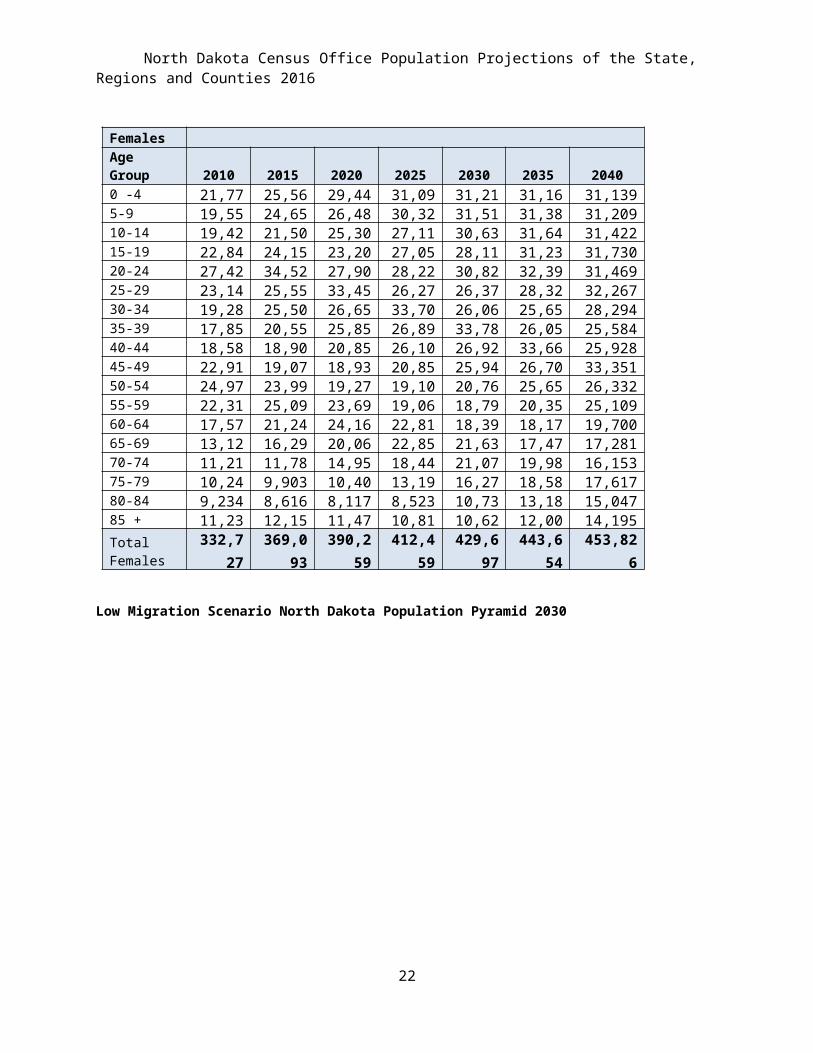
LOW MIGRATION SCENARIO
This scenario assumes that net migration will be approximately 50,000 additional residents between 2015 and 2040.
2016-2020 2021-2025 2026-2030 2031-2035 2036-20400
5,00010,00015,00020,00025,00030,00035,00040,00045,00050,000
24,30427,082
25,624 22,19116,99018,893 17,377
8,658
3,933 1,392
43,197 44,459
34,282
26,125
18,382
North Dakota Population ProjectionComponents of Change
By 5-Year Timeframes in Thousands
Natural RateMigrationTotal Change
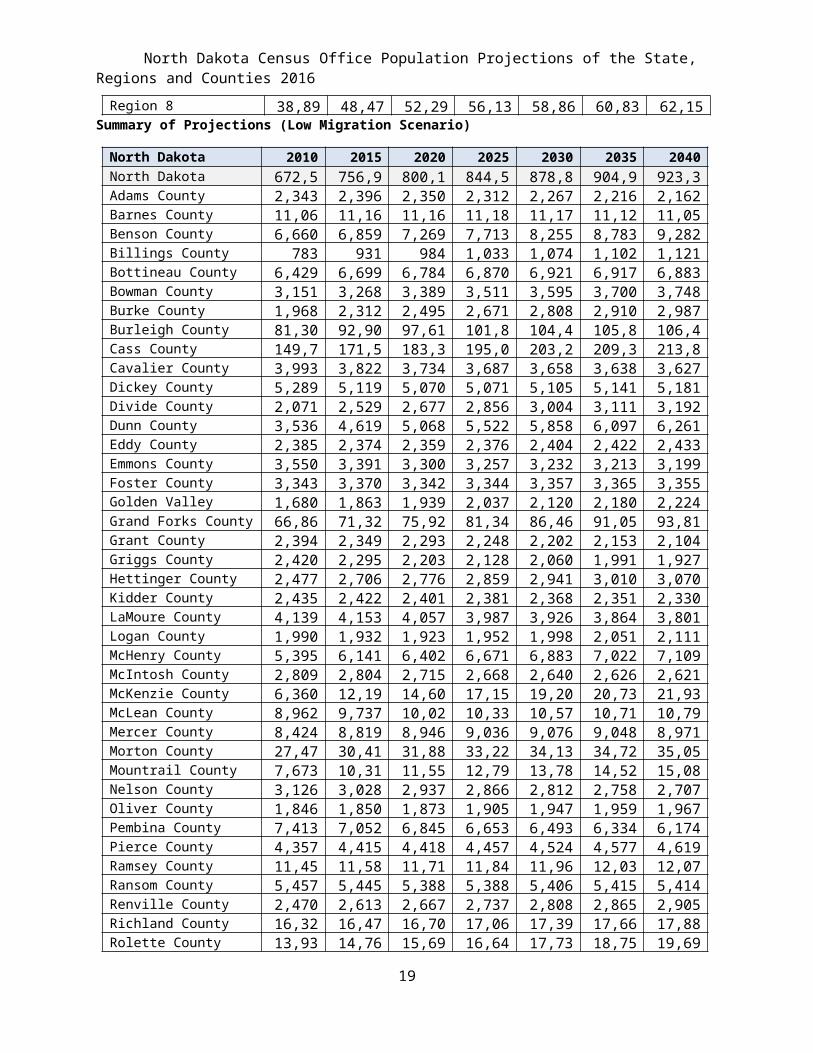
Summary of Projections (Low Migration Scenario):
2010 2015 2020 2025 2030 2035 2040North Dakota 672,591 756,927 800,124 844,583 878,865 904,990 923,372
East and West Region of the State (Combined) 2010 2015 2020 2025 2030 2035 2040East Four Regions 371,03
5397,713 414,885 433,591 448,760 461,005 469,414
West Four Regions 301,556
359,215 385,239 410,993 430,105 443,985 453,958
North Dakota’s Economic Planning Regions 2010 2015 2020 2025 2030 2035 2040Region 1 (Williston) 30,829 49,306 57,400 65,837 72,535 77,676 81,708 Region 2 (Minot) 89,967 103,736 111,041 118,213 123,724 128,043 131,418 Region 3 (Devils Lake) 40,672 41,731 43,124 44,656 46,434 48,071 49,554 Region 4 (Grand Forks) 88,519 92,333 96,563 101,699 106,617 110,999 113,553 Region 5 (Fargo) 185,48
1 207,484 219,456 231,597 240,163 246,591 251,283
Region 6 (Jamestown) 56,363 56,165 55,742 55,638 55,545 55,343 55,024 Region 7 (Bismarck) 141,86
4 157,696 164,500 170,811 174,981 177,435 178,678
Region 8 (Dickinson) 38,896 48,476 52,297 56,132 58,865 60,831 62,154 Summary of Projections (Low Migration Scenario)
15
North Dakota Census Office Population Projections of the State, Regions and Counties 2016
North Dakota Counties 2010 2015 2020 2025 2030 2035 2040North Dakota 672,591 756,927 800,124 844,583 878,865 904,990 923,372Adams County 2,343 2,396 2,350 2,312 2,267 2,216 2,162Barnes County 11,066 11,167 11,161 11,187 11,173 11,127 11,056Benson County 6,660 6,859 7,269 7,713 8,255 8,783 9,282Billings County 783 931 984 1,033 1,074 1,102 1,121Bottineau County 6,429 6,699 6,784 6,870 6,921 6,917 6,883Bowman County 3,151 3,268 3,389 3,511 3,595 3,700 3,748Burke County 1,968 2,312 2,495 2,671 2,808 2,910 2,987Burleigh County 81,308 92,903 97,614 101,879 104,451 105,868 106,456Cass County 149,778 171,588 183,374 195,070 203,227 209,363 213,863Cavalier County 3,993 3,822 3,734 3,687 3,658 3,638 3,627Dickey County 5,289 5,119 5,070 5,071 5,105 5,141 5,181Divide County 2,071 2,529 2,677 2,856 3,004 3,111 3,192Dunn County 3,536 4,619 5,068 5,522 5,858 6,097 6,261Eddy County 2,385 2,374 2,359 2,376 2,404 2,422 2,433Emmons County 3,550 3,391 3,300 3,257 3,232 3,213 3,199Foster County 3,343 3,370 3,342 3,344 3,357 3,365 3,355Golden Valley County 1,680 1,863 1,939 2,037 2,120 2,180 2,224Grand Forks County 66,861 71,328 75,927 81,345 86,467 91,053 93,816Grant County 2,394 2,349 2,293 2,248 2,202 2,153 2,104Griggs County 2,420 2,295 2,203 2,128 2,060 1,991 1,927Hettinger County 2,477 2,706 2,776 2,859 2,941 3,010 3,070Kidder County 2,435 2,422 2,401 2,381 2,368 2,351 2,330LaMoure County 4,139 4,153 4,057 3,987 3,926 3,864 3,801Logan County 1,990 1,932 1,923 1,952 1,998 2,051 2,111McHenry County 5,395 6,141 6,402 6,671 6,883 7,022 7,109McIntosh County 2,809 2,804 2,715 2,668 2,640 2,626 2,621McKenzie County 6,360 12,193 14,607 17,159 19,200 20,738 21,937McLean County 8,962 9,737 10,020 10,331 10,578 10,713 10,791Mercer County 8,424 8,819 8,946 9,036 9,076 9,048 8,971Morton County 27,471 30,418 31,883 33,221 34,138 34,720 35,051Mountrail County 7,673 10,314 11,551 12,798 13,784 14,524 15,086Nelson County 3,126 3,028 2,937 2,866 2,812 2,758 2,707Oliver County 1,846 1,850 1,873 1,905 1,947 1,959 1,967Pembina County 7,413 7,052 6,845 6,653 6,493 6,334 6,174Pierce County 4,357 4,415 4,418 4,457 4,524 4,577 4,619Ramsey County 11,451 11,587 11,718 11,847 11,961 12,035 12,071Ransom County 5,457 5,445 5,388 5,388 5,406 5,415 5,414Renville County 2,470 2,613 2,667 2,737 2,808 2,865 2,905Richland County 16,321 16,478 16,703 17,061 17,391 17,666 17,882Rolette County 13,937 14,765 15,693 16,646 17,739 18,757 19,690Sargent County 3,829 3,961 4,021 4,098 4,141 4,153 4,149North Dakota Counties (Continued) 2010 2015 2020 2025 2030 2035 2040
16
North Dakota Census Office Population Projections of the State, Regions and Counties 2016
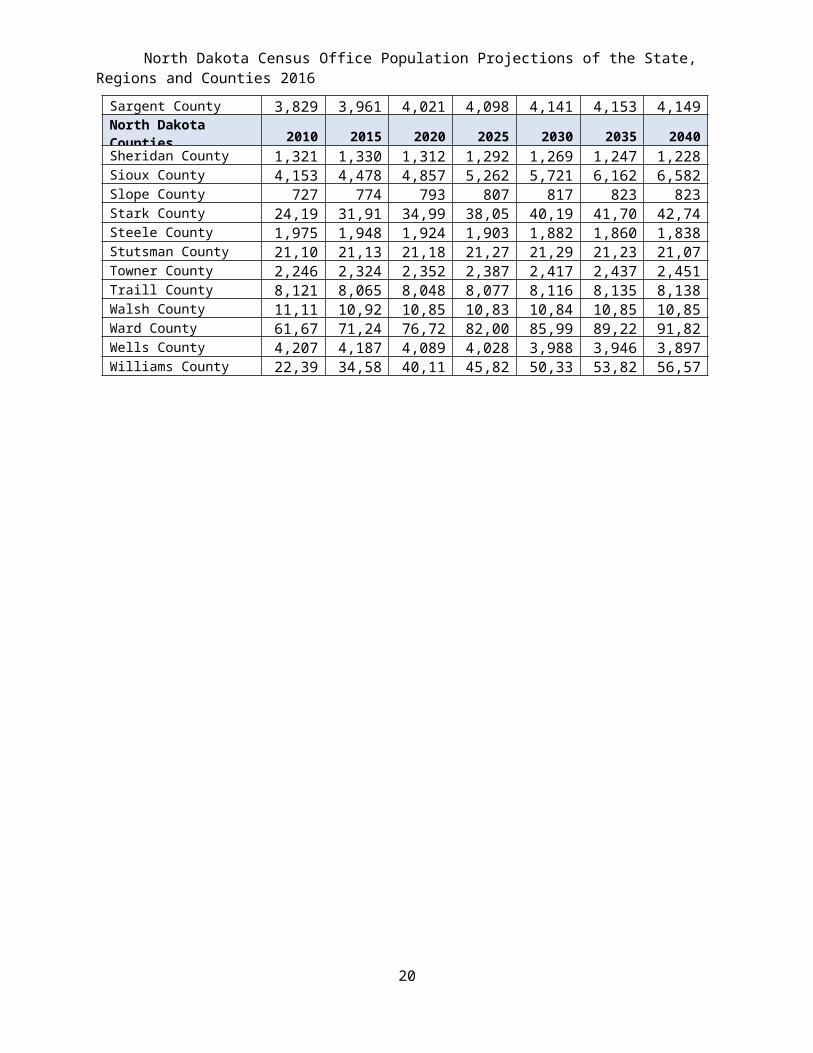
Sheridan County 1,321 1,330 1,312 1,292 1,269 1,247 1,228Sioux County 4,153 4,478 4,857 5,262 5,721 6,162 6,582Slope County 727 774 793 807 817 823 823Stark County 24,199 31,919 34,998 38,052 40,192 41,703 42,745Steele County 1,975 1,948 1,924 1,903 1,882 1,860 1,838Stutsman County 21,100 21,139 21,183 21,274 21,298 21,233 21,075Towner County 2,246 2,324 2,352 2,387 2,417 2,437 2,451Traill County 8,121 8,065 8,048 8,077 8,116 8,135 8,138Walsh County 11,119 10,925 10,853 10,835 10,845 10,854 10,856Ward County 61,675 71,243 76,724 82,009 85,996 89,229 91,829Wells County 4,207 4,187 4,089 4,028 3,988 3,946 3,897Williams County 22,398 34,583 40,117 45,822 50,332 53,826 56,578
17
North Dakota Census Office Population Projections of the State, Regions and Counties 2016
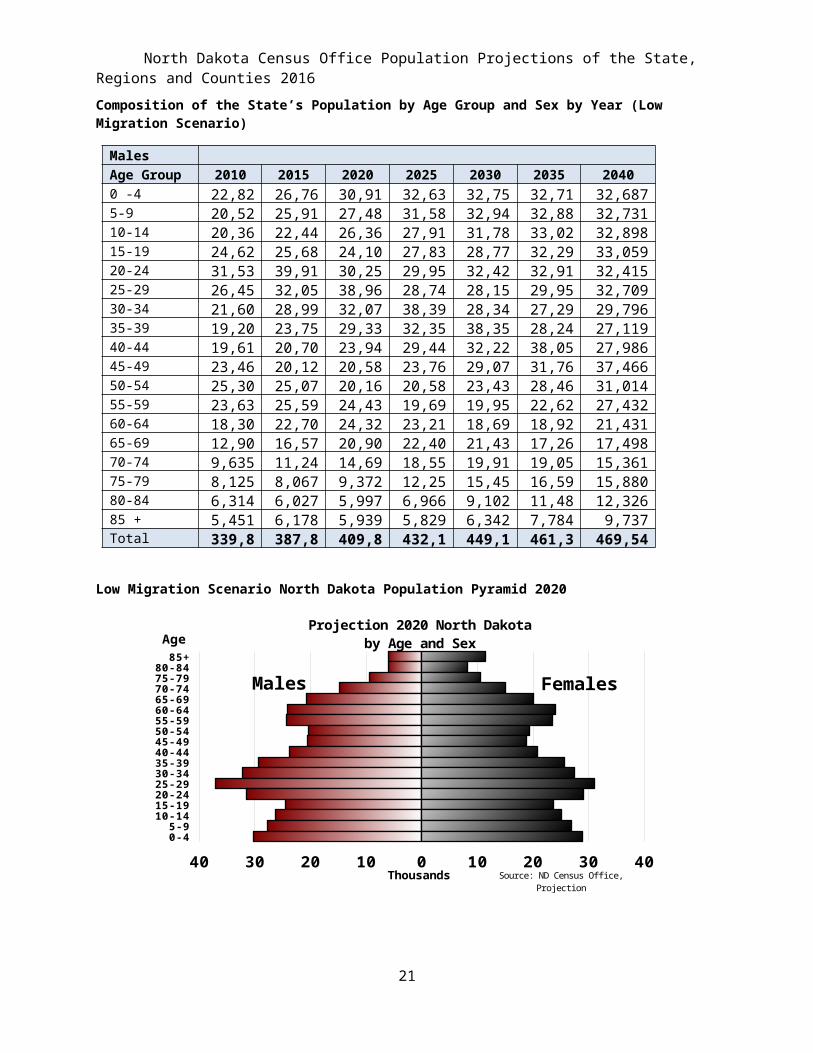
Composition of the State’s Population by Age Group and Sex by Year (Low Migration Scenario)
MalesAge Group 2010 2015 2020 2025 2030 2035 20400 -4 22,821 26,769 30,913 32,632 32,759 32,712 32,687 5-9 20,520 25,912 27,489 31,583 32,946 32,881 32,731 10-14 20,361 22,448 26,369 27,918 31,786 33,028 32,898 15-19 24,626 25,686 24,104 27,838 28,770 32,299 33,059 20-24 31,530 39,919 30,254 29,956 32,429 32,912 32,415 25-29 26,451 32,057 38,960 28,747 28,154 29,957 32,709 30-34 21,601 28,997 32,077 38,393 28,347 27,293 29,796 35-39 19,209 23,751 29,330 32,351 38,351 28,242 27,119 40-44 19,617 20,705 23,946 29,441 32,225 38,052 27,986 45-49 23,461 20,125 20,588 23,765 29,074 31,760 37,466 50-54 25,306 25,074 20,169 20,588 23,430 28,469 31,014 55-59 23,634 25,599 24,433 19,693 19,959 22,621 27,432 60-64 18,300 22,704 24,327 23,218 18,690 18,921 21,431 65-69 12,902 16,574 20,900 22,408 21,432 17,269 17,498 70-74 9,635 11,242 14,698 18,550 19,914 19,058 15,361 75-79 8,125 8,067 9,372 12,251 15,459 16,594 15,880 80-84 6,314 6,027 5,997 6,966 9,102 11,484 12,326 85 + 5,451 6,178 5,939 5,829 6,342 7,784 9,737 Total Males 339,864 387,834 409,865 432,125 449,168 461,336 469,546
Low Migration Scenario North Dakota Population Pyramid 2020
0-45-9
10-1415-1920-2425-2930-3435-3940-4445-4950-5455-5960-6465-6970-7475-7980-84
85+
40 30 20 10 0 10 20 30 40
Projection 2020 North Dakota by Age and Sex
Thousands
Age
Males Females
Source: ND Census Office, Projection
18
North Dakota Census Office Population Projections of the State, Regions and Counties 2016
FemalesAge Group 2010 2015 2020 2025 2030 2035 20400 -4 21,774 25,569 29,449 31,091 31,210 31,164 31,139 5-9 19,556 24,655 26,482 30,325 31,513 31,387 31,209 10-14 19,429 21,501 25,307 27,110 30,630 31,643 31,422 15-19 22,848 24,158 23,206 27,054 28,117 31,233 31,730 20-24 27,426 34,527 27,909 28,223 30,828 32,394 31,469 25-29 23,145 25,552 33,455 26,274 26,371 28,322 32,267 30-34 19,288 25,507 26,659 33,709 26,069 25,659 28,294 35-39 17,856 20,559 25,859 26,890 33,785 26,058 25,584 40-44 18,580 18,902 20,850 26,103 26,924 33,666 25,928 45-49 22,919 19,079 18,931 20,853 25,949 26,705 33,351 50-54 24,971 23,992 19,271 19,108 20,765 25,656 26,332 55-59 22,312 25,097 23,694 19,069 18,798 20,358 25,109 60-64 17,573 21,244 24,165 22,811 18,398 18,171 19,700 65-69 13,126 16,294 20,069 22,853 21,637 17,476 17,281 70-74 11,210 11,783 14,952 18,447 21,079 19,985 16,153 75-79 10,243 9,903 10,406 13,198 16,270 18,584 17,617 80-84 9,234 8,616 8,117 8,523 10,731 13,189 15,047 85 + 11,237 12,155 11,478 10,819 10,625 12,005 14,195
Total Females
332,727 369,093 390,259 412,459 429,697 443,654 453,826
Low Migration Scenario North Dakota Population Pyramid 2030
0-45-9
10-1415-1920-2425-2930-3435-3940-4445-4950-5455-5960-6465-6970-7475-7980-84
85+
40 30 20 10 0 10 20 30 40
Projection 2030 North Dakota by Age and Sex
Thousands
Age
Males Females
Source: ND Census Office, Projection
19
North Dakota Census Office Population Projections of the State, Regions and Counties 2016
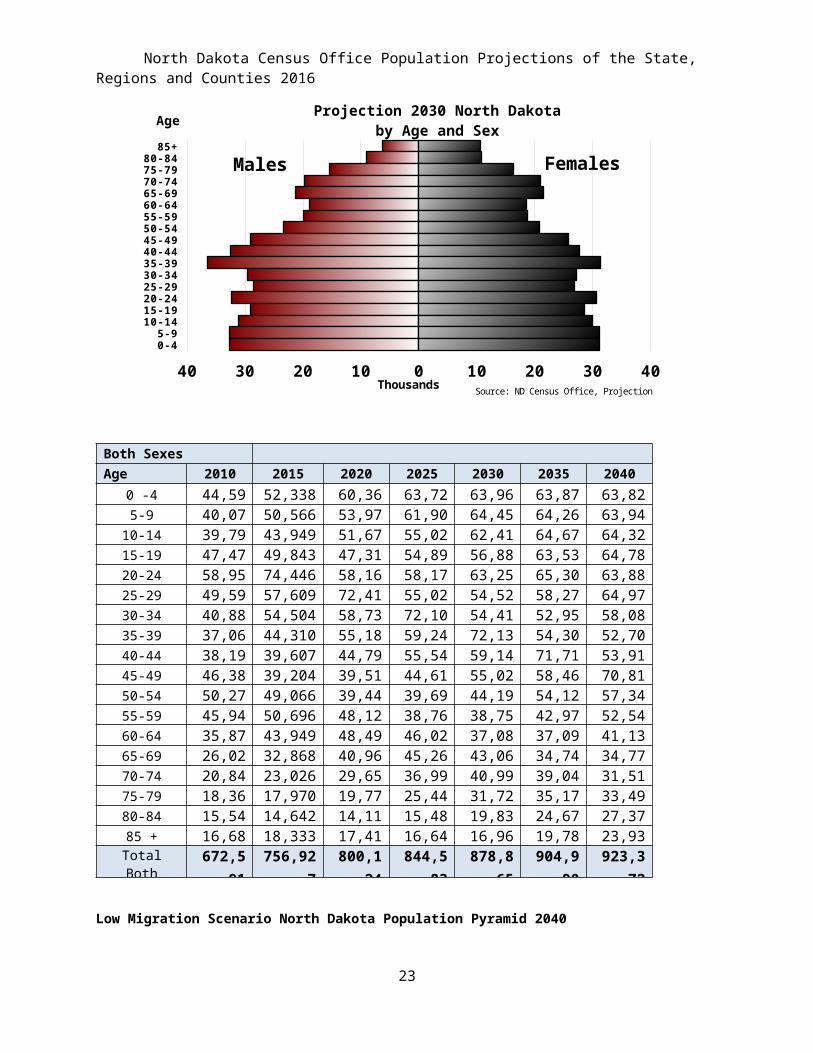
Both Sexes
Age Group: 2010 2015 2020 2025 2030 2035 2040
0 -4 44,595 52,338 60,362 63,723 63,969 63,876 63,826 5-9 40,076 50,566 53,972 61,908 64,459 64,267 63,940
10-14 39,790 43,949 51,676 55,028 62,416 64,670 64,321 15-19 47,474 49,843 47,310 54,892 56,887 63,532 64,788 20-24 58,956 74,446 58,163 58,179 63,257 65,306 63,884 25-29 49,596 57,609 72,415 55,021 54,524 58,279 64,976 30-34 40,889 54,504 58,736 72,101 54,417 52,952 58,089 35-39 37,065 44,310 55,189 59,241 72,136 54,300 52,703 40-44 38,197 39,607 44,796 55,544 59,149 71,718 53,914 45-49 46,380 39,204 39,519 44,617 55,023 58,465 70,817 50-54 50,277 49,066 39,440 39,696 44,195 54,125 57,346 55-59 45,946 50,696 48,127 38,761 38,756 42,979 52,541 60-64 35,873 43,949 48,492 46,029 37,088 37,092 41,132 65-69 26,028 32,868 40,968 45,261 43,068 34,745 34,779 70-74 20,845 23,026 29,650 36,997 40,993 39,042 31,514 75-79 18,368 17,970 19,777 25,449 31,728 35,178 33,497 80-84 15,548 14,642 14,114 15,489 19,834 24,672 27,373 85 + 16,688 18,333 17,417 16,648 16,967 19,789 23,932
Total Both Sexes
672,591 756,927 800,124 844,583 878,865 904,990 923,372
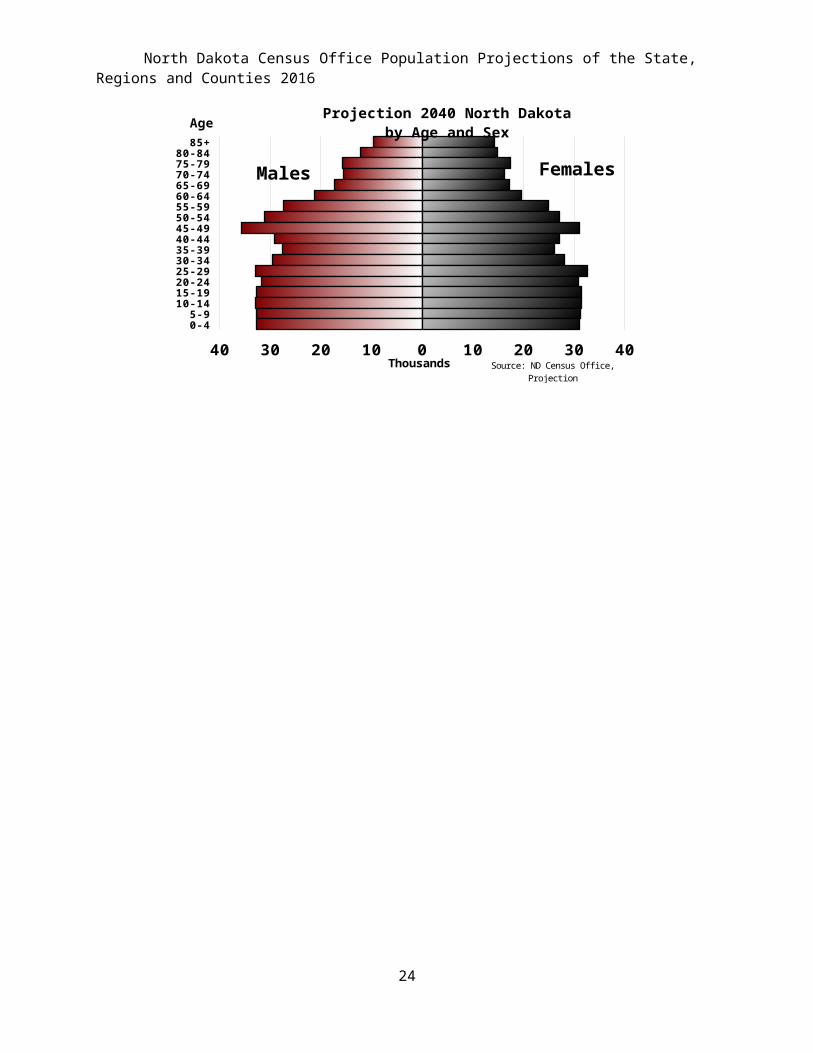
Low Migration Scenario North Dakota Population Pyramid 2040
0-45-9
10-1415-1920-2425-2930-3435-3940-4445-4950-5455-5960-6465-6970-7475-7980-84
85+
40 30 20 10 0 10 20 30 40
Projection 2040 North Dakota by Age and Sex
Thousands
Age
Males Females
Source: ND Census Office, Projection
20
North Dakota Census Office Population Projections of the State, Regions and Counties 2016
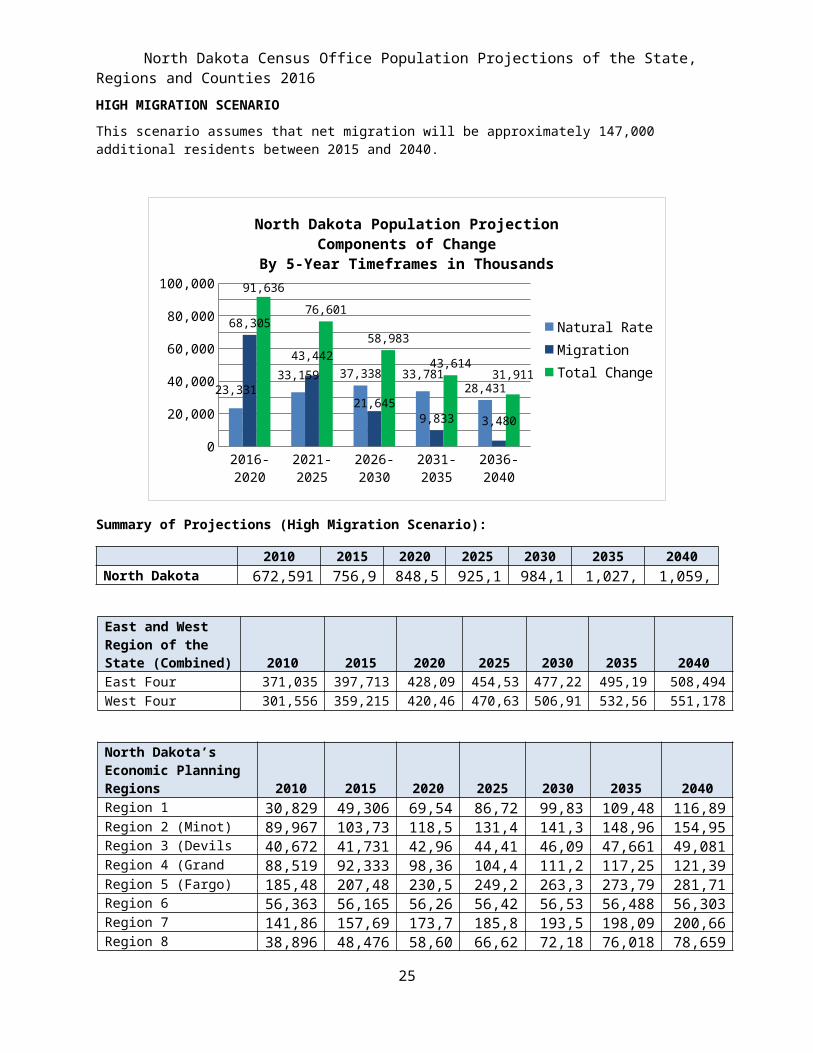
HIGH MIGRATION SCENARIOThis scenario assumes that net migration will be approximately 147,000 additional residents between 2015 and 2040.
2016-2020 2021-2025 2026-2030 2031-2035 2036-20400
10,00020,00030,00040,00050,00060,00070,00080,00090,000
100,000
23,33133,159 37,338 33,781
28,431
68,305
43,442
21,645
9,833 3,480
91,636
76,601
58,983
43,61431,911
North Dakota Population ProjectionComponents of Change
By 5-Year Timeframes in Thousands
Natural RateMigrationTotal Change
Summary of Projections (High Migration Scenario):
2010 2015 2020 2025 2030 2035 2040North Dakota 672,591 756,927 848,563 925,164 984,147 1,027,760 1,059,672
East and West Region of the State (Combined) 2010 2015 2020 2025 2030 2035 2040East Four Regions 371,035 397,713 428,096 454,530 477,229 495,199 508,494
West Four Regions 301,556 359,215 420,467 470,634 506,918 532,561 551,178
North Dakota’s Economic Planning Regions 2010 2015 2020 2025 2030 2035 2040Region 1 (Williston) 30,829 49,306 69,545 86,726 99,831 109,486 116,896 Region 2 (Minot) 89,967 103,736 118,550 131,434 141,361 148,967 154,959 Region 3 (Devils Lake) 40,672 41,731 42,965 44,413 46,091 47,661 49,081 Region 4 (Grand Forks) 88,519 92,333 98,363 104,492 111,234 117,253 121,396 Region 5 (Fargo) 185,481 207,484 230,505 249,202 263,370 273,798 281,714 Region 6 (Jamestown) 56,363 56,165 56,263 56,422 56,534 56,488 56,303 Region 7 (Bismarck) 141,864 157,696 173,770 185,853 193,544 198,090 200,664 Region 8 (Dickinson) 38,896 48,476 58,602 66,622 72,182 76,018 78,659
21
North Dakota Census Office Population Projections of the State, Regions and Counties 2016
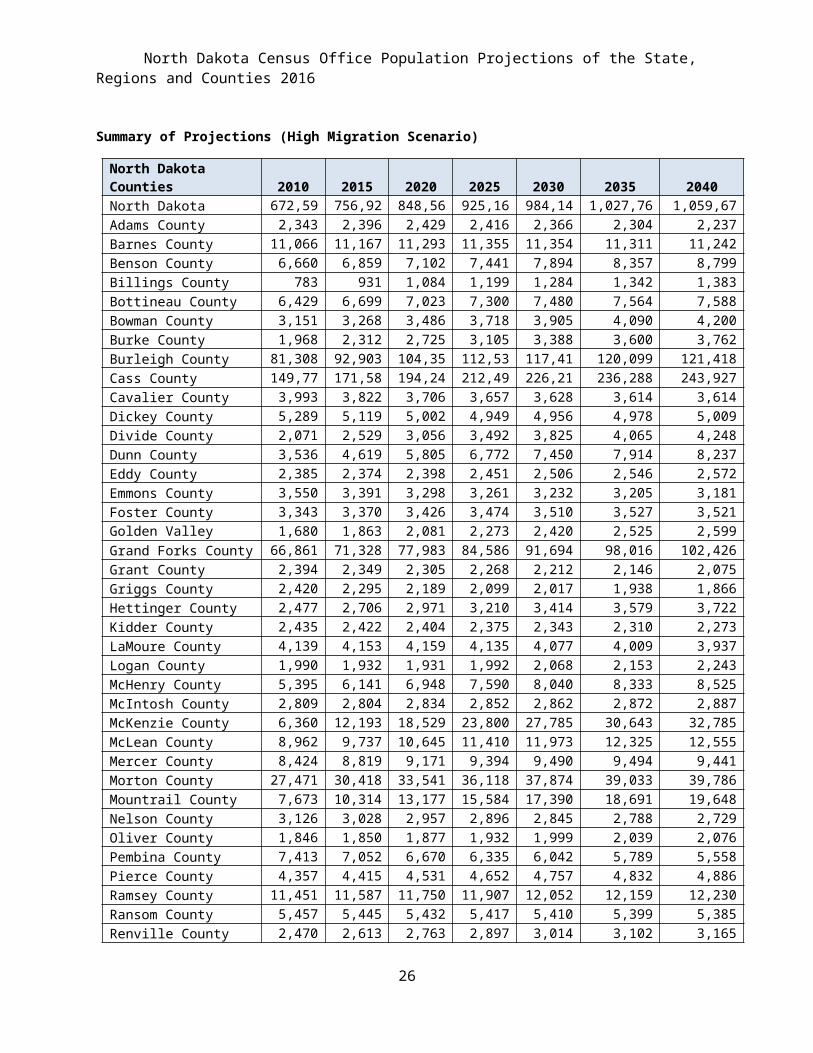
Summary of Projections (High Migration Scenario)
North Dakota Counties 2010 2015 2020 2025 2030 2035 2040North Dakota 672,591 756,927 848,563 925,164 984,147 1,027,760 1,059,672
Adams County 2,343 2,396 2,429 2,416 2,366 2,304 2,237
Barnes County 11,066 11,167 11,293 11,355 11,354 11,311 11,242
Benson County 6,660 6,859 7,102 7,441 7,894 8,357 8,799
Billings County 783 931 1,084 1,199 1,284 1,342 1,383
Bottineau County 6,429 6,699 7,023 7,300 7,480 7,564 7,588
Bowman County 3,151 3,268 3,486 3,718 3,905 4,090 4,200
Burke County 1,968 2,312 2,725 3,105 3,388 3,600 3,762
Burleigh County 81,308 92,903 104,358 112,532 117,414 120,099 121,418
Cass County 149,778 171,588 194,246 212,498 226,212 236,288 243,927
Cavalier County 3,993 3,822 3,706 3,657 3,628 3,614 3,614
Dickey County 5,289 5,119 5,002 4,949 4,956 4,978 5,009
Divide County 2,071 2,529 3,056 3,492 3,825 4,065 4,248
Dunn County 3,536 4,619 5,805 6,772 7,450 7,914 8,237
Eddy County 2,385 2,374 2,398 2,451 2,506 2,546 2,572
Emmons County 3,550 3,391 3,298 3,261 3,232 3,205 3,181
Foster County 3,343 3,370 3,426 3,474 3,510 3,527 3,521
Golden Valley County 1,680 1,863 2,081 2,273 2,420 2,525 2,599
Grand Forks County 66,861 71,328 77,983 84,586 91,694 98,016 102,426
Grant County 2,394 2,349 2,305 2,268 2,212 2,146 2,075
Griggs County 2,420 2,295 2,189 2,099 2,017 1,938 1,866
Hettinger County 2,477 2,706 2,971 3,210 3,414 3,579 3,722
Kidder County 2,435 2,422 2,404 2,375 2,343 2,310 2,273
LaMoure County 4,139 4,153 4,159 4,135 4,077 4,009 3,937
Logan County 1,990 1,932 1,931 1,992 2,068 2,153 2,243
McHenry County 5,395 6,141 6,948 7,590 8,040 8,333 8,525
McIntosh County 2,809 2,804 2,834 2,852 2,862 2,872 2,887
McKenzie County 6,360 12,193 18,529 23,800 27,785 30,643 32,785
McLean County 8,962 9,737 10,645 11,410 11,973 12,325 12,555
Mercer County 8,424 8,819 9,171 9,394 9,490 9,494 9,441
Morton County 27,471 30,418 33,541 36,118 37,874 39,033 39,786
Mountrail County 7,673 10,314 13,177 15,584 17,390 18,691 19,648
Nelson County 3,126 3,028 2,957 2,896 2,845 2,788 2,729
Oliver County 1,846 1,850 1,877 1,932 1,999 2,039 2,076
Pembina County 7,413 7,052 6,670 6,335 6,042 5,789 5,558
Pierce County 4,357 4,415 4,531 4,652 4,757 4,832 4,886
Ramsey County 11,451 11,587 11,750 11,907 12,052 12,159 12,230
Ransom County 5,457 5,445 5,432 5,417 5,410 5,399 5,385
Renville County 2,470 2,613 2,763 2,897 3,014 3,102 3,165
Richland County 16,321 16,478 16,742 17,054 17,421 17,753 18,053
Rolette County 13,937 14,765 15,563 16,397 17,373 18,296 19,141
Sargent County 3,829 3,961 4,146 4,325 4,434 4,492 4,519
22
North Dakota Census Office Population Projections of the State, Regions and Counties 2016
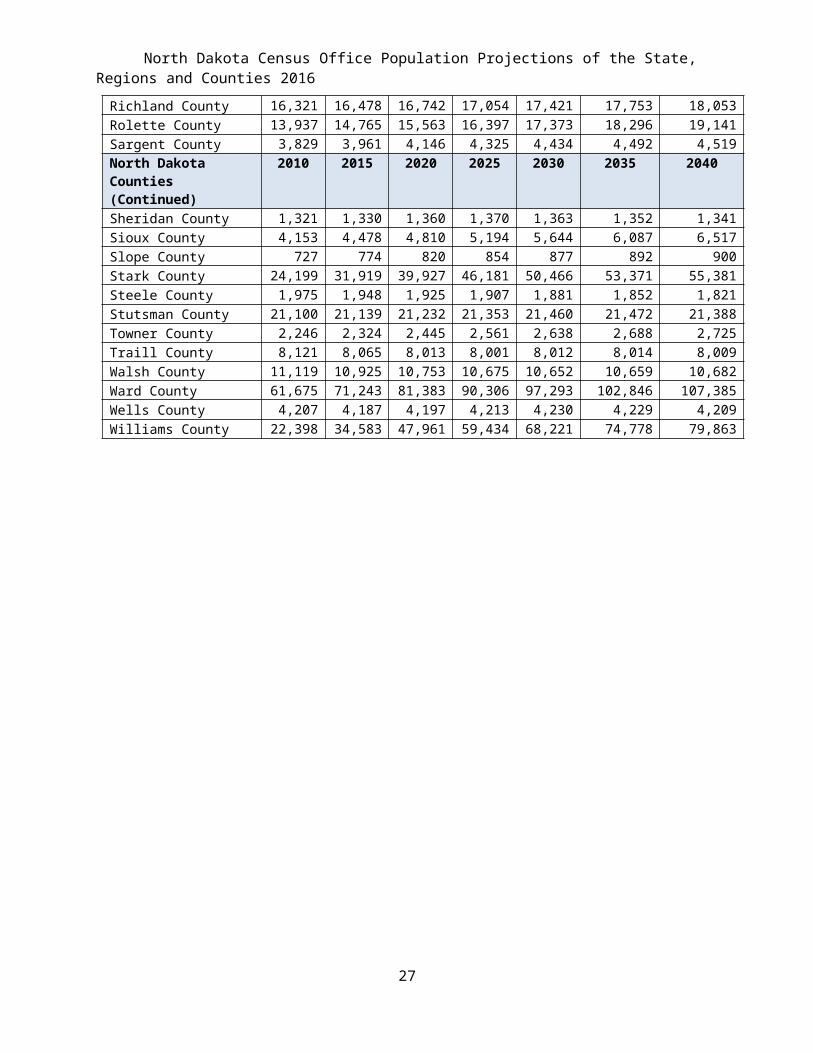
North Dakota Counties(Continued)
2010 2015 2020 2025 2030 2035 2040
Sheridan County 1,321 1,330 1,360 1,370 1,363 1,352 1,341
Sioux County 4,153 4,478 4,810 5,194 5,644 6,087 6,517
Slope County 727 774 820 854 877 892 900
Stark County 24,199 31,919 39,927 46,181 50,466 53,371 55,381
Steele County 1,975 1,948 1,925 1,907 1,881 1,852 1,821
Stutsman County 21,100 21,139 21,232 21,353 21,460 21,472 21,388
Towner County 2,246 2,324 2,445 2,561 2,638 2,688 2,725
Traill County 8,121 8,065 8,013 8,001 8,012 8,014 8,009
Walsh County 11,119 10,925 10,753 10,675 10,652 10,659 10,682
Ward County 61,675 71,243 81,383 90,306 97,293 102,846 107,385
Wells County 4,207 4,187 4,197 4,213 4,230 4,229 4,209
Williams County 22,398 34,583 47,961 59,434 68,221 74,778 79,863
23
North Dakota Census Office Population Projections of the State, Regions and Counties 2016
Composition of the State’s Population by Age Group and Sex by Year (High Migration Scenario)
MalesAge Group 2010 2015 2020 2025 2030 2035 20400 -4 22,821 26,769 31,411 36,338 39,452 39,332 39,269 5-9 20,520 25,912 29,455 33,139 37,175 39,805 39,428 10-14 20,361 22,448 27,604 30,547 33,673 37,405 39,872 15-19 24,626 25,686 27,506 30,903 32,307 34,597 37,575 20-24 31,530 39,919 39,924 38,550 38,074 37,611 35,119 25-29 26,451 32,057 39,500 38,644 36,836 35,631 37,400 30-34 21,601 28,997 33,764 39,838 38,627 36,120 35,502 35-39 19,209 23,751 30,801 34,818 40,180 38,620 35,939 40-44 19,617 20,705 25,092 31,515 34,974 40,002 38,307 45-49 23,461 20,125 21,138 25,189 31,263 34,533 39,409 50-54 25,306 25,074 21,590 21,889 25,200 30,777 33,779 55-59 23,634 25,599 25,195 21,471 21,416 24,418 29,687 60-64 18,300 22,704 24,539 24,054 20,431 20,327 23,142 65-69 12,902 16,574 20,620 22,453 22,130 18,846 18,787 70-74 9,635 11,242 14,575 18,235 19,921 19,664 16,758 75-79 8,125 8,067 9,381 12,153 15,198 16,601 16,386 80-84 6,314 6,027 6,010 6,980 9,033 11,292 12,332 85 + 5,451 6,178 6,182 6,055 6,497 7,827 9,647 Total Males 339,864 387,834 434,287 472,769 502,387 523,407 538,339
High Migration Scenario North Dakota Population Pyramid 2020
0-45-9
10-1415-1920-2425-2930-3435-3940-4445-4950-5455-5960-6465-6970-7475-7980-84
85+
45 35 25 15 5 5 15 25 35 45
Projection 2020 North Dakota by Age and Sex
Thousands
Age
Males Females
Source: ND Census Office, Projection
24
North Dakota Census Office Population Projections of the State, Regions and Counties 2016
FemalesAge Group 2010 2015 2020 2025 2030 2035 20400 -4 21,774 25,569 29,923 34,628 37,589 37,472 37,410 5-9 19,556 24,655 28,930 32,154 35,722 38,067 37,620 10-14 19,429 21,501 27,046 30,519 32,936 36,067 38,176 15-19 22,848 24,158 27,197 30,998 32,622 34,037 36,327 20-24 27,426 34,527 37,835 37,696 37,500 38,133 34,707 25-29 23,145 25,552 31,924 35,328 35,398 34,786 37,924 30-34 19,288 25,507 28,719 33,322 35,662 34,916 34,828 35-39 17,856 20,559 27,067 29,608 33,733 35,761 34,855 40-44 18,580 18,902 21,949 27,911 29,928 33,752 35,619 45-49 22,919 19,079 19,495 22,252 27,894 29,751 33,460 50-54 24,971 23,992 20,539 20,364 22,492 27,730 29,387 55-59 22,312 25,097 24,296 20,642 20,192 22,122 27,164 60-64 17,573 21,244 23,812 23,199 19,824 19,477 21,393 65-69 13,126 16,294 19,680 22,302 21,899 18,785 18,507 70-74 11,210 11,783 14,645 17,918 20,485 20,189 17,350 75-79 10,243 9,903 10,458 12,957 15,817 18,067 17,799 80-84 9,234 8,616 8,395 8,719 10,613 12,858 14,641 85 + 11,237 12,155 12,367 11,877 11,453 12,385 14,167 Total Females
332,727 369,093 414,276 452,395 481,760 504,353 521,333
High Migration Scenario North Dakota Population Pyramid 2030
0-45-9
10-1415-1920-2425-2930-3435-3940-4445-4950-5455-5960-6465-6970-7475-7980-84
85+
40 30 20 10 0 10 20 30 40
Projection 2030 North Dakota by Age and Sex
Thousands
Age
Males Females
Source: ND Census Office, Projection
25
North Dakota Census Office Population Projections of the State, Regions and Counties 2016
Both Sexes
Age Group 2010 2015 2020 2025 2030 2035 2040
0 -4 44,595 52,338 61,335 70,967 77,041 76,805 76,679 5-9 40,076 50,566 58,385 65,293 72,897 77,872 77,048
10-14 39,790 43,949 54,650 61,066 66,610 73,473 78,048 15-19 47,474 49,843 54,703 61,901 64,929 68,634 73,901 20-24 58,956 74,446 77,759 76,247 75,574 75,744 69,826 25-29 49,596 57,609 71,424 73,972 72,234 70,417 75,323 30-34 40,889 54,504 62,483 73,159 74,289 71,036 70,330 35-39 37,065 44,310 57,868 64,426 73,913 74,380 70,794 40-44 38,197 39,607 47,040 59,426 64,902 73,753 73,926 45-49 46,380 39,204 40,633 47,440 59,157 64,283 72,869 50-54 50,277 49,066 42,129 42,253 47,692 58,507 63,166 55-59 45,946 50,696 49,491 42,113 41,608 46,540 56,851 60-64 35,873 43,949 48,351 47,252 40,255 39,804 44,536 65-69 26,028 32,868 40,300 44,755 44,029 37,631 37,294 70-74 20,845 23,026 29,220 36,152 40,406 39,852 34,108 75-79 18,368 17,970 19,839 25,110 31,016 34,668 34,185 80-84 15,548 14,642 14,405 15,699 19,646 24,149 26,973 85 + 16,688 18,333 18,549 17,933 17,950 20,212 23,814
Total Both Sexes
672,591 756,927 848,563 925,164 984,147 1,027,760 1,059,672
High Migration Scenario North Dakota Population Pyramid 2040
0-45-9
10-1415-1920-2425-2930-3435-3940-4445-4950-5455-5960-6465-6970-7475-7980-84
85+
40 30 20 10 0 10 20 30 40
Projection 2040 North Dakota by Age and Sex
Thousands
Age
Males Females
Source: ND Census Office, Projection
26
North Dakota Census Office Population Projections of the State, Regions and Counties 2016
North Dakota Department of Commerce – Census Office1600 E. Century Ave., Suite 2
PO Box 2057Bismarck, ND 58503 | 701.328.5300
Kevin IversonCensus Office Manager
Joe CichaCensus Specialist
27