Embed Size (px)
Citation preview
1
Disasters Causing Mass Fatalities in New Zealand 1900-2015: The Basic Descriptive Epidemiology
Group C2 Fourth Year Medical Students, University of Otago, Wellington
Kate Seddon
Zoë Vincent
Luke Weaver-Mikaere
Adrienne Morales
Simone Besseling
Matthew O’Sullivan
Emily Cartmell
Shaina Pinares Garcia
Grant Crane
Laurie Renwick
Jonathan Feki
Elyssa Tan
Nicola Guy
Geoff Hoggins
Benjamin Keren
Jake Aitken
Jacob Arahill
29 March 2016
2
Abstract
Introduction
Disasters can cause high fatalities and injuries and have diffuse impacts on health services and broader society making them an important public health issue. Although data describing individual disasters exists, a descriptive epidemiological review of New Zealand disasters has not previously been published.
Aims
This study aimed to collate the available data on all major disasters in New Zealand between 1900 and 2015. The purpose of this was to evaluate disaster trends, impacts of disasters on public health and how efforts to prevent and mitigate disasters have changed over time.
Methods
An online search was conducted to create a composite dataset across the fields of natural, transport/industrial/infrastructure (TII) and biological disasters (ie, epidemics and pandemics). Information analysed included number of fatalities and injuries, preventability of disasters, formal inquiries and policies introduced as a result of the disasters. Data were analysed to determine temporal trends as well as trends between different disaster types.
Results
A total of 49 disasters were identified involving a total of 11,829 fatalities with 87% of the fatalities due to epidemic disasters. Disasters provisionally classified as “non-preventable” decreased from 16 pre-1950 to 9 post-1950. There was no significant change over time in the number of “impact-reducible” or preventable disasters, but the NZ population has more than doubled in this time. There has been a moderate increase in the proportion of disasters that had official inquiries conducted (53.5% pre-1950 versus 88.2% post-1950). There has been a statistically significant downward trend in mortality rates due to epidemics since 1900 (R2=0.357). Case studies on selected disasters indicated potentially very large economic impacts, for example, an estimated $30 billion cost from the Christchurch earthquake in 2011.
Conclusions
Disasters, and especially biological disasters, have caused large burden of morbidity and mortality in New Zealand over this 1900 to 2015 period. Disasters can also have a wide impact on population from social, and economic perspectives. This impact can affect the population disproportionately with Māori and lower socioeconomic status communities sometimes experiencing higher burdens. The results of this study suggest that New Zealand is improving in its ability to prevent and manage disasters due to advances in technology, policy and health systems. Increases in formal inquiries over time suggest that reasonable efforts are in place investigate disasters. Many policies are also in place to prevent future disasters in New Zealand from occurring.
3
Introduction
While health-care preparedness, planning and response to disasters on a national and worldwide scale are widely commented on (1-6), there is a lack of national descriptive epidemiology of disasters. Such information can aid in understanding the public health impact of these events and determine the potential needs of a population (5). Importantly this information can also be used to improve disaster prevention and also to prevent adverse health outcomes by informing management programmes and contingency plans in all aspects of disaster management.
There is an eclectic understanding throughout the literature of the term disaster and subsequently a call to harmonise this for future research purposes. The United Nations Office for Disaster Risk Reduction (UNISDR) defines a disaster as “a serious disruption of the functioning of a community or a society involving widespread human, material, economic or environmental losses and impacts, which exceeds the ability of the affected community or society to cope using its own resources” (7). More recently, Mayner et al. (8) reinforces these key themes, defining a disaster as “the widespread disruption and damage to a community that exceeds its ability to cope and overwhelms its resources”. However both of these definitions involve subjective elements so our study focused on the mass fatality level as the key defining feature in a disaster as well as the event being unexpected. We address the wider impacts of disasters in the discussion section of this Report.
Disasters can have varied and potentially widespread impact on a population including loss of life, physical injury, displacement and ongoing psychological effects. These effects are not only limited to those directly affected by the disaster, but extend to friends and family, rescue and recovery personnel and the surrounding community (9). There is often an economic impact from damage to infrastructure, loss of sources of employment and displacement of populations due to destruction of property. Factors that can affect the outcome of a disaster include population size, increased population density in urban areas, location of cities in areas that are at higher risk for a disaster (for example near coastlines or along earthquake fault-lines) and ease of movement of populations (particularly when considering biological events) (10).
Strategic planning for disasters (10) incorporates all levels of the healthcare sector; from national level and government to regional organisations and communities. The New Zealand Health Emergency Plan reflects current thinking on health aspects of emergency management of disasters in that it covers four areas: reduction, readiness, response and recovery (11). This plan intends to ensure that during and after an emergency, the health needs in the community are met in an appropriate and sustainable manner.
Disasters can have enormous potential to undermine public health on a population level, yet disaster events that have caused significant morbidity and mortality remain an under-researched area of public health in New Zealand. No descriptive and analytic epidemiological studies of multiple disaster events in a defined time period in New Zealand have been undertaken to date. Therefore, this study aimed to describe major disasters in New Zealand, from 1900-2015, in terms of patterns, causes, and effects. This was done to gain an appreciation of the impact on public health in New
4
Zealand and to determine if prevention and response to disasters may have been improving over time.
Methods
We conducted a narrative review of the descriptive epidemiological parameters of disasters in New Zealand from 1900 to 2015.
Disaster criteria
A disaster was defined as an unexpected event that occurred within New Zealand’s current geographical jurisdiction from January 1900 and through to December 2015, which caused 10 or more confirmed fatalities. The mortality threshold for biological disasters was set at 50 or more confirmed fatalities in one year, as events such as pandemics typically occur over a longer time period and mortality rates in official reports are only in terms of deaths per year. Events were excluded from the study if there was evidence of prior planning and/or an acknowledgement for the potential loss of human life. Therefore, riots, civil unrest, massacres and events related to these were excluded (eg, the Featherston Prisoner of War Camp riot during World War Two).
Search Strategy
A search was first conducted using Google Scholar, the Emergency Events Database (EM-DAT) (12) and NZ History’s disaster timeline (13) to create a composite dataset across the fields of natural (geophysical, meteorological, hydrological, climatological); transport, industry and infrastructure (TII); and biological disasters. Search terms included combination of the keywords "natural disaster", "transport", "industrial", "biological", "epidemic", "disasters", "New Zealand" and "epidemiology". The literature identified also served as the basis for reflection on historical aspects of New Zealand disasters from a public health perspective. These searches were expanded by reviewing key references from epidemiological literature and also included relevant inquiries including inquests, Royal Commissions and Transport Accident Investigation Commission inquiry reports.
Preventability
The scientific literature on preventability classifications and scales was reviewed. However there was no record of a scale which encompassed the wide range of disaster categories relevant to the current study. We therefore created a preventability scale incorporating an independent three-person review. The review team of three researchers had to reach a unanimous decision for a preventability classification to be assigned.
Disasters were graded to be “non-preventable”, “preventable”, or “impact-reducible” (in the case where the event itself was not preventable but some loss of life was), using the following criteria:

5
● Was the disaster caused by preventable human error● Were reasonable steps taken before the event to minimise the potential impact
and loss of life ● In the period immediately following the disaster was there a reasonable
attempt made to minimise the impact and loss of human life● Was technology available and/or utilised at the time of the event to minimise
impact and loss of life
If there was insufficient data to determine the likely preventability of the disaster using the above criteria (in terms of a balance of probabilities for the classification), the preventability was determined to be “unknown”.
Results
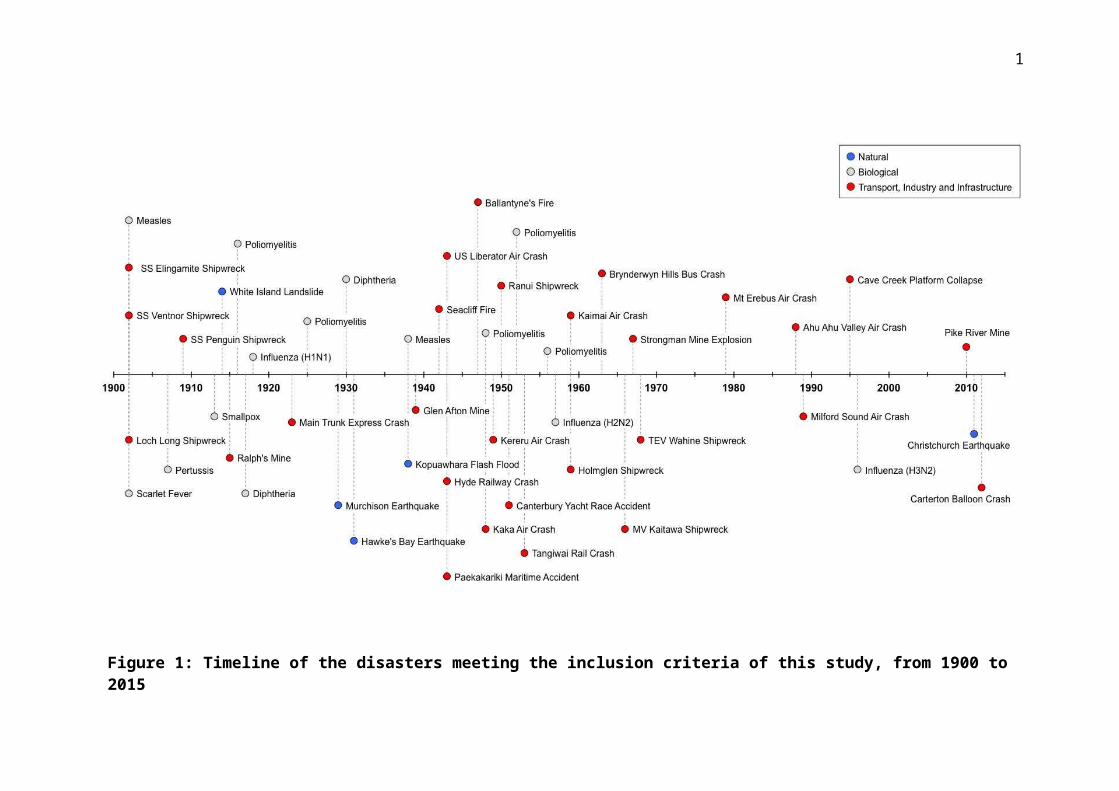
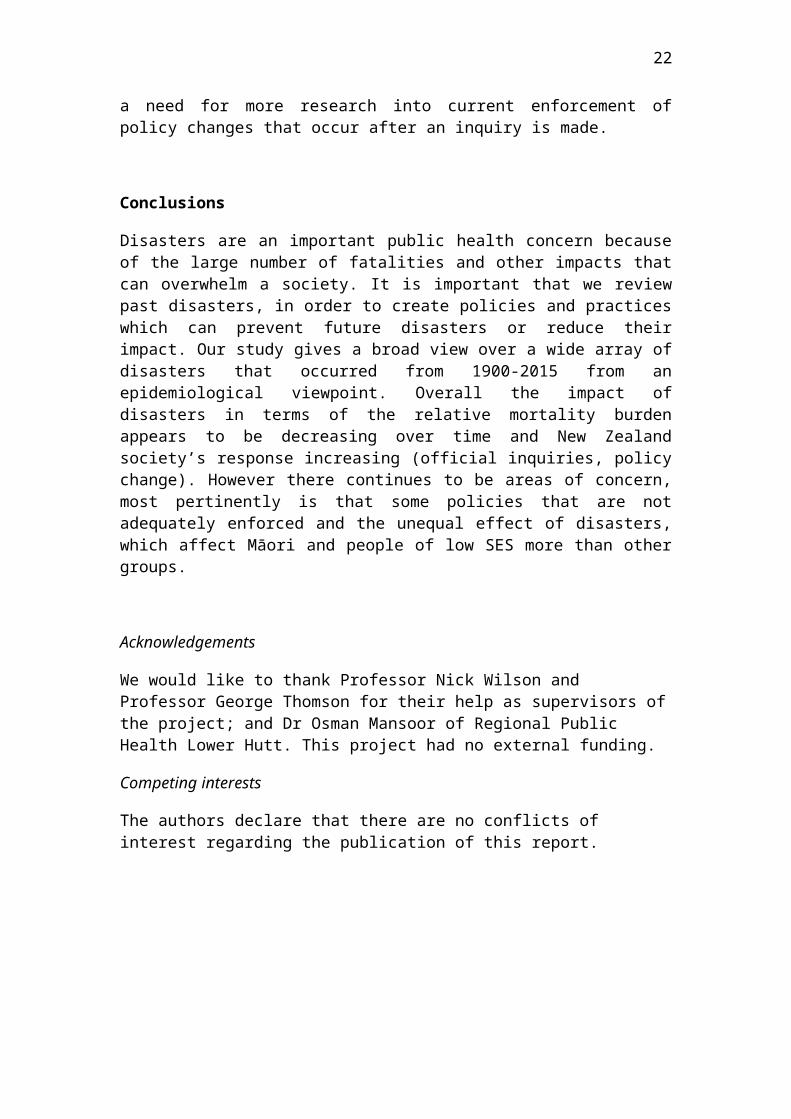
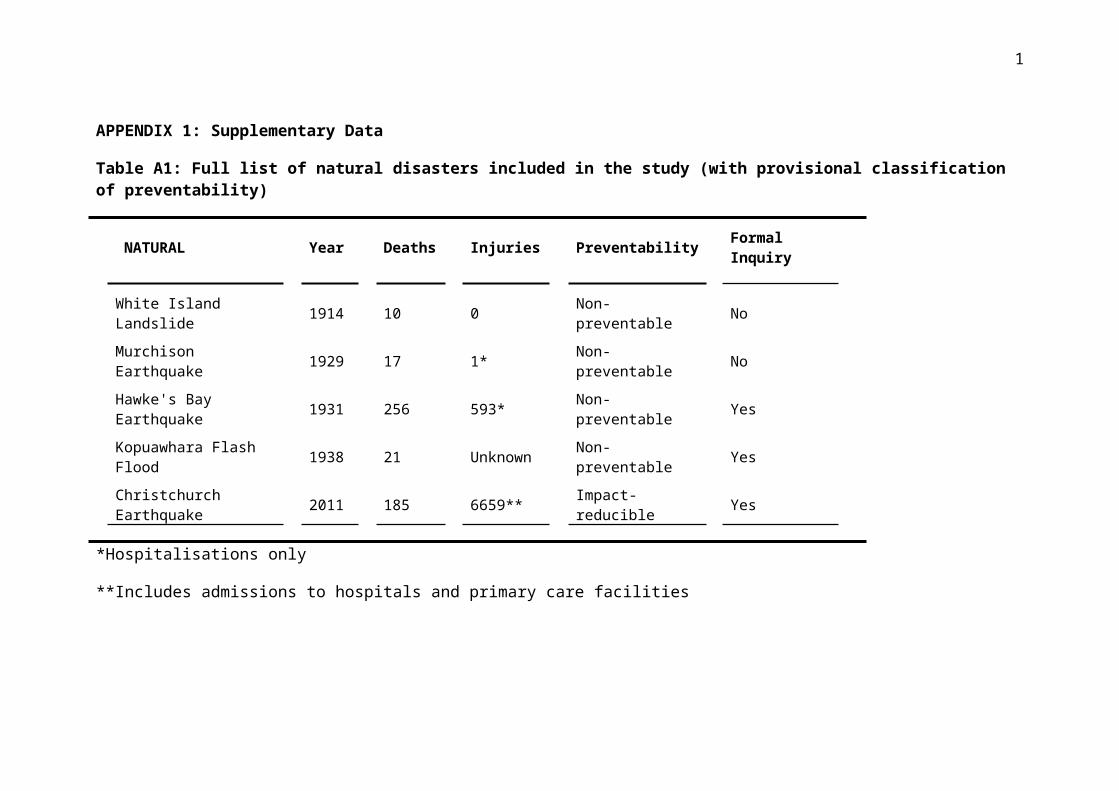
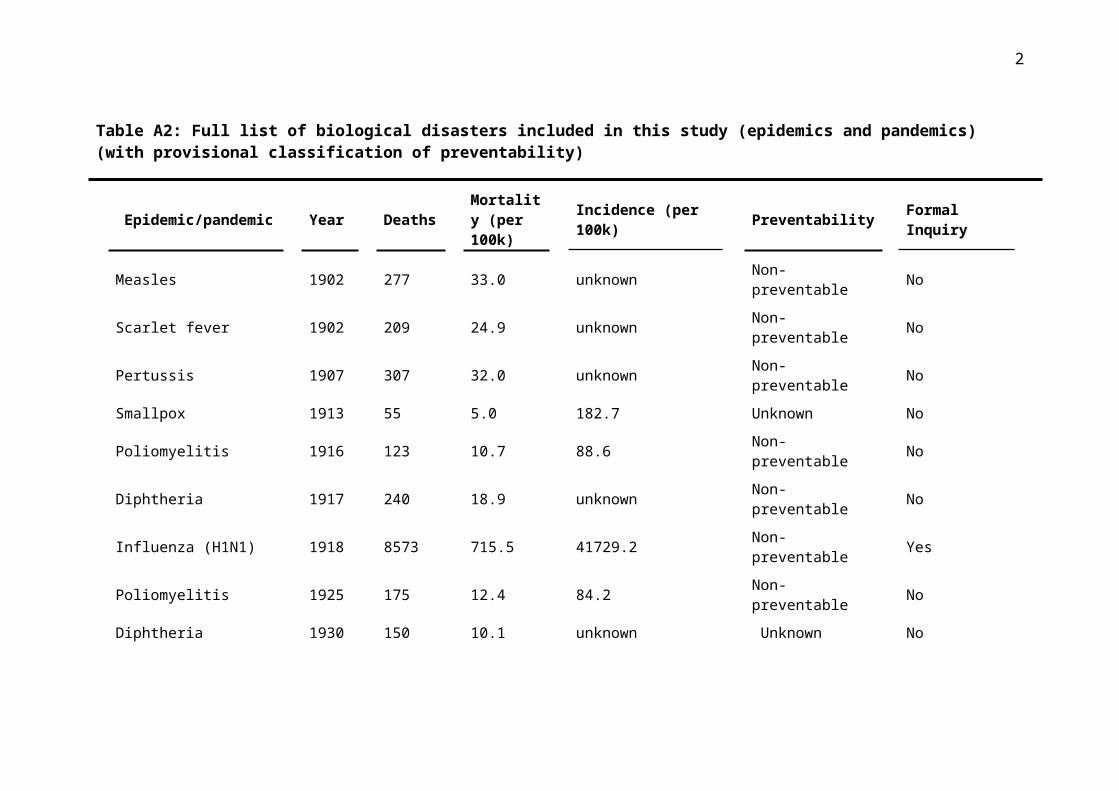
There were 49 mass casualty disasters in New Zealand between 1900 and 2015 that met the inclusion criteria for this study. Disasters were classified into natural (n=5), TII (n=29) or biological (n=15). These involved a total of 11,829 fatalities, and 8969 known injuries/survivors (biological not included), with 87% of the fatalities (N=10,913) due to epidemic disasters, 8% due to TII (N= 983), and 4% (N = 489) due to natural disasters. Details of specific disasters are shown in Appendix 1, Table A1. Figure 1 shows the distribution of disasters in New Zealand over time.
1
Figure 1: Timeline of the disasters meeting the inclusion criteria of this study, from 1900 to 2015
1
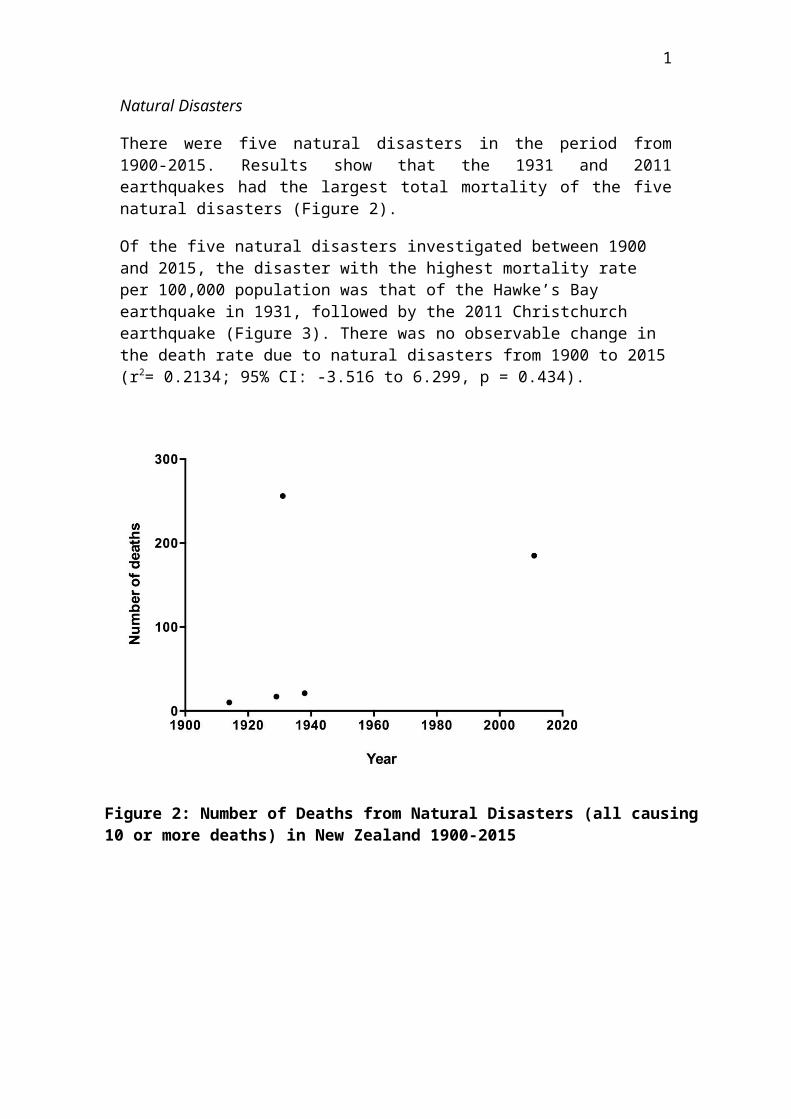
Natural Disasters
There were five natural disasters in the period from 1900-2015. Results show that the 1931 and 2011 earthquakes had the largest total mortality of the five natural disasters (Figure 2).
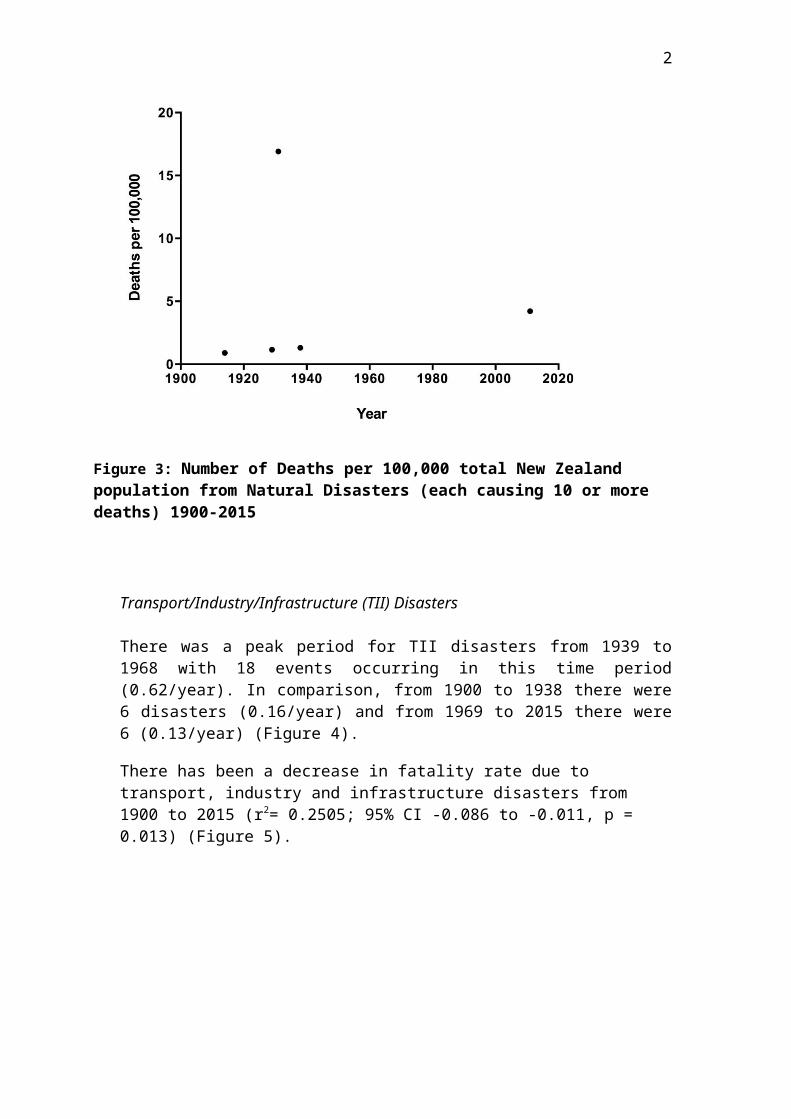
Of the five natural disasters investigated between 1900 and 2015, the disaster with the highest mortality rate per 100,000 population was that of the Hawke’s Bay earthquake in 1931, followed by the 2011 Christchurch earthquake (Figure 3). There was no observable change in the death rate due to natural disasters from 1900 to 2015 (r2= 0.2134; 95% CI: -3.516 to 6.299, p = 0.434).
Figure 2: Number of Deaths from Natural Disasters (all causing 10 or more deaths) in New Zealand 1900-2015
2
Transport/Industry/Infrastructure (TII) Disasters
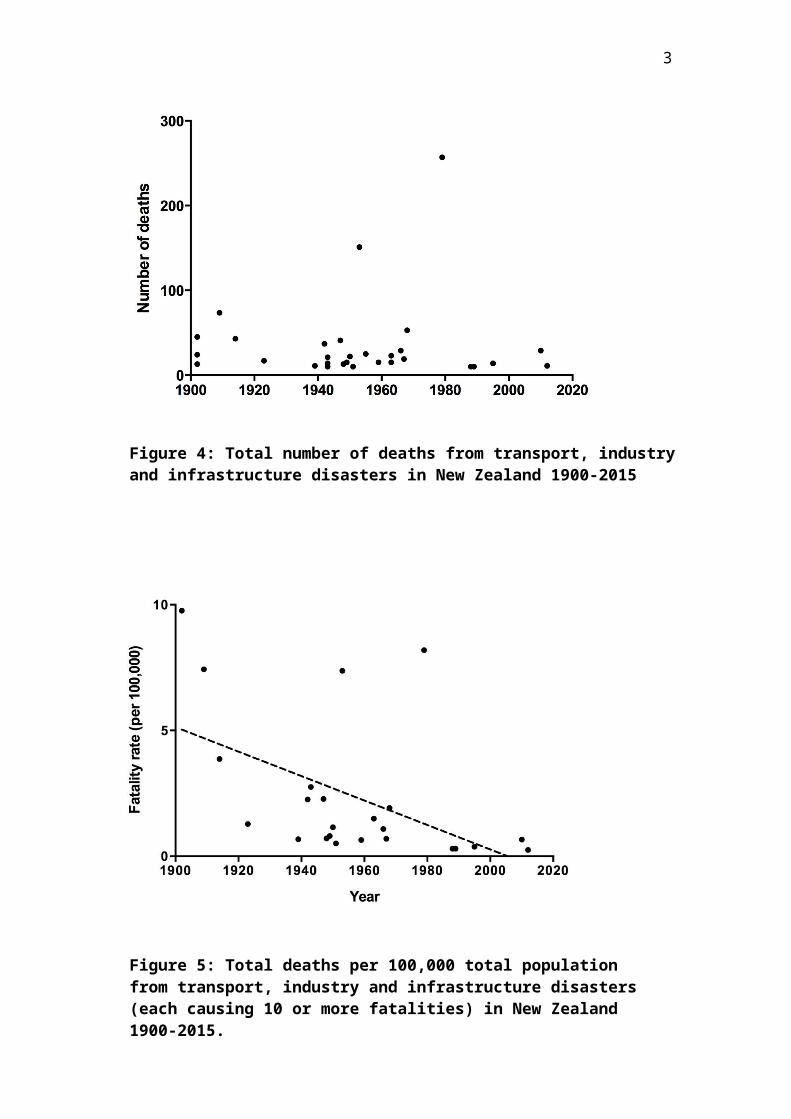
There was a peak period for TII disasters from 1939 to 1968 with 18 events occurring in this time period (0.62/year). In comparison, from 1900 to 1938 there were 6 disasters (0.16/year) and from 1969 to 2015 there were 6 (0.13/year) (Figure 4).
There has been a decrease in fatality rate due to transport, industry and infrastructure disasters from 1900 to 2015 (r2= 0.2505; 95% CI -0.086 to -0.011, p = 0.013) (Figure 5).
Figure 3: Number of Deaths per 100,000 total New Zealand population from Natural Disasters (each causing 10 or more deaths) 1900-2015
3
Figure 4: Total number of deaths from transport, industry and infrastructure disasters in New Zealand 1900-2015
Figure 5: Total deaths per 100,000 total population from transport, industry and infrastructure disasters (each causing 10 or more fatalities) in New Zealand 1900-2015.
4
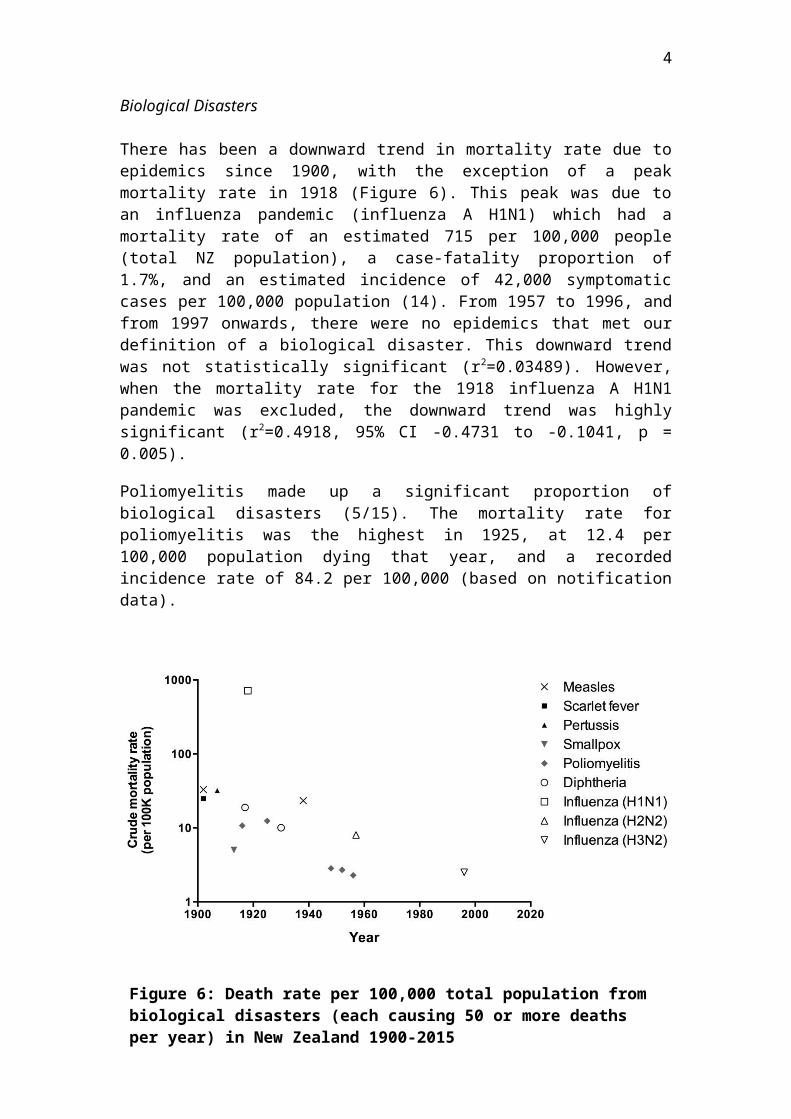
Biological Disasters
There has been a downward trend in mortality rate due to epidemics since 1900, with the exception of a peak mortality rate in 1918 (Figure 6). This peak was due to an influenza pandemic (influenza A H1N1) which had a mortality rate of an estimated 715 per 100,000 people (total NZ population), a case-fatality proportion of 1.7%, and an estimated incidence of 42,000 symptomatic cases per 100,000 population (14). From 1957 to 1996, and from 1997 onwards, there were no epidemics that met our definition of a biological disaster. This downward trend was not statistically significant (r2=0.03489). However, when the mortality rate for the 1918 influenza A H1N1 pandemic was excluded, the downward trend was highly significant (r2=0.4918, 95% CI -0.4731 to -0.1041, p = 0.005).
Poliomyelitis made up a significant proportion of biological disasters (5/15). The mortality rate for poliomyelitis was the highest in 1925, at 12.4 per 100,000 population dying that year, and a recorded incidence rate of 84.2 per 100,000 (based on notification data).
Figure 6: Death rate per 100,000 total population from biological disasters (each causing 50 or more deaths per year) in New Zealand 1900-2015
5
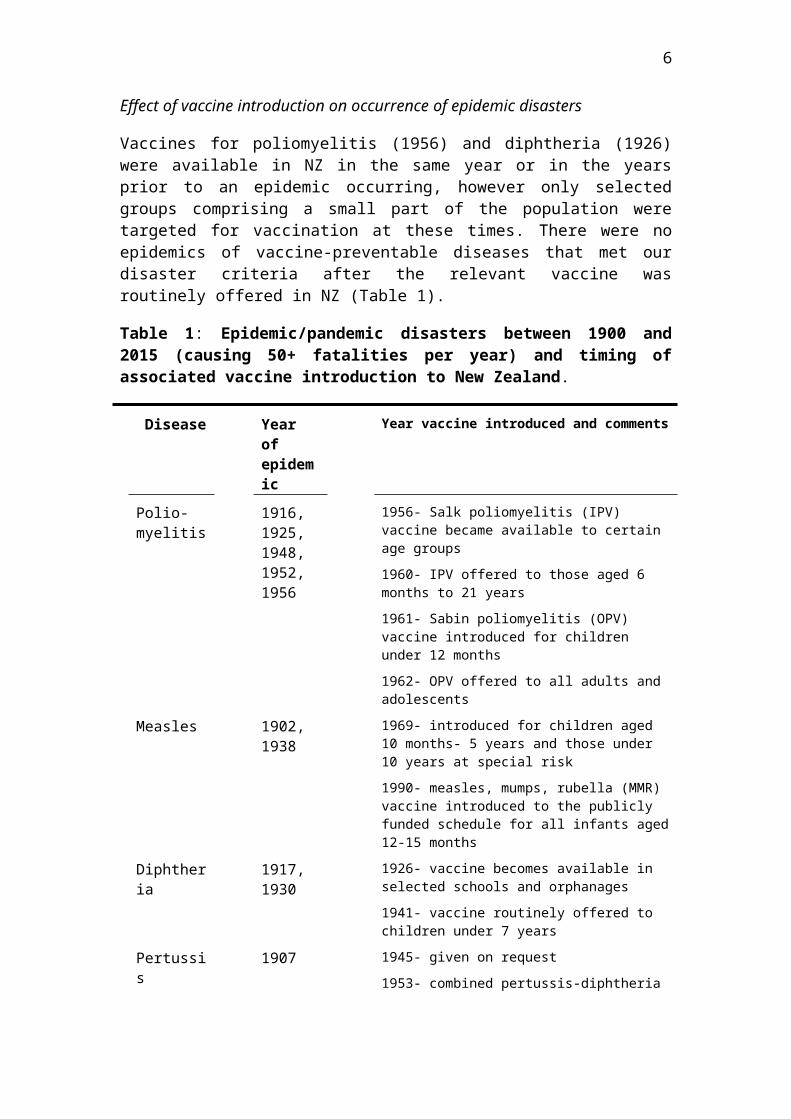
Effect of vaccine introduction on occurrence of epidemic disasters
Vaccines for poliomyelitis (1956) and diphtheria (1926) were available in NZ in the same year or in the years prior to an epidemic occurring, however only selected groups comprising a small part of the population were targeted for vaccination at these times. There were no epidemics of vaccine-preventable diseases that met our disaster criteria after the relevant vaccine was routinely offered in NZ (Table 1).
Table 1: Epidemic/pandemic disasters between 1900 and 2015 (causing 50+ fatalities per year) and timing of associated vaccine introduction to New Zealand.
Disease Year of epidemic
Year vaccine introduced and comments
Polio-myelitis
1916, 1925, 1948, 1952, 1956
1956- Salk poliomyelitis (IPV) vaccine became available to certain age groups
1960- IPV offered to those aged 6 months to 21 years
1961- Sabin poliomyelitis (OPV) vaccine introduced for children under 12 months
1962- OPV offered to all adults and adolescents
Measles 1902, 1938
1969- introduced for children aged 10 months- 5 years and those under 10 years at special risk
1990- measles, mumps, rubella (MMR) vaccine introduced to the publicly funded schedule for all infants aged 12-15 months
Diphtheria 1917, 1930
1926- vaccine becomes available in selected schools and orphanages
1941- vaccine routinely offered to children under 7 years
Pertussis 1907 1945- given on request
1953- combined pertussis-diphtheria vaccine available, usage is restricted
1958- diphtheria, tetanus, whole-cell pertussis (DTwP) becomes available, first schedule commences
Influenza 1918 (H1N1), 1957 (H2N2), 1996 (H3N2)
1997- introduced to the schedule for adults aged 65 and over
1999- introduced to Schedule for under 65s with certain medical conditions
2010- pregnant women eligible for funded vaccine
2013- under 5s with significant respiratory illness eligible for funded vaccine
Data obtained from Ministry of Health Immunisation Handbook 2014, Appendix 1: The history of immunisation in New Zealand (15).
6
Role of international events in these New Zealand based disastersOut of the 49 disasters, a total of six (12%) related to international events. That is the two influenza pandemics arose first in other countries, as did the influenza H3N2 epidemic, and also the 1913 smallpox epidemic (it was the result of smallpox infection on a ship to New Zealand from the United States (16)). There were also two disasters that related to US military activities in New Zealand during the Second World War (the Paekakariki maritime disaster and the Liberator air crash disaster).
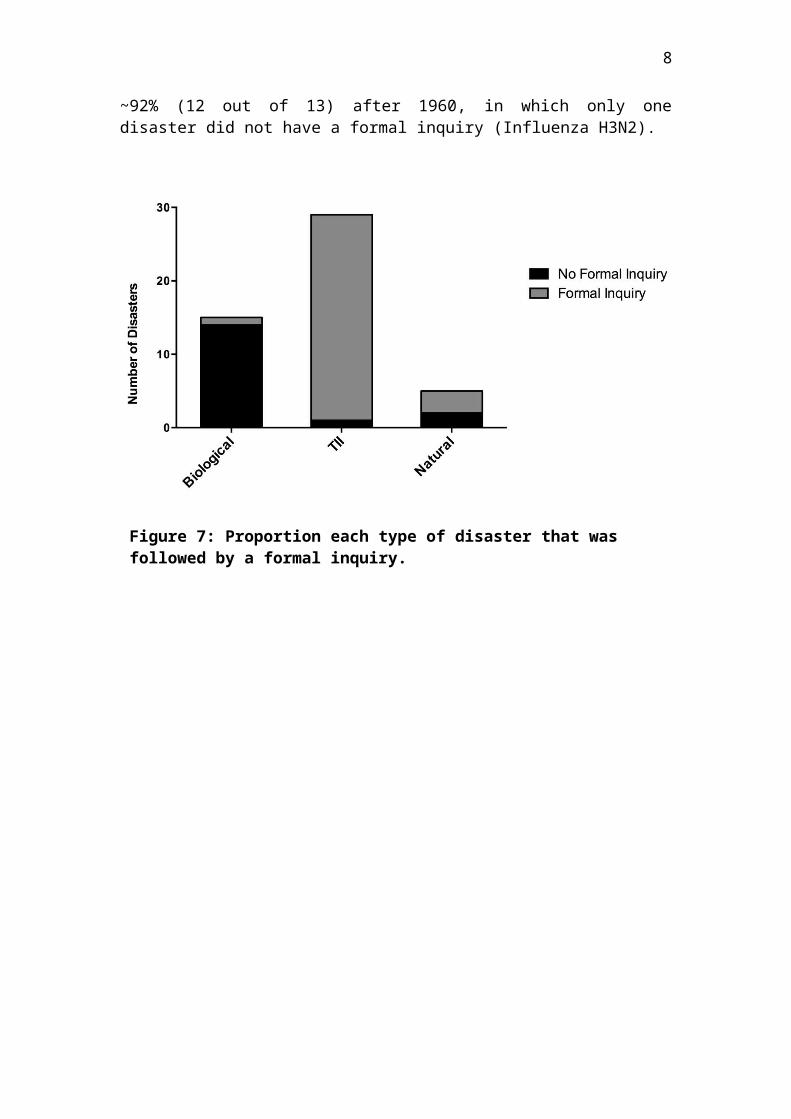
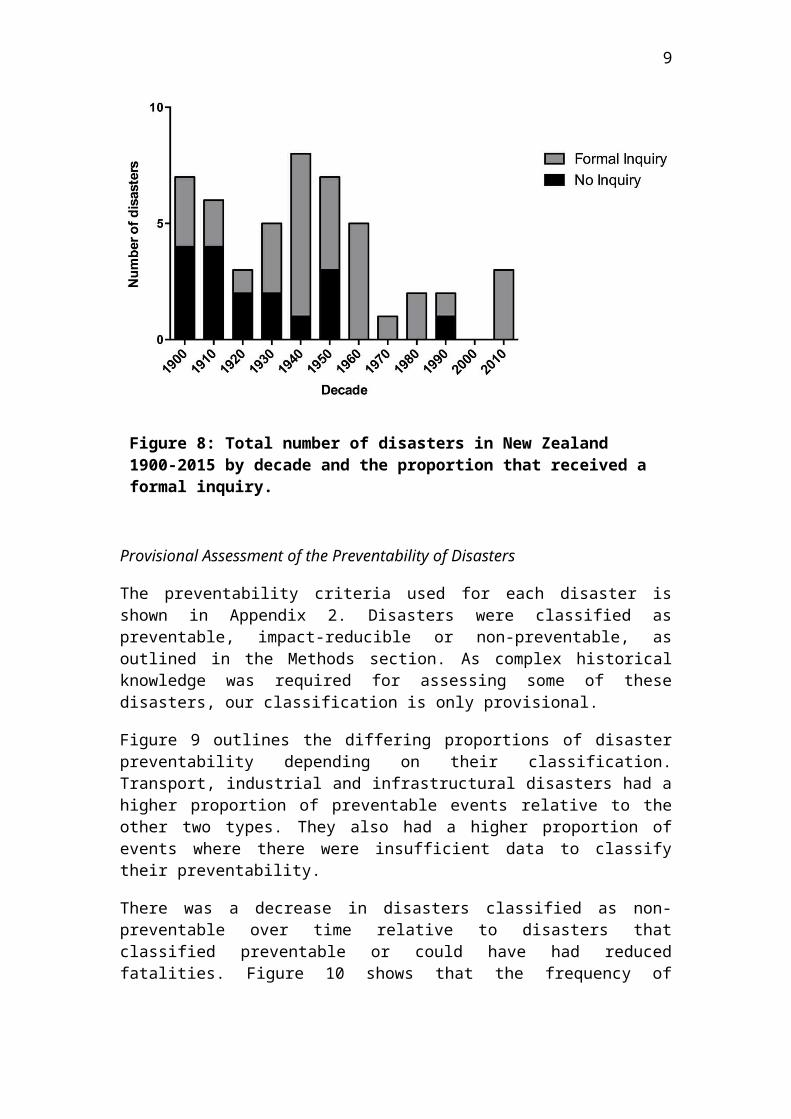
Formal Inquiries following a DisasterTII disasters had the greatest number of formal inquiries, 28 (97%) (Figure 7). Following this, natural disasters had a total of two formal inquiries (40%) and biological disasters had one (7%).
When examined by decade, the proportion of formal inquiries following disasters appears to have increased over time (Figure 8). Before 1960, ~53% of disasters received a formal inquiry (19 out of 36) increasing to ~92% (12 out of 13) after 1960, in which only one disaster did not have a formal inquiry (Influenza H3N2).
Figure 7: Proportion each type of disaster that was followed by a formal inquiry.

7
Provisional Assessment of the Preventability of Disasters
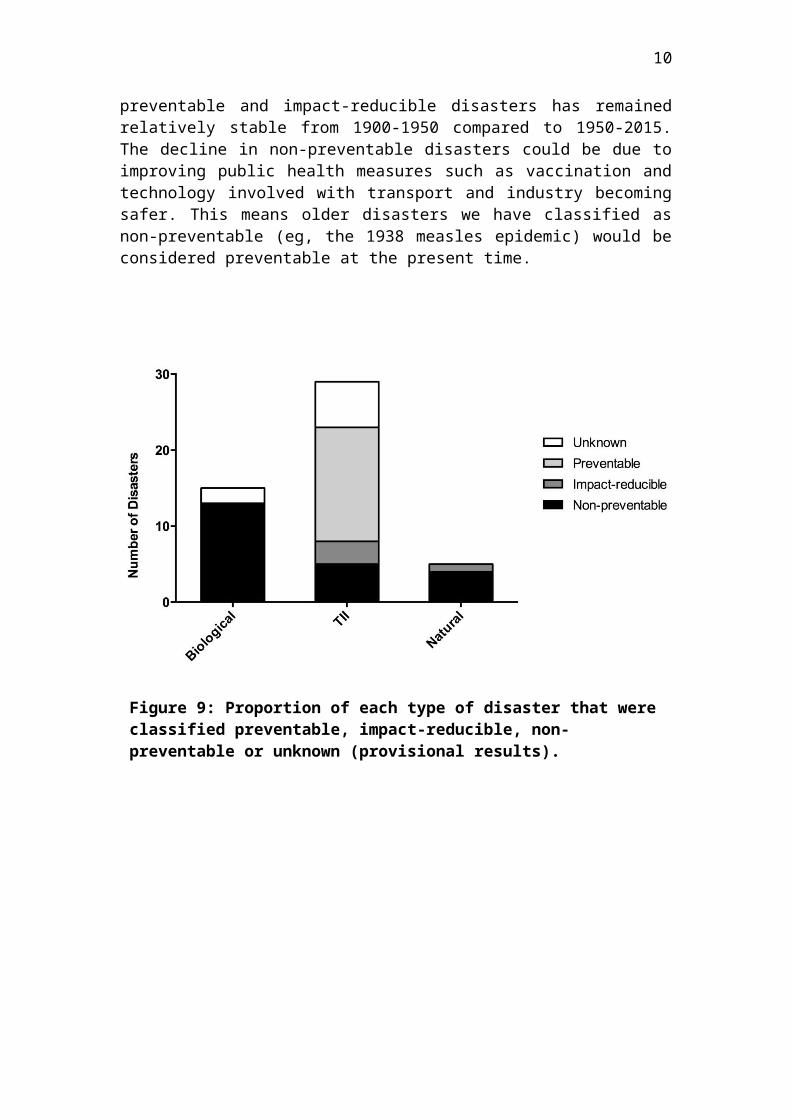
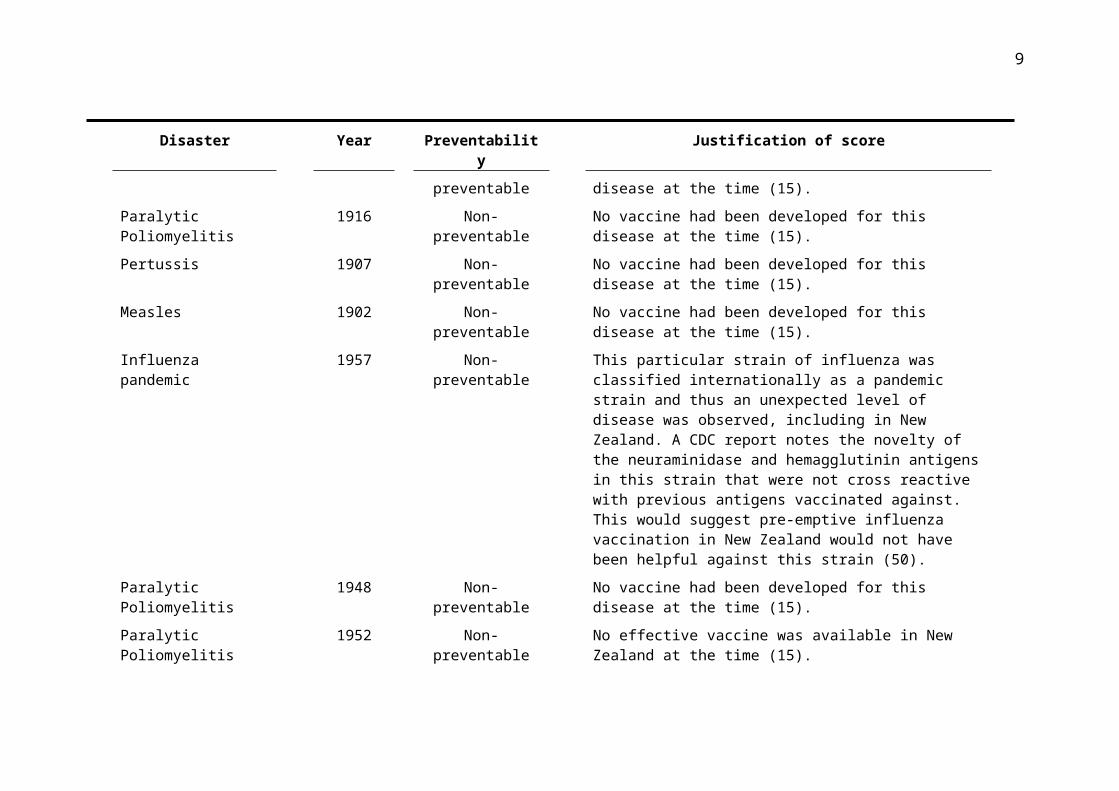
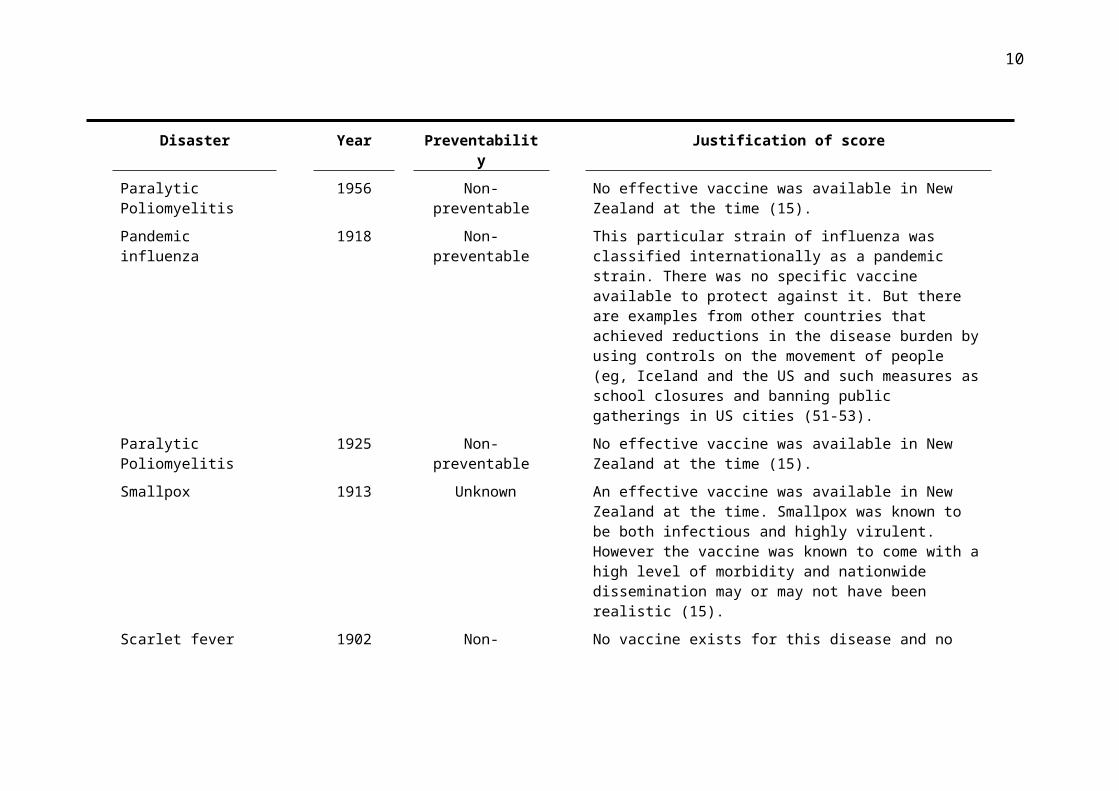
The preventability criteria used for each disaster is shown in Appendix 2. Disasters were classified as preventable, impact-reducible or non-preventable, as outlined in the Methods section. As complex historical knowledge was required for assessing some of these disasters, our classification is only provisional.
Figure 9 outlines the differing proportions of disaster preventability depending on their classification. Transport, industrial and infrastructural disasters had a higher proportion of preventable events relative to the other two types. They also had a higher proportion of events where there were insufficient data to classify their preventability.
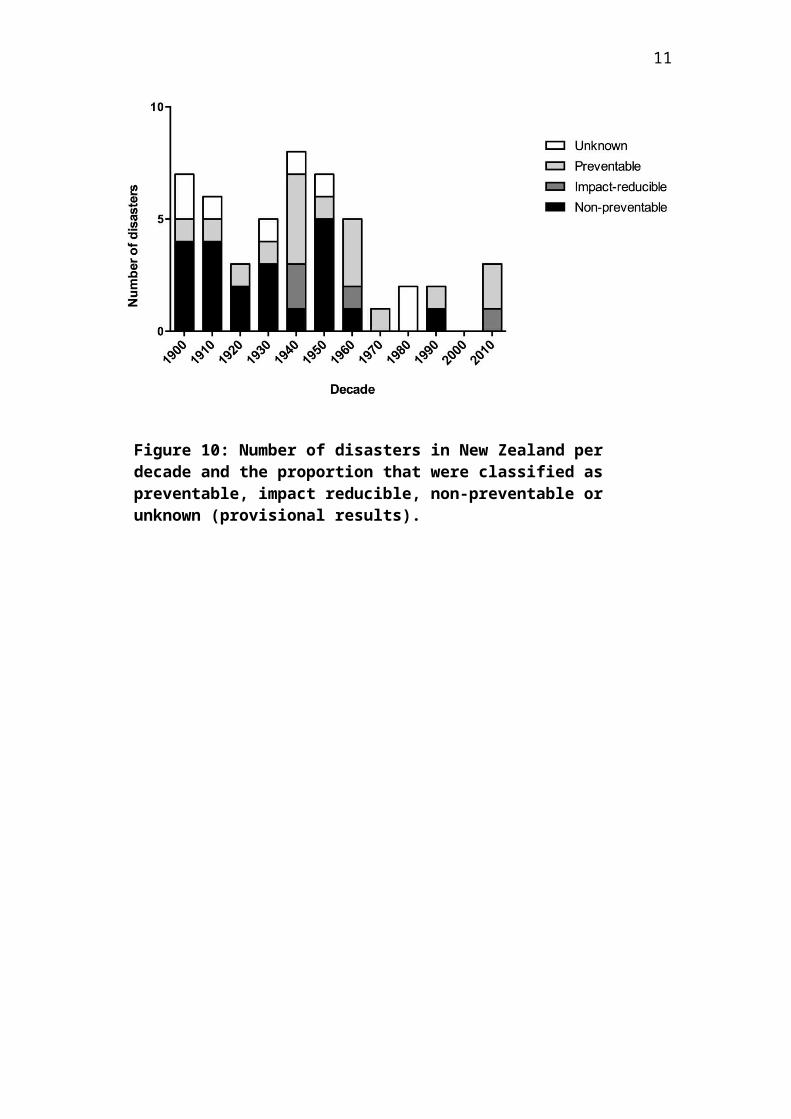
There was a decrease in disasters classified as non-preventable over time relative to disasters that classified preventable or could have had reduced fatalities. Figure 10 shows that the frequency of preventable and impact-reducible disasters has remained relatively stable from 1900-1950 compared to 1950-2015. The decline in non-preventable disasters could be due to improving public health measures such as vaccination and technology involved with transport and industry becoming safer. This means older disasters we have classified as non-preventable (eg, the 1938 measles epidemic) would be considered preventable at the present time.
Figure 8: Total number of disasters in New Zealand 1900-2015 by decade and the proportion that received a formal inquiry.
8
Figure 9: Proportion of each type of disaster that were classified preventable, impact-reducible, non-preventable or unknown (provisional results).
Figure 10: Number of disasters in New Zealand per decade and the proportion that were classified as preventable, impact reducible, non-preventable or unknown (provisional results).
9
Ethnicity dataEthnicity data were not available for the majority of epidemics, but we have described it for selected disasters since it is important in assessing the distribution of disaster impact. The measles epidemic of 1938 left 375 people dead, of which 212 were Māori (57%) and accounted for 10% of the total Māori deaths for that year (17). The mortality rate for Māori was 459 per 100,000, which was more than 20 times the death rate for non-Māori: 21 per 100,000. The death rate for Māori during the 1918 influenza epidemic was approximately seven times higher than the European death rate (43.3 per 1000 vs 5.8 per 1000 respectively) (13, 17).
Discussion
The disasters that have occurred in New Zealand in the last 115 years have had a significant impact on public health. This impact appears to be decreasing over time with reduced mortality and reduced disaster frequency.
Our provisional assessment suggests that there are a decreased number of preventable disasters (when adjusted for increase in population size) and an increase over time in the proportion of disasters that have had official inquiries. Together this suggests that New Zealand society’s ability to prevent and to manage disasters may be improving.
However, there is some evidence of disparities between the types of disasters and their effect on the population. These disparities reflect inequity patterns prevalent across public health issues in New Zealand which need to be addressed.
Disaster fatalities
The results showed that TII and biological disaster fatality rates declined from 1900-2015 whilst natural disaster fatality rates did not demonstrate a clear trend.
There appeared to be no overall trend in number of TII disaster fatalities, however when this was analysed to account for the total New Zealand population at the time, there appears to be a decreasing trend in fatality rate per 100,000. This is not surprising given the increased focus of safety in transport, industry and infrastructure throughout the 20th century which aimed to reduce fatalities in these areas (18, 19).
Ambiguity may have been due to a lead-lag pattern between new technology adoption and their safety development resulting in irregular patterns of TII fatalities. The air-transport industry is an example of this as whilst its popularity has continued to grow, air-transport fatalities peaked between 1940 and 1980 with disasters such as the Kaka air crash or the Mt Erebus air crash. However, since the 1980s there haven't been any notable air-traffic disasters in New Zealand, a likely reflection of the increased safety within the sector.
10
The mortality rate from biological disasters has been decreasing since 1900 (with the exception of the 1918 influenza pandemic). An important factor in preventing biological disasters has probably been the use of vaccines, but other factors may have been important (improved hygiene, improved housing, improved nutrition etc.). However the risk of a new pandemic with no available vaccine is still a concern so other approaches in management and planning have been established.
Earthquakes have accounted for three of the five natural disasters and resulted in many fatalities. There is a risk of further earthquakes of greater magnitude, organisations such as EQC are in place to ensure effective preparation and management. This is pertinent given the tectonic plates under New Zealand which impart a high risk of earthquakes.
Inequity of impact
Analysis of specific disasters found inequities in the impact on individuals. We did specific case reports for the Christchurch earthquake and some epidemics to assess ethnicity and socioeconomic data. These disasters have a widespread impact across a large population over an extended time period. Discrepancies in equity, even in countries like New Zealand, results in poorer areas suffering higher death rates and effects (20). Fothergill’s study (21) highlighted that those of lower socioeconomic status were worse off in both the pre- and post-disaster stages, and that this likely contributed to worse physical and psychological outcomes. Furthermore this inequity reflects a wide pattern in distribution of health in New Zealand and its root causes need to be addressed.
Epidemics had a larger impact on Māori than Europeans. The removal of land from Māori by colonialisation, likely contributed to increased mortality from infectious diseases as the colonial process resulted in serious disruption to the local economic base, food supply, and social networks of Māori communities, thus severely hampering how these communities coped with foreign infectious agents (22, 23). Furthermore, access to healthcare was likely a contributing factor, as Māori still were largely rurally located and generally mistrusting of Western medicine (17). Lastly, the housing of Māori in the early to mid-1900s tended to be poor, resulting in fertile ground for the spread of infectious disease (24).
In the case of natural disasters, the 2011 Canterbury earthquake is an example of a disaster that disproportionately affected a more deprived population. A large section of red zone, (an area deemed unliveable by the council) in Christchurch was in the Eastern suburbs, which included some of the most deprived suburbs in the city (25). The suburbs of Bexley, Avonside and Dallington were all greatly affected in the earthquake and are all classified as being in deciles 6 to 9 for area deprivation (1 being least deprived on the NZ Deprivation Index, 10 being the most deprived decile across multiple socioeconomic factors) (26). This demonstrates that populations most affected by a disaster are often the ones least able to recover. This phenomenon can be observed in international disasters and was evident in the aftermath of Hurricane Katrina in the USA (27, 28). The reasons for inequity of outcome are multifaceted and reflect the wider trend of inequity in all areas of public health. It highlights the
11
challenges of public health legislators, field workers and disaster management plans, which need to reach the populations who need protection and support the most.
Wider impact
Our study focused on the number of fatalities as the defining feature of a disaster. However the definition of a disaster encompasses a broad scope of impact. This was evident in some of the events which met our criteria and are further explored here.
Economic impacts
While the economic effects of industrial and biological disasters are difficult to discern, substantial data exists on the economic impact of natural disasters in New Zealand. The economic effects of the 2010/2011 Christchurch earthquakes are well documented. According to the 2011 Budget, the New Zealand Treasury estimated the combined financial cost of the direct loss at around NZ$15 billion (29). However, ongoing damages to employment, housing investment and sales, repair and rebuilding cost, as well as small business, population and tourism loss are under-represented in these estimates (29, 30). More recent estimates of the economic costs indicate this value to be around NZ$30 billion (31). The economic effect is important to understand because the projected costs of a disaster can justify the costs needed to prevent a disaster or reduce its impact.
Displacement after disasters
Physical destruction often necessitates relocation following a disaster. This can lead to short-term and long-term hazards. Damage to infrastructure (roads, sewage, water, electricity and communication) is the most immediate cause for human displacement. In the long-term, loss of income sources can be a reason for relocation, for example following the Christchurch earthquakes about 10% of businesses relocated permanently and 15% temporarily (32). Displacement has a long-term impact as it hinders the communities’ ability to rebuild and makes long-term health issues difficult to follow-up. Furthermore, studies have documented the psychological health effects of forced displacement following disasters (33, 34). There is an association between poorer outcomes and personal circumstances and prior mental health problems, particularly in the paediatric population, that contributes to incidence of major depression; posttraumatic stress disorder (PTSD); other anxiety disorders; and nicotine dependence (34).
Wider Impacts on Health and Well-being
While we focused on the number of fatalities, disaster events can have short and long-term effects on health and mental wellbeing. There are many ways that disasters can impact health, and this needs to be taken into consideration for management following a disaster, both in focus and budget. Importantly, the mental health of a population and quality of life can be greatly affected following a disaster. In particular, PTSD, anxiety and depression rates rise following a disaster event, and those affected report feeling more forgetful, preoccupied, irritable and sleep deprived than they would normally (35). This is important in considering recovery policies with a focus on reducing stigma of mental illness and encouraging people to seek help.
12
Disasters can also have delayed effects on health. For example, there was an increase in the number of heart attacks in the weeks following the 2010 Christchurch earthquake (36). There were unknown effects following exposure to airborne particulate matter from building destruction, and these may emerge in the long-term. Structural damage may lead to damp and cold homes, further impacting health and well-being (37). This effect can be exacerbated if displacement leads to overcrowding or accommodation in poor quality housing. Disasters can put strain on healthcare systems, for example overcrowding of hospitals, this can have an effect on other patients whose treatment has to be deferred or compromised.
Inquiries and policy changes
The proportion of disaster events receiving a formal inquiry has increased over time. Inquiries are important in evaluating the cause of a disaster and often lead to policy changes that aim to mitigate or prevent further disasters. Policy changes can also be made to plan for future disasters.
All but one of the TII disasters was followed by an inquiry, possibly because they were singular events, often with a discrete cause. In addition, these types of disasters are largely preventable and subsequent policy changes can contribute to new practices or laws that reduce risk. For example, the findings from the Pike River Mine inquiry led to specific amendments to the mining laws in addition to development of a national work safety programme applicable to all workplaces (38).
The Royal Commission reports and independent incident reviews over the last 100 years have provided recommendations for policy changes that would appear to be beneficial in preventing and reducing the effects of a disaster situation. It is unclear to what extent these inquiries have reduced the rate of disasters or their impact, but there is an association with overall reduction in disaster fatality and reduction in disasters classified as preventable. Despite many disasters leading to specific policy change, it is evident that there still needs to be a focus in ensuring that these policy changes are upheld. The collapse of buildings during the 2011 Canterbury Earthquake is a pertinent example of the devastating impact of non-compliance to building regulations (39). Given the earthquake risk of other major cities in New Zealand, the Canterbury Earthquake Inquiry holds particular importance. New Zealand’s response has seen a significant increase in earthquake proofing buildings in major cities since 2011.
The Health Act (1956) and the Epidemic Preparedness Act (2006) are policies in place to prepare for biological disasters, and have led to the development of the “National Health Emergency Plan: Infectious Diseases” and the “New Zealand Influenza Pandemic Plan” which provide frameworks for actions to take during a pandemic. Strategies to improve vaccine coverage are also crucial in reducing vaccine preventable mortality. These policies may be effective given their temporal association to the decrease in the frequency of biological disasters. Indeed, planning and management surrounding the influenza HINI pandemic in 2009 may have helped to control the spread and minimise mortality to only 49 deaths (40).
The New Zealand Government also creates policies which aim to improve the education of the public and their ability to respond to a disaster. The Ministry of Civil Defence runs a National Public Education Programme to prepare individuals and
13
communities, to increase awareness of the potential hazards around them and how to cope in the event of a disaster (41). The levels of preparedness to an emergency among New Zealand residents was higher than it was prior to the introduction of media campaigns under this programme (42). However, in recent years these levels have been declining. Further emphasis on individual readiness may be an area of future policy making.
Response efforts
The speed and design of the disaster response effort is important in limiting the number of deaths and injuries suffered in the immediate period (3, 4). Every disaster that occurs also lends important information towards improving preparedness and response protocols in order to prevent significant illness, injury, disability, death (3).
The response effort after the 2011 Canterbury earthquake appeared to be effective and its approach could be implemented in other disaster management plans. The community response was important as local churches, police and marae assisted individuals who were most at need such as the elderly and young families. An early national emergency declaration allowed maximum coordination between local and central emergency response groups as well as international groups. However, there is a need for a clearly defined role for each group, which would facilitate targeted training to these groups to effectively prepare them for future disasters (43). Other responses have been focused on the reduction of trauma related injury and death through such efforts as the immediate mobilisation of medical staff and equipment after the Napier Earthquake (44). Similar successful efforts have been seen following many 21st century disasters such as the Pike River Mine explosion where the use of existing emergency protocols, modern technologies and the coordinated efforts of local community, government and private agencies may have contributed to limiting deaths and injuries.
Response efforts have not always been successful. For example, in the 1939 Glen Afton mine disaster the majority of fatalities were among the rescue party. It is important to balance a rapid response effort with safety for first responders. In the case of the Ballantynes fire, misinformation and time delay contributed to an inadequate response effort.
Strengths and limitations of this study
A strength of this study is that it is the first one to look systematically at New Zealand disasters over a long period. But there are several notable limitations to this study including the diverse definitions of what constitutes a disaster. Definitions in current literature are eclectic and our time period studied was arbitrary because of the wide range of impacts, from fatalities and injuries to economic loss. Furthermore, the range of what constitutes a disaster depends on the community’s ability to cope and the baseline level of death and disease. Our study focused on mass fatality as an objective measure of a disaster. An unavoidable limitation was that no data were available for fatalities in the subsequent weeks, months or even years after the disaster. Thus we could not comment on longer term fatalities or other longer term health problems.

14
For some disasters there may still be residual uncertainty over the exact number of fatalities (for example, the Hawke’s Bay earthquake mortality may have been higher and there may have been some deaths among Māori in the 1918 influenza pandemic that may not have been counted) (45). Also in some cases we could not precisely identify the number of survivors (as per Table A3 in the Appendix).
Biological disasters were difficult to define, and we chose ‘unexpected’ as a key part of the definition; this typically excluded seasonal influenza (unless particularly severe), which has significant mortality every year and can overwhelm some hospitals. There was also difficulty in terms of classifying events, since some transport disasters also had natural disaster components. For example the volcanic part of the Tangiwai disaster and the landslip component of the 1923 railway disaster (both of which were primarily classified as TII disasters).
A further limitation of this study was the use of the preventability classification. We did not find a suitable scale of classifying preventability in the literature that encompassed the different types of disasters. So we had to create our own to assess the degree of preventability. This used a combination of information regarding the settings in time and place, policies at the time and available resources. We tried to reduce subjective error by using a panel of three of the researchers to assess preventability. Nevertheless, the complex nature of the issues makes our results fairly provisional.
The information was sometimes limited because the research analysed historical reports and documents, in which epidemiological data can be scarce. Much of the disaster documentation failed to include important public health information, which introduced limitations into the analysis, especially regarding health inequities.
Previous studies have not looked at such a broad range of disasters over an extended time period. Furthermore it is largely an epidemiological analysis, which contrasts with current information often in the form of inquiries or historical review. This is important in highlighting disasters as an area of public health concern, which has implications for future planning and prevention.
Implications for future research
This study highlights the importance of disasters as a public health concern and initiates a shift in focus to epidemiological features of disasters. The ongoing health effects, including mental health effects, for each type of disaster require further investigation, to improve specific recovery programmes and assess needs of vulnerable communities in case of future emergency. The ethnic disparities that arise following disasters and their causes needs to be further explored and addressed.
Further prospects for research includes comparison analyses of level of preparedness and how this compares to the preventability and severity of a disaster. There could be further development of a standard preventability tool, as no suitable scale was found in the literature. This could be used in the investigations of future disasters as a way to assess response efforts and to facilitate future epidemiological research. There is also a need for more research into current enforcement of policy changes that occur after an inquiry is made.
15
Conclusions
Disasters are an important public health concern because of the large number of fatalities and other impacts that can overwhelm a society. It is important that we review past disasters, in order to create policies and practices which can prevent future disasters or reduce their impact. Our study gives a broad view over a wide array of disasters that occurred from 1900-2015 from an epidemiological viewpoint. Overall the impact of disasters in terms of the relative mortality burden appears to be decreasing over time and New Zealand society’s response increasing (official inquiries, policy change). However there continues to be areas of concern, most pertinently is that some policies that are not adequately enforced and the unequal effect of disasters, which affect Māori and people of low SES more than other groups.
Acknowledgements
We would like to thank Professor Nick Wilson and Professor George Thomson for their help as supervisors of the project; and Dr Osman Mansoor of Regional Public Health Lower Hutt. This project had no external funding.
Competing interests
The authors declare that there are no conflicts of interest regarding the publication of this report.
1
APPENDIX 1: Supplementary Data
Table A1: Full list of natural disasters included in the study (with provisional classification of preventability)
NATURAL Year Deaths Injuries Preventability Formal Inquiry
White Island Landslide 1914 10 0 Non-preventable No
Murchison Earthquake 1929 17 1* Non-preventable No
Hawke's Bay Earthquake 1931 256 593* Non-preventable Yes
Kopuawhara Flash Flood 1938 21 Unknown Non-preventable Yes
Christchurch Earthquake 2011 185 6659** Impact-reducible Yes
*Hospitalisations only
**Includes admissions to hospitals and primary care facilities
2
Table A2: Full list of biological disasters included in this study (epidemics and pandemics) (with provisional classification of preventability)
Epidemic/pandemic Year Deaths Mortality (per 100k) Incidence (per 100k) Preventability Formal Inquiry
Measles 1902 277 33.0 unknown Non-preventable No
Scarlet fever 1902 209 24.9 unknown Non-preventable No
Pertussis 1907 307 32.0 unknown Non-preventable No
Smallpox 1913 55 5.0 182.7 Unknown No
Poliomyelitis 1916 123 10.7 88.6 Non-preventable No
Diphtheria 1917 240 18.9 unknown Non-preventable No
Influenza (H1N1) 1918 8573 715.5 41729.2 Non-preventable Yes
Poliomyelitis 1925 175 12.4 84.2 Non-preventable No
Diphtheria 1930 150 10.1 unknown Unknown No
Measles 1938 375 23.3 181.0 Non-preventable No
Poliomyelitis 1948 52 2.8 52.5 Non-preventable No
Poliomyelitis 1952 54 2.7 44.8 Non-preventable No
Poliomyelitis 1956 50 2.3 41.1 Non-preventable No
Influenza (H2N2) 1957 179 8.0 unknown Non-preventable No
Influenza (H3N2) 1996 94 2.5 unknown Non-preventable No
3
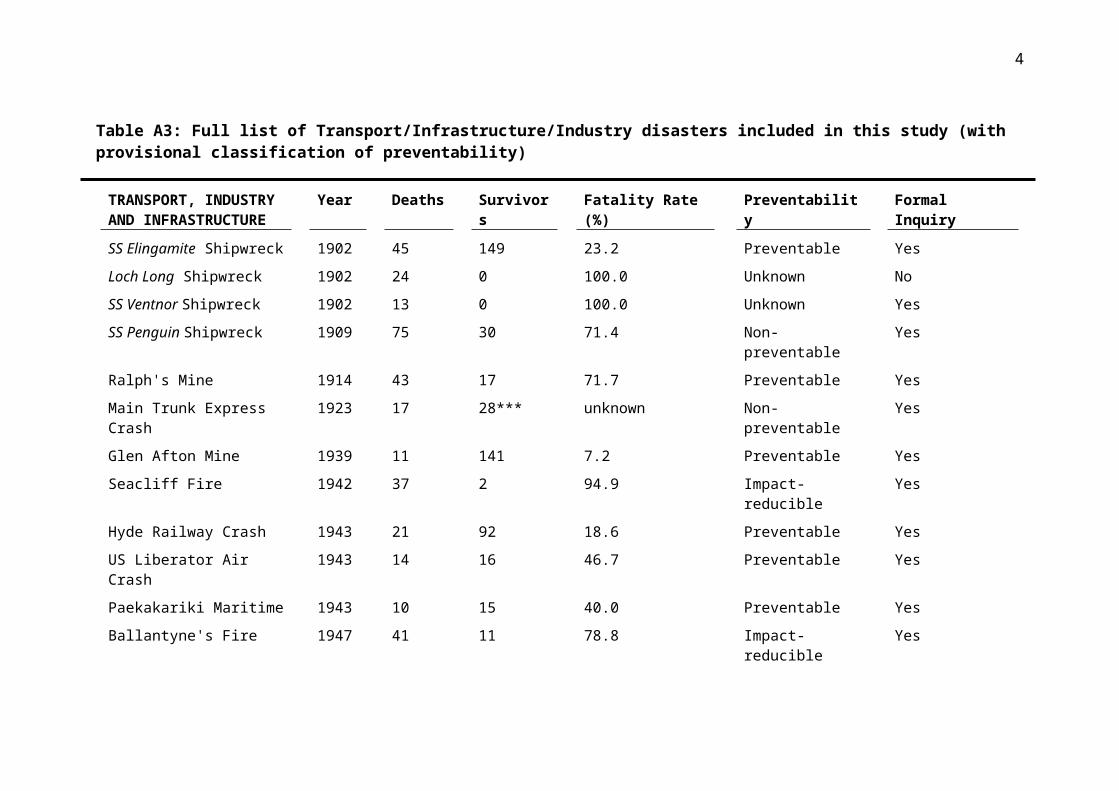
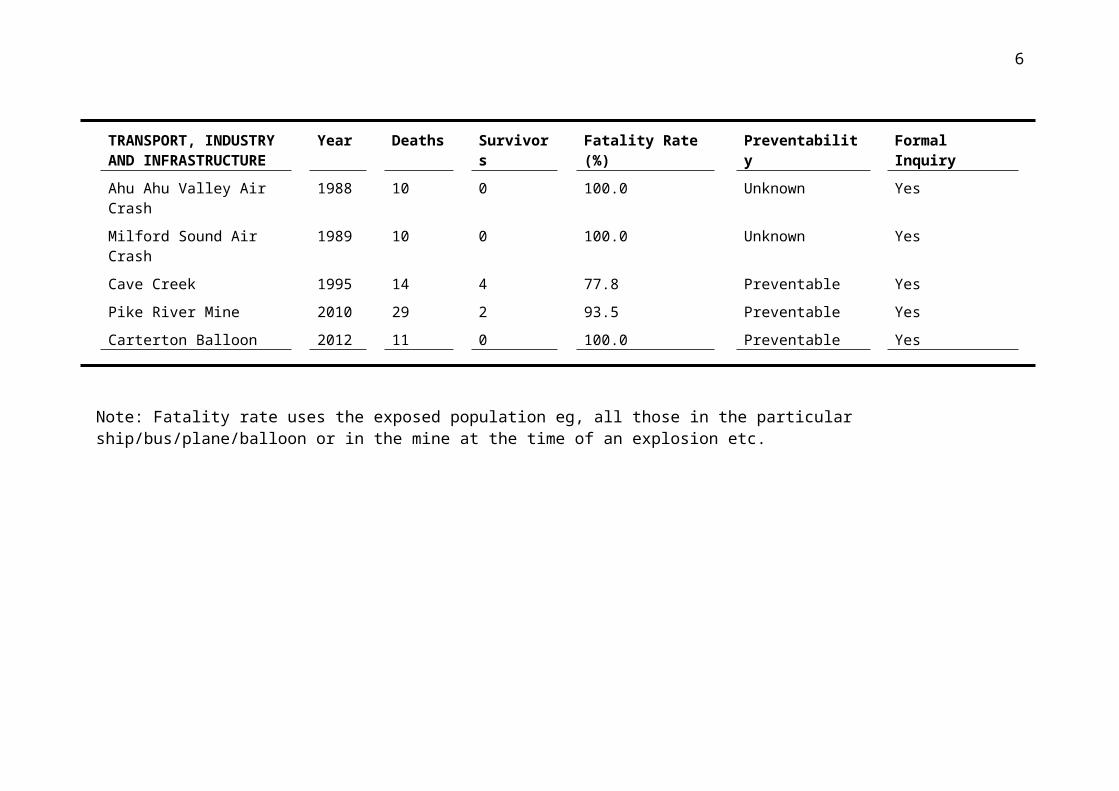
Table A3: Full list of Transport/Infrastructure/Industry disasters included in this study (with provisional classification of preventability)
TRANSPORT, INDUSTRY AND INFRASTRUCTURE
Year Deaths Survivors Fatality Rate (%) Preventability Formal Inquiry
SS Elingamite Shipwreck 1902 45 149 23.2 Preventable Yes
Loch Long Shipwreck 1902 24 0 100.0 Unknown No
SS Ventnor Shipwreck 1902 13 0 100.0 Unknown Yes
SS Penguin Shipwreck 1909 75 30 71.4 Non-preventable Yes
Ralph's Mine 1914 43 17 71.7 Preventable Yes
Main Trunk Express Crash 1923 17 28*** unknown Non-preventable Yes
Glen Afton Mine 1939 11 141 7.2 Preventable Yes
Seacliff Fire 1942 37 2 94.9 Impact-reducible Yes
Hyde Railway Crash 1943 21 92 18.6 Preventable Yes
US Liberator Air Crash 1943 14 16 46.7 Preventable Yes
Paekakariki Maritime 1943 10 15 40.0 Preventable Yes
Ballantyne's Fire 1947 41 11 78.8 Impact-reducible Yes
Kaka Crash 1948 13 0 100.0 Preventable Yes
Kereru Crash 1949 15 0 100.0 Unknown Yes
Ranui Shipwreck 1950 22 1 95.7 Non-preventable Yes
Canterbury Yacht Race 1951 10 unknown unknown Preventable Yes
Tangiwai Rail 1953 151 285 34.6 Non-preventable Yes
Holmglen Shipwreck 1959 15 0 100.0 Unknown Yes
4
TRANSPORT, INDUSTRY AND INFRASTRUCTURE
Year Deaths Survivors Fatality Rate (%) Preventability Formal Inquiry
Kaimai Air Crash 1963 23 0 100.0 Non-preventable Yes
Brynderwyn Hills Bus Crash 1963 15 21 41.7 Preventable Yes
MV Kaitawa Shipwreck 1966 29 0 100.0 Preventable Yes
Strongman Mine Explosion 1967 19 221 7.9 Preventable Yes
TEV Wahine Shipwreck 1968 53 681 7.2 Impact-reducible Yes
Mt Erebus Crash 1979 257 0 100.0 Preventable Yes
Ahu Ahu Valley Air Crash 1988 10 0 100.0 Unknown Yes
Milford Sound Air Crash 1989 10 0 100.0 Unknown Yes
Cave Creek 1995 14 4 77.8 Preventable Yes
Pike River Mine 2010 29 2 93.5 Preventable Yes
Carterton Balloon 2012 11 0 100.0 Preventable Yes
Note: Fatality rate uses the exposed population eg, all those in the particular ship/bus/plane/balloon or in the mine at the time of an explosion etc.
5
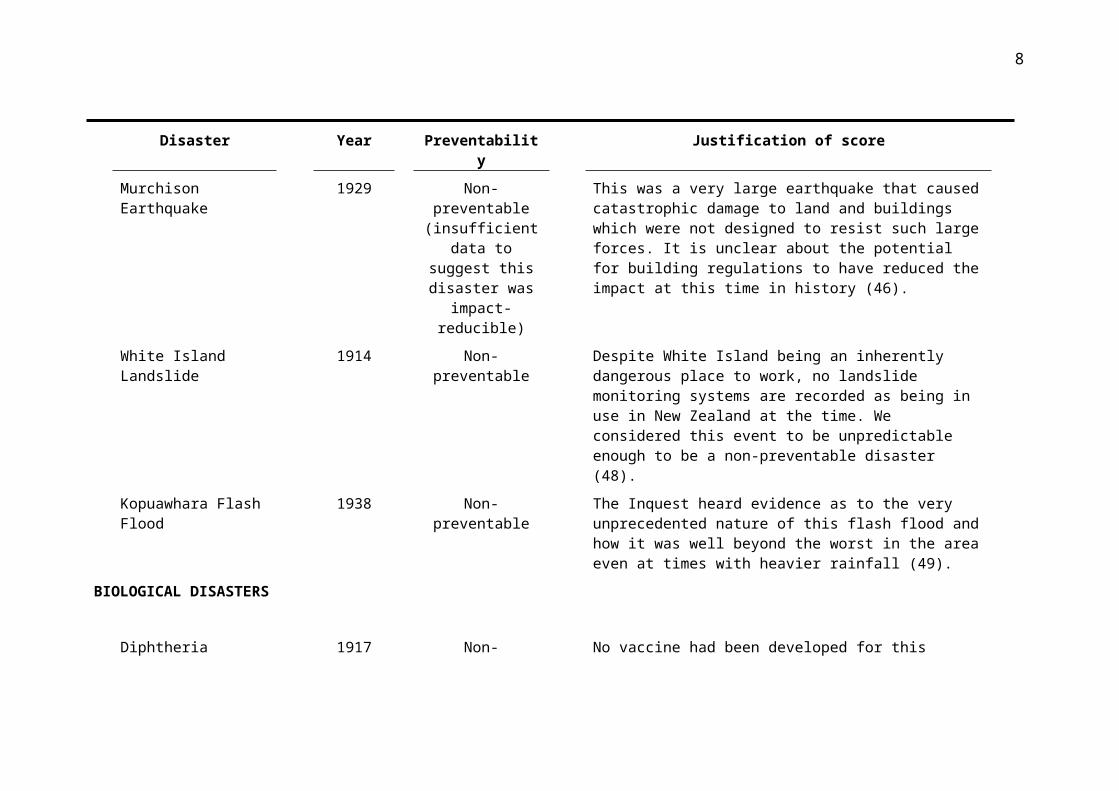
Table A4: Provisional disaster preventability classifications – additional details
Disaster Year Preventability Justification of score
NATURAL DISASTERS
Hawke's Bay Earthquake 1931 Non-preventable
(insufficient data to suggest this disaster
was impact-reducible)
This was a very large earthquake that struck a large urban population. No earthquake resistant building regulations existed at the time. Despite alterations made to building codes following this earthquake, we considered the predictability of the scale of this event to be low and the plausibility of having had building performance regulations before the event to be uncertain (46).
Christchurch Earthquake 2011 Non-preventable but impact-reducible
This was a very large earthquake that struck a large urban population. Building regulations for earthquake resistance did exist at the time. However, the CTV building in central Christchurch for example was found to have a design that should not have been approved as safe by engineers according to the Canterbury Earthquakes Royal Commission (47).
Murchison Earthquake 1929 Non-preventable (insufficient data to suggest this disaster
was impact-reducible)
This was a very large earthquake that caused catastrophic damage to land and buildings which were not designed to resist such large forces. It is unclear about the potential for building regulations to have reduced the impact at this time in history (46).
White Island Landslide 1914 Non-preventable Despite White Island being an inherently dangerous place to work, no landslide monitoring systems are recorded as being in use in New Zealand at the time. We considered this event to be unpredictable enough to be a non-preventable disaster (48).
Kopuawhara Flash Flood 1938 Non-preventable The Inquest heard evidence as to the very unprecedented nature of this flash flood and how it was well beyond the worst in the area
6
Disaster Year Preventability Justification of score
even at times with heavier rainfall (49).
BIOLOGICAL DISASTERS
Diphtheria 1917 Non-preventable No vaccine had been developed for this disease at the time (15).
Paralytic Poliomyelitis 1916 Non-preventable No vaccine had been developed for this disease at the time (15).
Pertussis 1907 Non-preventable No vaccine had been developed for this disease at the time (15).
Measles 1902 Non-preventable No vaccine had been developed for this disease at the time (15).
Influenza pandemic 1957 Non-preventable This particular strain of influenza was classified internationally as a pandemic strain and thus an unexpected level of disease was observed, including in New Zealand. A CDC report notes the novelty of the neuraminidase and hemagglutinin antigens in this strain that were not cross reactive with previous antigens vaccinated against. This would suggest pre-emptive influenza vaccination in New Zealand would not have been helpful against this strain (50).
Paralytic Poliomyelitis 1948 Non-preventable No vaccine had been developed for this disease at the time (15).
Paralytic Poliomyelitis 1952 Non-preventable No effective vaccine was available in New Zealand at the time (15).
Paralytic Poliomyelitis 1956 Non-preventable No effective vaccine was available in New Zealand at the time (15).
Pandemic influenza 1918 Non-preventable This particular strain of influenza was classified internationally as a pandemic strain. There was no specific vaccine available to protect against it. But there are examples from other countries that achieved reductions in the disease burden by using controls on the movement of people (eg, Iceland and the US and such measures as
7
Disaster Year Preventability Justification of score
school closures and banning public gatherings in US cities (51-53).
Paralytic Poliomyelitis 1925 Non-preventable No effective vaccine was available in New Zealand at the time (15).
Smallpox 1913 Unknown An effective vaccine was available in New Zealand at the time. Smallpox was known to be both infectious and highly virulent. However the vaccine was known to come with a high level of morbidity and nationwide dissemination may or may not have been realistic (15).
Scarlet fever 1902 Non-preventable No vaccine exists for this disease and no antibiotics to treat it existed at the time (15).
Influenza (H3N2) 1996 Non-preventable The CDC regarded the activity of this influenza strain to be at epidemic level in New Zealand. The CDC regards an epidemic to be a level of disease above what is expected. This event therefore meets our inclusion criteria for a biological disaster (54).
Measles 1938 Non-preventable No vaccine had been developed for this disease at the time (15).
Diphtheria 1930 Unknown A diphtheria vaccine was introduced in New Zealand in 1926. Effective dissemination of the vaccine and its efficacy was questioned by the Review Panel and this made it difficult to classify this disaster’s preventability (15).
TRANSPORT, INDUSTRIAL, INFRASTRUCTURAL DISASTERS
Mt Erebus Crash 1979 Preventable A Royal Commission of Inquiry found that the flight plan had been changed without informing the pilots (55).
SS Penguin Shipwreck 1909 Non-preventable Sudden bad weather (at a time when weather forecasting was
8
Disaster Year Preventability Justification of score
limited) and an exceptionally strong flood tide probably made this disaster hard to prevent. Nevertheless, we note that the Inquiry blamed the Captain for navigational error. We did not consider the navigational error to be the cause of the disaster however (56).
TEV Wahine Shipwreck 1968 Non-preventable but impact-reducible
A Royal Commission of Inquiry found no specific fault was involved, but acknowledged more steps should have been taken by the Captain to make the coastguard aware how much trouble the ship was in and that weather reports should have been more accurate and frequent (57).
SS Elingamite Shipwreck 1902 Preventable A Court of Inquiry initially found the Captain guilty of negligence but it was later discovered that the Three Kings Islands were charted incorrectly (58).
Ralph's Mine 1914 Preventable Safety flames were not made available to general mine staff despite managers being issued with them at the time. The explosion that caused the disaster was caused by a naked flame (59).
Ballantyne's Fire 1947 Insufficient information on
preventability but impact-reducible
The Inquiry could not determine the cause of the fire. Nevertheless, it found that the spread of the fire could have been reduced and evacuation procedures could have been more efficient (60).
Seacliff Fire 1942 Non-preventable but impact-reducible
Better measures should have been put in place to help residents evacuate in the event of a fire (61).
Pike River Mine 2010 Preventable A Royal Commission of Inquiry found that the company Pike River Coal to be in violation of more than 22 workplace safety polices and that the disaster was entirely preventable (62).
MV Kaitawa Shipwreck 1966 Preventable Although there was limited information as to why the shipwreck occurred at the time, a subsequent view by a former captain seems
9
Disaster Year Preventability Justification of score
reasonably plausible: the ship had no radar and no echo depth sounder (which were being used in other NZ ships at the time) (63).
Loch Long Shipwreck 1902 Unknown There is no reported explanation for why the shipwreck occurred.
Kaimai Air Crash 1963 Non-preventable Aircraft navigation systems at the time were unable to track planes drifting in the wind, the pilots could not have known how far they had drifted off course given the poor visibility and navigation technology available to them (64).
Ranui Shipwreck 1950 Non-preventable The shipwreck is known to be caused by an exceptionally high wave crashing into the boat and capsizing it without warning (65).
Hyde Railway Crash 1943 Preventable A Commission of Inquiry found the train to be going twice the speed it should have been at the time of the crash and the driver to be intoxicated at the time as well. He was convicted of manslaughter in the Dunedin Supreme Court (66).
Strongman Mine Explosion
1967 Preventable A Commission of Inquiry found that mining safety regulations were not followed and a that an explosive charge had been incorrectly fired (67).
Main Trunk Express Crash
1923 Non-preventable No warning system for debris covering train tracks existed at the time and stopping the train before it hit the landslide covering the tracks was not possible. There is insufficient information to know if more should have been done to prevent such slips in terms of landscaping of steep terrain and tree planting on slopes near the track (68).
Kereru Crash 1949 Unknown The Royal Commission of Inquiry considered the crash to be a result of faulty navigation, however the pilot was flying by visual flight rules which was allowed at the time due to low cloud. We decided the cause of the crash is therefore too hard to determine as
10
Disaster Year Preventability Justification of score
we cannot be certain of the visibility the pilot had at the time of the crash (69).
Holmglen Shipwreck 1959 Unknown A Court of Inquiry was unable to determine what caused the shipwreck and a dive to the wreck in 1999 gave no further information to the cause (70).
Brynderwyn Hills Bus Crash
1963 Preventable A Commission of Inquiry found brake failure on the bus to be the cause of the crash which we considered to be preventable. Following the disaster construction regulations for passenger vehicle brakes were changed (71).
Cave Creek 1995 Preventable A Commission of Inquiry found improper design and construction of the viewing platform by unqualified people to be the cause of the disaster (72).
US Liberator Air Crash 1943 Preventable Determined to be a result of pilot instrument error along with fatigue of the crew and the lack of a pre-flight checklist (73).
Kaka Crash 1948 Preventable A Commission of Inquiry found that a lack of navigation beacons in the North Island led to the pilot having to rely on the planes instruments and he was unable to check his position on the ground because of thick cloud. It was also found the pilot adjusted for a westerly wind incorrectly (69).
SS Ventnor Shipwreck 1902 Unknown The ship struck a submerged rock off Cape Egmont. A court of inquiry blamed the Captain for negligence. The inquiry itself however does not appear to have sufficient evidence to support this finding and so we considered this disaster to have insufficient data to make a preventability classification (74).
Glen Afton Mine 1939 Preventable A Royal Commission of Inquiry found violation of safety laws including insufficient ventilation caused the disaster. This lack of safety measures including poor ventilation lead to the deaths of 7
11
Disaster Year Preventability Justification of score
rescuers (75).
Carterton Balloon 2012 Preventable The Transport Accident Investigation Commission found the pilot's medical certificate had expired, the rapid deflation system and parachute valve has not been deployed despite sufficient time and passengers were not briefed on emergency use (76).
Paekākāriki Maritime disaster
1943 Preventable A Board of Inquiry found no one at fault, however the boats were launched in poor weather conditions and the marines were not wearing lifejackets which they were then required to do following the disaster (77).
Ahu Ahu Valley Air Crash
1988 Unknown Insufficient information could be found in regards to the cause of the crash despite a Court of Inquiry (78).
Milford Sound Air Crash 1989 Unknown Insufficient information could be found in regards to the cause of the crash despite an official investigation (79).
Canterbury Yacht Race 1951 Preventable The majority of the vessels in this race turned back after encountering bad weather. A magisterial inquiry also made recommendations around changing the conduct of future yacht races including more up to date weather forecasting by race organisers (80).
Tangiwai Rail Crash 1953 Non-preventable The Board of Inquiry found that the bridge was properly constructed and maintained prior to the disaster in conjunction with possible known forces from floods/lahars that could affect the bridge at the time (81).
12
Table A5: Population denominators used for calculating rates
Population estimates were obtained from Statistics New Zealand (82). Population denominators prior to 1926 were calculated assuming linear population growth between census years.
Year Mean Populationfor year ended31 December
1901 815,8621906 936,3091911 1,058,3131916 1,149,2251921 1,271,667
Estimated de factopopulation
1926 1,413,7001927 1,439,0001928 1,456,1001929 1,473,4001930 1,493,0001931 1,514,2001932 1,527,100
1933 1,539,6001934 1,551,5001935 1,562,2001936 1,575,2001937 1,590,0001938 1,606,8001939 1,628,5001940 1,637,3001941 1,630,9001942 1,639,5001943 1,635,6001944 1,655,8001945 1,694,7001946 1,759,6001947 1,798,3001948 1,834,700
1949 1,871,7001950 1,909,1001951 1,947,6001952 1,996,2001953 2,048,8001954 2,094,9001955 2,139,0001956 2,182,8001957 2,232,5001958 2,285,8001959 2,334,6001960 2,377,0001961 2,426,7001962 2,484,9001963 2,536,9001964 2,589,100
1965 2,635,3001966 2,682,6001967 2,727,7001968 2,753,5001969 2,780,1001970 2,819,6001968 2,753,5001969 2,780,1001970 2,819,6001971 2,864,2001972 2,915,6001973 2,977,1001974 3,041,8001975 3,100,1001976 3,131,8001977 3,142,600
13
1978 3,143,5001979 3,137,8001980 3,144,0001981 3,156,7001982 3,180,8001983 3,221,7001984 3,252,8001985 3,271,5001986 3,277,0001987 3,303,6001988 3,317,0001989 3,330,2001990 3,362,500
Estimated resident population
1991 3,495,8001992 3,533,0001993 3,573,6001994 3,621,6001995 3,675,8001996 3,733,9002010 4,353,0002011 4,386,3002012 4,410,7002013 4,446,700

1
References
1. Ardagh MW, Richardson SK, Robinson V, Than M, Gee P, Henderson S, et al. The initial health-system response to the earthquake in Christchurch, New Zealand, in February, 2011. The Lancet. 2012;379(9831):2109-15.
2. Fineberg HV. Pandemic preparedness and response—lessons from the H1N1 influenza of 2009. New England Journal of Medicine. 2014;370(14):1335-42.
3. Lurie N, Manolio T, Patterson AP, Collins F, Frieden T. Research as a part of public health emergency response. New England Journal of Medicine. 2013;368(13):1251-5.
4. Malilay J, Heumann M, Perrotta D, Wolkin AF, Schnall AH, Podgornik MN, et al. The role of applied epidemiology methods in the disaster management cycle. American Journal of Public Health. 2014;104(11):2092-102.
5. Noji EK. Disaster epidemiology: challenges for public health action. Journal of Public Health Policy. 1992;13(3):332-40.
6. Noji EK. Disasters: introduction and state of the art. Epidemiologic Reviews. 2005;27(1):3-8.
7. UNISDR. UNISDR Terminology on Disaster Risk Reduction. Geneva, Swizerland.: 2009.
8. Mayner L, Arbon P. Defining disaster: The need for harmonisation of terminology. Australasian Journal of Disaster and Trauma Studies. 2015;19:21.
9. Shepherd M, Hodgkinson PE. The Hidden Victims of Disaster: Helper Stress. Stress Medicine. 1990;6:29-35.
10. Ginter PM, Duncan WJ, Abdolrasulnia M. Hospital strategic preparedness planning: the new imperative. Prehospital and Disaster Medicine. 2007;22(6):529-36.
11. Health Mo. National Health Emergency Plan: A framework for the health and disability sector. Wellington: Ministry of Health; 2015.
12. Guha-Sapir D, Below R, Hoyois P. EM-DAT: International disaster database. Univ Cathol Louvain, Brussels: Belgium www em-dat net2014;20.
13. Ministry for Culture and Heritage. New Zealand History: New Zealand disasters timeline 2012. Available from: http://www.nzhistory.net.nz/culture/new-zealand-disasters/timeline.
14. Summers JA, Wilson N, Baker MG, Gottfredsson M. The influenza pandemic of 1918-1919 in two remote island nations: Iceland and New Zealand. The New Zealand Medical Journal. 2013;126(1373).
15. Ministry of Health. Immunisation Handbook 2014. 2014.16. Hopkins DR. The greatest killer: smallpox in history: University of Chicago
Press; 2002.17. Kohn GC. Encyclopedia of plague and pestilence: from ancient times to the
present: Infobase Publishing; 2007.
2
18. Ministry of Transport. Econometric Analysis of the Downward Trend in Road Fatalities since 1990. In: Transport Mo, editor.: Infometrics Ltd; 2013.
19. Ministry of Business Innovation and Enterprise. Occupational Health and Safety in New Zealand: NOHSAC: Technical Report 7 2006. Available from: http://www.dol.govt.nz/publications/nohsac/techreport7/011_content.asp.
20. Pfefferbaum B, Jacobs AK, Houston JB, Griffin N. Children’s disaster reactions: the influence of family and social factors. Current Psychiatry Reports. 2015;17(7):1-6.
21. Fothergill A, Peek LA. Poverty and disasters in the United States: A review of recent sociological findings. Natural Hazards. 2004;32(1):89-110.
22. Bedggood D. Rich and Poor in New Zealand: a Critique of Class, Politics, and Ideology: Allen & Unwin; 1980.
23. Kunitz SJ. Disease and social diversity: the European impact on the health of non-Europeans: Oxford University Press, USA; 1996.
24. Wanhalla A. Housing Un/healthy Bodies: Native Housing Surveys and Maori Health in New Zealand 1930-45. Health and History. 2006;8(1):100-20.
25. Authority CER. Planning and Community Toolset (PACT) [15/03/2016]. Available from: http://maps.cera.govt.nz/advanced-viewer/?Viewer=CERA_PACT.
26. Atkinson J, Salmond C, Crampton P. NZDep2013 index of deprivation. Department of Public Health, ed University of Otago. 2014.
27. Elliott JR, Pais J. Race, class, and Hurricane Katrina: Social differences in human responses to disaster. Social Science Research. 2006;35(2):295-321.
28. Mortensen K, Wilson RK, Ho V. Physical and mental health status of Hurricane Katrina evacuees in Houston in 2005 and 2006. Journal of Health Care for the Poor and Underserved. 2009;20(2):524-38.
29. Treasury. Economic and Fiscal Impacts of the Canterbury Earthquakes. . Wellington, Treasury, 2011.
30. Parker M, Steenkamp D. The economic impact of the Canterbury earthquakes. Reserve Bank of New Zealand Bulletin. 2012;75(3):13-25.
31. Layton B. Impact of Natural Disasters on Production Networks and Urbanization in New Zealand. Resilience and Recovery in Asian Disasters: Springer; 2015. p. 125-53.
32. Department of Labour. A Changing Landscape: the Impact of the Earthquakes on Christchurch Workplaces. Wellington: Department of Labour, 2011.
33. Fergusson DM, Horwood LJ, Boden JM, Mulder RT. Impact of a major disaster on the mental health of a well-studied cohort. JAMA Psychiatry. 2014;71(9):1025-31.
34. Lee C, Du YB, Christina D, Palfrey J, O'Rourke E, Belfer M. Displacement as a predictor of functional impairment in tsunami exposed children. ‐Disasters. 2015;39(1):86-107.
3
35. Crowe M. ‘Quake brain’: Coping with the series of earthquakes in Christchurch. International Journal of Mental Health Nursing. 2011;20(6):381-2.
36. Potter SH, Becker JS, Johnston DM, Rossiter KP. An overview of the impacts of the 2010-2011 Cantebury Earthquakes. International Journal of Disaster Risk Reduction. 2015;14:6-14.
37. Morgan J, Begg A, Beaven S, Schluter P, Jamieson K, Johal S, et al. Monitoring wellbeing during recovery from the 2010–2011 Canterbury earthquakes: The CERA wellbeing survey. International Journal of Disaster Risk Reduction. 2015;14:96-103.
38. McCracken L. An update on New Zealand's post-Pike River mining health and safety regulatory regime. AusIMM Bulletin. 2015(Oct 2015):32.
39. McClure J, Wills C, Johnston D, Recker C. New Zealander’s judgements of earthquake risk before and after the Canterbury earthquake: Do they relate to preparedness. New Zealand Journal of Psychology. 2011;40(4):7-11.
40. Williams D, Begg A, Burgess K. Influenza H1N1 2009 in Canterbury: a case study in pandemic response co-ordination. J Prim Health Care. 2010;2(4):323-9.
41. Ministry of Civil Defence and Emergency Management. Get Ready [16/03/2016]. Available from: http://www.civildefence.govt.nz/get-ready/.
42. Ministry of Civil Defence and Emergency Management. Campaign Monitoring Research. 2015.
43. McLean I, Oughton D, Ellis S, Wakelin B, Rubin CB. Review of the civil defence emergency management response to the 22 February Christchurch earthquake: New Zealand Ministry of Civil Defence and Emergency Management .Wellington, NZ; 2012.
44. Council NC. About Napier - He kōrero mō Ahuriri 2016. Available from: http://www.napier.govt.nz/napier/about/history/napier-earthquake-1931/.
45. Rice G. Black November. Wellington, New Zealand: Allen and Unwin. 1988:140.
46. Eileen M. 'Earthquakes - Building for earthquake resistance'.47. Commission CER. Canterbury Earthquakes Royal Commission. Volume 6:
Canterbury Television Building (CTV). 2015;6:1 -294.48. Ministry for Culture and Heritage. 'Eruption on White Island kills 10
people'. 2014.49. Press Association. Phenomenal Flood. Evening Post 1938. p. 20.50. Kilbourne ED. Influenza Pandemics of the 20th Century. Emerging
Infectious Diseases. 2006;12:9-14.51. Markel H, Lipman HB, Navarro JA, Sloan A, Michalsen JR, Stern AM, et al.
Nonpharmaceutical interventions implemented by US cities during the 1918-1919 influenza pandemic. JAMA. 2007;298:644-54.
52. Markel H, Stern A, Navarro J, Michalsen J, Monto A, DiGiovanni C. Nonpharmaceutical Influenza Mitigation Strategies, US Communities, 1918–1920 Pandemic. Emerging Infectious Diseases. 2006;12:1961-4.
4
53. Summers JA WN, Baker MG, Gottfredsson M. The influenza pandemic of 1918-1919 in two remote island nations: Iceland and New Zealand. N Z Med J. 2013;126:74-80.
54. Centers for Disease Control. Update: Influenza Activity -- Worldwide, 1996. 1996.
55. Mahon PT, editor Report of the Royal Commission to inquire into The Crash on Mount Erebus, Antarctica of a DC10 Aircraft operated by Air New Zealand Limited 19811981.
56. Ministry for Culture and Heritage. 'SS Penguin wrecked in Cook Strait'. 2016.
57. Lambert M. The Wahine Disaster. 2015.58. Libraries CC. Elingamite shipwreck [cited 2016]. Available from:
http://my.christchurchcitylibraries.com/elingamite/.59. Ministry for Culture and Heritage. Forty-three miners killed in explosion
at Huntly. 2015.60. Royal Commission of Enquiry into Ballantyne's Fire Evidence Book. 2009.61. Simpson A. 'Commissions of inquiry - Commissions over time'. 2012.62. Royal Commission on the Pike River Coal Mine Tragedy Volume 1.
2012;1:40.63. Cox M. Anger lingers over Kaitawa sinking. Waikato Times. 2011.64. Ministry for Culture and Heritage. 'DC-3 crashes in Kaimai Range'. 2015.65. McLintock AH. An encyclopaedia of New Zealand: The Ranui. Ministry for
Culture and Heritage Te Manatu Taonga; 1966.66. Ministry for Culture and Heritage. 'Rail tragedy at Hyde'. 2015.67. Ministry for Culture and Heritage. 19 killed in Strongman Mine explosion
at Rūnanga. 2016.68. Ministry for Culture and Heritage. Main trunk express train disaster 2015.
Available from: http://www.nzhistory.net.nz/auckland-wellington-express-train-disaster.
69. McLintock AH, Jones R. An encyclopaedia of New Zealand: The “Kaka” and “Kereru” Crashes. Ministry for Culture and Heritage Te Manatu Taonga; 1966.
70. Ministry for Culture and Heritage. Fifteen die in mysterious shipwreck. 2014.
71. McLintock AH. An encyclopaedia of New Zealand: Waitangi Day Bus Accident, 1963. 1966.
72. Department of Internal Affairs. Commission of inquiry into the collapse of a viewing platform at Cave Creek near Punakaiki on the West Coast.1995; Wellington.
73. Today in History - 2 August 2014.74. The Ventnor Inquiry. Star. 1902.75. Paterson S, Brown J, Dowgray J, Bishop T, McLagan A, editors. Glen Afton
Colleries Royal Commission (Report Of)1940.76. Transport Accident Investigation Commission. Inquiry 12-001: Hot-air
balloon collision with power lines and in-flight fire, near Carterton2012; Wellington.
77. Ministry for Culture and Heritage. 'United States Navy tragedy at Paekākāriki'. 2011.
5
78. ASN Wikibase Occurrence # 32832. 201.79. Transport Accident Investigation Commission .Official Accident Report
No. 89-066. Britten Norman BN2A-26 Islander, ZK-EVK Near Blue Duck Glacier, Upper Dart Valley1989; Wellington.
80. Stewart C, Johnston D, Nathan S. GNS Science Consultancy Report When Disaster Strikes: Collected Disaster Stories. 2007:14.
81. Stilwell WF, Hopkins HJ, Appleton W. Derailment of Wellington-Auckland Express at Whangaehu River Bridge between Tangiwai and Karioi Railways Stations on 24 December 1953. 1954:3-31.
82. Statistics New Zealand. Historical population estimates tables 2016 [cited 2016 22 March]. Available from: http://www.stats.govt.nz/browse_for_stats/population/estimates_and_projections/historical-population-tables.aspx.
6
Addendum to the Report by the Project Supervisors
The Supervisors commend the students for their high quality work and preparing this Report in such a short space of time. In particular, the students managed well with some complex definitional issues.
Nevertheless, they note that this was a complex project for many reasons and that further research has identified the following points that readers could consider:
1. In retrospect a possibly better term than “disasters” for this work may have been “mass casualty events”. This is because some events (eg, that caused 10 deaths in a transport crash) do not approach what the United Nations defines as a disaster (in terms of the widespread impacts).
2. In retrospect, the issue around classifying preventability was a big challenge. This means that the classifications used should be regarded as very provisional – and more research is needed to refine these.
3. The aircraft crash in the Ahu Ahu Valley in 1988 should probably not have been included in this study. This is because it appears to have involved 9 fatalities (not 10 as stated on various websites) – see this fairly detailed internet document (http://aviation-safety.net/wikibase/wiki.php?id=32832).
4. A probable missed event from the data collected in this Report was the crash of a US Air Force Flying Fortress (n=11 deaths) at Whenuapai in 1942. This is understandable since this event is not well recorded on NZ disaster websites as it does not appear to have been well documented due to war time secrecy.
5. We note that there is a plausible case for reclassifying the Tangiwai disaster as a “natural” disaster (rather than the “TII” category used) – as the primary cause was a natural event relating to the Ruapehu volcano.
6. Similarly we note a plausible case for reclassifying the Ongarue rail crash due to a landslip on the main trunk railway line in 1923 as “natural” (from “TII” as used) – as the primary cause was a natural event associated with heavy rain. But further research could clarify this further eg, was the slip due to a poorly designed cutting in the landscape?
7. We also note a plausible case for not including the H3N2 influenza event in 1996 in the analysis of biological disasters – given this could be seen as part of the range for seasonal influenza (ie, it was not a pandemic).
8. A possible missed inquiry was a “Marine Inquiry” into the Loch Long sinking – as reported at: http://freepages.genealogy.rootsweb.ancestry.com/~nzbound//chathams.htm
If further research is done on this topic – then the above issues could be explored in more detail. Again however, we commend the students for an impressive research effort conducted in a very constrained amount of time.
Nick Wilson & George Thomson