Embed Size (px)
Citation preview

ESS Step-By-Step IA Guide
Context
1. First you need to create a relevant, coherent and FOCUSED research question. The research question should be phrased so that the variables within the investigation are made clear. Take your time. Developing a clear, concise, measurable research question that contains the variables will help ensure a quality investigation.
Example Structure: “How does the ...independent variable... affect the... dependent variable.”
Example Question:How does the soil moisture level (0.2, 0.4, 0.6, 0.8, 1.0ml) of water added to a choice chamber versus a control of 0.0ml of water added to the alternate side of the chamber impact the preference of pill bugs (Armadillidium vulgare) as indicated by the population of pill bugs measured on each side of the chamber over a 10 minute time period? Example Explanation of CONNECTION between Issue and Research QuestionPill bugs are fascinating creatures found throughout the world. What is their niche? What ecosystem services do they provide? (Fascinating Facts)
“Pill bugs do not normally eat live plant material. Like earthworms, pill bugs seek out moist, dark habitats—making a compost bin an ideal home. Their diet in the compost pile is identical to their diet in natural surroundings, consisting largely of rotting wood and decomposing plant and animal matter.” (Curious Garden)
How therefore are pill bugs useful in tackling a global issue? “In the USA, organic waste is the second highest component of landfills, which are the largest source of methane emissions.” (Food Waste Facts)

It should therefore be useful to examine the abiotic factors most favorable to pill bugs in supporting a healthy population of decomposers in a compost. “Ultimately, if pill bugs are found in a compost pile or worm bin, it is a sign of a healthy compost environment.” (Curious Garden)
Relevant Environmental Issue as CONTEXT for Research QuestionRecognizing that pill bugs are indicative of a healthy compost pile and that these decomposers are necessary for breaking down organic waste aerobically to reduce the production of methane emissions let's further examine the consequences of a situation where pill bugs were not present in the system. “Where re-use is not possible, recycling and recovery should be pursued: by-product recycling, anaerobic digestion, composting, and incineration with energy recovery allow energy and nutrients to be recovered from food waste, representing a significant advantage over dumping it in landfills. Uneaten food that ends up rotting in landfills is a large producer of methane, a particularly harmful GHG.” (Food Waste Harms)
How large is the issue of food waste in terms of environmental consequences?“Each year, food that is produced but not eaten guzzles up a volume of water equivalent to the annual flow of Russia's Volga River and is responsible for adding 3.3 billion tonnes of greenhouse gases to the planet's atmosphere.” (Food Waste Harms)
Additional Guidance for Context:Example:
2. Second, you need to write the hypothesis of the investigation. The hypothesis needs to be very clear, giving an exact and complete description of what might happen (and why). The prediction is written like: If …then… because…

Example: If the independent variable is increased …then the dependent variable will increase because…scientific reasoning. Support your scientific reasoning with an in-text citation from a resource you have researched. Also include a reference section at the back of your lab.
Planning:
Table 1: Planning through Identification of Variables (a Completed Example)
Experimental Variables
Variable(s) Units (if applicable)
Additional Info
Independent Distance from civilization (10km, 20km, 30km, 40km, 50km)
km Systematic sampling method for simplicity and periodic quality.
DependentRiver Water pH
- Measured via pH Sensor in conjunction with LabQuest Pro with 5 repeated trials at each distance outlined above.
Controlled - Depth sensor is placed in water.- Distance from shore-Time sensor is held in water before taking a reading
-5 cm-1 meter- 60 seconds
*Summarize the below content (Steps 3-5) in the above chart.
3. The independent variable is the one that you alter throughout your experiment. In most investigations there is only ONE independent variable . For an example, if you investigate the change in pH of river water with distance from civilization, then the
different distances from civilization down river from Puerto Maldonado is the independent variable (10km, 20km, 30km, 40km, 50km).
4. What does "sufficient, relevant data" mean? Specifically list the five variations of the independent variable that you will use. Remember that five variations
is the minimum required from the IB. Include relevant units. Also remember that your procedure should mention that you will conduct a minimum of five repeated trials.
5. The dependent variable is the variable that you measure. Be sure to specifically describe the equipment you will use
to make your measurements and the units these measurements will be recorded in.
6. The controlled variables are the ones that you try to keep constant throughout your experiment so that they don’t affect your experiment. You should highlight at least three. Be SPECIFIC in describing what aspects of your MATERIALS and PROCEDURE you will control. Example: If investigating the change in pH down river you must control for variables such as the depth of the
water the sample is taken from, the distance from shore, the amount of time the sensor is kept in the water for and so on.

7. Sampling Method Justification For top marks make sure you include a statement to JUSTIFY the sampling strategy used. Are you using a
transect and systematic sampling, random sampling? Why did you choose this method? Using the above example, the dependent variable would be the pH level of the river water. The sampling method used was systematic for its simplicity and periodic quality.
SURVEY WORK - If you choose to do survey work consider the following advice on how to design a survey. Keep in mind that each question you ask is a question you will generate data for and need to analyze. Having five well designed questions will allow you to generate sufficient data. Using a 5 to 7 point Likert Scale within a question is considered to be a reliable form of data collection within a survey. If you incorporate one open ended question where students generate their own response you will likely use a cluster analysis or "bucketing technique" for the data you generate.
Always discuss your sample size within your report. How representative is your sample size with regards to the population you are surveying? Define the population you are intending to survey. Consider and comment upon the variables you will attempt to control in the survey. Be sure to address any variables you found it challenging to control within the evaluation section of your report.
Materials8. Provide a detailed list of all the equipment used in the experiment. Give the size of beakers/measuring cylinders,
amounts and concentrations of solutions etc, used, give the names of any chemicals that are used in the experiment. BE as specific as possible!
Example: 5 x 500 ml beaker1 x 100 ml graduated cylinder1 x Electronic balance (uncertainty: +/- 0.005g)1 x Digital Thermometer2 x Bottle of 1M HCl solution (20.0 ml of 6.00M HCl with 100 ml tap water)3 x Safety goggles3 x Pairs of safety gloves
Diagram of Experimental Set-Up
9. You should use a diagram (picture) to show the experimental set up where it will increase the ability of another scientist to replicate your experiment exactly as you performed it. ALL FIGURES USED ANYWHERE IN YOUR LAB MUST HAVE A FIGURE #, CAPTION, LABELS AND A REFERENCE.
Example:

Source: http://www.engr.sjsu.edu/bjfurman/courses/ME120/me120pdf/ME120labreportguide.pdf
10. A) Now you should describe the method. It should be written in past tense (i.e. not written as a guide on how to carry out the experiment again, but rather, how you did it). The steps in the experiment are either self-evident or explained.
http://www.fair.science-resources.org/sci_meth.htm
B) WITHIN your numbered procedure steps you should explain how the independent variable was varied. *IB states you should have at least FIVE readings/measurements/samples for each variation in the independent variableExample: Using the pH river water example, the independent variable can be varied by taking the pH readings in Puerto Maldonado (0 km) as the control, at Refugio Amazonas (10km), the Park Ranger CheckPoint (20km), Where the two main rivers intersect (30km) at TRC (40km) and at the Macaw Clay lick (50km) as each location is further downstream from civilization than the next.
C) Write how the dependent variable was measured.
Example: You should write how you got your results, e.g. by reading pH from a pH sensor.
D) i) Write how the controlled variables were controlled.Example: Using the pH river water example, you write that you made sure that the pH sensor was placed to the same depth each time a measurement was taken (5 cm), and that distance from shore was kept constant at 1 m with the sensor being kept in the sample for a time of 1 minute.
ii) AND USE A CONTROL in an experiment to ensure a FAIR TEST. If you are testing to see if sucrose has an effect on yeast growth have one flask of yeast where NO sucrose is added to the solution.
http://writing2.richmond.edu/training/project/biology/matmeth.html
E) Write how you made sure that the sufficient relevant data was recorded. Describe the method for data collection, i.e. HOW many REPEATED TRIALS did you PERFORM?, did you use a control, did you calibrate any instruments, if so how?
Example:
1. In preparing the catecholase extract, a potato was skinned, washed, and diced.
2. 30.0 g of the diced potato and 150 ml of distilled water were added to a kitchen blender and blended for approximately two minutes.
3. The resulting solution was filtered through four layers of cheese cloth.
4. The extract was stored in a clean, capped container.
5. Five individually labeled spectrophotometer tubes were prepared using different amounts (as represented in Table 1) of the following reagents: a buffer of pH 7, a 0.1% catechol substrate, and distilled water.
6. The wavelength of the Spectronic 20 spectrophotometer was set at 540 nm.
7. To calibrate the specrophotometer at zero absorbance, a blank control tube prepared with no catechol substrate and labeled "tube 1" was inverted and inserted into the spectrophotometer.
8. It is important to note that the extract to be tested was added to each tube immediately before placing the tube into the spectrophotometer.
9. 1.0 ml of catecholase extract was pipetted into tube 1.
10. Tube 1 was immediately inverted and placed in the spectrophotometer.
11. The absorbance was read and recorded for time zero (t0), the ten minute mark (t10), and each minute in between.
12. Tube 1 was removed from the spectrophotometer and the same measurements were taken for tube 2-5 using the same protocol.

13. Steps 5-11 were repeated for five, complete, repeated trials.
11. Risk Assessment and Ethical Considerations Include a brief statement outlining any safety concerns that need to be addressed after conducting a risk
assessment within the experimental method. Review the IB Animal Experimentation policy and comment on any consideration given to livings things within
your experimental method. Always include the "Risk Assessment and Ethical Considerations" Sub-Heading within your ESS IA report. Even if
you feel there are no ethical considerations or the results of a risk assessment are negligible include this information in a statement in this section.
If students are conducting SURVEY work remind them to incorporate safety and ethical considerations when addressing the general public.
Results, Analysis and Conclusion
Data Collection and Construction11. Quantitative Data: Systematically record appropriate quantitative and /or qualitative data including units in tables. The tables should be numbered, and have clear, descriptive titles. Units should be placed within column and row headings where appropriate. Record only RELEVANT qualitative observations, not everything that happened.
Report data in a table column with the SAME NUMBER of DECIMAL PLACES (degrees of accuracy)Ex: 4.02, 5.98, 6.45 =CORRECTEx: 4.0, 5.98, 6.45 = INCORRECT
12. Qualitative Data: Include a data table (or a column/row within a data table) for your qualitative observations. This is especially relevant for field research where it is imperative to include information about the weather, the surroundings and any factors you observe which may influence the results but which are beyond your control. Recording qualitative observations for work conducted in a laboratory setting is also equally relevant. Record the observations concisely and accurately. Often including a few key photographs will greatly augment the power of your qualitative observations. Be sure to include an Image #, caption, labels, and a photo credit (even if it is your own work).
Data Processing/Analysis 13. The data should be processed (analyzed) correctly and presented in a SUMMARY table.
For EACH calculation TYPE performed there must be ONE complete SAMPLE calculation shown. For example if you are calculating the average only include one SAMPLE average calculation. Using programs such as Excel to assist you in these calculations can save you a significant amount of time.
In the sample calculation always include the formula, substitution, calculation and appropriate units. Monitor Significant figures to ensure accuracy.
If you are researching a potential relationship between two numerical values calculate the R value and include a sample calculation for this.

Another frequent analysis method in ESS is finding the percentage difference in the results between two variations of the independent variable. Finding the percentage change (resulting in a percentage increase or a percentage decrease) between an initial value and a final value may also be of use.Example productivity calculations may be accessed here.
Advice and embedded resources for analyzing SURVEY data may be found via this link. When you design your survey questions think about the results you are hoping to generate with a plan in mind of how you will complete analysis as well.
Data Presentation/Display14. Include a graph of your PROCESSED DATA. All graphs should have graph number, clear, descriptive graph title, label axes and units for each label as well. Include a BRIEF a caption below the graph in which you describe the contents of the graph. Present the processed data appropriately and effectively to assist analysis.
Make sure that you use the correct type of graph. If both variables are continuous, use an X-Y Scatter plot, for comparison of a continuous variable (like time) against a non-continuous variable (like number of turtles) use a bar graph. For percentages use a pie chart. Print graphs in colour where possible with a clearly developed LEGEND to assist in analysis.
Find tips for presenting results for SURVEY work here. Choosing the most effective method to display your results is important so give this careful consideration.
Data Interpretation and Conclusion15. Restate your hypothesis. State if your hypothesis was supported, partially supported or not supported by yourdata. THEN REFER to YOUR PROCESSED DATA. If your results were inconclusive then say so and EXPLAIN why based
on your processed DATA.What patterns in your data contribute to your conclusion? What is the percentage difference or change between your highest and lowest results? I should see numbers here. Please do not just repeat your raw data in a long paragraph. EXPLAIN your conclusion correctly using SCIENCE. This explanation should be based on research you have conducted that is somehow connected to Environmental Systems and Societies. Provide in-text citations to reference this research appropriately and include a proper reference in your bibliography at the end of your report or you are guilty of academic responsibility and could lose your IB diploma. ANYTIME you get an idea from a source whether it is paraphrased or directly quoted it MUST be REFERENCED!
Discussion and Evaluation:
Evaluation16. In the evaluation you should evaluate the method used. USE a TABLE LIKE THE ONE BELOW TO DO THIS. USE ONLY the table, do not write out your evaluation as well.Write about the main weakness of the method used and the weakness in the method of manipulation of data. Write about the source of error, but don’t include personal mistakes. Suggest realistic improvements (that can be carried out in the school lab) to the investigation. Classic Examples of meaningful improvements include; collection of more data through increased variation of the independent variable, OR increased number of repeated trials.

Table 2: Evaluation of Method for ESS IA. (A completed Example) Dig deep! Avoid making superficial statements.
Evaluation Realistic Suggestion for ImprovementSuggest Strength of Method UsedExample: Correct sampling strategy was used and this resulted in valid data being collected.
Discuss one strength of the method used.Example: Discuss WHY this was the correctsampling strategy to use including specific observations from the investigation.
Suggest Significant Weakness of MethodExample: Lack of expertise in experimental technique left an unforeseen variable uncontrolled that impacted results. BE SPECIFIC IN YOUR REPORT
Discuss a Modification to Address the SignificantWeakness Identified.Example: Unforeseen variable would be controlled for by ………...BE SPECIFIC IN YOUR REPORT
Suggest Significant Weakness of Method 2Example: Limited number of repeated trials in field research. BE SPECIFIC IN YOUR REPORT
Discuss a Modification to Address the SignificantWeakness 2 Identified.Example: Increase number of repeated trials in fieldwork. BE SPECIFIC IN YOUR REPORT as to how.
Suggest Significant Limitation of MethodExample: Small sample size. BE SPECIFIC IN YOUR REPORT
Discuss a Modification to Address the SignificantLimitation Identified.Example: Increase sample size.
Suggest further areas of Research. List at least three.Example: 1. How do light levels vary pill pug populations in a choice chamber?2. How does the presence of other decomposer species vary pill bug populations in a choice chamber?3. How does the leaf type vary pill bug populations in a habitat?
Discuss why one of these further areas ofresearch would benefit this research area.Example: Having a well-rounded data set of the variables that pill bugs prefer in their habitat and working to replicate these conditions may help promote a healthy compost and increase the decomposition of organic matter while decreasing methane emissions.
17. Discussion:"Evaluate the conclusion in the context of the environmental issue". What are the implications of your results? Who cares about this information? How does it connect to the environment? How does it connect to society?Are there anomalies in the data? If there are they should be discussed.What is the context of your results? Does your data agree or disagree with other similarly published research? CITE THAT OTHER RESEARCH properly with an in-text citation and a reference in your bibliography at the end.It is likely that your research focused on a narrow context where your results would be valid but may be relevant in contributing a piece of knowledge to a larger issue. Comment on this.
18. Applications:
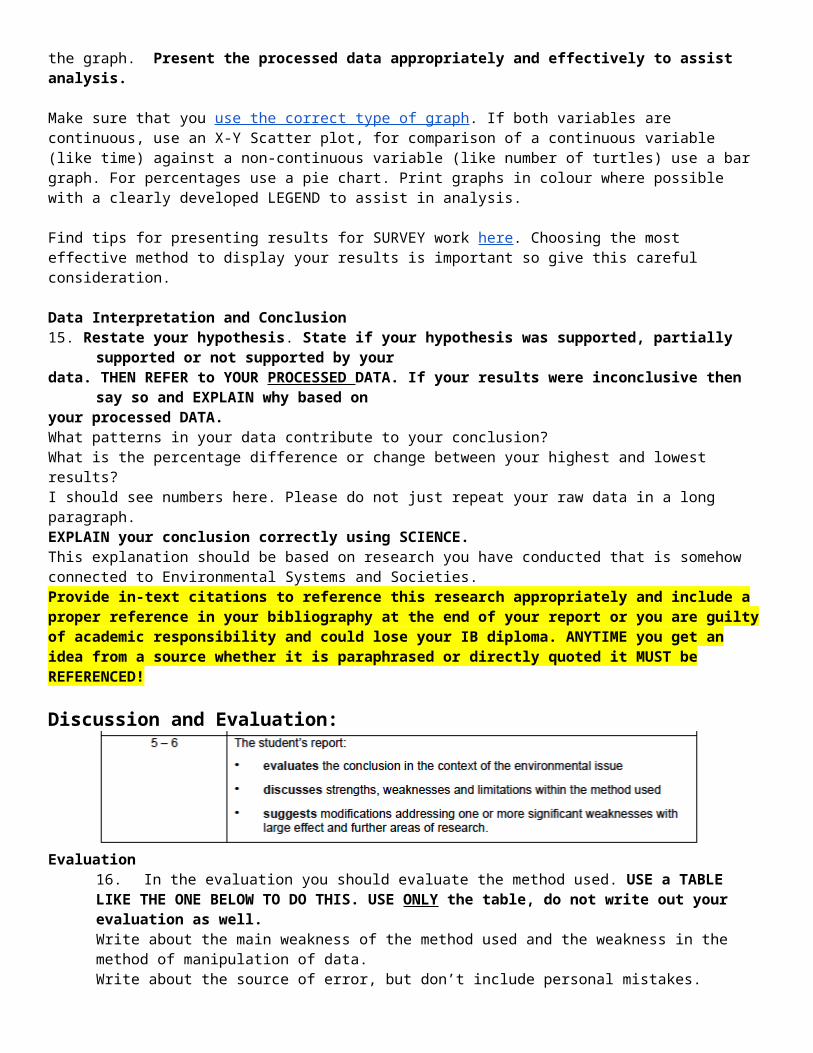
Table 3: Application of Results to Solution Development for Environmental Issue Identified in ContextComplete all sections of the table to ensure full marks.
Environmental Issue Identified in Context
Application/Solution to Issue
Justification(Include at least two statements which provide researched scientific reasoning for this solution choice. Ensure both statements include in-text citations for the research conducted.)
Strength of Solution Proposed
Weakness or Limitation of Solution Proposed
19. Communication:
The report you submit does not need a cover page. Include your full name, IB Candidate Number, and the date as a header on the page. Add page numbers to each page as well.
Include the WORD COUNT in this area as well. "The report should be 1,500 to 2,250 words long. Students should be made aware that external moderators will not read beyond 2,250 words and teachers should only mark up to this limit." BE CONCISE.
Use the subject specific vocabulary highlighted during classes and found in the Subject Guide glossary.
Read your report. Self-Assess using this document as a guideline. Does the report flow? Does it make sense? Peer assess. Friends don't let friends hand in bad ESS IAs. :)
Follow this guideline of headings and subheadings to help ensure clear structure within your report. You may also find this useful as a final checklist;Title: Make your research question the title of your report. Yes, that means it will be a long title.Main Heading - ContextResearch QuestionExplanation of Related Environmental Issue Connection between Research Question and Identified Environmental IssueHypothesis

Main Heading - PlanningTable 1: Planning through Identification of VariablesMaterials ListMethodJustification of Sampling StrategyDiagram of Experimental Set-UpRisk Assessment and Ethical Considerations
Main Heading - Results, Analysis and ConclusionData Collection and ConstructionQuantitative DataQualitative DataData Processing/AnalysisData Presentation/DisplayData Interpretation/Conclusion
Main Heading - Discussion and EvaluationTable 2: Evaluation of MethodDiscussion
Main Heading - ApplicationTable 3: Application of Results to Solution Development for Environmental Issue Identified in Context
Main Heading - Bibliography
20. Bibliography:Hadley, Debbie. "10 Fascinating Facts About Pillbugs." N.p., n.d. Web. 29 Sept. 2015. <http://insects.about.com/od/isopods/a/10-facts-pillbugs.htm>.
"Food Waste Harms Climate, Water, Land and Biodiversity - New FAO Report - UNEP." Food Waste Harms Climate, Water, Land and Biodiversity - New FAO Report - UNEP. N.p., n.d. Web. 21 Sept. 2015. <http://www.unep.org/newscentre/Default.aspx?DocumentID=2726&ArticleID=9611#sthash.h4xXR9Pn.dpufhttp://www.unep.org/newscentre/Default.aspx?DocumentID=2726&ArticleID=9611#sthash.h4xXR9Pn.dpuf>.
"Food Waste Facts." World Environment Day -. N.p., n.d. Web. 21 Sept. 2015. <http://www.unep.org/wed/2013/quickfacts/>.
Foglesong, Nancee. "A CURIOUS GARDEN: Pill Bugs." Solana Center for Environmental Innovation Fresh Perspectives. Solana Center for Environmental Innovation, 25 Oct. 2013. Web. 21 Sept. 2015. <https://solanacenter.wordpress.com/2013/10/25/a-curious-garden-pill-bugs/>.
General Resources in creating a Bibliography"EasyBib: The Free Automatic Bibliography Composer." EasyBib. N.p., n.d. Web. 21 Sept. 2015.

http://www.easybib.com/cite/view
How to Create In-Text Citations"MLA In-Text Citation Style." MLA In-Text Citation Style. N.p., n.d. Web. 21 Sept. 2015.http://www.virtualsalt.com/MLA-InText.html