Embed Size (px)
Citation preview

Section 7: The collapse
7.1 IntroductionThe Terms of Reference require the Royal Commission to consider why the CTV building failed severely.
The north wall complex and south shear wall were designed to be the primary earthquake load-resisting elements in the building. The columns were designed to provide support to gravity loads on the floor slabs.
The north wall complex did not fail as such; it remained standing after the collapse and was eventually deconstructed. However, it failed to perform its intended function of resisting earthquake loads on the building because the floor slabs detached from it. The south shear wall similarly failed in that the floor slabs detached from it and it toppled over, coming to rest on the remains of the building. The columns also failed to perform their function of providing gravity support for the floor slabs, although this failure may have been related to the failure of the joints between the columns and the beams.
It is clear that the building failed in a number of ways and that the consequences of these failures were as severe as they could possibly have been in terms of the safety of those in the building.
A number of expert witnesses who gave evidence to the Royal Commission put forward possible collapse scenarios. In most cases, an initiating point of failure was identified, as were the consequences of that failure. Some of the scenarios had common features while others were markedly different. However each of them necessarily incorporated the disconnection of the diaphragm connections at the north wall complex and south shear wall and the failure of the columns and/or beam-column joints.
The experts variously identified failures of the following parts of the building as possible collapse initiators:
• buckling or crushing of the columns, either internally or externally;
• disintegration of the beam-column joints;
• disconnection of the floor slabs from the north wall complex;
• disconnection of the floor slabs from the south shear wall; and
• disconnection of an interior beam from a west wall column.
In some of the proposed scenarios, the initiator resulted in the failure of other critical parts of the building. However, some experts gave evidence that the point of failure identified would have been sufficient to cause complete collapse.
A number of sources of evidence were availableto those experts, and to the Royal Commission, to consider possible collapse scenarios:
• the evidence of witnesses to the collapse, including those who were in the building at the time;
• photographs of the building following collapse;
• evidence about the state of elements of the building following collapse; and
• the results of computer analyses.
Each of the possible collapse scenarios will be described and considered below.

DEMAND PROBABLE COLLAPSE SEQUENCE CAPACITY
Components of demand on columns:
Gravity loads
Horizontal seismic loads and storey drifts
may have been influenced by:• asymmetric shear
walls• masonry infill• critical connections
between floors and north core
Vertical seismic loads
East and/or south side column failure – at mid
to high level
Internal column failure –at mid to low level
Rapid progressive collapse
Possible floor diaphragm
disconnection from north core walls
Capacity of columns to support gravity loads and to withstand storey drifts may have been limited by:
Non ductile detailing of columns and beam-
column joints
Insufficient gaps to Spandrel Panels
Low concrete strength
Vertical seismic loads
Capacity to resist progressive collapse may have been limited by:
Demand = loads or displacements acting on structure
Capacity = ability of structure to resist loads or displacements
Lack of redundant load paths and
interconnections of structural elements
for robustness
Figure 91: Collapse sequence flowchart produced in the Hyland/Smith1 report
7.2 Possible scenarios
7.2.1 The Hyland/Smith report scenariosDr Clark Hyland and Mr Ashley Smith evaluated various collapse scenarios for the purpose of identifying, if possible, the most likely. They produced a flowchart to illustrate the key considerations they used (see Figure 91).
The failure of one or more columns was central to their approach in each of their scenarios. They considered that collapse was almost certainly initiated by failure of a column when the lateral displacement of the building was more than the column could sustain. A comparison of “demand” (loads and displacements imposed on columns due to gravity and earthquake actions) and “capacity” (the strength and deformation capacity of critical columns) lay at the heart of their assessment.
As their flowchart illustrates, column failure was seen as the initiator of the collapse, with a possibility of contribution from the disconnection of the floor slabs from the north wall complex.
Four possible scenarios were identified.
7.2.1.1 Scenario 1, collapse initiated by columns in line 1 or F
As the building moved in the earthquake, the columns on line 1 and line F would have been exposed to the highest inter-storey drifts in the structure. This would have led to a failure of the line F columns in the second to fifth storeys, possibly exacerbated by interaction with the adjacent spandrel panels.
With the loss of the load-carrying capacity of the columns on line F, the interior columns on lines 2 and 3 at a mid to low level would have become overloaded. The slabs and beams they supported would have pulled downwards and northwards on the south shear wall and frame on line 1. The slabs and beams connected into the columns at line A would have pulled downwards and inwards on those columns, which could explain the beam-column joints pulling out in some locations. The upper levels and roof above the column failure on line F could have dropped as a unit, with a slight lean to the east.
Dr Hyland and Mr Smith described this in their report as their “preferred collapse scenario”, given that some witnesses saw the collapse start in the upper third of the building, a witness reported a slight tilt to the east and debris was observed on Madras Street after the collapse. This scenario was represented in three figures in their report (see Figure 92):

Roof
Gap between columns and Spandrel Panels
Precast concreteSpandrel Panels
Potential point of contact withSpandrel Panels
Loss of load carrying capacity at column heads, leading to slumping, load transfer to inner Line 2 and 3columns and beam-column joint distress
Level 6
Level 5 Hinges top and bottom
Level 4
Level 3
Level 2
Level 1
1 2 3 4 1 2 3 4 1 2 3 4
(a) Hinging at top and bottom of columns(c) to drift, compression loads, and interference
- no contact with Spandrel Panels (b) Panels. Possible short-column effecthinging also upper levels.
from Spandrel Panels. Slumping of beamsleads to load transfer to and collapse of internal columns on Lines 2 and 3.
Figure 17: Possible collapse sequence along Line F as inter-storey drifts reach critical levels and columns begin to fail from lack of displacement capability or from additional damage caused through contact with precast concrete Spandrel Panels. Displacements and damage are greatest in the upper levels, but inelastic drift capacity less in the lower levels. Also change in torsional stiffness at Level 4 due to the Line A masonry infill wall stopping at that level may have contributed to collapse appearing to initiate above Level 4.
Roof
A B C D E F
Level 6
Level 5
Level 4
Level 3
Level 2
Level 1
(1) (2) (3)
Roof
Level 6
Level 5
Level 4Level 3 Roof
Level 2Level 1
Level 6
Level 1
(4) (5)
Figure 19: Possible progression of collapse from loss of column capacity on Line F is shown sequentially as follows: (1) Collapse ofLine F columns above Level 4 leads to extra floor area being supported of columns on Line E; (2) The Line E columns begin to collapse under the extra load; (3) As the Line E columns sink additional floor area becomes supported on the Line D columns which in turn begin to collapse, causing an eastward tilt in the upper levels; (4) The upper levels then hit the Level 4 Line F; (5) The collapse completes with all floors laying on top of each other. Note that collapse is also spreading in the north-south direction simultaneously to this as shownin Figure 19.

1 2 3 4 5
Roof
Level 6
Level 5
Level 4
Level 3
Level 2
Level 1Line 1South Wall
(1)
North core
(2) (3)
Roof
Level 6
Level 5
Level 4
Level 3
Level 2Level 1
Floors pull away from South Wall and Line 1 frame
(4) (5)
Figure 20: Possible progression of collapse on a north-south section through the building simultaneous with that shown progressing westwards in Figure 19 (1) Initial condition; (2) Line 2 begins to subside; (3) As line 2 subsides further the stiffer and stronger North Core pulls the collapsing floors towards it; (4) The South Wall is pulled northwards; (5) The slabs pull away from the North Core eventually lying diagonally against it and the South Wall is pulled down onto the collapsed building.
Figure 92: Figures 17, 19 and 20 from the Hyland/Smith report illustrating their preferred collapse scenario
7.2.1.2 Scenario 2, collapse initiated by failure of internal column on line 2 or 3In this scenario, collapse was initiated by the failure of one of the most highly loaded internal columns on line 2 or line 3, following which the floor would have sunk and the slabs would have been forced into catenary
behaviour2. The structure would have progressively collapsed onto itself.
Dr Hyland and Mr Smith said in their report that this is a credible possibility that cannot be discounted but that it “may not be totally consistent with the observation of an eastward tilt as the upper levels fell as a unit and the slight eastward throw of debris into Madras Street. The isolated internal column collapse initiation would perhaps have been more likely to have resulted in an even more concentric debris pile on the site than what was observed”.
However, Mr Rob Jury, who was part of the DBH Expert Panel, gave evidence of his opinion that this scenario was more likely than Scenario 1 and that the initiator of the collapse may have been an internal column on level 1. He considered that the second Compusoft Engineering
Limited3 (Compusoft) NLTHA results provided a stronger case for this than the earlier analysis.
7.2.1.3 Scenario 3, collapse initiated by disconnection of floors at levels 2 and 3 from north wall complex
The diaphragm connections at levels 2 and 3 of the north wall complex (at which there were no drag bars) detached due to potentially high in-plane flexural demands. The effect of this detachment would have been to overload the columns on levels 1, 2 or 3 by imposing greater lateral displacement due to the loss of restraint from the north wall complex.
However, Dr Hyland and Mr Smith concluded that diaphragm disconnection at levels 2 and 3 was not entirely consistent with the collapse evidence and less likely than their first two scenarios. They referred to evidence of the floor slab lying against the north wall complex in a manner indicating it had lost support at the line 3 end of the slab rather than at the north wall complex (see Figure 93).

Figure 93: Figure 95 from the Hyland/Smith report showing the slabs lying against the north wall complex
7.2.1.4 Scenario 4, collapse initiated by disconnection of drag bars from levels 4, 5 or 6
This scenario is similar to Scenario 3 but also includes failure of the drag bars and adjacent slab. The disconnection from the north wall complex at levels 4, 5 or 6 would lead to column failure. This might have been compounded by the effects of east-west foundation rocking and uplift of the slab/wall connection due to northwards displacement.
Rocking or tensile extension of the south face of the north wall complex as part of the north-south response may have initiated failure and detachment of the floor slabs due to a combination of in-plane and out-of-plane diaphragm actions. With the detachment the inter- storey drifts would increase resulting in failure of the columns.
Dr Hyland and Mr Smith concluded that this scenario was not entirely consistent with the collapse evidence. Photographs of the north wall complex showed that the levels 4, 5 and 6 slabs may not have failed initially at the drag bars (see Figure 94). For these reasons they believed it was less likely than the previous three scenarios.

L6 Drag bar still attached to and holding up slab
L5 Drag bars
L5 Line 4 precast concrete beam afterL5 slab has rotated off
L4 slab failure along ends of H12 saddle bars 1200mm off line 4 similar to L5and L6
Failure surface runs diagonally from inside face of edge beam to the ends of the slab saddle bars
Column Line 4 D/E L4-5 and L5-6 with beam-column joint pullout at L5
L5 Drag bar
L5 slab from in front of lifts between wallsD/E and D
L5 slab failure surface 1200mm out fromline 4 at end of H12 saddle bars
Figure 94: Figures 163 and 164 from the Hyland/Smith report showing diaphragm failure at the north wall complex

7.2.1.5 Discussion on collapse scenarios 1, 2, 3 and 4 from Dr Hyland and Mr Smith
All four of the collapse scenarios proposed by Dr Hyland and Mr Smith are based on the premise that a column or columns initiated failure due to excessive drift being developed during the earthquake. They identified columns on the east and south sides of the building as the ones most likely to have initiated failure.
The limiting inter-storey drifts the columns could sustain were calculated by Dr Hyland using a Cumbia software program to calculate moment curvature relationships for reinforced concrete members subjected to axial load. The analysis is based on the assumption that plane sections remain plane. The failure criterion for lightly confined columns, such as those used in the CTV building, was taken as the actions sustained when a limiting strain of 0.004 was reached in the concrete. A limiting strain of 0.004 is widely assumed to be the value at which spalling of concrete commences. In practice this critical strain level varies and it is generally in the range of 0.003 to 0.007. For lightly confined columns, such as those in the CTV building, spalling of the concrete could be expected to result in a loss of flexural strength. However, a reduction in flexural strength does not necessarily result in failure of the axial load-carrying capacity, provided there is some other load path that can resist P-delta forces, which would be the case provided there is some connection between the floors and the walls.
We note that it is difficult to identify a critical displacement that will cause an axial load failure and this displacement may have been underestimated by the authors. Our concerns about the Hyland/Smith analysis include their use of low concrete strengths, the assumption that plane sections remain plane, the assumption about the stiffness properties of the columns and the approximation of the plastic hinge length.
Dr Hyland and Mr Smith note in their report:
…failure may not have occurred at the drag bar connections to the North Core at levels 4, 5 and 6 prior to slab pulling away. The slabs at levels 5 and 6 were seen to have hung up on the North Core with their line 3 ends resting on the ground after the collapse as seen in Figure 95, (which is reproduced in Figure 93). This would not be expected to have occurred if they had first lost their support adjacent to the North Core. It is concluded that the slab failures at level 4, 5 and 6 had most likely occurred due to the floors losing their supports along lines 2 and 3 as those columns collapsed.4
We note that Figure 95 in the Hyland/Smith report, which is reproduced in Figure 93, shows that the floors of levels 5 and 6 are leaning against the north wall complex opposite walls C, C-D and D but not to the east of this. This could be explained by failure of the drag bars and by partial disconnection between the floors and the wall in the region between the finger walls of C and D, with complete disconnection occurring when the slabs collapsed as a result of the failure of the columns on lines 2 and 3.
In Scenario 1, Dr Hyland and Mr Smith identified a column on line F, the east side of the building, as the most likely location of the critical column that initiated the collapse. In Scenario 2 they indicated that one of the heavily loaded internal columns on lines 2 or 3 may have failed due to excessive axial load. This deduction was in part based on the low concrete strengths that they had measured in core test samples taken from the remains of the columns after collapse. Later evidence indicated that these test results were in all probability on the low side and not representative of the actual concrete strength in the columns. We have discussed this in section 2.3.4.
As previously noted the third scenario postulated by Dr Hyland and Mr Smith was failure due to total disconnection between the floors and the north wall complex. As with the previous cases this is a possibility, but clearly not one that the authors felt was likely to have occurred. Scenario 4 is similar to the third but involves the additional failure of the drag bars which were at the higher levels. Again the authors clearly felt this was unlikely.
The Royal Commission accepts that all four collapse scenarios described by Dr Hyland and Mr Smith are possible.
7.2.2 Professor’s Priestley’s scenario Professor Nigel Priestley gave evidence that the columns on line F were unlikely to have acted as thefailure initiator. He considered it more likely that failure of the connections between the diaphragms and the north wall complex would have occurred early in the building’s response to the February earthquake. It was, in his view, “entirely possible” that partial disconnection in that location had already occurred during the September earthquake. Failure of the connection in the February earthquake would have increased the inter-storey drifts and this would have caused distress to a number of beam-column joints. Professor Priestley indicated that the beam-column joints were weaker than the columns. As a result,

yielding of the column reinforcement would have been largely confined to the beam-column region. The consequent spalling of concrete from the bottom of the joint zone would reduce the capacity of columns to support vertical loads and horizontal displacements. The failure of the connection to the north wall complex would result in an increase in displacement demands to the columns and the failure of internal columns. It was Professor Priestley’s view that the “failure of internal columns due to the combination of large displacements, spalling of concrete and high vertical loads (including vertical acceleration effects) would result in explosive failures of the columns and the beam-column joints”.
7.2.2.1 Discussion
We note that early failure of the connections between the floors and the north wall complex features in several scenarios. We consider that early failure of the drag bars is likely. From the photographs after the collapse it appears that the failure of the drag bars was the result of either the anchors between the steel angle and concrete slab failing or the failure of the reinforced concrete slab in which the drag bars were anchored. The slab was lightly reinforced with non-ductile mesh. Failure of the drag bar anchors or of the slab would be brittle as the connection had little ductility. Consequently it is likely that the drag bars would have failed in the first few seconds of the intense ground shaking in the February earthquake (see section 6.3.3). As suggested by Professor Priestley it is possible that some of the drag bars disconnected in the September earthquake.
Failure at the interface of a column at the lower surface of a beam-column joint due to spalling of the concrete is supported in other scenarios and we accept that it is a likely cause of collapse
7.2.3 Mr. Holmes’ scenarioMr William T. Holmes proposed a “refined collapse
scenario” in his peer review5 of the Hyland/Smith report into the collapse of the CTV building. He considered that a global collapse mechanism was caused more by the degradation of the beam-column joints than by column hinging. He said that joint degradation would have been “sudden and complete” and would have lead to a global collapse far more directly than column hinging because all moment capacity in the joint would be lost, gravity support for the columns would be lost and the joint could come apart, leaving only the weak floor topping to hold the floor plates together.
Mr Holmes referred to photographic evidence of almost universal joint failure and to the evidence of Mr Graham Frost, who noted that there were no intact beam-column joints to be found on the site after the collapse.
Mr Holmes said that failure of the beam-column joints would also lead to a more direct vertical collapse, while failure of the columns due to the formation of plastic hinges would have led to greater lateral sway as the floors collapsed. He noted the vertical collapse mode was consistent with eyewitness accounts and with the “folding over of the front [south] coupled shear wall into the centre of the building with only a slight tilt towards the east (see Figure 95). It was also consistent with several of the floor slabs leaning against the tower indicating that line 3 probably collapsed before these slabs lost vertical support from the tower [north wall complex] along line 4”.
Mr Holmes indicated that the beam-column joints were all potentially susceptible to joint degradation. However, he identified the beam-column joints on line A at the intersection with the beams on lines 2 and 3 as being particularly susceptible to rapid degradation due to the way the beam bars were hooked into the beam-column joints (see Figures 88 and 89 in section 6.3.5). He quoted the account of Mr Leonard Fortune (eyewitness 16 in the Hyland/Smith report) who saw the column at A-1 kick out as though it had buckled from what is believed to have been level 4 before it fell narrowly missing him. Mr. Holmes’ interpretation of that account is that there was a complete loss of strength of the joint zone, leading to a buckling-type failure of the column over two storeys.
Mr. Holmes noted that there was a lack of apparent yielding in the north wall and this was not consistent with the predicted drifts of the wall. From this he concluded that partial or complete separation of some of the floors would have occurred at an early stage in the earthquake. This would have led to increased drifts of the columns and greater structural actions on the beam-column joint zones.
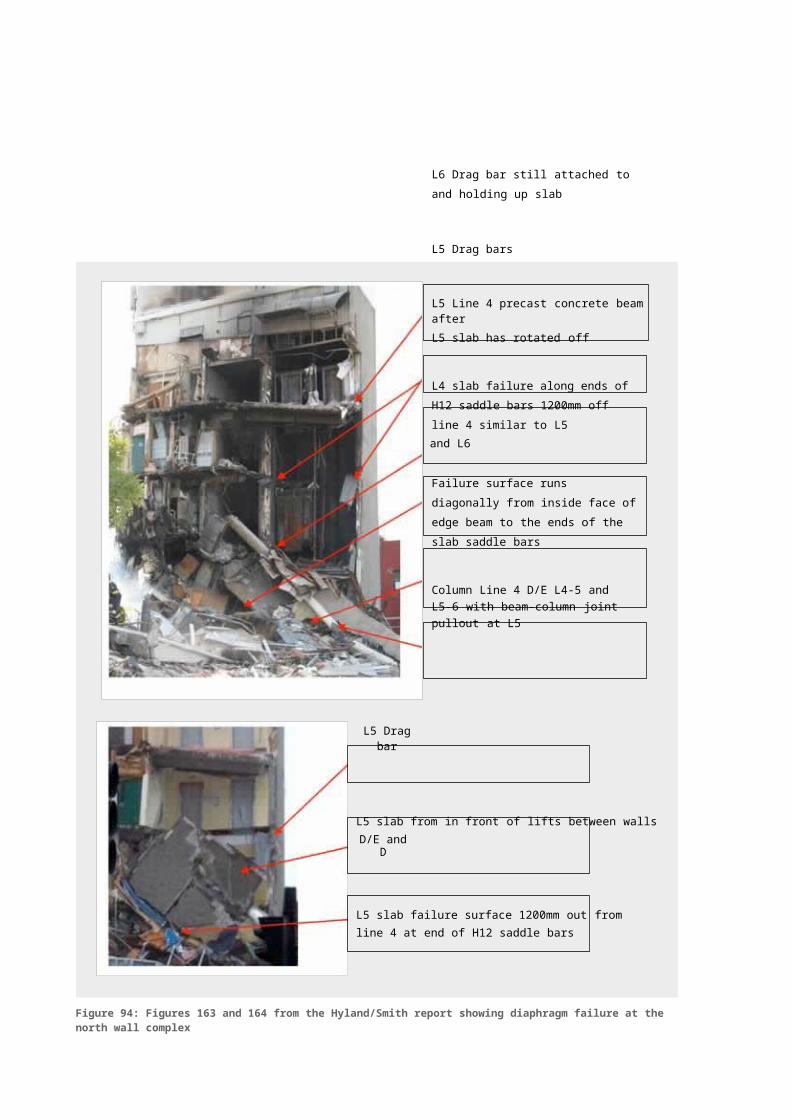
Figure 95: Aerial photograph referred to by Mr Holmes
Mr Holmes said that if the columns in the building had been better detailed, but the beam-column joints had not, the building would probably still have collapsed. However, if the beam-column joints were improved, both for shear and confinement so as to better tie the beams to the columns, the building may not have collapsed so completely, provided that the lateral loads were adequately transferred to both the north wall complex and the south shear wall.
7.2.3.1 Discussion
We consider that Mr Holmes’ scenario highlights some of the critical weaknesses in the building and that failure of the beam-column joints accompanied by partial disconnection of the floor slabs from the north wall complex was a very likely cause of the collapse.

7.2.4 Professor Mander’s scenarios Professor John Mander described three alternative gravity dominated collapse scenarios, namely:
• a collapse mechanism under east-west shaking;
• a collapse mechanism under north-south shaking; and
• a collapse mechanism under northward displacement.
7.2.4.1 Collapse mechanism under east-west shakingThe inter-storey drifts in the east-west direction predicted from in the non-linear time history analyses carried out by Compusoft3 were of the order of three per cent. Such displacements would have generated negative and positive moments in the beams on lines 2 and 3 where they were framed into the columns on line A. As illustrated in stage 1 in Figure 96, these bending moments would have generated cracks in the columns behind the hooked beam bars (see also section 6.3.5).
Professor Mander postulated that the positive moment rotation would have caused the concrete below the beam to spall, allowing the beam to drop (as shown in stage 2 in Figure 96) and become wedged between the columns on lines A and B. This action would have partially unloaded the support and transferred gravity loads to the adjacent column or columns on line B. Professor Mander proposed that, as the inter-storey drift decreased, the wedging action of the beam would have pushed the row of columns to the west as illustrated in stages 3 and 4 in Figures 97 and 98.
Professor Mander estimated that, including vertical load effects, there was an increase in axial load on the level 2 columns of 400kN, leading to the incipient collapse mechanism shown in stage 4 of Figure 97. He calculated that differential drifts of 1.15–1.3 per cent, depending on the concrete strength, would have been sufficient to cause a column or columns to fail. The final collapse mechanism is shown in Figure 98. Professor Mander noted that this mechanism is consistent with some of the eyewitness accounts.
Sequence
Stage 1The building sways to the west with a large velocity pulse. The E-W beams on column lines 2 and 3 at the west wall are required to form large negative moments that cause the joint core concrete andthe beam-soffit cover concrete to crush.
-M
W
Floor level
T
C
Column
Stage 2During the next half-pulse the building lurches eastward. The beam along line 2 and 3 pull away from the west wall and their line A column seats to form the alternating positive movement. Thecrushed cover concrete from the previous reversalspalls off and the beam slumps down a little, with +Ma partial or full loss of seating. Due to the loss of seating at the support line A there is a transfer of the previous gravity load from the tributary area of the beam onto the neighbouring columns on line B. This action an axial force increase of up to 40% the columns along line B.
Stage 3As the building attempts to return to an upright condition by moving west, the unseated beams are inhibited from fully returning due to the presence ofthe west wall.
Crushing
CE
T
BreakoutR 0
W
Gap
R=0
Figure 96: Professor Mander’s diagram of the trigger for the east-west collapse failure mode

Stage 4Permanent differential deformations remain that inhibit the columns along line B from remaining straight. This sets the columns up for a classic Euler buckling type failure, especially under further axial load derived from vertical accelerations andtheir consequent vibrations.
Level 6
Level 5
Pcr Level 4
West wall
Additional tributary load
Level 3e
PcrLevel 2
Pcr
e Level 1
Line B Line A
Figure 97: Professor Mander’s diagram of four-storey double bending buckling failure starting on column line Bleading to the east-west collapse failure mode
A B C D E F
654321
1 Beam seat fails 2 Incipient buckling 3 Collapse mechanism forms
Figure 98: Professor Mander’s collapse scenario diagram for east-west collapse mode

Floo
r in
ertia
Nor
th
0.5L
c =H
S1
Lc=2
HS
2 Upw
ard
acce
lera
tion
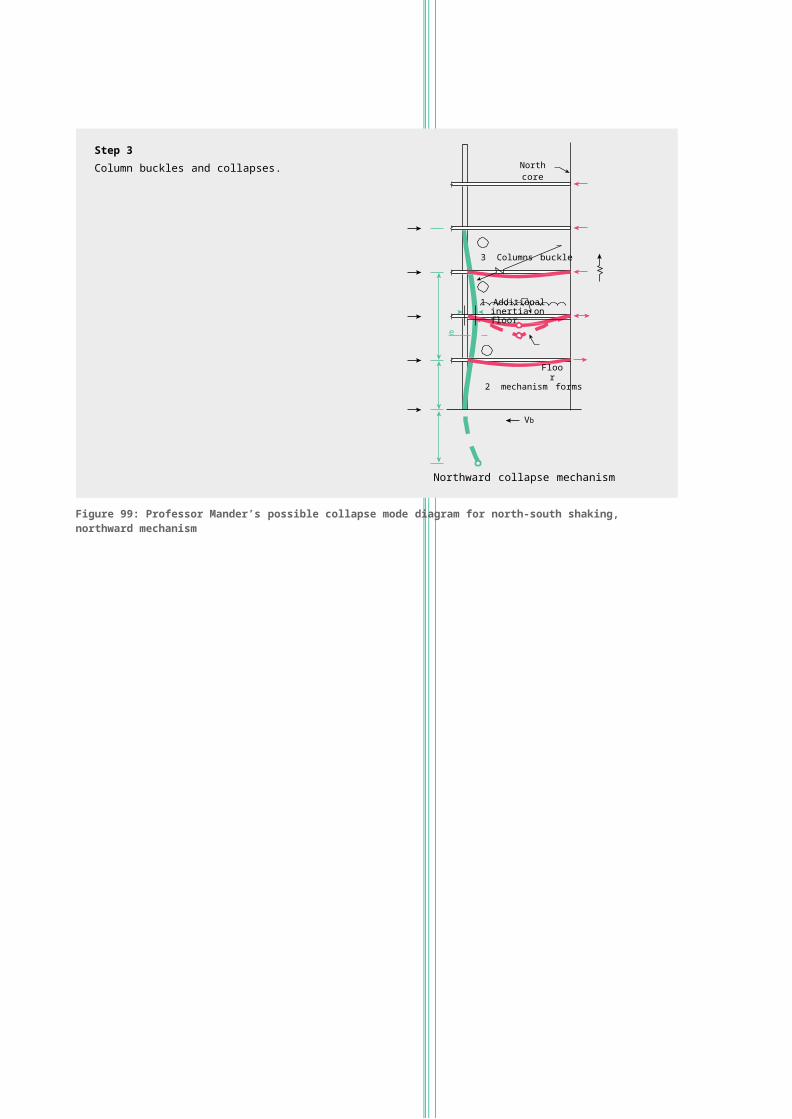
7.2.4.2 Collapse mechanism under north-southshaking, northward mechanismProfessor Mander postulated that the metal tray in the composite floor debonded from the concrete due to the high vertical acceleration. He suggested that this debonding could have resulted in the deflection of the floors associated with the hump on level 4 which was noted by Ms Margaret Aydon, Ms Marie-Claire Brehaut and Mr Ronald Godkin from King’s Education after the September earthquake and some subsequent aftershocks. This is an alternative explanation to that given by Mr David Coatsworth who believed deflection was due to differential shrinkage of the concrete, which was known to be a common cause of such slab deflections increasing with time.
This collapse scenario is based on the assumption that, in a strong northward earthquake pulse, the sagging floor in the bay between grid lines 3 and 4 would have sagged sufficiently due to gravity loading and vertical ground motion to cause it to fail due to P-delta actions (see Volume 1, section 3.2.5) when the floor was subjected to compression as it transferred inertial force to the north wall complex. Collapse of the slab would drag the columns on lines 2 and 3 towards the north resulting in a classic P-delta collapse of the columns, as shown in Figure 99. This figure shows the collapse being initiated by the sagging of a single slab, inducing a P-delta collapse mode in two or more storeys of acolumn or columns on line 3.
Sequence
Step 1Due to the lack of beams in the N-S direction and very high vertical motions, the in-plane stiffnessis low. The slab buckles downward due to a combination of upward vertical acceleration, and N-S sideway of the frame.
Step 2Because the slab buckles, and the columns lack lateral support in the N-S direction, a 4-storey, double bending column buckling mechanism forms.
Step 3Column buckles and collapses.
North core
3 Columns buckle
1 Additional inertia on floor
e
Floor2 mechanism forms
Vb
Northward collapse mechanism
Figure 99: Professor Mander’s possible collapse mode diagram for north-south shaking, northward mechanism

0.5L
c =H
S1
Lc=2
HS
=648
0
7.2.4.3 Collapse mechanism under north-southshaking, southward mechanismIn this scenario southward inertial forces drag the slabs towards the south leading to disconnection of theslabs from the north wall complex. It is suggested that the lack of drag bars on the lower floor levels (2 and 3) would result in the reinforcement thatconnects the floors to the north wall complex fracturing in low cycle fatigue, after one or two cycles of displacement. The disconnected floors would enable the columns on lines 2 and 3 to form a classic bucklingdeflected shape (see Figure 100). The buckling failure of the most heavily loaded columns on lines 2 and 3 would result in their axial loads being transferred to othercolumns, leading to complete collapse occurring.
Sequence
Step 1Due to the absence of drag bars in the lower stories, there is a large strain demand placed on the slab steel connecting with the North core. After one or two cycles the bars fracture due to low cycle fatigue.
Step 2The columns on lines 2 and 3 lack lateral restraint from moving independently southward, therefore they move away from the north core. A double- bending column buckling mechanism forms in the lower four stories.
Step 3Several columns buckle and the structure collapses downward.
North core
TUpper floors
in tensionT
3 Columns bucklee = Eccentricity
Floor inertia force2 Wall floor
separation
Vb
Phantom buckle effect on lower story
Southward collapse mechanism
Figure 100: Professor Mander’s possible collapse mode diagram for north-south shaking, southward mechanism
7.2.4.4 DiscussionThe Royal Commission accepts that two of Professor Mander’s proposed failure mechanisms are possible, but unlikely.
We consider the first mechanism to be an unlikely initiator of the collapse. However, we do accept that the failure of the beam anchorage into the column is very likely to have contributed to the collapse of the building.
The differential movement of the column on line B relative to the column on line A, as shown in Figures 97 and 98, implies that the floors provide very little resistance to lateral displacement. This could only have been the case if the floors were
disconnected from at least one of the structural walls on lines 1 and 5. The elongation associated with the formation of the crack behind the hooked beam bars in the column, or alternatively the wedging action of the beam when it settles due to the spalling of concrete, would have induced axial forces in the beam that spans between the columns on lines A and B. However, it is not clear why this should push all the columns and floor slabs to the east of line A towards the east but not push the single column on line A tothe west. It may be noted that there is little holding the columns on line A into the building. As the building sways in the east-west direction it is likely that cracks that separate the beams from the columns, which are illustrated in stages 1 and 2 in Figure 96, would develop

over the height of the column. Once these cracks have formed, all that is holding the column to the floors are the 12mm starters at 600mm centres, anchored into the 140mm-wide precast beams on levels 2 and 3, but not above level 3. Due to the narrowness of these precast beams and the ineffective way they are anchored into the columns (see Figure 89 in section 6.3.5), the starter bars would provide little lateral restraint to the columns. Above level 3 there is no reinforcement holding the columns into the floors except in the beams, which will have been broken out of the columns, as illustrated in Figure 96 and described above. We do not accept this as a possible failure mode.
The second collapse scenario depends on the floor slab being debonded from the metal tray, which it is postulated occurred in the September earthquake or in subsequent aftershocks. However, we find it difficult to envisage such complete debonding occurring unless the vertical accelerations were so high that load reversal occurred. The vertical accelerations in the September earthquake were considerably smaller than those in the February earthquake. However, even in February the response spectra for the four ground
motion records in the Central Business District (CBD)6
show that vertical accelerations for elastic response only exceed gravity for periods of less than 0.2 seconds. We consider that the combination of a high initial stiffness for the floor slab to sustain forces that were sufficient to debond the concrete from the metal tray, followed immediately by a very flexible slab necessary to enable a P-delta failure, is unlikely. Consequently we do not consider that this failure mechanism is likely to have occurred.
The third scenario is based on the assumption that the floors at levels 2 and 3 disconnected from the north wall complex and sway of these floors occurred until the columns collapsed in a P-delta mode. We accept this is a possible failure mode but consider it unlikely.
7.2.5 Closing submission from Alan ReayConsultants Ltd and Dr ReayIn closing submissions, counsel for Alan ReayConsultants Ltd (ARCL) and Dr Reay submitted that“the collapse probably initiated from the southern shear wall (leading directly to column and slab failure in the immediate vicinity followed by all elements save the north shear core)”. It was also submitted that collapse may not have occurred without the initial trigger of disconnection of the south shear wall. On this analysis the CTV building failed severely in part because of the damage caused by the September design level earthquake, which meant that the building, without repair, could not withstand the exceptional vertical and other forces experienced in the February earthquake.
A schedule titled “Probable collapse initiation mechanism” was attached to Mr Rennie7 QC’s written submissions. This set out the argument in support of this failure mechanism, including references to evidence and a series of diagrams. The schedule described reinforcing failure in the connections of the floor slabs to the south shear wall causing the slabs at that point to disconnect from the wall and collapse. A hinging effect on the beams at line 2 commencing at level 3 was illustrated in a diagram (see Figure 101).

1 2 3 4 5
A
B
Possible failure/hinge line
C
Pre February 22nd beam location Collapsing
section of floor slab
Floor slab hinge line
D
Beam and floor disconnection from wall
Floor slopes down
E Possible failure/hinge line
F
Figure 101: ARCL and Dr Reay’s “Probable collapse mechanism stage 1 – level 3”

1 2 1 2 1 2
Level 6 Level 6 Level 6
Level 5 Level 5 Level 5
Shear wall on Grid 1
Shear failure occurs at wall face allowing
floor to rotate
Floor rotates
Level 4
Level 3
Level 2
Shear wallon Grid 1 Slab connection
progressively falls
Level 4
Level 3
Level 2
Shear wall on Grid 1
Level 4
Level 3
Floor pushes on column and rachets downin earthquake pulses.
Level 2
Level 1 Level 1 Level 1
Probable collapse mechanism - stage 1February 22nd Earthquake Probable collapse mechanism - stage 2a
February 22nd EarthquakeProbable collapse mechanism - stage 2b
February 22nd Earthquake
Figure 102: ARCL and Dr Reay’s “Probable collapse mechanism”
The scenario is based on the premise that inter- storey drift of the order of 1.5 per cent would cause the reinforcement connecting the slab to the wall to fail, resulting in the slab on the third level collapsing onto the lower level as shown in Figure 102. It was postulated that this collapse would occur by hinging of the floor slab around the beams and columns on line 2, with the slab then acting as a prop that would bear against a column to cause it to bend and fail as indicated in the Figure 102. The schedule went on to say:
Once the collapse of the floors in that area occurred, it set in motion the collapse of the columns on line 2 (by the bending/buckling failure of the column/s). This occurred at the same time as the columns were subjected to additional high axial loads resulting from the very high vertical accelerations. The chain reaction that followed brought the building down.
The text includes a number of photographs of cracks in the coupling beams (see Figure 103) and it was submitted that some of the cracks were 2mm in width. In addition it was noted that Mr Coatsworth identified a few cracks in the south shear wall. It was suggested that the damage represented by these cracks would have contributed to the collapse of the building.

Figure 103: Cracking in south shear wall coupling beams (source: Leonard Pagan)
We do not accept that the cracks shown in the photographs or those identified by Mr Coatsworth were of significance in the collapse. We consider that if the cracks had been as wide as ARCL indicates Mr Coatsworth would have recorded their widths. We note that reinforced concrete has to crack to enable the reinforcement to work and crack widths apparent in the photographs do not indicate a significant loss of strength or seismic performance. The seismic motion in the February earthquake was considerably more violent than that in the September earthquake or in any of the aftershocks that occurred before 22 February. In the first few seconds of the February event more damage would have been sustained in the south shear wall and local floor areas than would have been induced in the previous events. We conclude that any damage sustained in the south shear wall and its connection to the floors would have had no significant influence on its structural performance in the February earthquake.
An inter-storey drift of 1.5 per cent in the north-south direction could be expected to generate a crack width just over 2mm at the level of the reinforcement. Tests have shown crack width of this order can cause non- ductile mesh such as the 664 mesh used in the CTV
floors to fail8. However, this would not cause failure of the slab wall connection. Eight high-strength ductile 12mm bars projected from the wall into each floor slab and these, together with the Hi-Bond metal tray (which the drawings show was supported on a 25mm ledge into the wall), would have maintained the shear strength connection between the floors and the wall.
Tests9 on high-strength 12mm bars extracted from the collapsed floor slabs have shown that this
reinforcement was ductile. Tests10 at the University of Canterbury have shown that such reinforcement can sustain crack widths of the order of 20mm before failure occurs. An inter-storey drift in excess of 10 per cent of the storey height would be required for this metal tray to be pulled out so as to cause collapse.
We believe that this proposed failure mechanism does not provide a valid explanation of the collapse mechanism of the building.

7.2.6 Mr Harding’s scenarioMr David Harding noted in his evidence that the Hyland/Smith report acknowledged that the vertical ground accelerations increased the axial loads on the columns and thereby reduced the column drift capacity. In Mr Harding’s opinion, this was “the key to why the building failed as it did”. Mr Harding said that, in hindsight, the structural design of the CTV building was vulnerable to the effects of severe vertical acceleration. He provided calculations showing levels of load on columns that indicated they were susceptible to failure when exposed to the level of loading produced by the February earthquake. He said it was possible that failure could have been initiated at any level in the building and that, once one floor failed, all of the floors would have pancaked.
Mr Harding was one of several witnesses that referred to the potential adverse effects of vertical accelerations on structural performance. That issue is addressed in section 7.3.1, and Mr Harding’s evidence is considered in more detail in section 7.3.1.3.
7.3 Contributors to collapseDr Reay gave evidence that “there are at least five scenarios” that in his opinion had not been adequately considered in relation to potential reasons for the collapse of the building. One of these, which related to building modifications, has been considered in other sections of this Report. The other four scenarios are addressed in this section.
7.3.1 Vertical accelerations
7.3.1.1 Introduction
Vertical accelerations alone have been considered as a primary cause of collapse, most prominently by Mr Harding. It has been recognised by many expert witnesses that the contribution of high vertical accelerations would have had a detrimental effect, exacerbating weaknesses in the structure.
The seismicity and ground motion aspects of the22 February 2011 earthquake have been examined in Volume 1 of this Report and details of the ground motions and associated response spectra are given in the report that we commissioned from Professor Carr6, “Inelastic response spectra for the Christchurch earthquake records”. In Volume 1 we note that the shallowness of the rupture and its proximity to the city contributed to the high vertical accelerations. Basin and topographical effects and the high water table are likely to have added to the shaking in the earthquake.
Vertical accelerations reached 2.2g, with horizontal accelerations of 1.7g in the Heathcote Valley (which was near the epicentre) and up to 0.8g in both the vertical and horizontal directions in the CBD. Three recommendations relating to vertical ground motion have been made previously by the Royal Commission. These are reported in Volumes 1 and 2 of this report.
All buildings in the Christchurch CBD were subjectedto vertical accelerations, however only the CTV building collapsed completely, in such a way that all slabs ended up on top of each other, leaving little chance of survival. Dr Reay accepted that it was the only building that collapsed in that manner.
Counsel acting for ARCL and Dr Reay submitted that it will never be possible to say with certainty how the CTV building site reacted in the February earthquake, despite the investigations that they commissioned. ARCL and Dr Reay arranged for a strong ground motion instrument to be deployed at the CTV site in March 2012. Dr Brendon Bradley noted that the ground motions recorded from this instrument could be compared with those concurrently observed at nearby Geonet strong motion stations in order to ascertain whether there were any peculiarities in the ground motions at the CTV site. The ground motion amplitudes of earthquakes measured after March 2012 were small relative to the September and February earthquakes. Therefore the effect of non-linear soil response was not as evident in the recordings for these smaller earthquakes.
Dr Bradley co-authored a paper11 published in the Bulletin of the New Zealand Society for Earthquake Engineering on the strong ground motions observed in the February earthquake. In that paper it was noted that the large vertical ground motions observed were the result of the significant number of near-source recordings rather than any event-specific features. In a technical report12 prepared for the Royal Commission, Dr Bradley assessed the ground motion aspects of the February earthquake related to the CTV building. Figure 104 illustrates the response spectra of vertical ground motions at the four CBD measuring stations in proximity to the CTV site. High vertical accelerations were recorded in the short period range, below 0.5 seconds. Dr Bradley’s report established that the results of the four Geonet stations (that is, CCCC, CHHC, CBGS and REHS) were appropriate to model the ground motion at the CTV site in the September and February earthquakes. The REHS site had not been included
in the first Compusoft analysis13, which formed the basis of the Hyland/Smith report. The Bradley report did not indicate any unique peculiarities at the CTV site, which would have substantially increased site ground motions.

Pse
udo-
Spe
ctra
l acc
eler
atio
n, S
a (g
)
322 February 2011 CBGS
2.5
2
1.5
1
0.5
Vertical component CHHC CCCC REHS
00 0.2 0.4 0.6 0.8 1
Period T (seconds)
Figure 104: Response spectra of vertical ground motions observed during the 22 February 2011 earthquake(source: Brendon Bradley9)
7.3.1.2 Non-linear time history analyses
The effects of vertical accelerations were modelled in the Compusoft13 non-linear time history analyses. In the second report3, prepared for the Royal Commission, the maximum variation in column axial load is shown in Figure 105. This Figure gives the predicted values for the internal column at the intersection of line C and line 2 when the analyses were run using the ground motion records obtained at the CBGS and CCCC Geonet stations.
Compusoft found that the CCCC ground motion record produced a much larger variation in the predicted axial loads in the columns than the corresponding values obtained with use of the CBGS record. This can be attributed to the difference in frequency components between the two records and the magnitude of the vertical accelerations present in each. Compusoft noted that the peak axial demands may not be concurrent with the peak bending actions that occur as a result of building drift. Consequently, when assessing vertical earthquake demands, consideration should be given to concurrency of actions.
Forc
e (k
N)
Axi
al L
oad
(kN
)
Forc
e (k
N)
She
ar F
orce
(kN
) / B
endi
ng M
omen
t (k
Nm
)
3500
3000
2500
2000
1500
1000
500
0
-500 1 2 3 4 5
3500
3000
2500
2000
1500
1000
500
0
-5001 2 3 4 5
Max Axial ForceAxial Force dueto gravity loadingMin Axial force
(a) CBGSLevel
(b) CCCCLevel
Figure 105: Column C2 axial load variation, 22 February earthquake (source: Compusoft Engineering)
Mr Smith (co-author of the Hyland/Smith report) presented in evidence a plot of the concurrent actions of shear, axial load and bending moments in a column at level 1 at the intersection of lines D and 2 during the February earthquake. The axial load (blue line), shear force (red line) and bending moment (green line) plotted against time are shown in Figure 106.
3000 250
2500
2000
1500
1000
500
0
Axial Load (kN) Shear (kN) Moment (kNm)
0 1 2 3 4 5 6 7 8 9 10 11
Time (seconds)
200
150
100
50
0
Figure 106: Predicted concurrent actions in column D-2 at level 1

The design column gravity load assumed to apply with seismic load combinations is around 1700kN, which is the starting point for the blue line. The vertical oscillations are caused by vertical accelerations. Mr Smith mentioned that the damping value adopted was low and higher damping was used in subsequent analyses. He noted that vertical vibrations tend to decay earlier with higher damping values and there is therefore probably a slight overestimate of the effect of vertical accelerations. Mr Smith explained that this analysis is not exact and requires consideration of trends and general performance indicators. In particular he was looking for concurrent peaks of actions which may give critical conditions.
Dr Bradley stated that the effects of the sub-surface soils were modelled by Compusoft simply as linear springs with tension gapping. This soil-structure modelling was crude in comparison to the non- linearities modelled in the structural elements. He said at the least, a sensitivity study should have been considered. Soil non-linearity occurs at infinitesimal strains, and therefore plastic deformation of soils is essentially always occurring. Dr Bradley indicated that the elastic springs representing soil deformation did not match actual behaviour, which would have been inelastic from low strain levels. However, more refined models were not readily available.
We consider that the soil-structure interaction can have a significant influence on the vertical accelerations transmitted into the structure. Inelastic deformation of the soil should increase effective damping and this might significantly reduce vertical excitation actions.
Furthermore Dr Bradley explained that the beam- column joint model used by Compusoft did not consider the time varying effect of axial load, which is known to be significant as a result of significant vertical acceleration.
Mr William T. Holmes agreed that vertical accelerations probably had some detrimental effect on the overall response of the CTV building in the February earthquake. However, he had not seen a method of definitively combining the vertical effects with lateral effects. He said it is very hard to do and had doubts as to how the non-linear time history modelling would try to combine all these things.
7.3.1.3 Mr Harding
Mr Harding stated that vertical acceleration increased axial loads on the columns, thereby reducing the column drift capacity and that this was an explanation to why the CTV building failed as it did. He went on to note that a number of eyewitnesses had referred to an upwards jolt at the outset, which was a manifestation of vertical acceleration. This was consistent, in his view, with vertical acceleration effects overloading all of the columns on one storey at a similar time causing sudden and rapid collapse rather than a progressive collapse.
Mr Harding referred to a photo taken by Mr Becker(see Figure 107), which shows books stacked up on steel trestle tables in the IRD building, at 224 Cashel Street directly opposite the site (we discuss the IRD building in section 6.5.3 of Volume 2). He observed that the lateral forces have not been sufficient to dislodge the books, however it appears the tables have a major sag in the middle “as if the books had tripled in weight”. He said this showed the site was subject to very high levels of vertical acceleration.
Figure 107: Bookshop in the IRD buildings after theFebruary earthquake (source: Ross Becker)
Mr Harding said there was no provision for vertical
acceleration in buildings in NZS 4203:198414 and, in hindsight, the structural design of the CTV building was vulnerable to the effects of severe vertical acceleration because it had heavy floors. In evidence he gave his prediction of the actual axial loads on the internal columns due to the recorded vertical accelerations. He also reproduced his 1986 calculation of the design axial load. At level 1 (ground floor) he had the following loads:
• dead load, D = 1522kN;
• reduced live load, LR = 352kN;
• total unfactored load, D + LR = 1874kN; and
• design load, 1.4D + 1.7LR = 2729 kN.

Mr Harding then stated that the column capacity as designed was 3100kN. In Mr Harding’s 1986 calculations he used axial-moment interaction column design charts to check that the column capacity was greater than demands. However his calculations did
not satisfy Clause 6.4.1.5 of NZS 3101:198215 for the maximum design axial load in compression. This clause required the design axial load to be less than 0.8P0 , which equates to 2460kN where P0 is the
crush load for the column. This value is less than the design load of 2729kN. Therefore Mr Harding’s column design in 1986 did not comply with NZS 3101:1982.
Mr Harding claimed that the axial loads induced by vertical accelerations recorded at two adjacent ground motion stations had been shown to be well above the column capacity (which he stated as 3100kN), and were high enough to initiate failure. He noted that the CCCC and PRPC stations recorded 0.79g and 1.88g vertical acceleration, which gave actual loads on the column of 3354kN and 5397kN, respectively. However, the PRPC strong motion site is located well outside the CBD and close to the epicentre of the February earthquake. It was not considered appropriate for comparison to the CTV
site in a report by Dr Bradley12. We agree with Dr Bradley.
Professor Priestley explained the complexities of estimating the effect of vertical movements. He said it is unlikely that the different floor levels and the different bays of the floors at a given level would respond synchronously. Thus determining the effect of vertical acceleration by simply factoring up the axial loads on the columns by an assumed vertical acceleration response factor would be an extremely crude approach.
The second set of NLTHA analysis3 used four ground motion site records, with the REHS being included. The Compusoft analysis (see Figure 105 above) gave a maximum axial load of around 3200kN for an internal column at level 1. Mr Harding calculated an actual column load of 3354kN from vertical acceleration, which was close to the predicted NLTHA value. However the axial load at which concrete crushing occurs is above this value of 3354kN. With no strength- reduction factors the column capacity is of the order of 4400kN, assuming f c of 35MPa with a column diameter of 400mm and six
H20 longitudinal bars. Further concrete strength testing has found the concrete to be at or above the specified strength (see section 2.3.4).
The Royal Commission does not consider that vertical acceleration by itself was a primary cause of collapse, principally because the maximum axial column demand (in the order of 3200–3400kN from the Compusoft analysis and Mr Harding’s calculation) is less than the
column concrete crushing strength of 4400kN at level 1. The demand calculated by Mr Harding is based on the peak ground motion. The Compusoft NLTHA analysis is a more refined estimate. It should be noted that the Compusoft estimate (~3200kN) is the peak, or maximum, over the whole earthquake record and that vertical movements are high-frequency (rapid) motions. Furthermore the speed of loading and lower characteristic concrete strength specified may give a column capacity higher than theoretically calculated.
Mr Harding contended that if the building had been designed for the degree of vertical acceleration that it was subjected to, it would have made a significant difference to the size of the columns. However an increase in column size may not have had the positive effect Mr Harding was implying, because of the increased seismic actions that the stiffer member would have attracted.
7.3.1.4 Dr ReayDr Reay expressed the view that the lateral load resistance, or stability, of the southern wall was dependent on the gravity restoring force provided by the floor, and vertical accelerations would potentially increase or decrease this force. He said that if this force was substantially diminished at the same time as there was a significant lateral load on the wall, the wall would tend to commence overturning and allow a significant rotation in the south side of the building. He said collapse initiated by this scenario is highly feasible.
We note that the south wall tributary area for gravity loads is about a fifteenth of the total floor area, while close to half of the floor contributes lateral seismic inertial forces on the wall. Consequently the gravity loading is relatively small compared to the lateral seismic inertial forces.
Dr Reay anticipated a fundamental building period of 1.2 seconds in the east-west direction. The fundamental period for the vertical stiffness of the wall is much lower, about 0.2 seconds. The response spectra for vertical accelerations (see Figure 104) give a peak vertical acceleration of between 1.0g and 0.5g.
We note that the acceleration in the upward direction would last for 0.1 seconds before reversing in the opposite direction for a further 0.1 seconds. At the same time the wall would be vibrating backwards and forwards with a period of about 1–1.2 seconds. The vertical upward acceleration would increase the axial load on the wall and increase its lateral strength for the 0.1 seconds followed by a decrease in lateral strength when the downward acceleration occurs in the following

0.1 seconds. The overall effect on the lateral performance of the wall would be negligible.
We do not consider that the high-frequency accelerations can have had any significant effect on the overall stability of the south wall.
7.3.1.5 Professor ManderProfessor Mander described the February earthquake as having exceptionally high vertical accelerations. In response to comments from Professor Priestley he conceded that the September vertical accelerations were very high, but not exceptionally high. Professor Mander considered that while the exceptionally high vertical motions were not the sole cause of failure, they would tend to vibrate vertical load bearing elements, such as the columns and floor slabs, and add considerably to the resulting damage.
Under questioning from Mr Mills QC, Professor Mander accepted that no one had established exactly what the effects of the vertical accelerations were. He agreed that the way a building reacts to vertical forces is affected by factors such as previous cracking in the floor slabs, how those floors respond, distribution of live loading and the axial flexibility of the columns. This makes it a complex task to estimate the vertical period. Professor Mander agreed that the CTV building had a significant number of structural weaknesses and that vertical accelerations would have exacerbated these existing weaknesses. Dr Bradley observed that the vertical accelerations increase the demand imposed already by horizontal ground motions and that if a structure is particularly vulnerable, for example because of a lack of ductile detailing, then the additional effect of vertical accelerations will probably be more important than for structures that are well-detailed.
Many of Professor Mander’s collapse scenarios included concurrent vertical vibrations; however, these were ancillary to the primary mechanism. Professor Priestley did not find any of Professor Mander’s scenarios very convincing, considering that they rested on a number of assumptions that were asserted as facts. Professor Mander claimed it was “inevitable that the two displacement and force maxima would coincide momentarily producing extremely high loading and stress demands on the materials”. Professor Priestley disagreed with this statement, citing the non-linear time history analysis results to show this was not strictly correct. Professor Mander later said that a vertical load peak will coincide with large drifts, but acknowledged that the peak values will not coincide exactly.
Mr Brian Kehoe did not consider that vertical accelerations in the September earthquake would have had any effect on the building because the amount of vertical acceleration was relatively small compared to the design level gravity forces that the structural elements were designed to resist. While the February vertical accelerations were significantly higher, he did not believe they were the primary cause of failure because they were rapid movements and they had to overcome the design gravity load of the elements. He referred to studies he had been part of in the past, including analyses of several buildings for the effects of vertical acceleration. These were found to be minor compared to the vertical design loads (that is, the maximum gravity and live load combination) of structural elements.
Mr Holmes commented on Professor Mander’s suggestion that the floor slab connection to the precast beams was broken at the negative moment areas over the beam during the September earthquake. While he was unsure what Professor Mander meant by “broken”, he thought it unlikely that this could occur given the ductile reinforcing in this location. He assumed it to mean that the moment fixity to the beam was broken, resulting in an increase in the displacements. Professor Priestley said if Professor Mander was suggesting that the reinforcement yielded and reduced the moment fixity, then the displacement would be much less than the 500 per cent claimed by Professor Mander. Hysteretic behaviour would have further reduced response by increasing the effective damping associated with inelastic deformation. Professor Mander conceded that it would only have been an increase of 400 per cent if the reinforcement had fractured reducing the support conditions to that of a simple support.
The Royal Commission’s calculations show that the vertical accelerations would not “break” the moment connection of the slabs to the beam as the accelerations do not appear to be sufficient to reverse the direction of the bending moments at the supports. Furthermore we do not accept that the ductile 12mm bars above the beams would fracture under the action of gravity loading and vertical seismic forces. It seems unlikely that the floor slab would fail in P-delta actions, which would be required to trigger this failure mechanism.
7.3.1.6 Other opinions on vertical ground movements
Mr Graham Frost, whose evidence we discussed in section 5.1, postulated that beam-column joint failure was a very likely scenario if the building was subjected

to very high vertical accelerations. He also raised the possibility that vertical accelerations may have been high enough to raise the gravity load moments in the slabs to the level where the slabs failed in simple bending, either through the loss of bond between the metal decking and slab concrete or through tension failure of the metal decking.
We consider that the reinforcement in the slab would have been sufficient to prevent complete collapse even if the metal tray had fractured and therefore we do not accept the postulate that the slabs could fail. However, we do accept the possibility that the high vertical accelerations may have influenced failure of the beam- column joints (see section 6.3.5).
Professor Priestley saw photos of column failures that he thought tended to indicate failure occurred at the top of the splices, probably due to high vertical compression force. However, in his opinion a more likely collapse scenario is that which is reported in section 7.2.2.
Professor Carr stated that based on the revised non- linear time history analysis, the building collapsed due to the inability of the heavily loaded interior columns to carry their imposed vertical loads when subjected to the effects of inter-storey drifts. He said that a large variation of actual forces due to the very large vertical accelerations may also have had a part to play in the column failure.
Counsel assisting the Royal Commission submitted that while vertical forces may well have had a contributing role, the exact vertical forces to which the building was subjected are not known. Counsel for Dr Reay and ARCL contended that focusing on “critical structural weaknesses” minimised to an unreasonable degree the important effects of extremely high vertical accelerations.
We accept that vertical seismic forces may have had an influence on the collapse mechanism and this is recognised in section 6.3.5.
7.3.2 Cumulative damage, low-cycle fatigue, strain hardening and strain ageingThe phenomena of cumulative damage, low-cycle fatigue and strain hardening have been referred to on numerous occasions during the course of the hearings. They are discussed in section 3.5.7 in the context of Mr Coatsworth’s inspection of the building after the September earthquake. They are examined as a probable collapse scenario or contributor to collapse. There was some lack of clarity in the discussion of these concepts in the evidence of the expert witnesses.
7.3.2.1 Cumulative damage
Dr Reay said that during the Canterbury earthquake sequence he had observed cracks in several buildings that were originally limited in extent and crack width. Over time these cracks had gradually increased in number, length and width. He gave the shear walls in the IRD building as an example. He said this change had occurred progressively due to aftershocks. In his opinion, the ongoing sequence of aftershocks continued to cause cumulative damage to reinforced concrete buildings, each significant aftershock reducing the capacity of the building to some extent.
In the United States, guidance on evaluating the damage and analysing the future performance of concrete wall buildings is given in FEMA 30616. This report was prepared by the Applied Technology Council (ATC-43 Project) in 1998. Mr Kehoe and Professor Mander were both ATC-43 Project participants. Mr Kehoe explained that studies made as part of the FEMA 306, 307 and 308 process examined whether previous earthquake damage would affect a building’s ability to resist further earthquakes. The prologue section of this report concluded as follows:
Damage may not significantly affect displacement demand in future larger earthquakes.
One of the findings of the ATC-43 project is that prior earthquake damage does not affect maximum displacement response in future, larger earthquakes in many instances. At first, this may seem illogical. Observing a building with cracks in its walls after an earthquake and visualizing its future performance in an even larger event, it is natural to assume that it is worse off than if the damage had not occurred. It seems likely that the maximum displacement in the future, larger earthquake would be greater than if it had not been damaged. Extensive nonlinear time history analyses performed for the project indicated otherwise for many structures. This was particularly true in cases in which significant strength degradation did not occur during the prior, smaller earthquake. Careful examination of the results revealed that maximum displacements in time histories of relatively large earthquakes tended to occur after the loss of stiffness and strength would have taken place even in an undamaged structure. In other words, the damage that occurs in a prior, smaller event would have occurred early in the subsequent, larger event anyway.
Mr Kehoe’s opinion, after reviewing the damage assessment made by Mr Coatsworth, was that the4 September and subsequent aftershocks up to the time of the inspection on 29 September 2011 had no effect on the capacity of the building. Mr Kehoe explained that a finding of the ATC-43 investigation was that, in some cases, damaged buildings performed

better in a subsequent earthquake because they were “softer”. In some cases the damaged buildings performed slightly worse. However, there was no real evidence that damage in one event would cause a building to perform worse in a future earthquake of similar magnitude.
Professor Mander agreed that in order for the CTV building to have undergone relevant low-cycle fatigue it must have sustained physical damage, although that damage might have been hidden. He considered damage was not “hidden” simply because it was not readily examinable. Under questioning Professor Mander said that more sophisticated techniques, such as ultrasonic tomography, may be necessary to confirm there is no damage. He claimed that hidden damage may include reinforcing steel that appears from visual inspection to be in good condition after many cycles of loading but on a further cycle a fatigue crack may appear in the steel. He cited the beam-column joint as a region where hidden damage may occur but conceded that tension induced into the joint zones by reinforcement that was anchored by hooks in the mid-region of the joint could cause cracks to form. He noted that the presence of the precast elements may have hidden this cracking from view. Mr Coatsworth inspected the beam-column joints on the lower levels and the external beam-column joints and did not see any visible signs of distress.
The NLTHA panel produced two sets of comparative analyses to assess the likely effect of the damage sustained in the September earthquake on the building’s performance in the February earthquake. It was found that there was very little difference in projected performance assuming the building was undamaged at the start of the February earthquake and analysing the building subjected first to the September and then to the February earthquake. In the September earthquake some inelastic deformation was predicted to occur and potentially some drag bar disconnection may have occurred.
Dr Bradley noted that the NLTHA modelling limitations were such that cumulative damage could not be assessed in the beam-column joint models. Professor Carr said such beam-column joint models were not available in SAP2000, the programme used in the analyses. He also noted that there are no recognised techniques for modelling two-way interacting beam-column joints and there is little research on the structural configuration of the joints used in the CTV building. Therefore, there will always be considerable uncertainty as to the adequacy of any joint model. Professor Carr stated that if
accumulative degradation is considered thenmore damage will concentrate in the joint and less in the columns.
We note that comparative non-linear time history analyses were made using a simplified analytical model of the Hotel Grand Chancellor. These analyses are discussed in section 3.5.3 of Volume 2. The analyses indicated that the predicted damage sustained in the building in the September and Boxing Day earthquakes made very little difference to the predicted performance of the building in the February earthquake.
Professor Mander17 produced a table of significant aftershocks felt in Christchurch earthquakes between 4 September 2010 and 22 February 2011. Significant earthquakes for the purposes of this list were those of magnitude 5 or higher. This table gave the peak ground acceleration but it gave no indication of the associated response spectra, information that is required to gauge the likely structural effects of the earthquakes. A letter18 dated 15 June 2012 from counsel representing ARCL and Dr Reay suggested that the NLTHA should include modelling of significant earthquakes between September and February so that cumulative fatigue effects could be considered. The only comments from the NLTHA panel came from Professor Carr and Dr Barry Davidson. Professor Carr noted that magnitude 5 earthquakes are two magnitudes smaller than the September earthquake and hence a thousand times smaller in terms of energy released. Most earthquakes on Professor Mander’s list were at similar distance from the CBD as the September events, with the exception of the Boxing Day 2010 earthquake. A study by Professor Carr using the Boxing Day earthquake on a similar shear wall building in the CBD showed that the building’s response to that earthquake, when compared with the September and February earthquakes, was insignificant at the “noise level”. Dr Davidson commented on the significant time it would take to perform an analysis that put the building through many more earthquakes.
We consider it probable that any damage that may have occurred in prior earthquakes would have been induced in any event in the early stages of the subsequent larger February earthquake. In our opinion any pre-existing damage would have made very little difference to the performance of the building in the February event, and any damage that had been sustained in previous earthquakes was not a primary cause of collapse.

We note from our study of the representative sample of buildings, which is described in Volumes 2 and 4, that there are two types of structure.
• There are brittle structures, which give little warning in terms of apparent damage before collapse occurs. These buildings include the PGC building, unreinforced masonry buildings and concrete buildings, which have low reinforcement contents such that yielding of reinforcement in a wall is confined to a single primary crack.
• The second type of building is ductile. In these buildings cracks may form and extend in aftershocks but because the reinforcement is ductile there is no loss of strength. There can be some stiffness degradation. These ductile structures are relatively insensitive to accumulated damage, as this can only occur by low-cycle fatigue. We note that while low-cycle fatigue has been seen in tests it only occurs under extreme conditions (see section 7.3.2.2).
7.3.2.2 Low-cycle fatigue and strain hardeningDr Reay stated that “reinforcing strain hardening” was a “collapse consideration”, which required further attention. He said ARCL had found reinforcing steel that had been subject to strain hardening in several shear wall buildings with bar yielding being limited to a very short length, about 1–2 bar diameters, along the reinforcing steel. He indicated that this short length of yielding prevented the extent of elongation necessary to reach the level of ductility assumed in the code. He referred to a loss of capacity of about 40–50 per cent, depending on the degree of strain hardening.
In Dr Reay’s view strain hardening in the CTV building could have potentially caused a materially different response than that predicted by analysis. He stated that the floor diaphragms and shear walls in the building may have been subject to reinforcing fracture.
We note that the issue of strain hardening and the premature failure of reinforcing bars due to strain concentration in some shear walls was considered in some detail in section 8 of Volume 2 of our Report. This is not an issue that could affect the performance of the structural walls in the CTV building as it can only arise where reinforcement content is low. This is not the case in the structural walls of the CTV building.
We note that strain hardening is an essential feature in the design of reinforced concrete as it causes yielding to propagate along the length of the reinforcing bar, allowing plastic hinges to form. The higher the strain
hardening characteristic of reinforcement, the more the yielding will spread. Questioned by Commissioner Fenwick, Dr Reay agreed that strain hardening actually had beneficial effects and it is not strain hardening “per se” that is modifying the propagation of yielding through reinforcing.
The phenomenon of strain hardening alone has no adverse effects on the structure and therefore it did not contribute to collapse. Professor Mander proposed low- cycle fatigue as a surrogate for strain hardening. He said that any steel that is strained under reverse cyclic loading is suffering low-cycle fatigue.
In previous hearings the low-cycle fatigue phenomenon was described by a simplified paper clip analogy. If the paper clip is bent back and forth it will eventually break after a few cycles. Professor Mander explained that structures that undergo extreme loadings such as occur in earthquakes can sustain low-cycle fatigue.
The material behaviour of steel for low-cycle fatigueis in the inelastic (post-yield) range. Professor Mander agreed that the number of cycles that the reinforcing steel will go through before it starts to suffer strain damage depends on the amplitude of the strain to which it is exposed. Steel typically starts to yield at about 0.002 per cent strain and strain hardens at 1.0–2.5 per cent strain. In a paper written by Mander et
al.19 It was noted that if the steel is loaded to a strain of three per cent then it can undergo four full tension compression cycles before suffering fracture. This level of strain is well into the strain hardening range. Professor Mander said that if the September shaking was large enough to cause yielding but not strain hardening, the steel might be expected to undergo about 50–150 cycles before fracturing.
Mr Kehoe stated that in order for strain hardening to occur there has to be a large amount of strain in the reinforcing steel. For that strain to occur there necessarily has to be cracking in the concrete, which would be visible. Mr Kehoe explained that, even if hidden by non-structural elements, the effect of large cracking is such that it would be visible elsewhere in the finishes, and in other portions of the building. Mr Kehoe considered that the fact that Mr Coatsworth did not see cracking in some areas was an indication that any cracking that may have occurred was going to be small.
Dr Hyland said he observed low-cycle fatigue fractures in the 2010 Chilean earthquake. He said the steel tended to bend and buckle and he believed that, iflow-cyclic failures had occurred in the September

earthquake, there would have been visible evidence of major spalling of the concrete. However, there was no evidence of this.
We note that many tests of reinforced concrete beams and beam-column joints were carried out at The University of Auckland between 1980 and 2000. In many of these tests high strain levels (typically 20–50 yield strains) were induced in ductile longitudinal reinforcement under cyclic loading conditions. Low- cycle fatigue failure was observed to occur in only a few cases and only in situations where the bars had started to buckle and straighten out as they were subjected first to compression and then to tension during a load cycle. Buckling of the bars is always associated with extensive spalling as the buckling bars push the cover concrete away from the member.
While low-cyclic fatigue is a known phenomenon, we have seen no evidence that this occurred in the CTV building in the September or Boxing Day earthquakes. Evidence of high strain levels in the reinforcement would be associated with the formation of wide cracks in regions containing reinforcement and buckling, which would be associated with extensive spalling. Given the absence of such indications of damage and the short duration of strong motion in the earthquakes, we are satisfied that low-cycle fatigue was unlikely to be an issue in the performance of the CTV building.
7.3.2.3 Strain ageingStrain ageing was not an issue that was specifically raised in the hearing on the CTV building. Potential problems with strain ageing in reinforcement were described in section 8 of Volume 2 of our Report. We understand that the sensitivity of reinforcement that is available in New Zealand has varied significantly between differing reinforcement sources over the years. A paper on strain ageing of some recently manufactured reinforcement was briefly reviewed in Volume 2 of our Report. The reported test results indicated that strain ageing could have some effect on the performance of the reinforcement. In the circumstances, we considered it advisable to see whether the reinforcement used in the construction of the CTV building could have been adversely affected by strain ageing.
Holmes Solutions Limited9 was commissionedto investigate the strain-ageing characteristics of reinforcing steel from the CTV building. They reported that an appreciable number of research projects have been completed, which indicate that reinforcing bars can suffer the effects of strain ageing.
Holmes Solutions salvaged samples of 12mm diameter deformed reinforcing bars from the CTV building debris at the Burwood landfill. Two samples were cut from each reinforcing bar to give a matching pair. One sample from each pair was subjected to an initial level of pre-strain and then immediately tested to destruction. The other sample was pre-strained and then left to age for the desired period prior to undergoing a test to destruction.
It was found that two grades of 12mm diameter bars were used in construction. Thirty of the 36 samples had a lower characteristic yield strength of 517MPa with the other six samples having an average yield strength of 380MPa. The drawings specified grade, 380MPa for all the 12mm reinforcement in the building.
Holmes Solutions stated that results reported by previous researchers are often contradictory with regards to the extent of influence of strain ageing. Some of the reported research indicated changes of up to 25 per cent increase in peak stress and 30 per cent reduction in uniform elongation capacity.
The strain ageing testing results obtained from theCTV building reinforcing indicated the following trends:
• the ultimate strength of the strain aged steel samples was on average 5 per cent lower than non-aged samples;
• the average uniform strain capacity of the strain- aged steel was found to decrease when compared to the non-aged samples by nine per cent;
• there were no specific trends for both the ultimate strength and the uniform strain capacity of the samples with regard to the level of pre-strain applied to the steel, or the length of ageing period; and
• all the reinforcing bars that were tested were ductile, whether strain aged or not, and in all cases the strain at maximum stress exceeded 10 per cent. In many cases it was considerably greater than this level.
Our conclusion from these tests is that strain ageing of the 12mm bars in the CTV building would not have had a noticeable effect on the seismic performance of the building in the February earthquake.
7.3.3 Shake table testingDr Reay also gave evidence of his opinion that “there should be shake testing undertaken on a six degree- of-freedom shake table to investigate the overall behaviour and to recreate the structural failure of the CTV building”.

As testified by several witnesses, shake table testing would be an extremely difficult and expensive undertaking. If such a test was to be carried out it would be necessary to arrange for the use of a shake table in Japan or the USA. Then it would be necessary to build a scale model of the building. That would introduce numerous problems in terms of scale effects and therefore considerable doubt as to the validity of the test in representing the behaviour of the actual building. In such a model there would be a major issue in obtaining and installing strain and displacement equipment to effectively monitor the behaviour during the test.
We note that the weaknesses that led to the collapse of the building have been clearly identified. Some quasi-static model testing of the elements in the building might be justified. However, the urgent need for resources is not so much for research into structural weakness apparent in the CTV building but for finding other buildings that may contain similar faults.
7.4 Most likely collapse scenario Our conclusions on the most likely cause of the collapse of the CTV building are based on a review of the proposed collapse mechanisms presented by the expert witnesses (as described in this section), our assessment of the design calculations and the different structural elements in the structure (described in section 6).
There were two major weaknesses in the structure, which are identified below:
1. Mr Holmes, Professor Priestley and Professor Mander all identified the beam-column joints as being potentially weaker than the columns. This is consistent with our own assessment. All of the beam-column joints in the building contained a basic flaw. In every case the bottom beam bars were anchored into the columns by 90° hooks, located in the mid-regions of the beam-column joints. For the internal columns on lines 2 and 3, there was a small overlap between the hooked bars. This overlap was not sufficient to enable the tension force to be transferred into the compression zoneon the other side of the joint zone, which was essential for the load carrying capacity of the joint zone to be maintained under cyclic loading (see Figure 87 in section 6.3.5). In the external beam- column joints on lines A and F the hooked bars were
anchored short of the mid-section of the beam- column joint. In both the internal and external joint zones flexural tension forces in the beam bars would create tensile stresses in the joint zone. When the concrete cracked in tension there would have been little left to stop the hooked bar from being pulled out of the joint zone (see Figures 89 and 90 in section 6.3.5). This would have led to rapid strength degradation and a near vertical collapse of the floor slabs and beams. We note that all of the joint zones were susceptible to this failure mechanism and it is not possible to identify which beam-column joint zone would fail first.
The beam-column joint zones on lines 1, 2, 3 and 4 at the west wall (line A) were particularly vulnerable as both the top and bottom beam bars were anchored by hooks into the mid-regions of the beam-column joint zones. This vulnerability was pointed out by Mr Holmes and Professor Mander. There was little to hold the beams into the joints except one or possibly two 10mm ties once cracks had formed behind the hooked bars (see Figure 88 in section 6.3.5).
The most critical joint zone is likely to have been located where the inter-storey drift was greatest. Due to the high lateral stiffness of the north wall complex the highest inter-storey drifts would be expected to occur on lines 1 and F. The beam- column joints on line A, for drifts in the north-south direction, were particularly vulnerable but there may initially have been lateral stiffness from the masonry infill walls, which would reduce the north-south drift on the beam-column joint zones on levels 2 and 3.
There is a further possible failure mechanism for the internal beam-column joint zones on lines 2 and 3. As shown in Figure 87(e) in section 6.3.5, support to the beams may have been lost due to spalling of the concrete immediately below the beam support. Mr Frost suggested a mechanism similar to this due to the interface between the end of the beam and the in situ column concrete not being roughened, which prevented it from resisting shear by aggregate interlock action. We note that premature spalling of this supporting concrete ledge could have occurred by prising action of the beam when tension in the bottom beam bars opened up a crack at the interface between the in situ and precast concretes. This is discussed in section 6.3.5.

4
2. The second basic weakness was in the connection of the floors to the north wall complex. As discussed in section 6.3.3, there were errors in the design of the connections between the floors and the north wall complex. The design forces that were used to resist seismic forces in the east-west direction were approximately half of the values that would have been consistent with NZS 4203:1984. While the time history analyses predicted peak forces considerably in excess of the NZS 4203:1984 values, we consider it likely that, if connections had been provided through the use of ductile reinforcement, the ductility would have prevented complete failure of the connections. We note that the correct design values for seismic actions in the north-south direction were met after the addition of the drag bars. However, the drag bars lacked ductility and, as indicated by the non-linear time history analyses, the drag bar connections could be expected to have failed either in the September earthquake or near the start of the intense ground motion in the February earthquake.
We consider it likely that most of the drag barsfailed in the early stages of the February earthquake with some tearing of the floors near line 4 in the region between walls C and D, as illustrated in Figure 108. Partial disconnection of the floors by the loss of the drag bars and the tearing of the floors, in this way, would have greatly increased the flexibility of the load path between the floor and the north wall complex. This would account for the lack of damage to the north wall complex. The tearing of the floor from the north wall complex would have been completed by the collapse of the floors. This process would account for the remnant portions of the floors remaining piled up against the north wall complex after the earthquake.
C D N
5Stairs Lift shaft
Drag bar
Slab remnant@ L2,3,4 & 6 Slab remnant @ L6
Figure 108: Remnant slab profiles at north wall complex after February earthquake (adapted from Figure 43 of the Hyland/Smith report)

The failure of the drag bars and the partial disconnection of the floors from the north wall complex would have led to an increase in the inter-storey drifts in the structure. It is probable that the inter-storey drifts would have been sufficient to cause the collapse of the joint zones without the partial disconnection of the floors from the north wall complex. However, it is likely that this partial disconnection accelerated the failure of the building.
It is not possible for us to identify the critical beam- column joint that started the failure. However we note that the joint zones where lines 1 and 2 intersect with line A are particularly susceptible to failure, under east-west seismic ground motion, due to the hooks from both the top and bottom beam reinforcement being bent into the mid-region of the joint zones. The east-west shaking in the February earthquake was particularly strong. The failure of these joint zones and the resultant collapse of the beams may have been the reason why the collapse occurred from the south to the north.
We note that if the joint zones did not fail first, collapse would still have occurred due to the brittle characteristics of the columns, arising from their lack of confinement reinforcement. In our opinion collapse of the building can be accounted for without allowing for the additional forces induced by vertical ground motion. While this motion may have contributed to the collapse of the building we do not consider it to be the reason for the collapse.
The basic mechanics of beam-column joints were studied in detail starting from the late 1960s. By the mid-1970s there was a good understanding of the
basic load paths through beam-column joints 20.
In summary, it is our opinion that the CTV building collapsed in the February earthquake for the following reasons:
• the ground motion of the February earthquake was unusually intense although it was of short duration;
• the designer failed to:
– consider properly or adequately the seismic behaviour of the gravity load system. In particular no consideration appears to have been given to load tracking through the beam- column joint zones. The failure to consider this aspect led to joint zones that were easy to construct but lacked ductility and were brittle in character;
– ensure the columns were adequately confined so that they could sustain the required deformation without failure;
– determine the correct tie forces between the floors and the north wall complex and to track the load path between the wall and the floors;
– ensure the adequate connection of the walls on lines D and D–E to the floors to resist seismic actions in the north-south direction. While the addition of drag bars in 1991 remedied the non-compliance in the north-south direction, this was not the case in the east-west direction. In addition, the drag bars failed in the February earthquake, or possibly in the September earthquake, due to their lack of ductility; and
• the builder failed to roughen the interface between the ends of the precast beams and the in situ concrete in the columns, so that shear could be transmitted across the interface by aggregate interlock action. This was not picked up by those responsible for monitoring the construction works.
The design of the CTV building relied on the north wall complex and the south coupled shear wall to resist the lateral loads generated by earthquakes. The defects that have been identified and discussed above meant that in the strong shaking generated by the February earthquake these two walls were not able to function as the designer intended. We are satisfied from the eyewitness accounts that the collapse of the building would have occurred within 10–20 seconds of the commencement of the earthquake. It was a sudden and catastrophic collapse, as recounted by both survivors within the building and those who observed it from nearby. After an initial period of twisting and shaking all of the floors dropped, virtually straight down, due to major weaknesses in the beam-column joints and the columns. Eyewitnesses described the collapse as a “pancake” effect. The north wall complex was left standing, the floors having torn away and come to rest stacked up adjacent to its base. The south shear wall collapsed inwards on top of the floors in what we consider would have been the last part of the collapse sequence. The observed damage to both of these walls showed that they had not been able to perform their intended role.
Our analysis of the collapse is consistent with the eyewitness accounts.

References 1. Hyland C., and Smith, A. (2012). CTV Collapse Investigation for Department of Building and Housing: 25 January
2012. Wellington, New Zealand: Department of Building and Housing.
2. Catenary action can be envisaged by a chain or cable. The member is suspended from its end points and resists vertical loads by hanging in tension.
3. Compusoft Engineering. (2012). CTV Building: Non-Linear Time History Analysis (NLTHA) Report (Ref: 12026-00). Christchurch, New Zealand: Canterbury Earthquakes Royal Commission.
4. Dr Hyland acknowledged that reference to levels 3 and 4 at this point in the Hyland/Smith report was incorrect, and should have been levels 5 and 6.
5. Holmes, W.T. (2012). Peer Review: CTV Building Collapse Investigation dated 25 January 2012 by Hyland Consultants Ltd, and StructureSmith Ltd. Report prepared for the Canterbury Earthquakes Royal Commission. Christchurch, New Zealand: Canterbury Earthquakes Royal Commission.
6. Carr, A.J. (2011). Inelastic Response Spectra for the Christchurch Earthquake Records. Report to the CanterburyEarthquakes Royal Commission. Christchurch, New Zealand: Canterbury Earthquakes Royal Commission.
7. Rennie, H.B. (2012). Closing Submissions for Alan Reay Consultants Limited and Dr Reay: Dated 3 September2012. Christchurch, New Zealand: Canterbury Earthquakes Royal Commission.
8. Matthews, J. (2004). Hollow-core floor slab performance following a severe earthquake (Unpublished doctorate thesis). University of Canterbury, Christchurch, New Zealand.
9. Holmes Solutions Limited. (2012). Investigation into the influence of strain-ageing on the seismic performanceof reinforcing steel from the CTV building. Report prepared for the Canterbury Earthquakes Royal Commission. Christchurch, New Zealand: Canterbury Earthquakes Royal Commission.
10. Jensen, J. (2006). Experimental investigation of existing hollow-core seating connections, pre and post retrofit (Unpublished Master’s thesis). University of Canterbury, Christchurch, New Zealand. Fenwick, R., Bull, D. and Gardiner, D. (2010). Assessment of hollow-core floors for seismic performance. Christchurch, New Zealand: University of Canterbury.
11. Bradley, B.A., and Cubrinovski, M. (2011). Near-source strong ground motions observed in the 22 February2011 Christchurch earthquake. Bulletin of the New Zealand Society for Earthquake Engineering 44(4).
12. Bradley, B. (2012). Ground Motion and Seismicity Aspects of the 4 September 2010 and 22 February Earthquakes: Technical Paper prepared for the Canterbury Earthquakes Royal Commission. Christchurch, New Zealand: Canterbury Earthquakes Royal Commission.
13. Compusoft Engineering. (2012). CTV Non-Linear Seismic Analysis Report. Report prepared for the Department of Building and Housing. Christchurch, New Zealand: Canterbury Earthquakes Royal Commission.
14. NZS 4203:1984. Code of Practice for General Structural Design and Design Loadings for Buildings, StandardsNew Zealand.
15. NZS 3101:1982. Code of Practice for Design of Concrete Structures, Standards New Zealand.
16. Applied Technology Council. (1998). Evaluation of Earthquake Damaged Concrete and Masonry Wall Buildings: Basic Procedures Manual (FEMA 306). Redwood City, California, United States of America: The Partnership for Response and Recovery.
17. Mander, J. (2012). Progressive Damage Accumulation in Earthquakes within the Context of the CTV Building Collapse. Published as part of Professor Mander’s statement of evidence to the Canterbury Earthquakes Royal Commission. Christchurch, New Zealand: Canterbury Earthquakes Royal Commission.
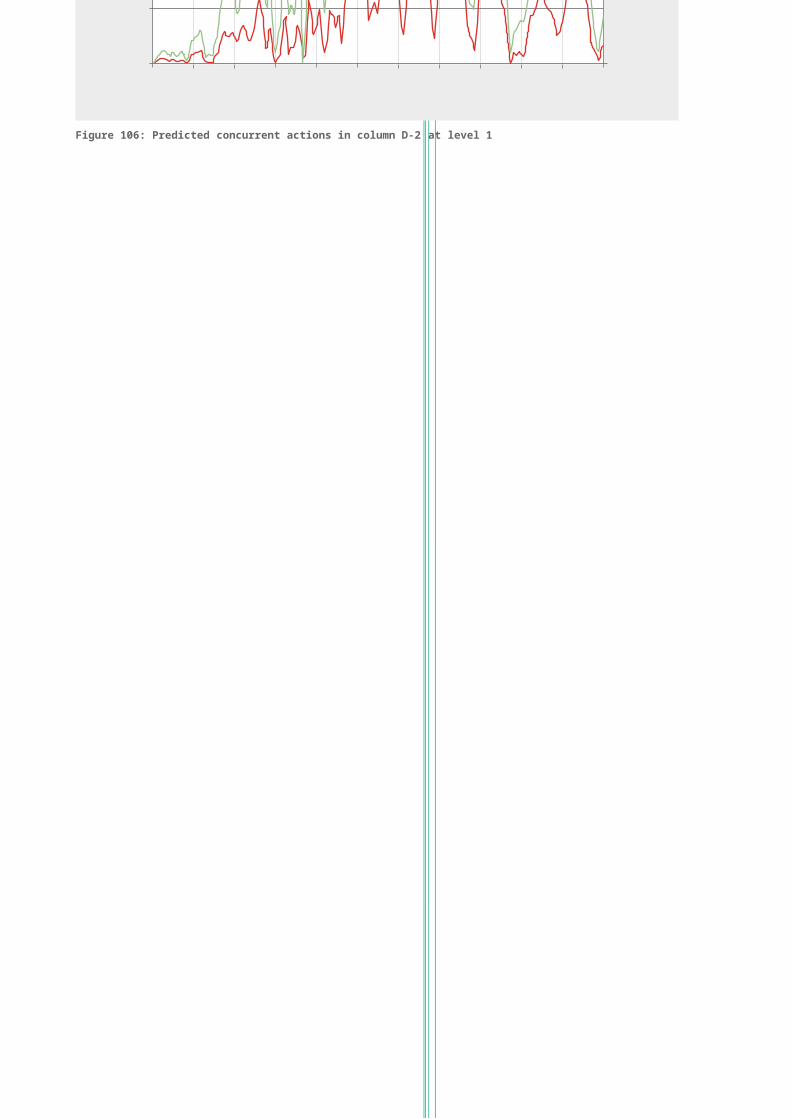
18. Willie Palmer, Buddle Findlay. Email to counsel assisting the Canterbury Earthquakes Royal Commission,15 June 2012.
19. Mander, J.B., Panthaki, F.D., and Kasalanati, A. (1994). Low-Cycle Fatigue Behaviour of Reinforcing Steel.ASCE Journal of Materials in Civil Engineering, 6(4), 453-468.
20. Park, R. and Paulay, T. (1975). Reinforced Concrete Structures. New York, United States of America: John Wiley & Sons.
Note: Standards New Zealand was previously known as the Standards Association of New Zealand and the StandardsInstitute of New Zealand.


![Tread lightly caravan photos [autosaved]](https://img.pdfslide.us/doc/110x75/58f30ab91a28ab94158b4605/tread-lightly-caravan-photos-autosaved.jpg)