Embed Size (px)
Citation preview
BIOL 6150 – Genomics and Applied BioinformaticsGroup Project: Microarray Analysis
Title: Identification of the Shear-and Side-specific genes related
to Aortic Valve CalcificationGroup: Swetha Rathan, HaozhengTian, Sandra Baethke,
WafaEldarrat
Background:Aortic valve (AV) calcification is one of the major causes of morbidity and mortality in elderly population[1, 2]. The primary risk factors for AV calcification include hypertension, congenital defects like bicuspid AV, age, smoking, diabetes and chronic kidney disease[3, 4]. The AV experiences dynamic mechanical environment with significant variations in pressure, bending and shear on either side[5]. Under physiological conditions, these stimuli constantly renew and remodel the valve. Any alterations to this mechanical environment have been shown to cause a disease condition, eventually resulting in aortic stenosis (AS) and aortic regurgitation (AR)[6]. Several studies have been done to characterize the role of shear stresses on vascular biology and have indicated that low and oscillatory shear stress is atheroprone whereas high shear is atheroprotective[7-10]. It has been speculated that the reduced shear stresses on the non-coronary leaflet of the AV due to the lack of coronary flow are responsible for the increased susceptibility to calcification of that leaflet[11].
Hypothesis: Adverse patterns of shear stress were found to upregulate inflammatory markers in valve leaflet tissues, indicating that the fibrosa is more atheroprone compared to the ventricularis side, which is also seen in calcified human valves.
Thus the hypothesis of our study is that the Human Aortic Valve Endothelial Cells of fibrosa side (fHAVECs) when exposed to oscillatory shear stress expresses similar genes that are seen in the calcified human AVs.
Data sets chosen:For our comparison purposes, we have chosen two data sets as follows:1. GSE26953 (4 data sets - 6 replicates per data set)[12]This is the data was extracted from part of the study: Discovery of Shear- and Side-specific mRNAs and miRNAs in Human Aortic Valvular Endothelial Cells. In this study the HAVECs from either sides of the valve were exposed to different shear stresses (both atheroprotective and atheroprone). The total RNA was collected and the miRNA and mRNA arrays were carried out
to identify if there are any differentially expressed shear and side specific miRNA and mRNA that could play a role in AV disease progression. For our project purposes, we used only the mRNA data sets. mRNA microarray data was available for different data sets such as
fHAVEC exposed to OS (FO) vHAVEC exposed to OS (VO) fHAVEC exposed to LS (FL) vHAVEC exposed to LS (VL)
Where the HAVECs are the human aortic valve endothelial cells from either the fibrosa side or the ventricularis side (fHAVECs or vHAVECs respectively). OS: Oscillatory shear stress( pro-atherogenic) and LS : Laminar shear ( atheroprotective).
2. GSE12644 ( 2 data sets – with 3 or 4 replicates)[13]This data set has been extracted from the study: Gene expression profile of normal and calcified stenotic human aortic valves. This study was used to gene expression profiling of human aortic valves in patients with or without aortic stenosis. The dataset was generated constituteda large-scale quantitative measurements of gene expression in normal and stenotic human valves. The goal of this study was to compare gene expression levels between the two groups and identified a list of genes that are up-or down-regulated in aortic stenosis. For our project purposes we used the entire mRNA microarray data set provided, which is the following
Human Aortic Valve – control (10 samples) Human Calcified Aortic Valve (diseased) - (10 samples)
Objectives: In this project, the first step was to do the microarray analysis and to identify the differentially expressed genes within each data set. Our comparison groups are
1. For the sheared HAVECs data set, we have the following groupsa. Overall differences between different shear stress : Oscillatory
vs Laminarb. Overall differences between the sides : Fibrosa and
VentricularisFor more specific comparisons, we did the following.
c. fHAVECsvsvHAVECs exposed to same shear stress – Oscillatoryd. fHAVECsvsvHAVECs exposed to same shear stress – Laminare. fHAVECs exposed to different shear stresses – Oscillatory vs
Laminar f. vHAVECs exposed to different shear stresses – Oscillatory vs
Laminar2. For the calcified and normal AV microarray data set, we compared the
gene expression profiles between normal and calcified human AVs.
From 1, Our comparisons a and b gives us the list of the differentially expressed genes that are shear sensitive and side- dependent respectively. Comparisons c and d will give us the differentially expressed genes that are side-dependent when exposed to same shear. Comparisons e and f will give us the differentially expressed genes that are shear-dependent on the same side.
From 2, We will obtain the gene expression profiles that are expressed in diseased calcified genes.
In our further steps, we will retrieve all the genes from the ids of the array platforms and then separately run the statistics to see if any of the shear conditions upregulate the gene expressions that are related to AV calcification.
Project detailed steps:
We used the tutorial provided and followed all the steps in order to retrieve the data sets from the GEO website. Briefly, we use the accession number of the paper with shear data, GSE26953, and obtained the information of the experimental design. : 24 samples; n=6 for the following 4 groups: FO, VO, FL, and VL (24 miRNA and 24 mRNA arrays.
We have downloaded the series matrix files in txt.gz format. Since gz format files are all zipped files, use the 7 zip or any other unzipping program to extract files. We then formatted it according to the specifications for the JMP genomics software, as provided in the tutorial.
Original, formatted and normalized data files attached: The data files were formatted, standardized and used for further analysis. Following are the list of files in the order of entire expression data, experimental design and normalized data for two accession numbers. These files are also attached along with the differentially expression profile files.
GSE 12644 – Calcified vs. Normal human aortic valves1. gse12644_disease_exp2. gse12644_disease_expression_data3. gse12644_disease_expression_std
GSE 26953 – Shear data4. gse26953_shear_exp5. gse26953_shear_gene_express_std6. gse26953_shear_gene_expression

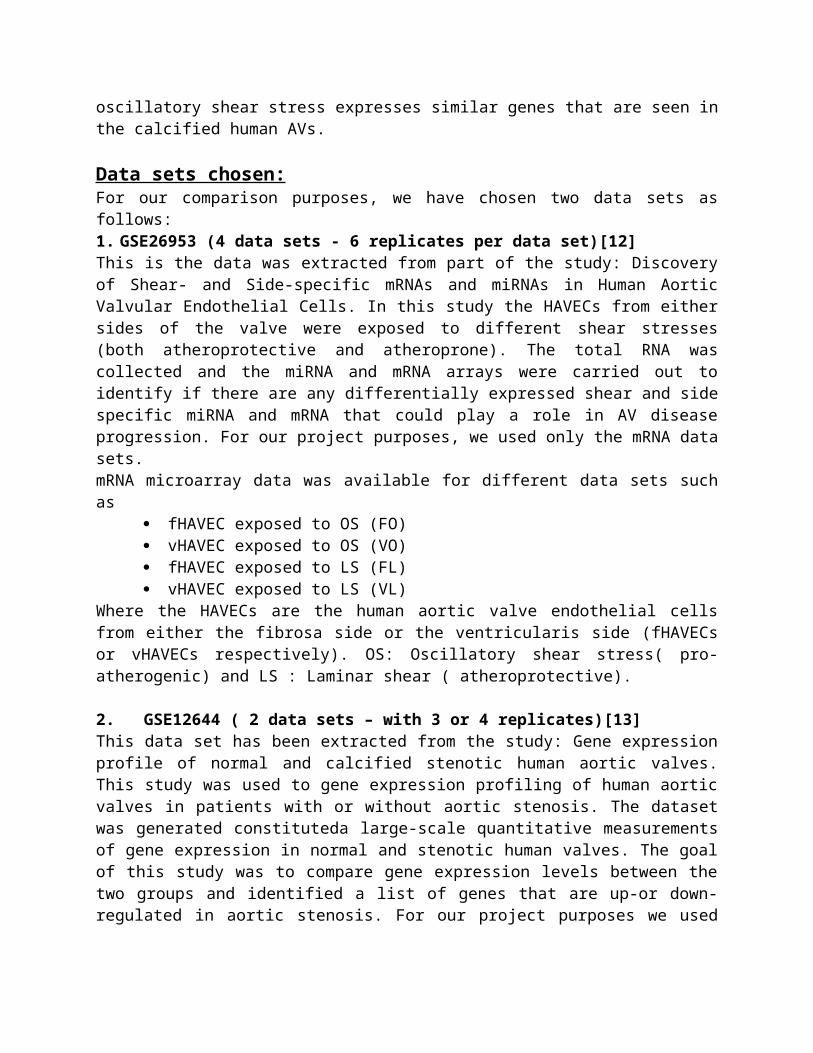
Identification of differentially expressed genes:To identify the differentially expressed genes, we followed the instructions in the tutorial, and used the pFDR – multiple testing method, one-way ANOVA for overall statistics, and t-test for individual pairs. Alpha: 0.05. All the specific p-values, corresponding list and the file names are listed in the table as follows. Also specifically the list of these genes were obtained by selecting only the genes that are expressed above the threshold p-value (above the red line in the anova plots).
1. Overall differences between different shear stress : Oscillatory vs Laminar : Effect of shear stress
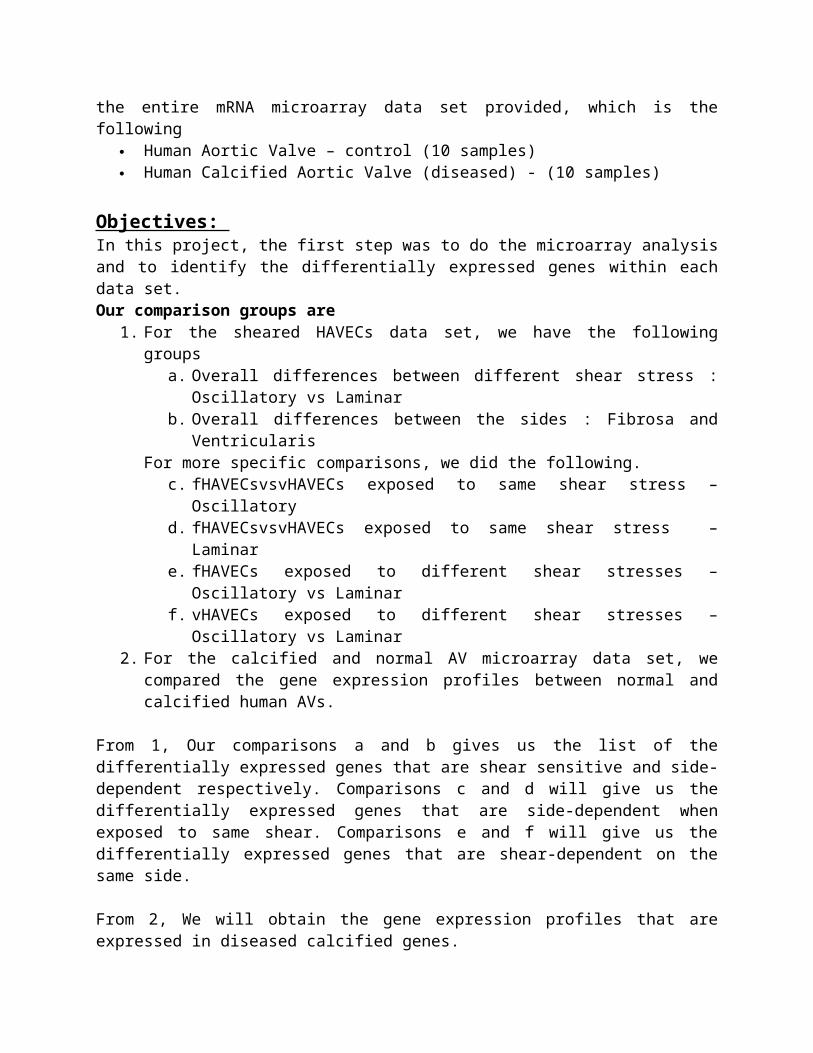
2. Overall differences between the sides : Fibrosa and Ventricularis – overall side specificity
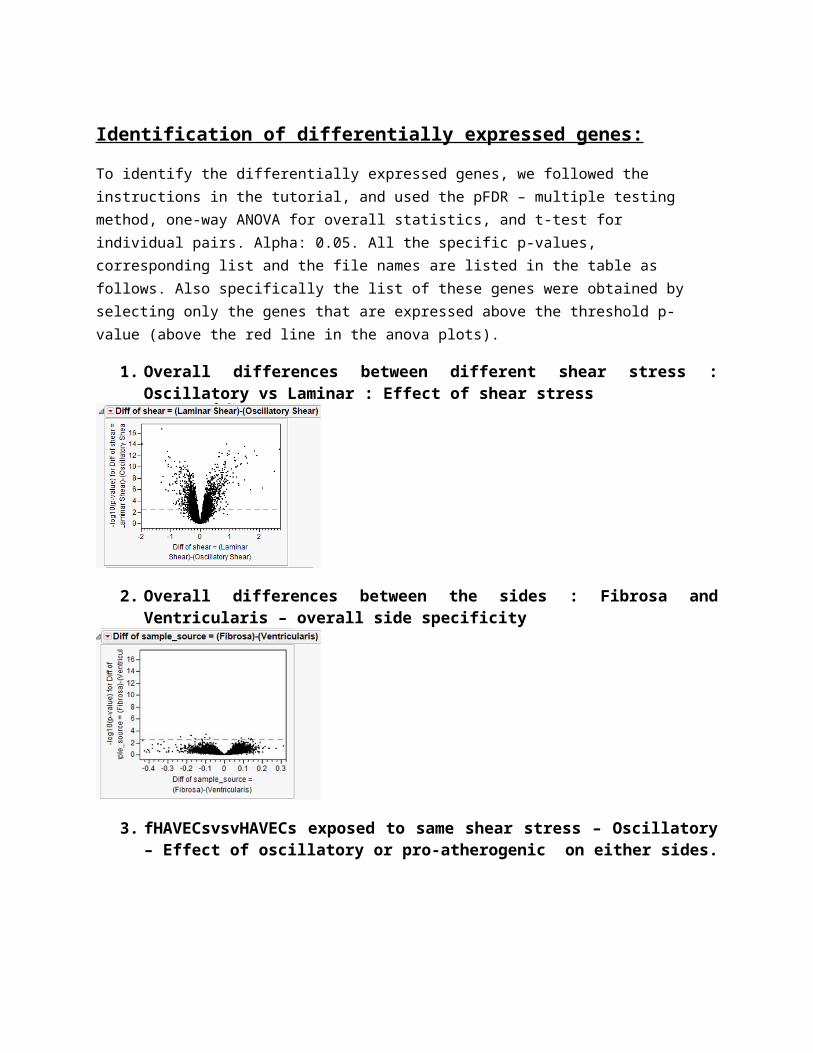
3. fHAVECsvsvHAVECs exposed to same shear stress – Oscillatory – Effect of oscillatory or pro-atherogenic on either sides.
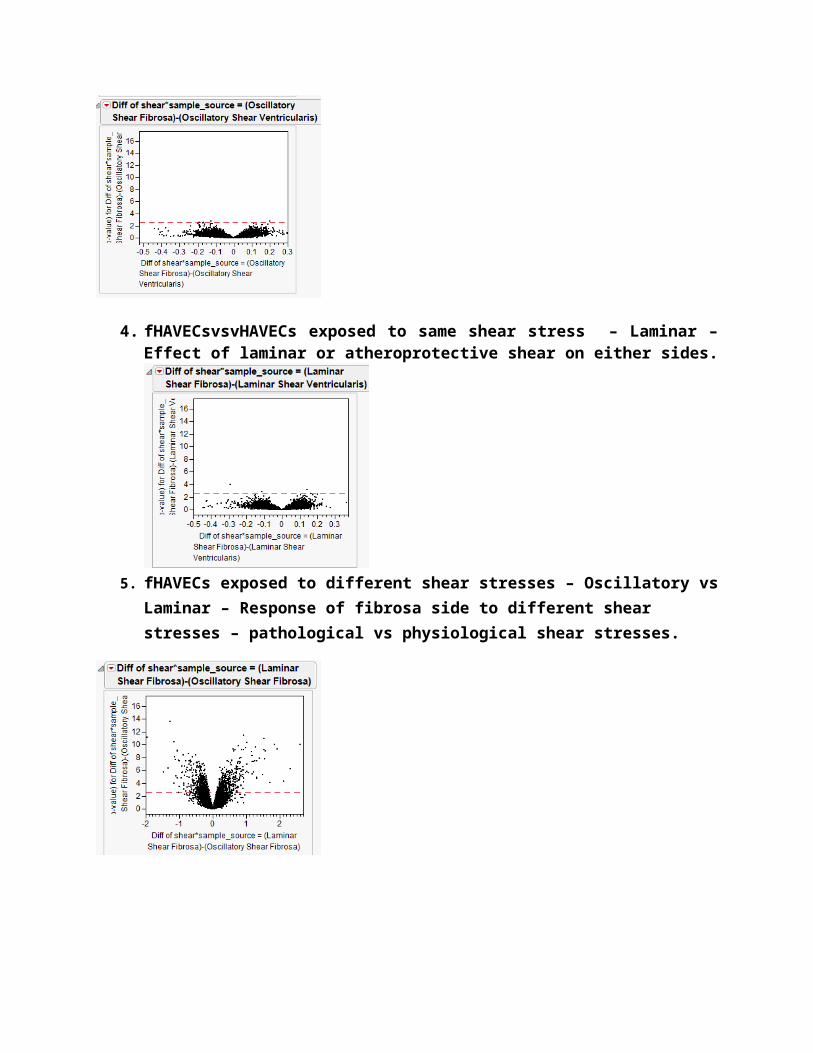
4. fHAVECsvsvHAVECs exposed to same shear stress – Laminar – Effect of laminar or atheroprotective shear on either sides.
5. fHAVECs exposed to different shear stresses – Oscillatory vs Laminar – Response of fibrosa side to different shear stresses – pathological vs physiological shear stresses.
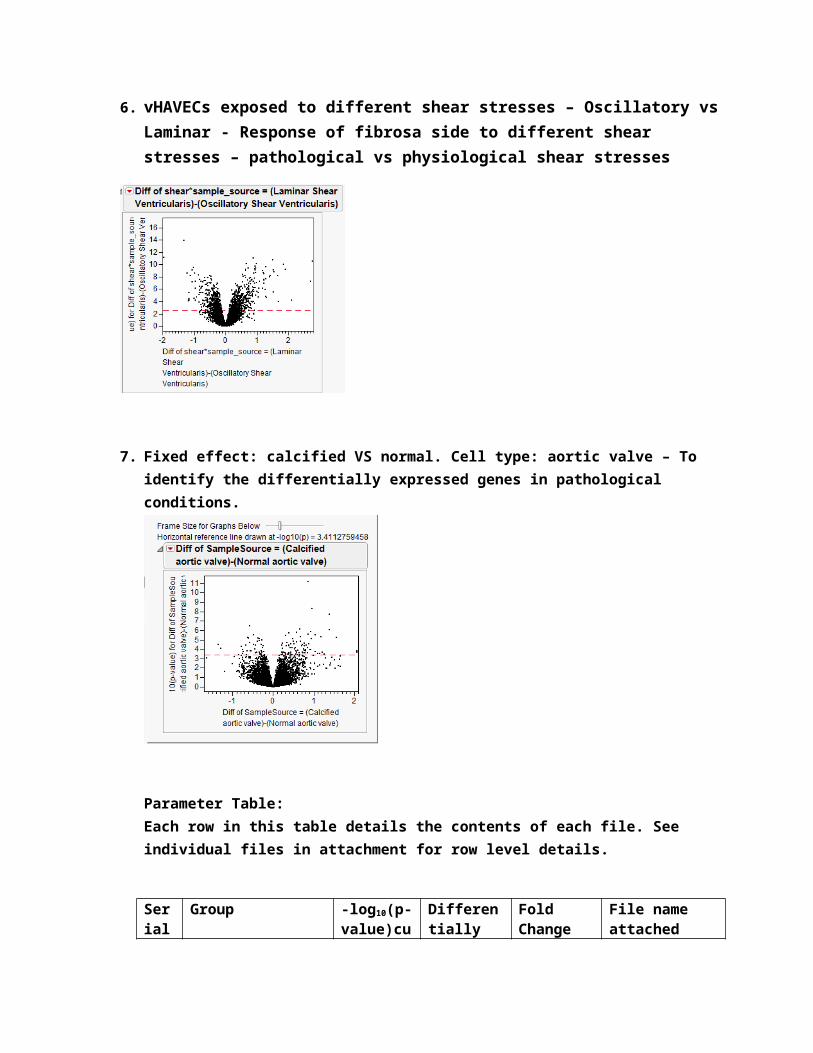
6. vHAVECs exposed to different shear stresses – Oscillatory vs Laminar - Response of fibrosa side to different shear stresses – pathological vs physiological shear stresses
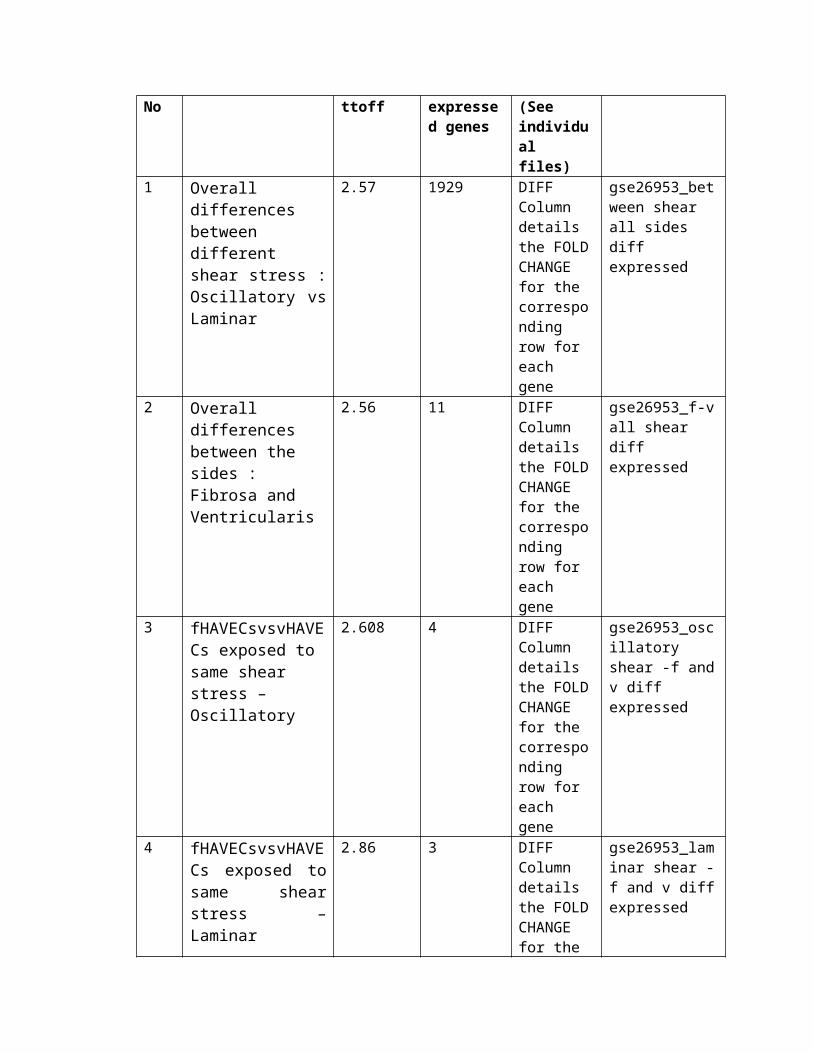
7. Fixed effect: calcified VS normal. Cell type: aortic valve – To identify the differentially expressed genes in pathological conditions.
Parameter Table: Each row in this table details the contents of each file. See individual files in attachment for row level details.
Serial No
Group -log10(p-value)cuttoff
Differentially expressed genes
Fold Change(See individual files)
File name attached
1 Overall differences between different shear stress : Oscillatory vs
2.57 1929 DIFF Column details the FOLD CHANGE for the
gse26953_between shear all sides diff expressed
Laminar corresponding row for each gene
2 Overall differences between the sides : Fibrosa and Ventricularis
2.56 11 DIFF Column details the FOLD CHANGE for the corresponding row for each gene
gse26953_f-v all shear diff expressed
3 fHAVECsvsvHAVECs exposed to same shear stress – Oscillatory
2.608 4 DIFF Column details the FOLD CHANGE for the corresponding row for each gene
gse26953_oscillatory shear -f and v diff expressed
4 fHAVECsvsvHAVECs exposed to same shear stress – Laminar
2.86 3 DIFF Column details the FOLD CHANGE for the corresponding row for each gene
gse26953_laminar shear -f and v diff expressed
5 fHAVECs exposed to different shear stresses – Oscillatory vs Laminar
2.47 1052 DIFF Column details the FOLD CHANGE for the corresponding row for each gene
gse26953_side f - oscillatory and laminar shear diff expressed
6 vHAVECs exposed to different shear stresses – Oscillatory vs
2.675 964 DIFF Column details the FOLD CHANGE for the
gse26953_side v -oscillatory and laminar shear diff expressed
Laminar corresponding row for each gene
7 Calcified vs Normal human AV
3.27 130 DIFF Column details the FOLD CHANGE for the corresponding row for each gene
gse12644 Diff expressed _disease genes
Principal Component Analysis:
1. GSE12644 : Calcified vs normal human AV samples
Heat Map:
GSM317342
GSM317343GSM317344GSM317345GSM317346
GSM317347GSM317348GSM317349GSM317350
GSM317351
GSM377368GSM377369GSM377370GSM377371GSM377372GSM377373
GSM377374GSM377375
GSM377376
GSM377377
GSM317342
GSM317343
GSM317344
GSM317345
GSM317346
GSM317347
GSM317348
GSM317349
GSM317350
GSM317351
GSM377368
GSM377369
GSM377370
GSM377371
GSM377372
GSM377373
GSM377374
GSM377375
GSM377376
GSM377377
-0.928-0.742-0.556-0.371-0.1850.00010.20010.4001
0.60.81
Heat Map and Dendrogram
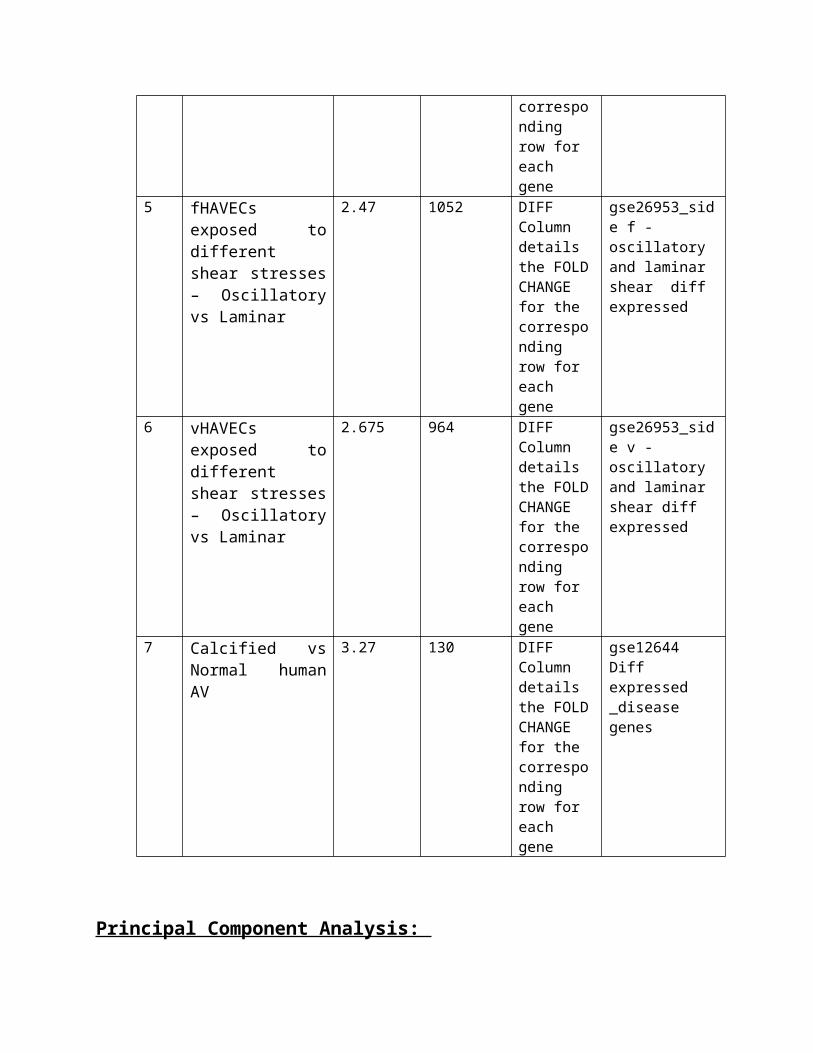
2. GSE26953 :Sheared HAVECs sample data.
Heat Map:

GSM665514
GSM665515
GSM665516GSM665517
GSM665518
GSM665519
GSM665520
GSM665521
GSM665522GSM665523
GSM665524
GSM665525
GSM665526
GSM665527
GSM665528GSM665529
GSM665530GSM665531
GSM665532
GSM665533
GSM665534
GSM665535GSM665536
GSM665537
GSM665514
GSM665515
GSM665516
GSM665517
GSM665518
GSM665519
GSM665520
GSM665521
GSM665522
GSM665523
GSM665524
GSM665525
GSM665526
GSM665527
GSM665528
GSM665529
GSM665530
GSM665531
GSM665532
GSM665533
GSM665534
GSM665535
GSM665536
GSM665537
-0.714-0.57-0.427-0.283-0.14
0.00410.20330.40250.60160.8008
1
Heat Map and Dendrogram
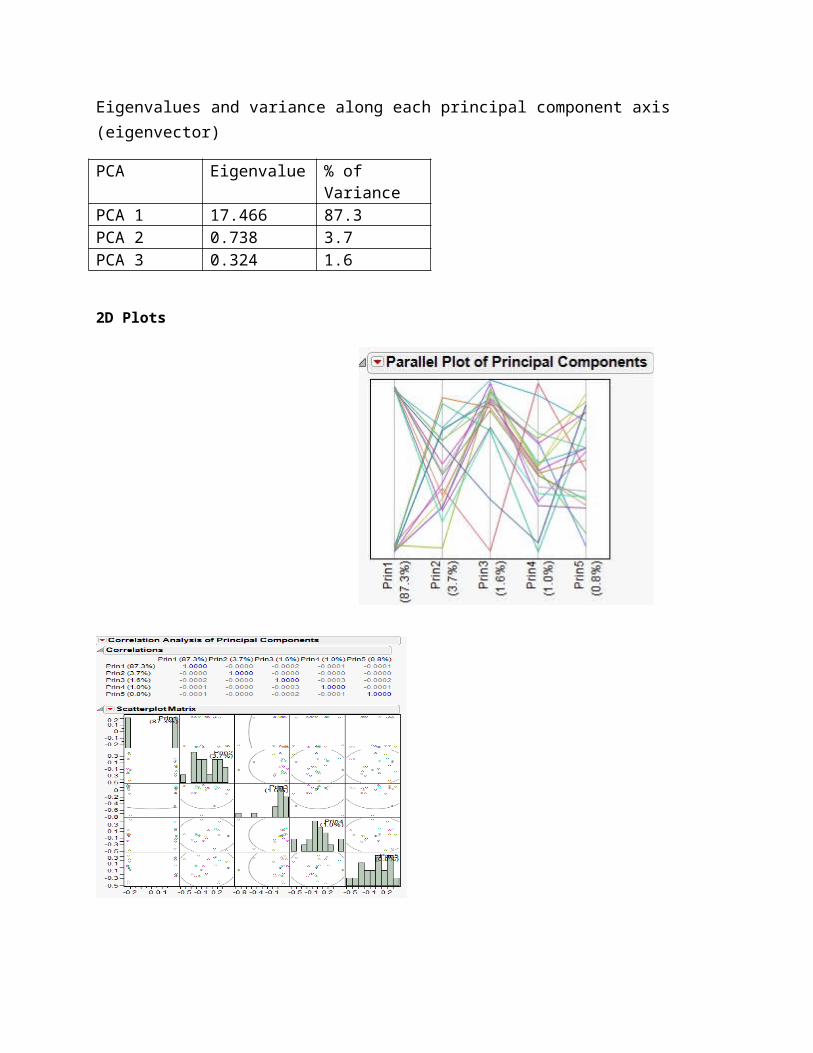
GSE12644 : Calcified vs normal human AV samplesEigenvalues and variance along each principal component axis (eigenvector)
PCA Eigenvalue % of Variance
PCA 1 17.466 87.3PCA 2 0.738 3.7PCA 3 0.324 1.6
2D Plots
3D plot
Blue: Normal aortic valve, Red: Calcified aortic valve
Figure 1 Figure 2
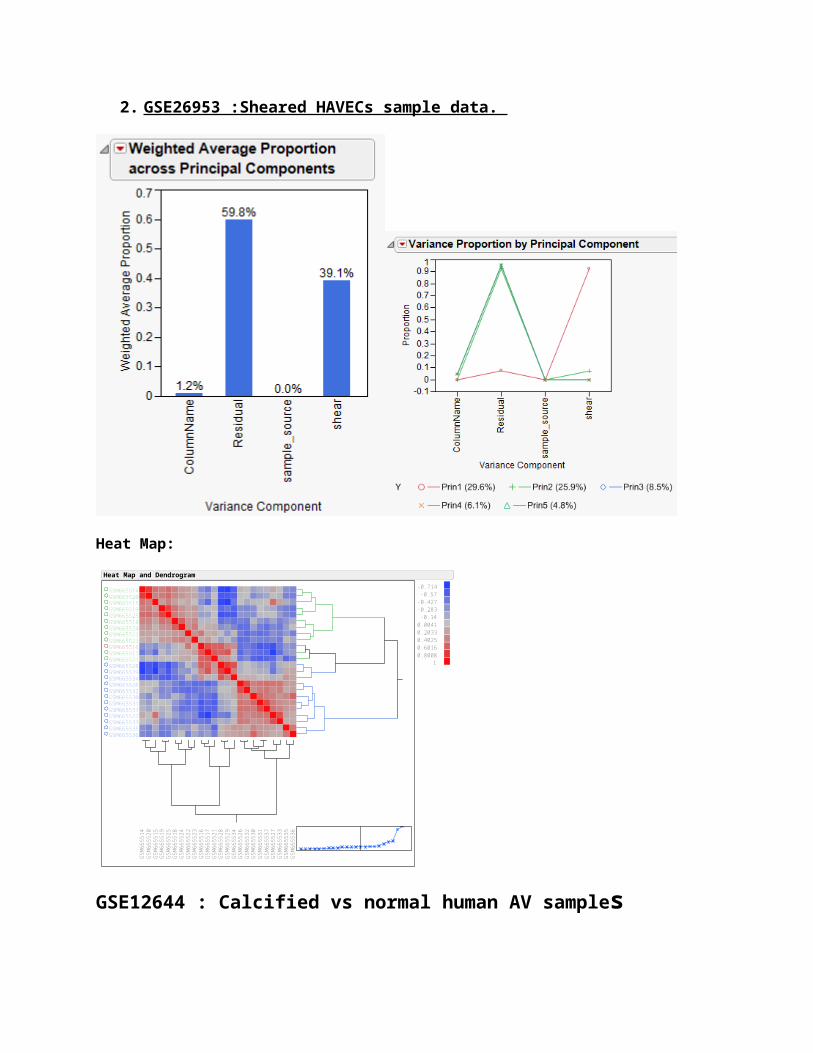
Figure 1 : A 87.3% of the variance is shown along the first principal component axis. Two groupings are clearly demonstrated in the PCA, however the normal and diseased aortic valve (blue and red respectively) are not the dividing factors. The grouping element is unknown.
Figure 2 : The PCA here demonstrates the third principle component axis with a variance of 1.6%.In both Figure 1 and Figure 2 the second principle component axis captures a variance of 3.7%. The PCA in both figures show that the normal aortic valves lie in the positive region and the calcified aortic valves represented by the red balls have negative readings along both axis ranging from 0 to -0.5.
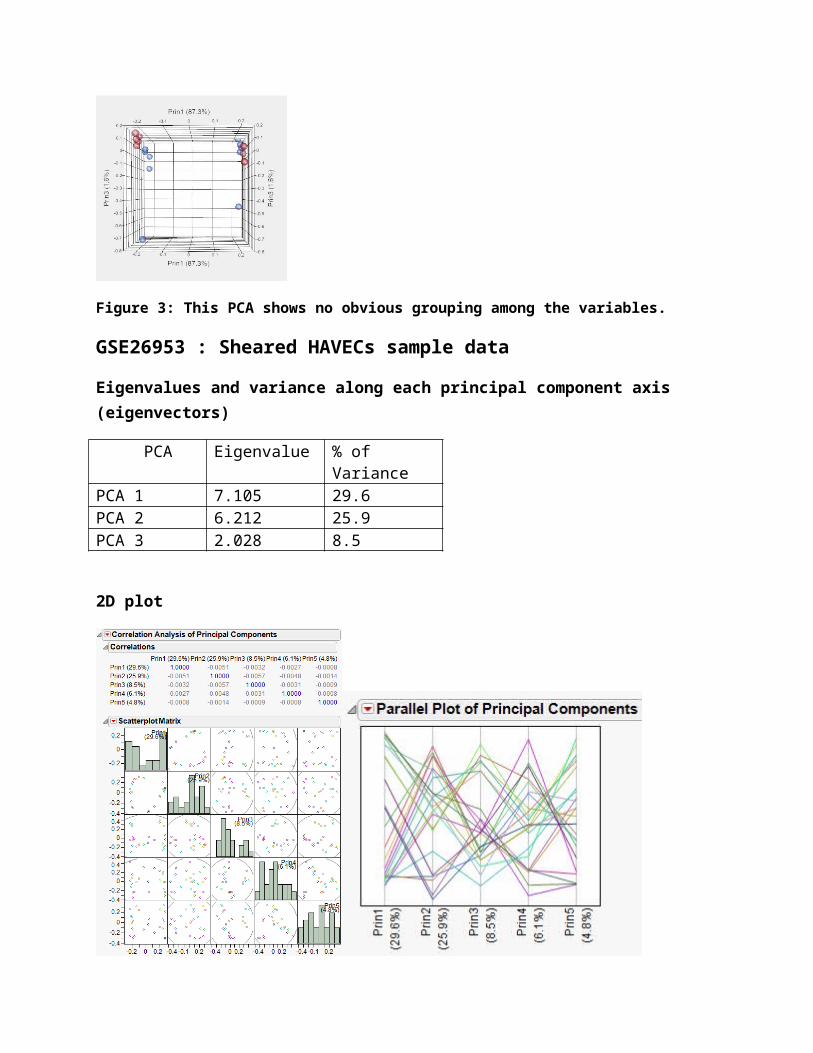
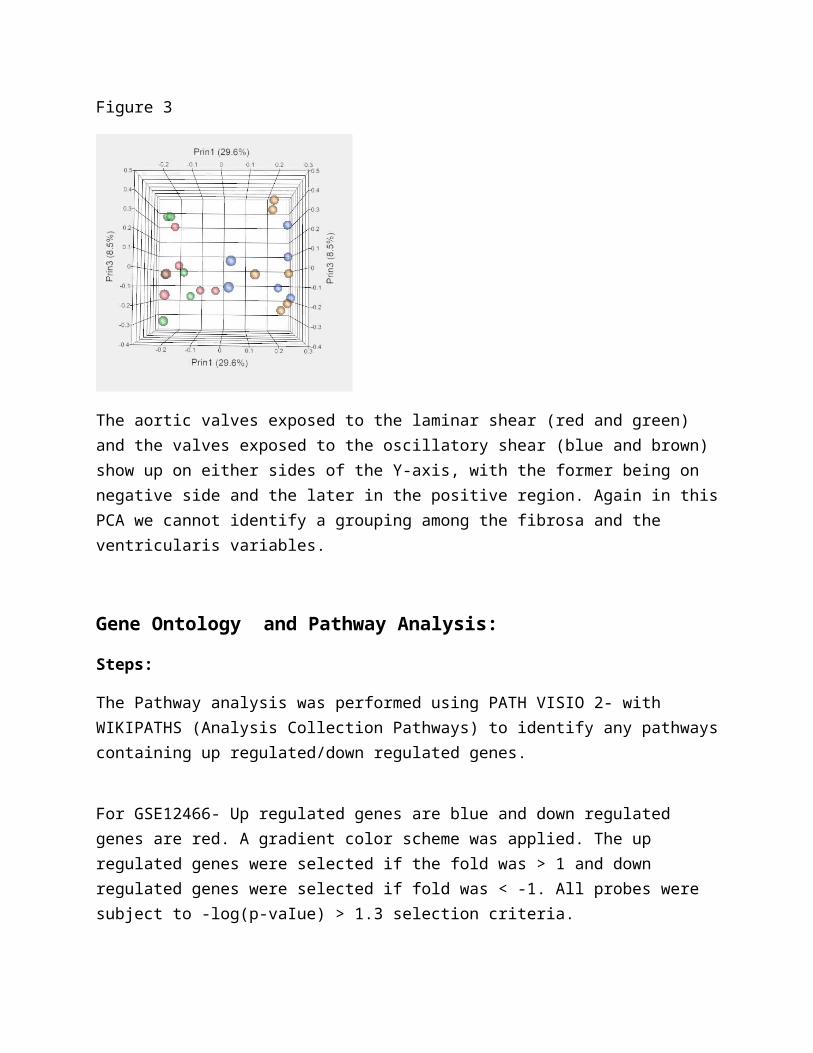
Figure 3
Figure 3: This PCA shows no obvious grouping among the variables.
GSE26953 : Sheared HAVECs sample data
Eigenvalues and variance along each principal component axis (eigenvectors)
PCA Eigenvalue % of Variance
PCA 1 7.105 29.6PCA 2 6.212 25.9PCA 3 2.028 8.5
2D plot
3D plot
Blue: Fibrosa, Oscillatory shear
Green: Ventricularis, Laminar shear
Red: Fibrosa, Laminar shear
Brown: Ventricularis, Oscillatory shear
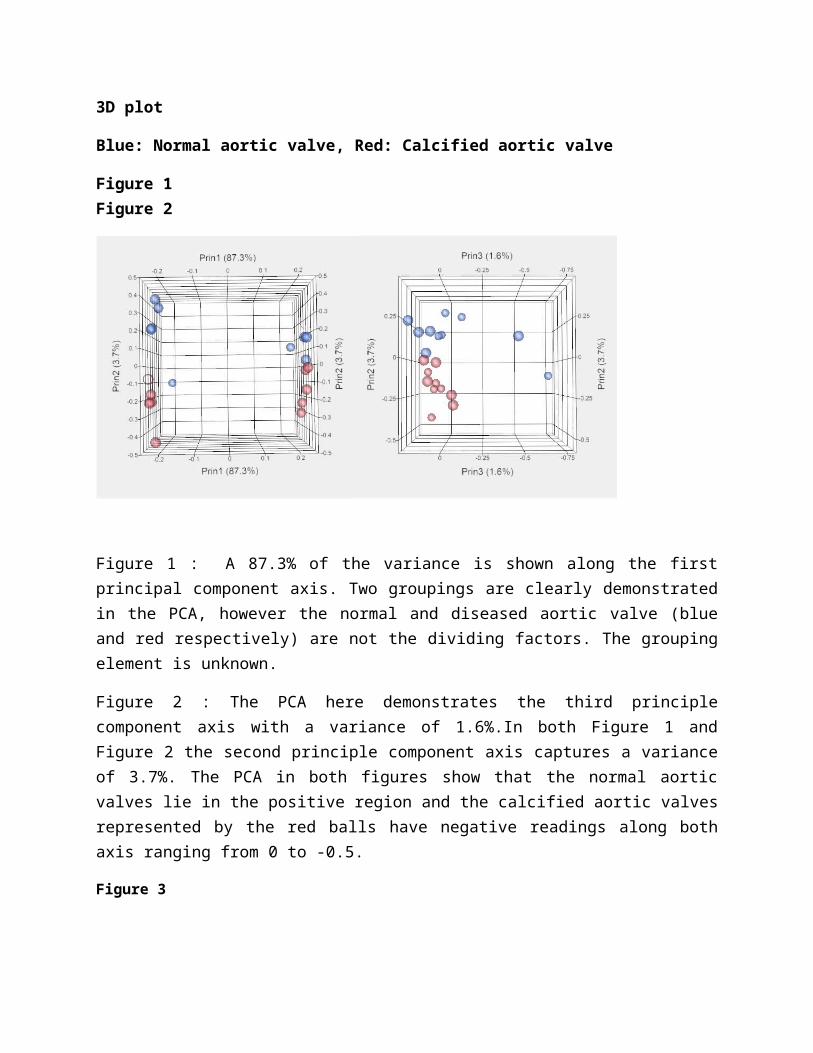
Figure 1 Figure 2
Figure 1: The variables which were exposed to laminar and oscillatory shear are represented in the PCA as two distinct groups. However there is no distinct pattern among the ventricularis and the fibrosa tissue. Along the first principal component there is a 29.6% variance.
Figure 2: This PCA shows no grouping among the different aortic valves. Along the third principal component there is a 8.5% variance.
Figure 3
The aortic valves exposed to the laminar shear (red and green) and the valves exposed to the oscillatory shear (blue and brown) show up on either sides of the Y-axis, with the former being on negative side and the later in
the positive region. Again in this PCA we cannot identify a grouping among the fibrosa and the ventricularis variables.
Gene Ontology and Pathway Analysis:
Steps:
The Pathway analysis was performed using PATH VISIO 2- with WIKIPATHS (Analysis Collection Pathways) to identify any pathways containing up regulated/down regulated genes.
For GSE12466- Up regulated genes are blue and down regulated genes are red. A gradient color scheme was applied. The up regulated genes were selected if the fold was > 1 and down regulated genes were selected if fold was < -1. All probes were subject to -log(p-vaIue) > 1.3 selection criteria.
For GSE26593- down regulated genes were blue and up regulated genes were red. A gradient color scheme was applied. Down regulated genes were selected if fold value < 0 and up regulated genes were selected if fold value > 0. The fold values in these data sets were small. The selection for all records was -log(p-value) > 1.3. Not all samples provided pathways using these methods. In some cases no z value was calculated.
Other PATH ANALYSIS tools were also attempted. Cytoscape, David, GenMapp CS Files and GSEA. GenMApp CS provided output similar to PATHVISIO but did not seem to provide an easy way to determine which paths could be used- in other words it displayed all paths- 181 of them.
GSEA- This one utility needed the original affymetrix probe data for all samples but only containing the selected genes . We had used the JMP data which did not contain this level of detail. The original JMP tables containing the affymetrix and illumina data contain all original probes not just the selected probes. Most of these utilities need excel data saved as tab delimited files. JMP files cannot be read into them and we cannot access JMP from home. David did not seem to provide pathway 'pictures' and deciphering the output did not seem easy. We also tried using GOEAST for Pathway Analysis, but could not get a decent diagram for GSE12466 (Calcified vs healthy Aortic) with more than 10 genes. We also couldn't get a
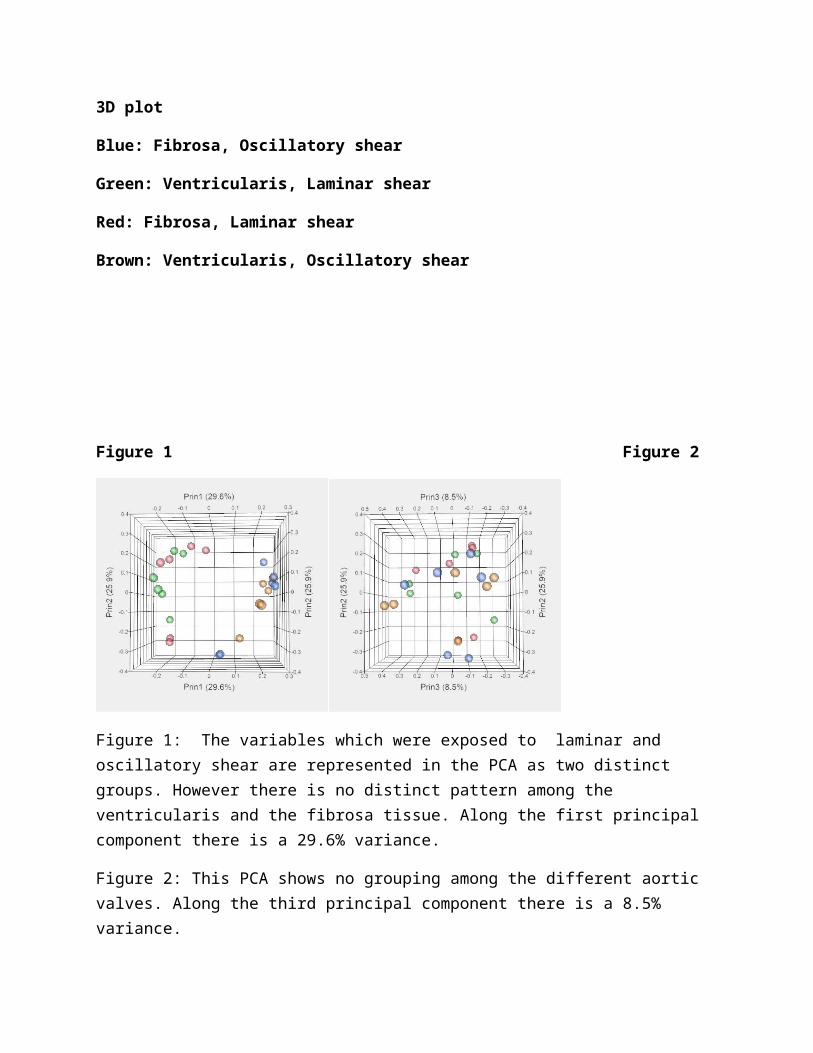
diagram for the other study GSE26593 Osc vs Laminar data. GOEAST was abending or gave errors after waiting a long awhile.
However, with whatever different analysis we performed, we nailed it down to the following important pathways and processes that regulated by the genes in response to different treatments or conditions, which are explained in detail below.
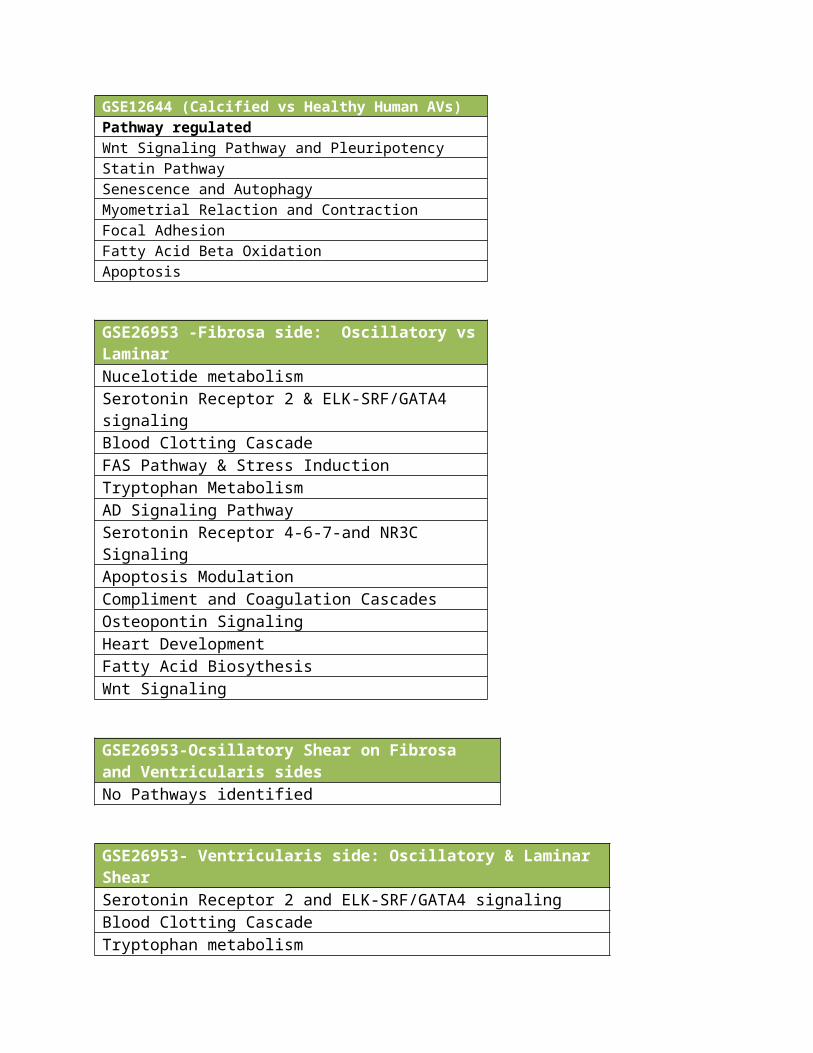
Pathways:
GSE12644 (Calcified vs Healthy Human AVs)Pathway regulatedWnt Signaling Pathway and PleuripotencyStatin PathwaySenescence and AutophagyMyometrial Relaction and ContractionFocal AdhesionFatty Acid Beta OxidationApoptosis
GSE26953 -Fibrosa side: Oscillatory vs LaminarNucelotide metabolismSerotonin Receptor 2 & ELK-SRF/GATA4 signalingBlood Clotting CascadeFAS Pathway & Stress InductionTryptophan MetabolismAD Signaling PathwaySerotonin Receptor 4-6-7-and NR3C SignalingApoptosis ModulationCompliment and Coagulation CascadesOsteopontin SignalingHeart DevelopmentFatty Acid BiosythesisWnt Signaling
GSE26953-Ocsillatory Shear on Fibrosa and Ventricularis sidesNo Pathways identified
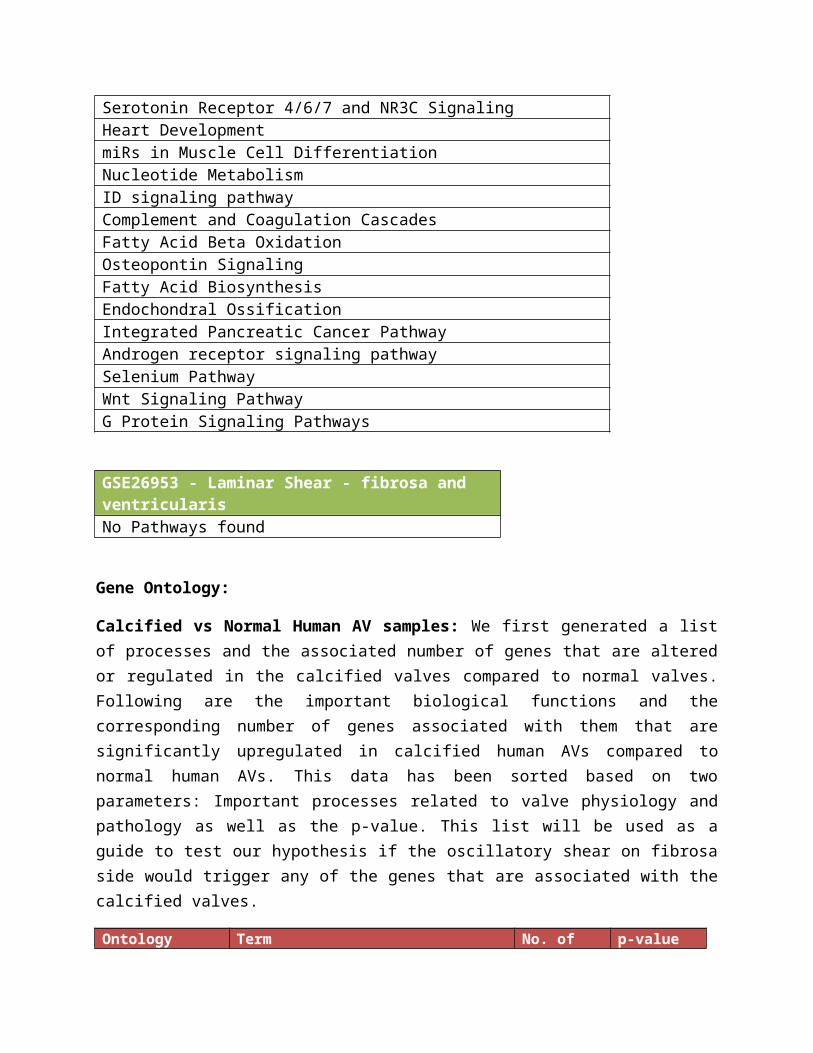
GSE26953- Ventricularis side: Oscillatory & Laminar
ShearSerotonin Receptor 2 and ELK-SRF/GATA4 signalingBlood Clotting CascadeTryptophan metabolismSerotonin Receptor 4/6/7 and NR3C SignalingHeart DevelopmentmiRs in Muscle Cell DifferentiationNucleotide MetabolismID signaling pathwayComplement and Coagulation CascadesFatty Acid Beta OxidationOsteopontin SignalingFatty Acid BiosynthesisEndochondral OssificationIntegrated Pancreatic Cancer PathwayAndrogen receptor signaling pathwaySelenium PathwayWnt Signaling PathwayG Protein Signaling Pathways
GSE26953 - Laminar Shear - fibrosa and ventricularisNo Pathways found
Gene Ontology:
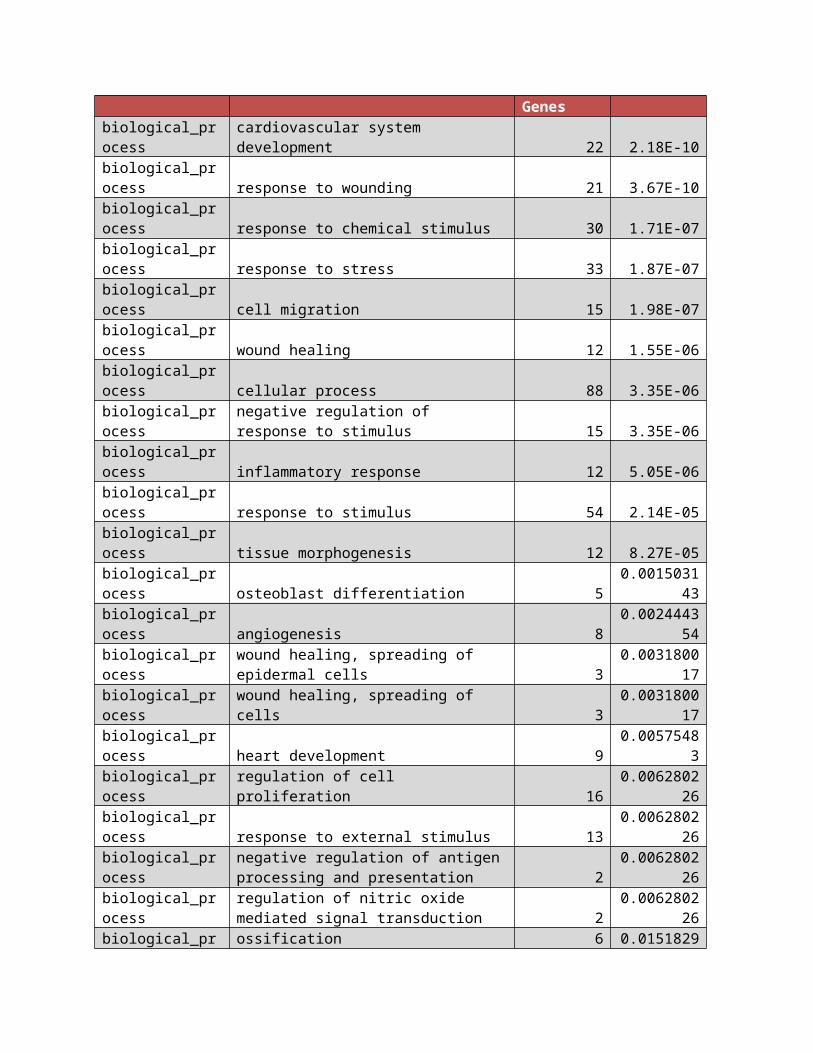
Calcified vs Normal Human AV samples: We first generated a list of processes and the associated number of genes that are altered or regulated in the calcified valves compared to normal valves. Following are the important biological functions and the corresponding number of genes associated with them that are significantly upregulated in calcified human AVs compared to normal human AVs. This data has been sorted based on two parameters: Important processes related to valve physiology and pathology as well as the p-value. This list will be used as a guide to test our hypothesis if the oscillatory shear on fibrosa side would trigger any of the genes that are associated with the calcified valves.
Ontology TermNo. of Genes p-value
biological_process cardiovascular system development 22 2.18E-10biological_proc response to wounding 21 3.67E-10
essbiological_process response to chemical stimulus 30 1.71E-07biological_process response to stress 33 1.87E-07biological_process cell migration 15 1.98E-07biological_process wound healing 12 1.55E-06biological_process cellular process 88 3.35E-06biological_process
negative regulation of response to stimulus 15 3.35E-06
biological_process inflammatory response 12 5.05E-06biological_process response to stimulus 54 2.14E-05biological_process tissue morphogenesis 12 8.27E-05biological_process osteoblast differentiation 5
0.001503143
biological_process angiogenesis 8
0.002444354
biological_process
wound healing, spreading of epidermal cells 3
0.003180017
biological_process wound healing, spreading of cells 3
0.003180017
biological_process heart development 9
0.00575483
biological_process regulation of cell proliferation 16
0.006280226
biological_process response to external stimulus 13
0.006280226
biological_process
negative regulation of antigen processing and presentation 2
0.006280226
biological_process
regulation of nitric oxide mediated signal transduction 2
0.006280226
biological_process ossification 6
0.015182975
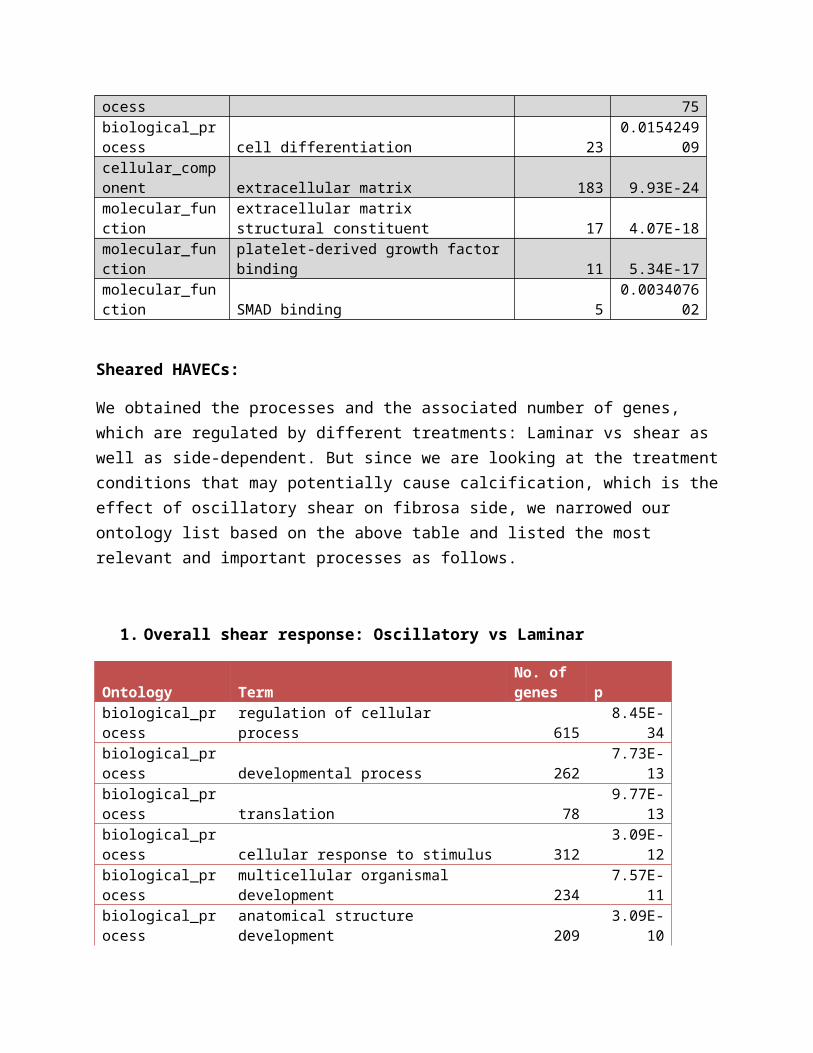
biological_process cell differentiation 23
0.015424909
cellular_component extracellular matrix 183 9.93E-24molecular_function
extracellular matrix structural constituent 17 4.07E-18
molecular_function
platelet-derived growth factor binding 11 5.34E-17
molecular_function SMAD binding 5
0.003407602
Sheared HAVECs:
We obtained the processes and the associated number of genes, which are regulated by different treatments: Laminar vs shear as well as side-dependent. But since we are looking at the treatment conditions that may potentially cause calcification, which is the effect of oscillatory shear on fibrosa side, we narrowed our ontology list based on the above table and listed the most relevant and important processes as follows.
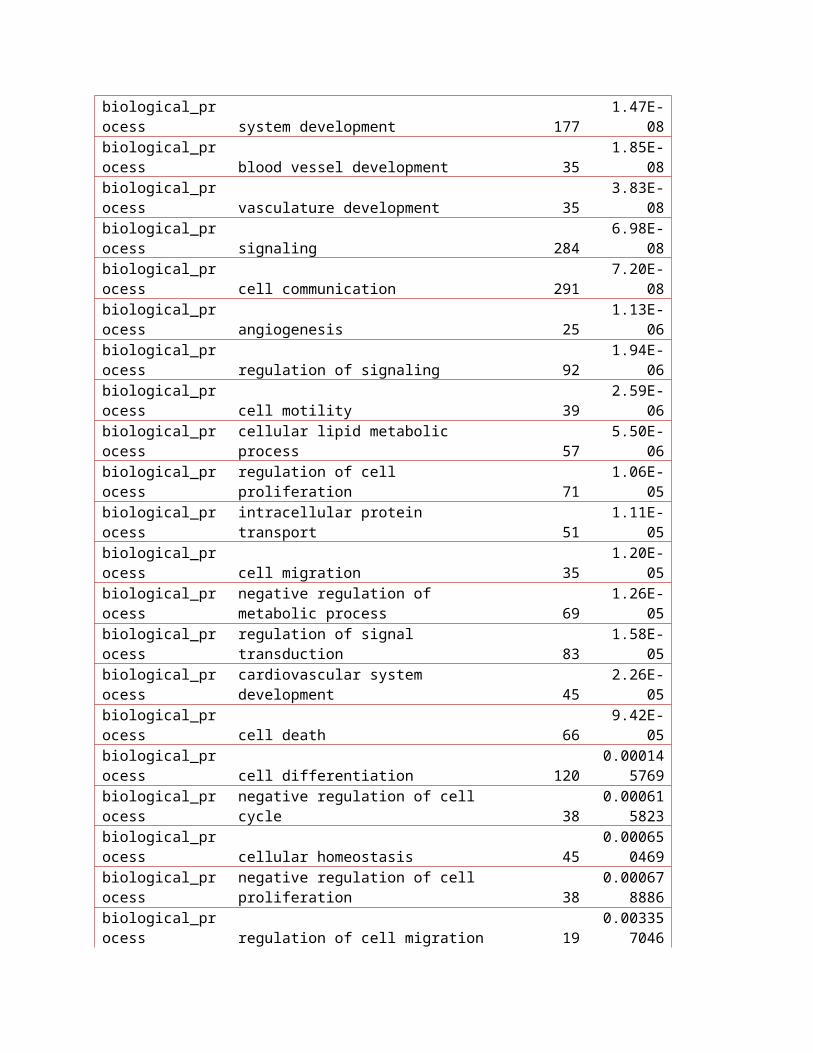
1. Overall shear response: Oscillatory vs Laminar
Ontology TermNo. of genes p
biological_process regulation of cellular process 615 8.45E-34biological_process developmental process 262 7.73E-13biological_process translation 78 9.77E-13biological_process cellular response to stimulus 312 3.09E-12biological_process
multicellular organismal development 234 7.57E-11
biological_process anatomical structure development 209 3.09E-10biological_process system development 177 1.47E-08biological_process blood vessel development 35 1.85E-08biological_process vasculature development 35 3.83E-08biological_process signaling 284 6.98E-08biological_process cell communication 291 7.20E-08biological_process angiogenesis 25 1.13E-06biological_process regulation of signaling 92 1.94E-06biological_process cell motility 39 2.59E-06biological_process cellular lipid metabolic process 57 5.50E-06biological_proce regulation of cell proliferation 71 1.06E-05
ssbiological_process intracellular protein transport 51 1.11E-05biological_process cell migration 35 1.20E-05biological_process
negative regulation of metabolic process 69 1.26E-05
biological_process regulation of signal transduction 83 1.58E-05biological_process
cardiovascular system development 45 2.26E-05
biological_process cell death 66 9.42E-05biological_process cell differentiation 120
0.000145769
biological_process negative regulation of cell cycle 38
0.000615823
biological_process cellular homeostasis 45
0.000650469
biological_process
negative regulation of cell proliferation 38
0.000678886
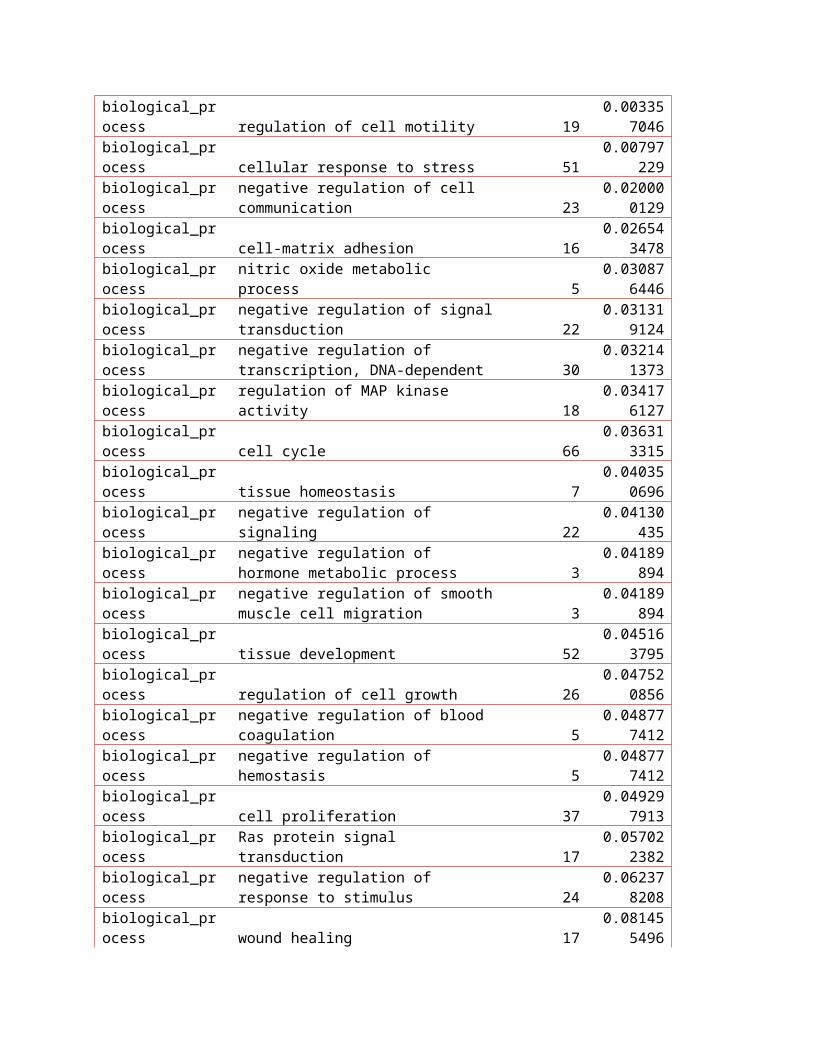
biological_process regulation of cell migration 19
0.003357046
biological_process regulation of cell motility 19
0.003357046
biological_process cellular response to stress 51
0.00797229
biological_process
negative regulation of cell communication 23
0.020000129
biological_process cell-matrix adhesion 16
0.026543478
biological_process nitric oxide metabolic process 5
0.030876446
biological_process
negative regulation of signal transduction 22
0.031319124
biological_process
negative regulation of transcription, DNA-dependent 30
0.032141373
biological_process regulation of MAP kinase activity 18
0.034176127
biological_process cell cycle 66
0.036313315
biological_process tissue homeostasis 7
0.040350696
biological_process negative regulation of signaling 22
0.04130435
biological_process
negative regulation of hormone metabolic process 3
0.04189894
biological_process
negative regulation of smooth muscle cell migration 3
0.04189894
biological_process tissue development 52
0.045163795
biological_process regulation of cell growth 26
0.047520856
biological_process
negative regulation of blood coagulation 5
0.048777412
biological_process negative regulation of hemostasis 5
0.048777412
biological_process cell proliferation 37
0.049297913
biological_process Ras protein signal transduction 17
0.057022382
biological_process
negative regulation of response to stimulus 24
0.062378208
biological_process wound healing 17
0.081455496
biological_process cell development 43
0.081615089
biological_process chemical homeostasis 37
0.081727329
biological_process
regulation of programmed cell death 45
0.088334937
biological_process regulation of cell death 45
0.090526108
biological_process
regulation of actin polymerization or depolymerization 10
0.09069631
biological_process ion transmembrane transport 8
0.091831322
biological_process
regulation of I-kappaB kinase/NF-kappaB cascade 16
0.091831322
biological_process response to oxidative stress 16
0.091831322
cellular_component cell 1357
2.98E-166
cellular_component cell part 1357
2.98E-166
cellular_component intracellular 1230
4.80E-165
cellular_component intracellular part 1199
1.07E-161
cellular_component endomembrane system 141 5.04E-12molecular_function
phosphotransferase activity, alcohol group as acceptor 93 1.57E-08
molecular_function antioxidant activity 10
0.065424983
molecular_function
nucleoside-triphosphatase regulator activity 38
0.091831322
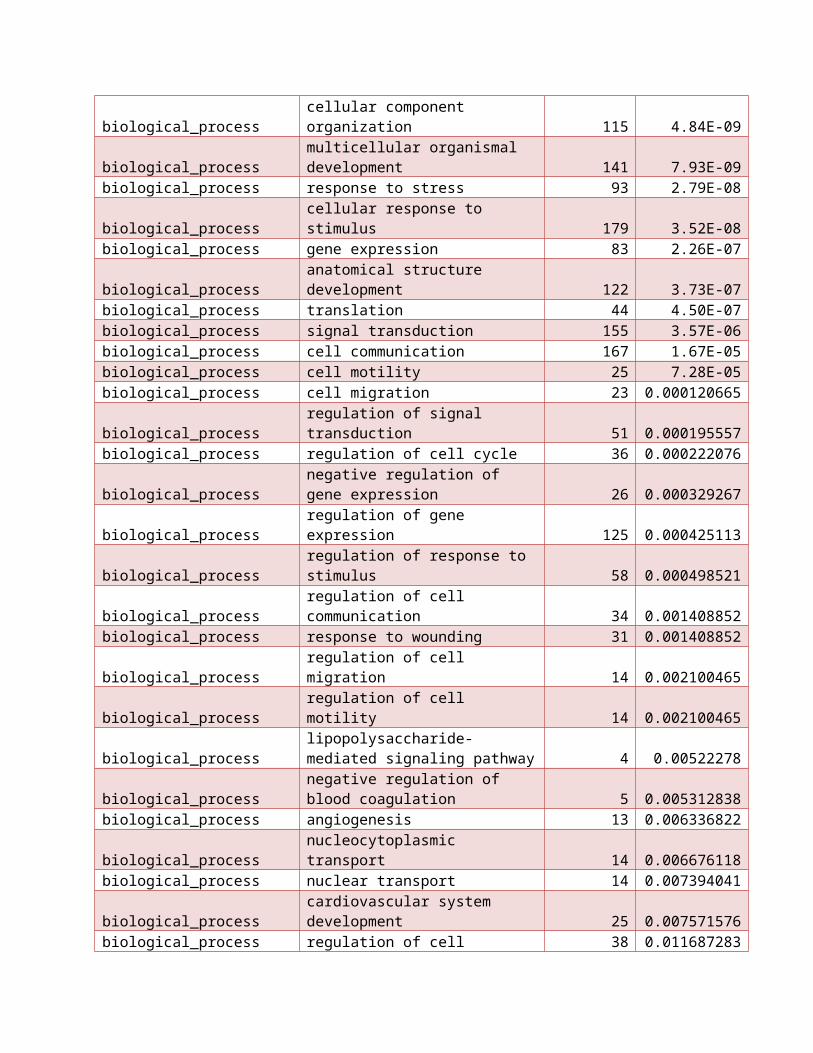
2. Fibrosa side: Oscillatory vs Laminar shear:
Ontology TermNo. of genes p - value
biological_process cellular process 571 3.49E-57biological_process regulation of cellular process 340 8.01E-19biological_process response to stimulus 241 4.25E-12
biological_processcellular component organization 115 4.84E-09
biological_processmulticellular organismal development 141 7.93E-09
biological_process response to stress 93 2.79E-08biological_process cellular response to stimulus 179 3.52E-08biological_process gene expression 83 2.26E-07
biological_processanatomical structure development 122 3.73E-07
biological_process translation 44 4.50E-07biological_process signal transduction 155 3.57E-06biological_process cell communication 167 1.67E-05biological_process cell motility 25 7.28E-05biological_process cell migration 23 0.000120665
biological_processregulation of signal transduction 51 0.000195557
biological_process regulation of cell cycle 36 0.000222076
biological_processnegative regulation of gene expression 26 0.000329267
biological_process regulation of gene expression 125 0.000425113
biological_processregulation of response to stimulus 58 0.000498521
biological_processregulation of cell communication 34 0.001408852
biological_process response to wounding 31 0.001408852biological_process regulation of cell migration 14 0.002100465biological_process regulation of cell motility 14 0.002100465
biological_processlipopolysaccharide-mediated signaling pathway 4 0.00522278
biological_processnegative regulation of blood coagulation 5 0.005312838
biological_process angiogenesis 13 0.006336822biological_process nucleocytoplasmic transport 14 0.006676118biological_process nuclear transport 14 0.007394041
biological_processcardiovascular system development 25 0.007571576
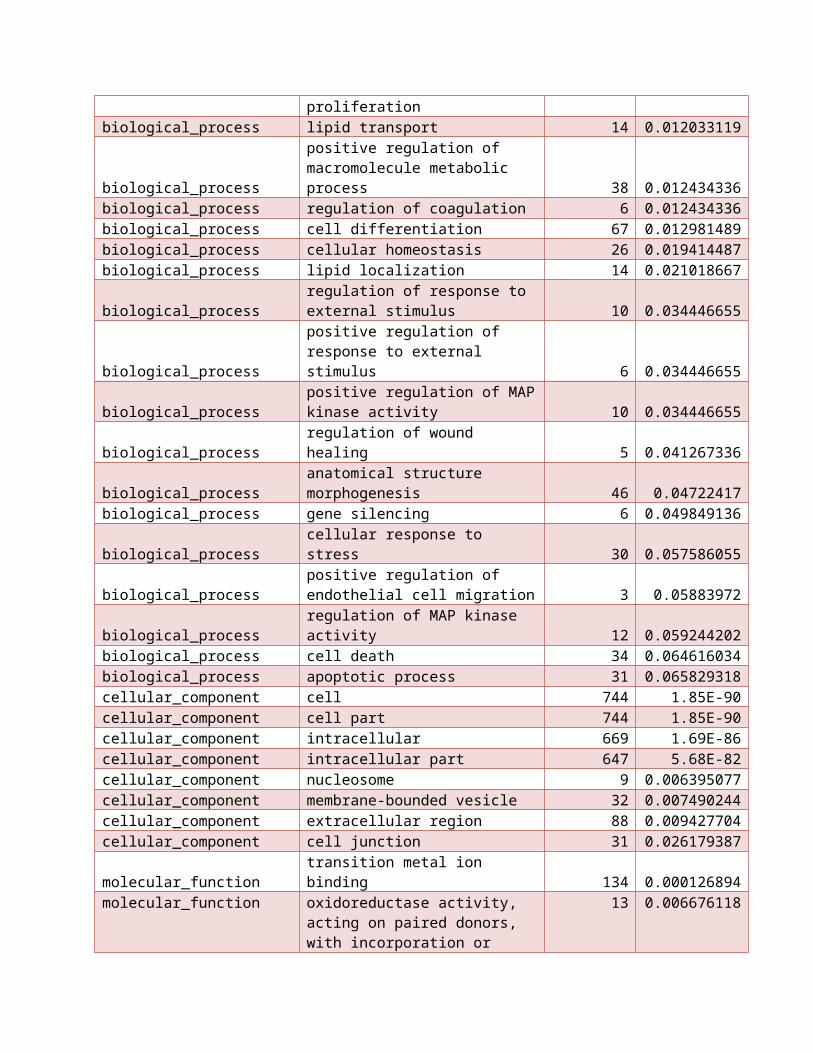
biological_process regulation of cell proliferation 38 0.011687283biological_process lipid transport 14 0.012033119
biological_process
positive regulation of macromolecule metabolic process 38 0.012434336
biological_process regulation of coagulation 6 0.012434336biological_process cell differentiation 67 0.012981489biological_process cellular homeostasis 26 0.019414487biological_process lipid localization 14 0.021018667
biological_processregulation of response to external stimulus 10 0.034446655
biological_processpositive regulation of response to external stimulus 6 0.034446655
biological_processpositive regulation of MAP kinase activity 10 0.034446655
biological_process regulation of wound healing 5 0.041267336
biological_processanatomical structure morphogenesis 46 0.04722417
biological_process gene silencing 6 0.049849136biological_process cellular response to stress 30 0.057586055
biological_processpositive regulation of endothelial cell migration 3 0.05883972
biological_processregulation of MAP kinase activity 12 0.059244202
biological_process cell death 34 0.064616034biological_process apoptotic process 31 0.065829318cellular_component cell 744 1.85E-90cellular_component cell part 744 1.85E-90cellular_component intracellular 669 1.69E-86cellular_component intracellular part 647 5.68E-82cellular_component nucleosome 9 0.006395077cellular_component membrane-bounded vesicle 32 0.007490244cellular_component extracellular region 88 0.009427704cellular_component cell junction 31 0.026179387molecular_function transition metal ion binding 134 0.000126894
molecular_function
oxidoreductase activity, acting on paired donors, with incorporation or reduction of molecular oxygen 13 0.006676118
molecular_function L-ascorbic acid binding 6 0.006767938molecular_function calcium ion binding 55 0.007160141
3. Fibrosa vs Ventricularis side: Oscillatory shear
Ontology Termgenes p
biological_process regulation of catabolic process 2
0.032616666
biological_process cytoplasmic sequestering of NF-kappaB 1
0.08034134
biological_process fatty acid alpha-oxidation 1
0.080861475
biological_process regulation of Cdc42 protein signal transduction 1
0.080861475
biological_process regulation of Cdc42 GTPase activity 1
0.080861475
biological_process
negative regulation of transmembrane transport 1
0.085464824
biological_process
negative regulation of protein import into nucleus 1
0.085464824
biological_process
negative regulation of NF-kappaB import into nucleus 1
0.085464824
biological_process
negative regulation of transcription factor import into nucleus 1
0.085464824
biological_process
cytoplasmic sequestering of transcription factor 1
0.085464824
biological_process
negative regulation of I-kappaB kinase/NF-kappaB cascade 1
0.085464824
biological_process
negative regulation of nucleocytoplasmic transport 1
0.085464824
biological_process
negative regulation of intracellular protein transport 1
0.085464824
biological_process regulation of Rho GTPase activity 1
0.085464824
biological_process positive regulation of Ras GTPase activity 1
0.085464824
biological_process positive regulation of Rho GTPase activity 1
0.085464824
biological_process positive regulation of GTPase activity 1
0.085464824
biological_process positive regulation of protein complex assembly 1
0.086473584
biological_process negative regulation of intracellular transport 1
0.087431714
biological_process regulation of NF-kappaB import into nucleus 1
0.092939231
molecular_function Rac GTPase activator activity 1
0.08034134
molecular_function NF-kappaB binding 1
0.085464824
molecular_function Rac GTPase binding 1
0.085464824
molecular_function Rho GTPase activator activity 1
0.094580619
Discussion:
We were able to generate pathway as well as the gene ontology details for all our comparison groups. PCA analysis indicated that calcified vs healthy human AVs sample data are distinctly grouped into two. Further pathway

analysis showed that these calcified samples expressed genes that involved in the Apoptosis, Wnt signaling, oxidation and statin pathways. These pathways when altered have been known to be involved in the AV disease progression[6]. Further gene ontology revealed that, the calcified valves expressed genes that negatively alter basic cell functions such as cell death, proliferation, migration and development apart from the process that are associated with disease initiating pathways such as angiogenesis, inflammation (via NF-KB pathway), apoptosis, ossification and osteogenesis. These results are also in good agreement with the published results[13].
In order to test our hypothesis, which is fibrosa side when exposed to oscillatory shear stress, expresses genes involved in AV disease progression, we primarily focused on the following groups
1. Overall shear effects: oscillatory vs laminar shear stress 2. Fibrosa: oscillatory vs laminar shear stress3. Oscillatory shear stress: Fibrosa vs Ventricularis
We observed that when fibrosa was exposed to oscillatory vs laminar shear stress, some of the pathways associated with disease were identified, such as osteopontin, wnt signaling, serotonin receptor pathway, blood coagulation inducer, which were not observed on ventricularis side.
Further, specifically, the processes related to anatomic development were seen preferentially on fibrosa when exposed to oscillatory shear. This can be justified stating that, although fibrosa and ventricularis sides are part of the same valve, their composition differs, partly due to the conditioning of the different mechanical stimuli and partly due to genetics. Perhaps, this can also explain the preferential inflammation and calcification of the fibrosa side, under altered mechanical stimuli, compared to ventricularis side, as also reported in an ex vivo study[7].
Genes involved in other functions such as cell cycle, migration, development, proliferation were expressed in all different groups, but at different levels (or numbers). However, the published results indicated other novel mechanosensitive pathways that were not detected by our analysis. This could be due to the differences in the analysis softwares ( such as using JMP vs SAM, open source tools for pathways and ontology vs using Ingenuity Pathway Analysis etc)[12]. Albeit the differences in the pathways identified, we found some of the common pathways between fibrosa exposed to oscillatory shear and calcified human valves. This thus indicated that fibrosa when exposed to low magnitude disturbed shear
stresses such as low oscillatory shear can express genes that are involved in AV disease progression. The negative effects of low magnitude oscillatory shear has been observed even in the atherosclerosis of blood vessels, suggesting that AV disease progression can potentially share some similarities with that of atherosclerosis[14].
References:
1. Rajamannan, N.M., R.O. Bonow, and S.H. Rahimtoola, Calcific aortic stenosis: an update. Nat Clin Pract Cardiovasc Med, 2007. 4(5): p. 254-262.
2. Otto, C.M., et al., Association of Aortic-Valve Sclerosis with Cardiovascular Mortality and Morbidity in the Elderly. N Engl J Med, 1999. 341(3): p. 142-147.
3. Stewart, M.D.F.B.F., et al., Clinical Factors Associated With Calcific Aortic Valve Disease. Journal of the American College of Cardiology, 1997. 29(3): p. 630-634.
4. Rabkin, S.W., The association of hypertension and aortic valve sclerosis. Blood Pressure, 2005. 14(5): p. 264-272.
5. Thubrikar, M., The aortic valve1990, Boca Raton, Fla. :: CRC Press.6. Miller, J.D., R.M. Weiss, and D.D. Heistad, Calcific Aortic Valve
Stenosis: Methods, Models, and Mechanisms. Circulation Research, 2011. 108(11): p. 1392-1412.
7. Sucosky, P., et al., Altered Shear Stress Stimulates Upregulation of Endothelial VCAM-1 and ICAM-1 in a BMP-4- and TGF-{beta}1-Dependent Pathway. Arterioscler Thromb Vasc Biol, 2009. 29(2): p. 254-260.
8. Weston, M. and A. Yoganathan, Biosynthetic Activity in Heart Valve Leaflets in Response to In Vitro Flow Environments. Annals of Biomedical Engineering, 2001. 29(9): p. 752-763.
9. Sorescu, G.P., et al., Bone Morphogenic Protein 4 Produced in Endothelial Cells by Oscillatory Shear Stress Induces Monocyte Adhesion by Stimulating Reactive Oxygen Species Production From a Nox1-Based NADPH Oxidase. Circulation Research, 2004. 95(8): p. 773-779.
10. Ge, L. and F. Sotiropoulos, Direction and Magnitude of Blood Flow Shear Stresses on the Leaflets of Aortic Valves: Is There a Link With Valve Calcification? Journal of Biomechanical Engineering, 2010. 132(1): p. 014505.
11. Hsu, S.Y., et al., Aortic valve sclerosis is an echocardiographic indicator of significant coronary disease in patients undergoing diagnostic coronary angiography. International Journal of Clinical Practice, 2005. 59(1): p. 72-77.
12. Holliday, C.J., et al., Discovery of Shear- and Side-specific mRNAs and miRNAs in Human Aortic Valvular Endothelial Cells. American Journal of Physiology - Heart and Circulatory Physiology, 2011.
13. Bosse, Y., et al., Refining Molecular Pathways Leading to Calcific Aortic Valve Stenosis by Studying Gene Expression Profile of Normal and Calcified Stenotic Human Aortic Valves. Circulation-Cardiovascular Genetics, 2009. 2(5): p. 489-U185.
14. Agmon, Y., et al., Aortic valve sclerosis and aortic atherosclerosis: different manifestations of the same disease?: Insights from a population-based study. J Am Coll Cardiol, 2001. 38(3): p. 827-834.