Embed Size (px)
Citation preview

Take-over time in highly automated vehicles: non-critical transitions to and from manual control
Alexander Eriksson, Neville A Stanton
Transportation Research Group, Faculty of Engineering and the Environment, University of
Southampton, Boldrewood campus, SO16 7QF, UK
Running head: Take-over time in automated vehicles
Manuscript type: Research article
Word count: 4791
Corresponding author: Alexander Eriksson Transportation Research Group, Faculty of Engineering and the Environment, University of Southampton, Boldrewood campus, SO16 7QF, UK. Email: [email protected]
Acknowledgements: This research has been conducted as a part of the European Marie Curie ITN
project HFAuto - Human Factors of Automated driving (PITN-GA-2013-605817)
Biographies
Alexander Eriksson, MSc, received his Master of Science degree in Cognitive Science from Linköping
University in 2014 and is currently a Marie Curie Research Fellow in the EU funded Marie Curie
International Training Network on Human Factors in Highly Automated Vehicles (HF-Auto) within the
Faculty of Engineering and the Environment at the University of Southampton where he is undertaking
his PhD research. His primary research focus is on human-automation interaction, specifically in how
automated vehicles hands back control to the driver in terms of information presentation and cues.
Professor Neville Stanton, PhD, DSc, is a Chartered Psychologist, Chartered Ergonomist and a Chartered
Engineer and holds the Chair in Human Factors Engineering in the Faculty of Engineering and the
Environment at the University of Southampton. He is leading the EPSRC/JLR funded project on Human
Interaction: Designing Automated Vehicles (HI:DAVe) and is a partner in the EU funded Marie Curie
International Training Network on Human Factors in Highly Automated Vehicles (HF-Auto).
1
2
3
4
5
6
7
8910
11
12
13
14
15
16
17
18
19
20
21
22
23
24
25
Abstract
Objective: The aim of this study was to review existing research into driver control transitions and to determine the time it takes drivers to resume control from a highly automated vehicle in non-critical scenarios. Background: Contemporary research has moved from an inclusive design approach to only adhering to mean/median values when designing control transitions in automated driving. Research into control transitions in highly automated driving has focused on urgent scenarios where drivers are given a relatively short time span to respond to a request to resume manual control. We found a paucity in research into more frequent scenarios for control transitions, such as planned exits from highway systems.Method: Twenty six drivers drove two scenarios with an automated driving feature activated. Drivers were asked to read a newspaper, or to monitor the system, and to relinquish, or resume, control from the automation when prompted by vehicle systems.Results: Significantly longer control transition times were found between driving with and without secondary tasks. Control transition times were substantially longer than those reported in the peer-reviewed literature.Conclusion: We found that drivers take longer to resume control when under no time-pressure compared to that reported in the literature. Moreover, we found that drivers occupied by a secondary task exhibit larger variance, and slower responses to requests to resume control. Workload scores implied optimal workload.Application: Intra- and inter-individual differences need to be accommodated by vehicle manufacturers and policy makes alike to ensure inclusive design of contemporary systems and safety during control transitions.
Keywords: Automation, Automated Driving, Control Transitions, Take-Over Requests, Driving
Performance, Task Regulation
Précis: This study reviews the literature for non-critical control transitions in highly automated driving and contrasts the reported results with driver-paced control transitions. The results show increased response times compared to the literature, and when engaged in secondary tasks compared with no task engagement. The study also reports on transition times from manual to automated driving for the first time.
Topic Choice: Surface Transportation
26
27
28293031323334353637383940414243444546474849
50
51
5253545556
57

Introduction
Highly automated vehicles are becoming an engineering reality and will become commonplace on
our roads in the very near future (Walker et al., 2015). For example, Tesla released its Autopilot
feature in 2015, with BMW, Mercedes and Audi quickly following with similar technologies (Audi,
2014; BMW, 2013; safecarnews.com, 2015). It is a common misconception that these features are
‘highly automated’ when they are in fact classified as conditional driving automation (SAE Level 3,
'SAE International, 2016). This means that they come with limitations, such as the features may only
be intended for use under certain Operational Design Domains, for example, on highways, as well as
requiring driver monitoring and intervention (Stanton et al., 1997; Wolterink et al., 2011).
When using a driver assistance system that is able to automate the driving task to such an extent
that hands- and feet-free driving is possible (SAE Level 3, 'SAE International, 2016), the driver
becomes decoupled from the operational and tactical levels of control (Michon, 1985; Stanton &
Young, 2005), leaving the high level strategic goals to be dealt with by the driver (until the point of
resuming manual control). This is a form of “driver-initiated automation”, where the driver is in
control of when the system becomes engaged or disengaged (Banks & Stanton, 2015, 2016; Lu & de
Winter, 2015). Indeed, according to Bainbridge (1983), two of the most important tasks for humans
in automated systems are monitoring the system to make sure it performs according to expectations
and to be ready to resume control when the automation deviates from expectation (Stanton &
Marsden, 1996). Research has shown that vehicle automation has a negative effect on mental
workload and situation awareness (Endsley & Kaber, 1999; Kaber & Endsley, 1997; Stanton et al.,
1997; Stanton & Young, 2005; Young & Stanton, 2002), and that reaction times increase as the level
of automation increases (Young & Stanton, 2007). This becomes problematic when the driver is
expected to regain control when system limits are exceeded, as a result of a sudden automation
failure. Failure-induced transfer of control has been extensively studied (see Desmond et al., 1998;
Molloy & Parasuraman, 1996; Stanton et al., 1997; Stanton et al., 2001; Strand et al., 2014; Young &
Stanton, 2007). In one failure-induced control-transition-scenario, Stanton et al. (1997) found that
58
59
60
61
62
63
64
65
66
67
68
69
70
71
72
73
74
75
76
77
78
79
80
81
82
83

more than a third of drivers failed to regain control of the vehicle following an automation failure
whilst using Adaptive Cruise Control. Other research has shown that it takes approximately one
second for a driver manually driving to respond to an unexpected and sudden braking event in traffic
(Summala, 2000; Swaroop & Rajagopal, 2001; Wolterink et al., 2011). Young and Stanton (2007)
report brake reaction times of 2.13±0.55 seconds for drivers using Adaptive Cruise Control (SAE Level
1), and brake reaction times of 2.48±0.66 seconds for drivers with Adaptive Cruise Control and
Assistive Steering (SAE Level 2). By contrasting the results from Young and Stanton (2007) where
drivers experienced an automation failure whilst a lead vehicle suddenly braked, with Summala
(2000) it seems like it takes an additional 1.1-1.5 seconds to react to sudden events requiring braking
whilst driving with Driver Assistance Automation (SAE Level 1) and Partial Driving Automation (SAE
Level 2). This increase, in combination with headways as short as 0.3 seconds (Willemsen et al.,
2015) coupled with evidence that drivers are poor monitors (Molloy & Parasuraman, 1996), could
actually cause accidents. Evidently, automating the driving task seem to have a detrimental effect on
driver reaction time (Young & Stanton, 2007). Therefore, as Cranor (2008) and Eriksson and Stanton
(2016) proposed, the driver needs to receive appropriate feedback if they are to successfully re-
enter the driving control loop. Recent research efforts have been made to determine the optimal
Take-Over-Request lead time (TORlt: the lead-time from a ‘take-over request’ (TOR) to a critical
event, such as a stranded vehicle) and Take Over reaction time (TOrt: the time is takes the driver to
take back control of the vehicle from the automated system when a TOR has been issued) with times
varying from 0-30 seconds for TORlt and 1.14-15 seconds for TOrt as shown in Table 1. A total of 25
papers reported either TORlt, or TOrt and were included in the review (see Table 1).
Table 1. Papers included in the review. Modalities for the Take-over request is coded as: A = Auditory, V = Visual, H = Haptic and B = Brake Jerk.Paper TORlt TOrt Modality1 Gold et al. (2016) 7 2.47-3.61 -2 Körber et al. (2015) 3 - A3 Louw et al. (2015b) 6.5 2.18-2.47 A4 Zeeb et al. (2016) 2.5, 4 - V5 Damböck et al. (2012) 4, 6, 8 - A6 Kerschbaum et al. (2015) 7 2.22-3.09 V A
84
85
86
87
88
89
90
91
92
93
94
95
96
97
98
99
100
101
102
103
104
105106
7 Belderbos (2015) 10 5.86-5.87 V A H8 Walch et al. (2015) 4, 6 1.90-2.75 V A9 Lorenz et al. (2014) 7 2.86-3.03 V A10 Merat et al. (2014) 0 10-15 -11 Naujoks et al. (2014) - 2.29-6.90 V A12 Schömig et al. (2015) 12 - V A 13 Louw et al. (2015a) 3 - V A14 Zeeb et al. (2015) 2.5, 3, 3.5, 12 1.14 V A15 Mok et al. (2015) 2, 5, 8 - A16 Gold et al. (2014) 5 1.67-2.22 V A17 Radlmayr et al. (2014) 7 1.55-2.92 V A18 Dogan et al. (2014) 3 - V A19 Gold et al. (2013) 5, 7 2.06-3.65 V A20 van den Beukel and van der Voort (2013) 1.5, 2.2, 2.8 - A21 Melcher et al. (2015) 10 3.42-3.77 V A B22 Naujoks and Nekum (2014) 0, 1, 2, 3, 4 - V A23 Feldhütter et al. (2016) 6 1.88-2.24 A24 Payre et al. (2016) 2, 30 4.30-8.70 V A25 Körber et al. (2016) 7 2.41-3.66 A
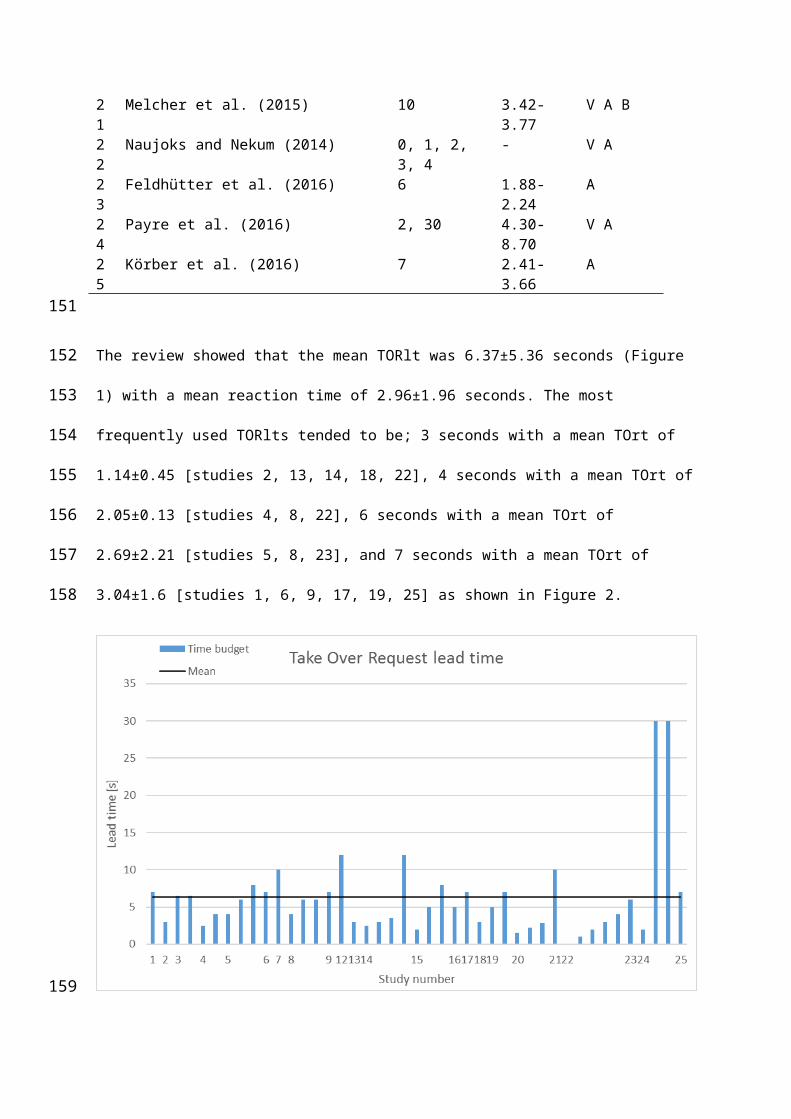
The review showed that the mean TORlt was 6.37±5.36 seconds (Figure 1) with a mean reaction time
of 2.96±1.96 seconds. The most frequently used TORlts tended to be; 3 seconds with a mean TOrt of
1.14±0.45 [studies 2, 13, 14, 18, 22], 4 seconds with a mean TOrt of 2.05±0.13 [studies 4, 8, 22], 6
seconds with a mean TOrt of 2.69±2.21 [studies 5, 8, 23], and 7 seconds with a mean TOrt of
3.04±1.6 [studies 1, 6, 9, 17, 19, 25] as shown in Figure 2.
107
108
109
110
111
112

Figure 1. The TORlt used in the reviewed papers. Several papers used a multitude of TOR lead times and thus contributed on several points of the graph.
Take Over reaction times stay fairly consistent around 2-3.5 seconds in most control transitions, with
a few outliers, as seen in Figure 2. Belderbos (2015), Merat et al. (2014), Naujoks et al. (2014) and
Payre et al. (2016) show longer TOrt compared to the rest of the reviewed papers. Merat et al.
(2014) and Naujoks et al. (2014) had the control transition initiated without any lead time whereas
Belderbos (2015) and Payre et al. (2016) did. Merat et al. (2014) showed that there is a 10-15 second
time lag between the disengagement of the automated driving system and resumption of control by
the driver. Notably, the control transition was system initiated and lacked a pre-emptive TOR which
may have caused the increase in TOrt. Similarly, Naujoks et al. (2014) observed a 6.9 second TOrt
from when a TOR was issued and the automation disconnected until the driver resumed control in
situations where automation became unavailable due to missing line markings, the beginning of a
work zone or entering a curve. Based on personal communication with the author, the vehicle would
have crossed the lane markings after approximately 13 seconds, and would have reached the faded
lane markings approximately 10 seconds after the TOR. The velocity in Naujoks et al. (2014) was 50
113114115116
117
118
119
120
121
122
123
124
125
126
127
128
129
Kph, which is fairly slow compared to most other TOR studies that use speeds over 100 Kph [studies
1, 3, 4, 6, 9, 10, 12, 14, 17, 19, 21, 23, 24, 25] and may have had an effect on the perceived urgency.
Figure 2. Take Over reaction time averages for all the conditions in the reviewed studies. Some studies had more than one take over event and is therefore featured multiple times.
Belderbos (2015) showed TOrt’s of 5.86±1.57 to 5.87±4.01 when drivers were given a TORlt of 10
seconds during unsupervised automated driving. Payre et al. (2016) utilised two different TORlt’s, 2,
and 30 seconds. These TORlt’s produced significant differences in TOrt, the 2 second TORlt produced
a TOrt of 4.3±1.2 seconds and the two scenarios that used the 30 second TORlt produced TOrt’s of
8.7±2.7 seconds and 6.8±2.5 seconds respectively. The shorter TOrt of the two 30 second TOR
events occurred after the 2 second emergency TOR and could have been affected by the urgency
caused by the short lead time in the preceding, shorter TOR.
Merat et al. (2014) concluded, based on their observed TOrt, that there is a need for a timely and
appropriate notification of an imminent control transition. This observation is in line with the current
SAE-guidelines which state that the driver “Is receptive to a request to intervene and responds by
performing dynamic driving task fallback in a timely manner”(SAE International, 2016, p. 20). In
initial efforts to determine how long in advance the driver needs to be notified before a control
130
131
132133134135
136
137
138
139
140
141
142
143
144
145
146
147

transition is initiated, Damböck et al. (2012) and Gold et al. (2013) explored a set of TOR lead times.
Damböck et al. (2012) utilised three TORlt’s, 4, 6, and 8 seconds and found that given an 8 second
lead time, drivers did not differ significantly from manual driving. This was confirmed by Gold et al.
(2013) who reported that drivers need to be warned at least 7 seconds in advance of a control
transition to safely resume control. These findings seem to have been the inspiration for the TORlt of
some recent work utilising timings around 7 seconds [studies 1, 6, 9, 17].
A caveat of a number of the reviewed studies is that the lead time given in certain scenarios such as;
disappearing lane markings, construction zones, and merging motorway lanes is surprisingly short,
from 0 to 12 seconds (c.f. Table 1), and will likely be longer in on road use cases [studies 4, 5, 11, 14,
15, 21]. The reason for this is the increasing accuracy of contemporary GPS hardware and associated
services, such as Google Maps. Such services are already able to direct lane positioning whilst driving
manually, as well as notifying drivers of construction zones and alternate, faster routes. Thus, there
is no evident gain of having short lead times in such situations.
Several of the studies reviewed have explored the effect of TOR’s in different critical settings by
issuing the TOR immediately preceding a time critical event [studies 1, 2, 3, 4, 6, 7, 8, 9, 13, 16, 17,
19, 20, 23, 24, 25]. These studies have explored how drivers manage critical situations in terms of
driving behaviour, workload, and scanning behaviour. Whilst it is of utmost importance to know how
quickly a driver can respond to a TOR and what the shortest TOR-times are in emergencies, there is a
paucity of research exploring the time it takes a driver to resume control in normal, non-critical,
situations. We argue that if the design of normal, non-critical, control transitions are designed based
on data obtained in studies utilising critical situations, there is a risk of unwanted consequences such
as: drivers not responding optimally due to too short lead time (suboptimal responses are
acceptable in emergencies as drivers are tasked with avoiding danger), drivers being unable to fully
regain situation awareness, and sudden, dramatic, increases in workload. Arguably, these
consequences should not be present in every transition of control as it poses a safety risk for the
148
149
150
151
152
153
154
155
156
157
158
159
160
161
162
163
164
165
166
167
168
169
170
171
172
driver, as well as other road users. Therefore, the aim of this study is to establish driver take-over
time in normal traffic situations when, e.g. the vehicle is leaving its Operational Design Domain as
these will account for most of the situations (Nilsson, 2014; SAE International, 2016). We also
explore how TOR take-over time is affected by a non-driving secondary task, as this was expected to
increase the reaction time (Merat et al., 2012).
Moreover, none of the papers included in the review mentioned the time it takes drivers to
transition from manual to automated driving. Gaining an understanding on the time required to
toggle an automated driving system on is important in situations such as: entering an area dedicated
to automated vehicles or engaging the automated driving mode in preparation for joining a platoon
as proposed by the SARTRE project (Robinson et al., 2010). Therefore, the aim of this study was to
establish the time it takes a driver to switch to automated driving when automated driving features
become available. Ultimately, this research aims to provide guidance about the lead-time required
to get the driver back into, and out of, the manual vehicle control loop.
Method
Participants
Twenty-six participants (10 females, 16 males) between 20 and 52 years of age (M = 30.27 SD = 8.52)
with a minimum one year and an average 10.57 years (SD = 8.61) of driving experience were asked
to take part in the trial. Upon recruiting participants, their informed consent was obtained. The
study complied with the American Psychological Association Code of Ethics and had been approved
by the University of Southampton Ethics Research and Governance Office (ERGO number 17771).
Equipment
The experiment was carried out in a fixed based driving simulator located at the University of
Southampton. The simulator was a Jaguar XJ 350 with pedal and steering sensors provided by
Systems Technology Inc. as part of STISIM Drive® M500W Version 3
173
174
175
176
177
178
179
180
181
182
183
184
185
186
187
188
189
190
191
192
193
194
195
196

(http://www.stisimdrive.com/m500w) providing a projected 140° field of view. Rear view- and side-
mirrors were provided through additional projectors and video cameras. The original Jaguar XJ
instrument cluster was replaced with a 10.6” Sharp LQ106K1LA01B Laptop LCD panel connected to
the computer via a RTMC1B LCD controller board to display computer generated graphics
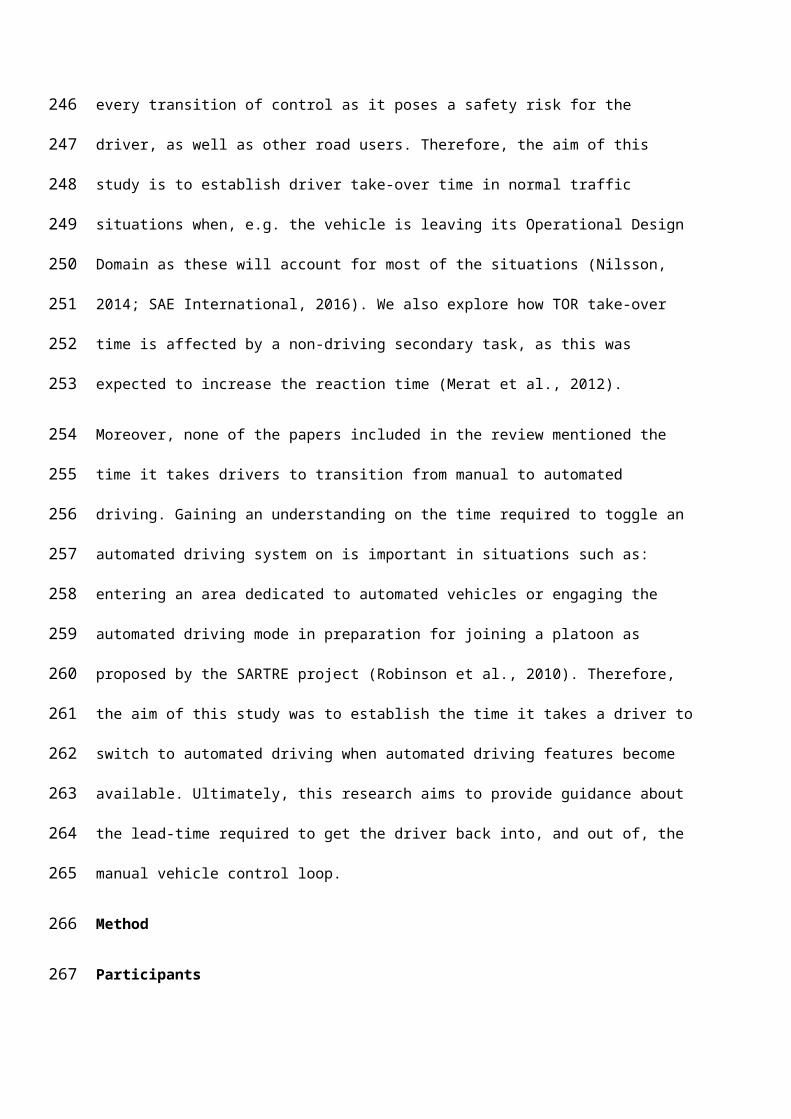
components for TOR’s. The default configuration of the instrument cluster is shown in Figure 3.
Figure 3. The instrument cluster in its default configuration
When a TOR was issued the engine speed dial was hidden and the request was shown in its place.
The symbol asking for control resumption is shown in Figure 5 and the symbol used to prompt the
driver to re-engage the automation is shown in Figure 4.
197
198
199
200
201
202
203204205
206
207

Figure 4. The icon shown when the automation becomes available. The icon was coupled with a
computer generated voice message stating “automation available”.
Figure 5. The take-over request icon shown on the instrument cluster. The icon was coupled with a
computer generated voice message stating "please resume control”.
The mode switching human machine interface was located on a Windows tablet in the centre
console, consisting of two buttons, used either to engage, or to disengage the automation. To enable
208
209
210
211212
213
214
215

dynamic dis-engagement and re-engagement of the automation, bespoke algorithms were
developed and are reported elsewhere (c.f. Eriksson et al., 2016).
Experiment Design
The experiment had a repeated-measures, within-subject design with three conditions; Manual,
Highly Automated Driving (HAD) and Highly Automated Driving with a secondary task. The conditions
were counterbalanced to counteract order effects. For the automated conditions, participants drove
at 70 mph on a 30 kilometre, three lane highway with some curves, with oncoming traffic in the
opposing three lanes separated by a barrier and moderate traffic conditions. The route was mirrored
between the two automated conditions to reduce familiarity effects whilst keeping the roadway
layout consistent.
In the secondary task condition, drivers were asked to read (in their head) an issue of National
Geographic whilst the automated driving system was engaged in order to remove them from the
driving (and monitoring) task. During both conditions, drivers were prompted to either resume
control from, or relinquish control to, the automated driving system. The control transition requests
were presented as both a visual cue (c.f. Figure 4 and Figure 5) and an auditory message, in line with
previous research [studies 6,7,8,9,11,12,13,14,16,17,18,19,22,24], in the form of a computer
generated, female voice stating “please resume control” or “automation available”. No haptic
feedback was included in this study, despite the findings from Petermeijer et al. (2016) and Scott and
Gray (2008) showing shorter reaction times when vibrotactile feedback was used. The motivation for
excluding the haptic modality was that it was under-represented in the review, with only 1 paper in
the review utilising a form of haptic feedback. Furthermore, Petermeijer et al. (2016) concluded that
haptic feedback is best suited for warnings, and as the current experimental design explored non-
critical warnings, no motivation for including haptics could be found. The interval in which these
requests were issued ranged from 30-45 seconds, thus allowing for approximately 24 control
transitions of which half were to manual control.
216
217
218
219
220
221
222
223
224
225
226
227
228
229
230
231
232
233
234
235
236
237
238
239
240

Procedure
Upon arrival, participants were asked to read an information sheet, containing information regarding
the study, the right to at any point abort their trial without any questions asked. After reading the
information sheet the participants were asked to sign an informed consent form. They were also told
that they were able to override any system inputs via the steering wheel, throttle or brake pedals.
Drivers were reminded that they were responsible for the safe operation of the vehicle regardless of
its mode (manual or automated), and thus needed to be able to safely resume control in case of
failure. This is in accordance with current legislation (United Nations, 1968) and recent amendments
to the Vienna Convention of Road Traffic. They were informed that the system may prompt them to
either resume or relinquish control of the vehicle, and that when such a prompt was issued they
were required to adhere to the instruction, but only when they felt safe doing so. This instruction
was intended to reduce the pressure on drivers to respond immediately and to reinforce the idea
that they were ultimately responsible for safe vehicle operation.
At the end of each driving condition, participants were asked to fill out the NASA-RTLX (Byers et al.,
1989). They were also offered a short break before continuing the study. Reaction time data were
logged for each transition to and from manual control.
Dependent variables
The following metrics were collected for each condition per participant.
Reaction time to the control transition request was recorded from the onset of the TOR. The control
transition request was presented in the instrument cluster coupled with a computer generated voice
to initiate a change in mode to and from manual control and was recorded in milliseconds.
Driving performance as measured by Standard Deviation of Steering Angular rate (degrees / second).
241
242
243
244
245
246
247
248
249
250
251
252
253
254
255
256
257
258
259
260
261
262
Subjective workload scores were collected via the NASA-TLX sub-scales at the end of each driving
condition. Overall workload score was calculated through the summation of sub-scales (Byers et al.,
1989; Hart & Staveland, 1988).
Analysis
The dependent measures were tested for normal distribution using the Kolmogorov-Smirnov test,
which revealed that the data was non-normally distributed. To assess driving performance after
control was handed back to the driver, a measure of the standard deviation of the absolute steering
angular rate was used to capture corrective steering actions (Fisher et al., 2011 ch 40, pp 10).
Furthermore, as the TOrt data is reaction time data, the median TOrt values for each participant was
calculated after which Wilcoxon signed-rank test was used to analyse the time and workload data.
The box plots in Figure 6 and Figure 8 had their outlier thresholds adjusted to accommodate the log-
normal distribution of the TOrt data by using the LIBRA library for MatLab (Verboven & Hubert,
2005) and its method for robust boxplots for non-normally distributed data by Hubert and
Vandervieren (2008). Effect sizes were calculated as: r = abs(Z/√N).
263
264
265
266
267
268
269
270
271
272
273
274
275
276

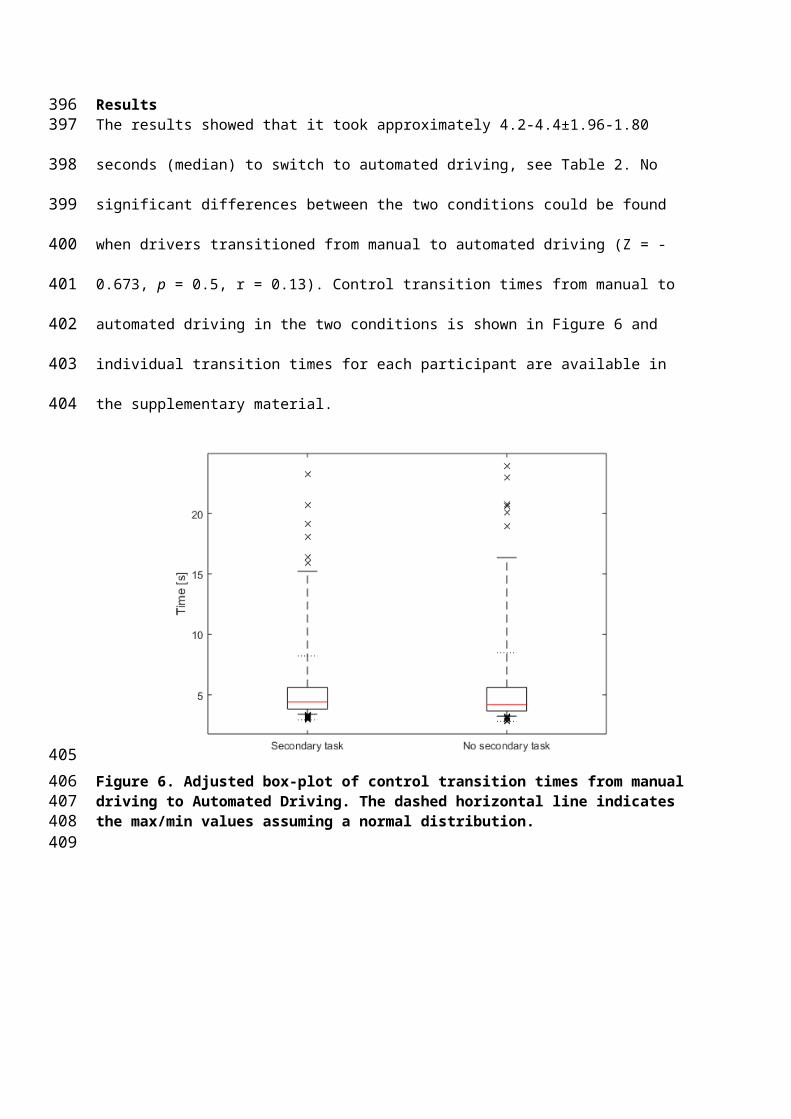
Results The results showed that it took approximately 4.2-4.4±1.96-1.80 seconds (median) to switch to
automated driving, see Table 2. No significant differences between the two conditions could be
found when drivers transitioned from manual to automated driving (Z = -0.673, p = 0.5, r = 0.13).
Control transition times from manual to automated driving in the two conditions is shown in Figure 6
and individual transition times for each participant are available in the supplementary material.
Figure 6. Adjusted box-plot of control transition times from manual driving to Automated Driving. The dashed horizontal line indicates the max/min values assuming a normal distribution.
277278
279
280
281
282
283284285286
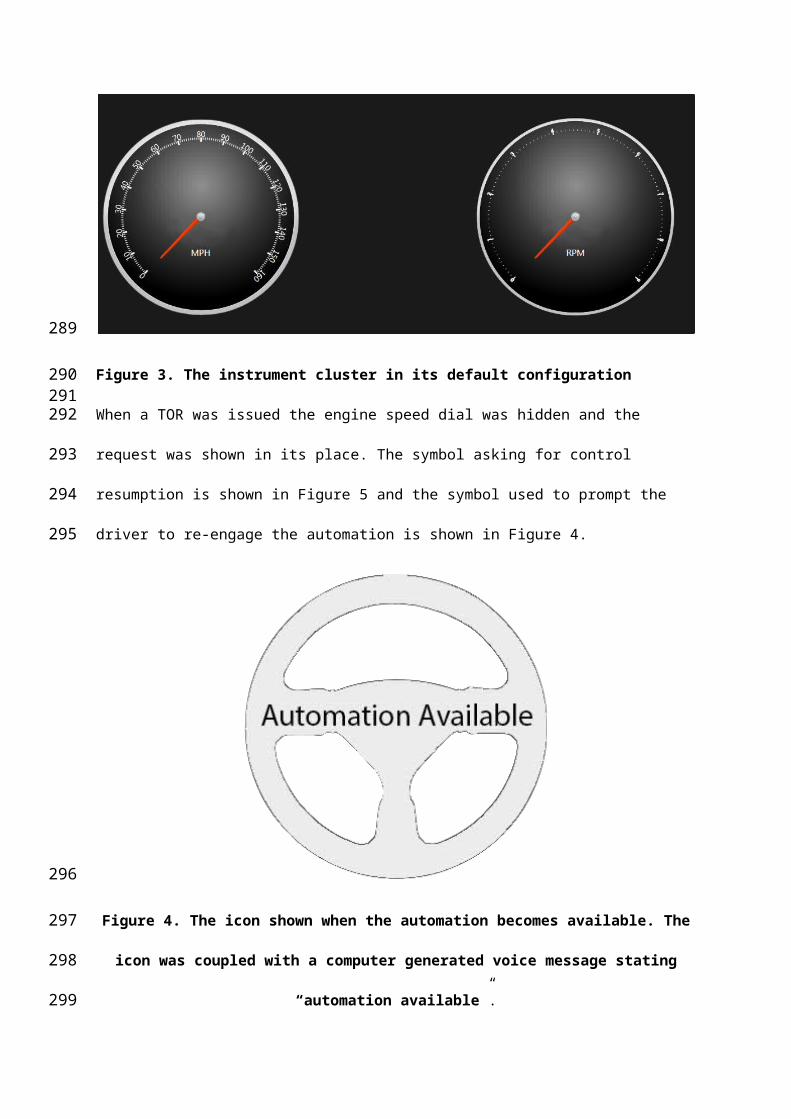
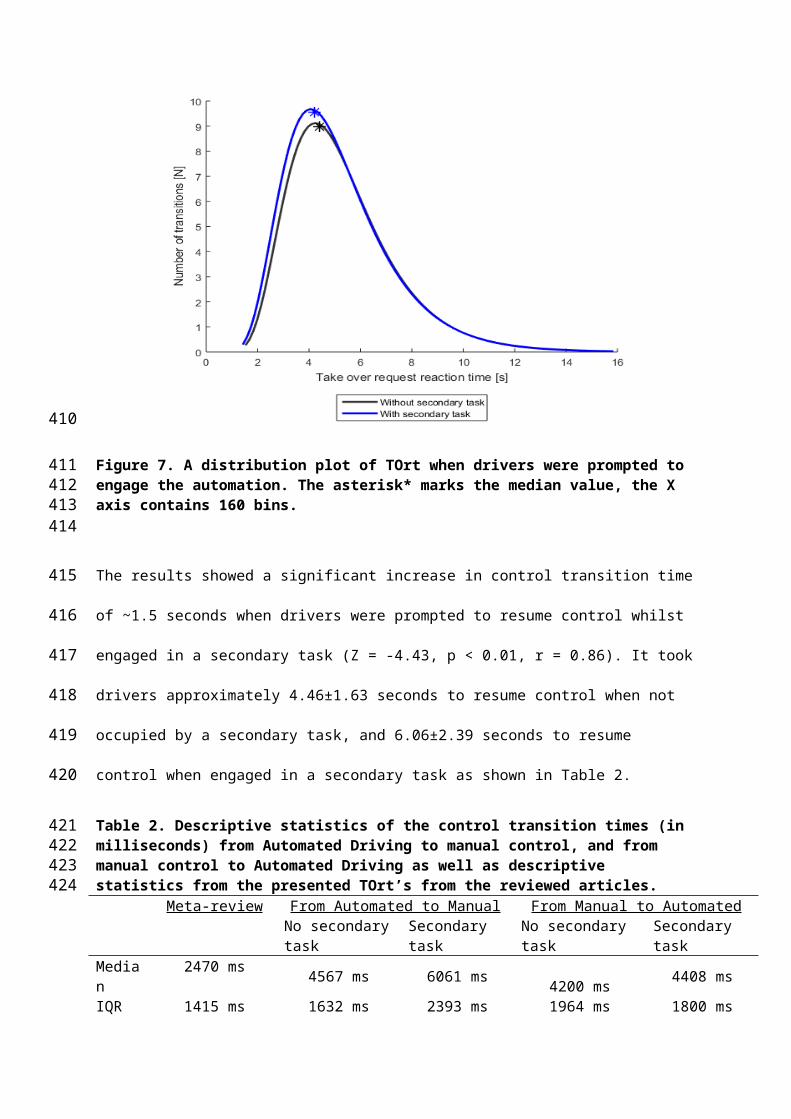
Figure 7. A distribution plot of TOrt when drivers were prompted to engage the automation. The asterisk* marks the median value, the X axis contains 160 bins.
The results showed a significant increase in control transition time of ~1.5 seconds when drivers
were prompted to resume control whilst engaged in a secondary task (Z = -4.43, p < 0.01, r = 0.86). It
took drivers approximately 4.46±1.63 seconds to resume control when not occupied by a secondary
task, and 6.06±2.39 seconds to resume control when engaged in a secondary task as shown in Table
2.
Table 2. Descriptive statistics of the control transition times (in milliseconds) from Automated Driving to manual control, and from manual control to Automated Driving as well as descriptive statistics from the presented TOrt’s from the reviewed articles.
Meta-review From Automated to Manual From Manual to AutomatedNo secondary task Secondary task No secondary task Secondary task
Median 2470 ms 4567 ms 6061 ms 4200 ms 4408 msIQR 1415 ms 1632 ms 2393 ms 1964 ms 1800 msMin 1140 ms 1975 ms 3179 ms 2822 ms 2926 msMax 15000 ms 25750 ms 20994 ms 23884 ms 23221 ms
287
288289290
291
292
293
294
295
296297298
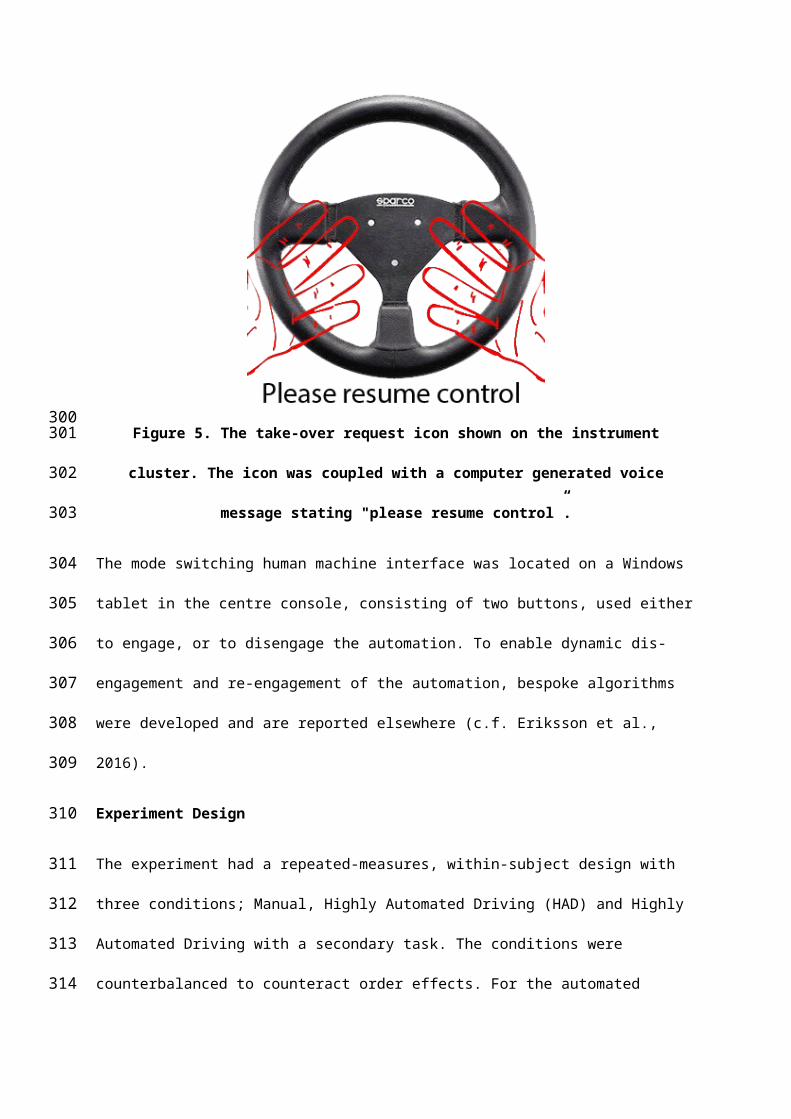
Figure 8. Adjusted boxplot of the Take Over reaction time when switching from automated to manual control in the two experimental conditions contrasted with the TOrt of the reviewed papers.
299
300301302303304

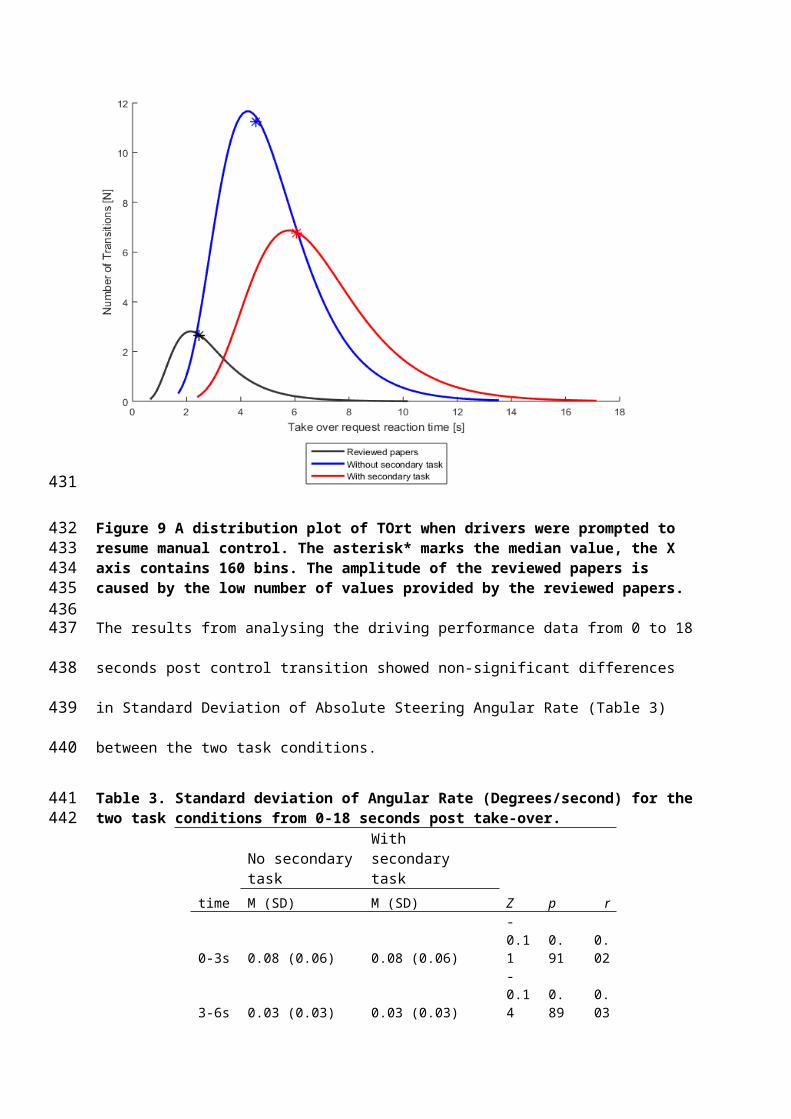
Figure 9 A distribution plot of TOrt when drivers were prompted to resume manual control. The asterisk* marks the median value, the X axis contains 160 bins. The amplitude of the reviewed papers is caused by the low number of values provided by the reviewed papers.
The results from analysing the driving performance data from 0 to 18 seconds post control transition
showed non-significant differences in Standard Deviation of Absolute Steering Angular Rate (Table 3)
between the two task conditions.
Table 3. Standard deviation of Angular Rate (Degrees/second) for the two task conditions from 0-18 seconds post take-over.
No secondary task With secondary task
time M (SD) M (SD) Z p r
0-3s 0.08 (0.06) 0.08 (0.06) -0.11 0.91 0.023-6s 0.03 (0.03) 0.03 (0.03) -0.14 0.89 0.036-9s 0.02 (0.02) 0.06 (0.17) -1.48 0.13 0.299-12s 0.02 (0.02) 0.11 (0.44) -0.98 0.33 0.1912-15s 0.02 (0.02) 0.11 (0.45) -0.39 0.69 0.0815-18s 0.03 (0.07) 0.13 (0.51) -0.42 0.67 0.08
305
306307308309310
311
312
313314
315
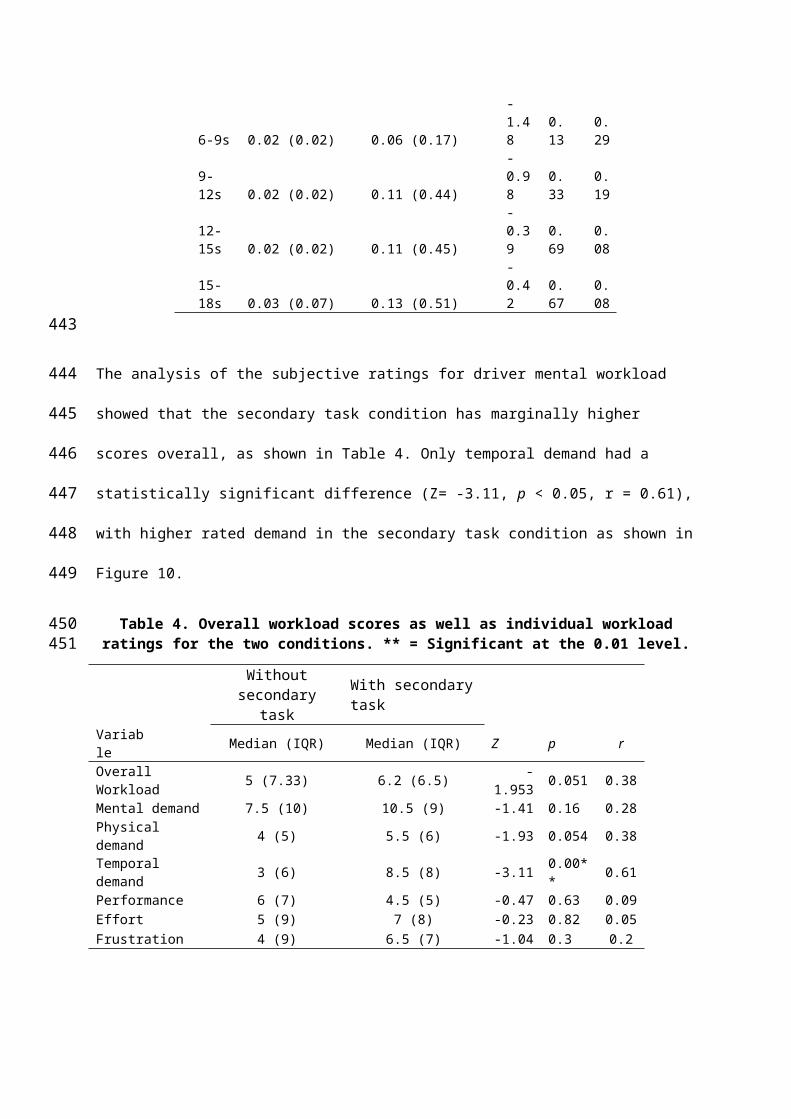
The analysis of the subjective ratings for driver mental workload showed that the secondary task
condition has marginally higher scores overall, as shown in Table 4. Only temporal demand had a
statistically significant difference (Z= -3.11, p < 0.05, r = 0.61), with higher rated demand in the
secondary task condition as shown in Figure 10.
Table 4. Overall workload scores as well as individual workload ratings for the two conditions. ** = Significant at the 0.01 level.
Without secondary
task With secondary task
Variable Median (IQR) Median (IQR) Z p rOverall Workload 5 (7.33) 6.2 (6.5) -1.953 0.051 0.38Mental demand 7.5 (10) 10.5 (9) -1.41 0.16 0.28Physical demand 4 (5) 5.5 (6) -1.93 0.054 0.38Temporal demand 3 (6) 8.5 (8) -3.11 0.00** 0.61Performance 6 (7) 4.5 (5) -0.47 0.63 0.09Effort 5 (9) 7 (8) -0.23 0.82 0.05Frustration 4 (9) 6.5 (7) -1.04 0.3 0.2
316
317
318
319
320321
322
323

Figure 10. Boxplot of Subjective estimations of workload in the two conditions.
Discussion
Relinquishing control to automation
In this study we subjected drivers to multiple control transitions between manual and automated
control in a highway scenario. Upon reviewing the literature, no mention of how long the driver
takes to engage an automated driving system was found, making this study a first-of-a-kind. We
found that drivers take between 2.82-23.8 seconds (Median = 4.2-4.4) to engage automated driving
when the system indicates that the feature is available. No significant differences between the two
conditions was found, but as Figure 6 shows, there was large range in the time it takes to relinquish
control. It is clear from Figure 7 that designing for the median, or average driver effectively exclude a
large part of the user group, which could have severe implications for drivers who fall outside of the
mean or median. It has been common practice in Human Factors and Anthropometrics to design for
90% of the population, normally through accommodating the range between the 5 th percentile
female and the 95th percentile male (Porter et al., 2004). Thus, it is important that vehicle
manufacturers are made aware of the intra-individual differences, as such differences have a large
effect on the larger traffic system if drivers are expected to toggle Automated Driving systems within
a certain time frame. An example of potential situations where the driver would need to toggle the
automated driving system could be in HAD-dedicated areas. Moreover, it may be that the time it
takes to engage the automated driving system depends on external factors such as, perceived safety,
weather conditions, traffic flow rates, presence of vulnerable road users, roadworks, and so on. If
the driver deems a situation unsafe, or has doubts as to how well the automation would perform in
a situation, the driver may hold off on completing a transition until the driver feels that the system
can comfortably handle the situation.
324325
326
327
328
329
330
331
332
333
334
335
336
337
338
339
340
341
342
343
344
345
346
347
348

Resuming control from automation
Previous research was reviewed and it was found that most studies utilised system paced
transitions, where the automated driving system warns in advance of failure or reduced automation
support with relatively short lead times, from 3 seconds [studies 2, 13, 14, 18, 22] to 7 seconds
[studies 1, 6, 9, 17, 19, 25]. It has previously been shown that whilst it takes approximately 2.47±1.42
seconds on average, it can take up to 15 seconds to respond to such an event (Merat et al., 2014).
We argue that this use case, albeit important, does not reflect the primary use case for control
transitions in highly automated driving. When comparing the range of TOrt in the literature to the
user paced (no secondary task) condition in this study, a great deal of overlap can be seen. The
observed values in the current study are closer to the higher values observed by Merat et al. (2014)
whilst the median range of 4.56-6.06s is closer to the range of times suggested by Gold et al. (2013)
and Damböck et al. (2012). It is evident that there is a large spread in the TOrt, which when
designing driving automation should be considered, as the range of performance is more important
than the median or mean, as these exclude a large portion of drivers.
When subjecting drivers to TOR’s without time restrictions we found that drivers take between 1.97-
25.75 seconds (Median = 4.56) to resume control from automated driving in normal conditions, and
between 3.17-20.99 seconds (Median = 6.06) to do so whilst engaged in a secondary task preceding
the control transition. This shows that there is a median 2 second difference in control transition
times in the reviewed manuscripts compared to the user paced control transitions. There was a large
effect of secondary task engagement on TOrt, showing an increase in driver control resumption
times when engaged in a secondary task. This might be explained in part by the nature of the
secondary task, as the driver had to allocate time to put down the magazine they were asked to read
whilst the automated driving feature was activated. It could also be partly attributed to driver task
adaptation, by holding off transferring control until they have had time to switch between the
349
350
351
352
353
354
355
356
357
358
359
360
361
362
363
364
365
366
367
368
369
370
371
372
373
reading task and driving task. This is supported by research indicating that drivers tend to adapt to
external factors such as traffic complexity to allow for more time to make decisions (Eriksson et al.,
2014), by for example slowing down when engaged in secondary tasks (Cooper et al., 2009) or the
expectation of resuming control (Young & Stanton, 2007). In light of these results, there is a case for
“adaptive automation” that modulates TORlt by, for example, detecting whether the driver gaze is
off road for a certain time-period, providing the driver with a few additional seconds before
resuming control.
Furthermore, the 1.5 second increase of control resumption time when engaged in a reading task is
similar to the reaction time increase caused by the introduction of automated driving features
observed by Young and Stanton (2007) compared to reaction time in manual driving (Summala,
2000). Therefore, a further increase of reaction times when drivers are engaged in other tasks will
have to be expected, but measures must be taken to reduce the increase in reaction time, for
example through the addition of informative displays, to reduce the risk of accidents (Cranor, 2008;
Eriksson & Stanton, 2016).
There was a significant increase in perceived temporal demand when drivers were tasked with
reading whilst the automation was engaged. This increase in perceived temporal demand may have
been caused by the TOR, and the driver not being fully sure as to how long the vehicle could manage
before a forced transition would occur (this was not a possibility in the current experiment). This
increase in perceived temporal demand could also be attributed to the pace of the experiment, and
that the drivers were required to pick up, and put down the magazine whenever a control transition
was issued. Overall there are little differences in workload, and the median workload in both
conditions was approximately at the halfway point on the scale, implying optimal loading (Stanton et
al., 2011).
In light of these results, combined with the non-significant, small effect of task condition on driving
performance indicated that the drivers were able to self-regulate the control transition process by
374
375
376
377
378
379
380
381
382
383
384
385
386
387
388
389
390
391
392
393
394
395
396
397
398
adapting the time needed to resume control (Eriksson et al., 2014; Kircher et al., 2014) and therefore
maintaining optimal levels of workload, minimizing the severity of the after-effects observed in
studies by e.g. Gold et al. (2013).
Conclusions
Relinquishing control to automation
The literature on control transitions in highly automated driving is absent in research reports on
transitions from manual to automated vehicle control. In a first-of-a-kind study, we found that it
takes drivers between 2.8 and 23.8 seconds to switch from manual to automated control. This
finding has some implications for the safety of drivers merging into automated driving dedicated
lanes, or other infrastructure whilst in manual mode. Such an event may require certain adaptations
for traffic already occupying such a lane. Adaptations may include increasing time-headway or
reducing speed to accommodate the natural variance in human behaviour to avoid collisions, or
discomfort for road users in such a lane. Moreover, it may be that part of the variance could be
reduced by designing merging zones on straight, uncomplicated road sections as drivers may
otherwise hold off transferring control to the automated driving system until the driver feels it safe
to hand control to the automated driving system.
Resuming control from automation
A review of the literature found that most papers tend to report the mean Take Over reaction time
and often fail to report standard deviation and range (c.f. Figure 2), thus the variance in control
transition times remain unknown (median, and interquartile range for each participant in this study
can be found in the supplementary material). Additionally, the reviewed papers tended to give
drivers a lead time of between 0 and 30 seconds between the presentation of a TOR and a critical
event with the main part of the reviewed papers using a 3 or 7 second lead time. In this study we
399
400
401
402
403
404
405
406
407
408
409
410
411
412
413
414
415
416
417
418
419
420
421
422

found that the range of time in which drivers resume control from the automated driving system
was between 1.9 and 25.7 seconds depending on task engagement. The spread of TOrt in the two
conditions in this study indicates that mean, or median values do not tell the entire story when it
comes to control transitions. Notably, the distribution of TOrt approaches platykurtic (c.f. Figure 9)
when drivers are engaged in a secondary task. This implies that vehicle manufacturers must adapt to
the circumstances, providing more time to drivers who are engaged in secondary tasks, whilst in
highly automated driving mode to avoid excluding drivers at the tail of the distribution. In light of
this, designers of automated vehicles should not focus on the mean, or median, driver when it
comes to control transition times. Rather they should strive to include the larger range of control
transitions times so they do not exclude users that fall outside the mean or median. Moreover,
policy-makers should strive to accommodate these inter- and intra-individual differences in their
guidelines for “sufficiently comfortable transition times”. When drivers were allowed to self-regulate
the control transition process, little differences could be found in both driving performance and
workload between the two conditions. This lends further support to the argument for designing for
the range of transition-times rather than the mean or median in non-critical situations.
Lastly, based on the large decrease in TOrt kurtosis when drivers were engaged in a secondary task,
it may also be the case that future automated vehicles need to adapt the TORlt to account for
drivers engaged in other, non-driving, tasks and even adapt TORlt to accommodate external factors
such as traffic density and weather.
Key Points
Large differences between control transitions times reported in the literature and the no-
secondary task condition were found.
Drivers take longer to resume control from automation when engaged in a secondary task prior
to the control transition.
423
424
425
426
427
428
429
430
431
432
433
434
435
436
437
438
439
440
441
442
443
444
445
446
An inclusive design approach is needed to accommodate the observed variance as the mean or
median response times are not sufficient when it comes to designing control transitions in
automated driving.
447
448
449
References
450
451
452
453