Embed Size (px)
Citation preview
Apparent Competition Drives Community-Wide Parasitism Rates and
Changes in Host Abundance Across Ecosystem Boundaries
Carol M. Frost1,2*, Guadalupe Peralta1,3, Tatyana A. Rand4, Raphael K. Didham5,6, Arvind
Varsani1,7,8,9, and Jason M. Tylianakis1,10 *
Affiliations:
1 Centre for Integrative Ecology, School of Biological Sciences, University of
Canterbury, Private Bag 4800, Christchurch 8140, New Zealand.
2 Current address: Department of Forest Ecology and Management, Swedish University
of Agricultural Sciences, Skogsmarksgränd, 90183 Umeå, Sweden.
3 Current address: Instituto Argentino de Investigaciones de las Zonas Áridas, CONICET,
CC 507, 5500, Mendoza, Argentina.
4 USDA-ARS Northern Plains Agricultural Research Laboratory, Sidney, MT 59270,
USA.
5 School of Animal Biology, The University of Western Australia, 35 Stirling Highway,
Crawley WA 6009, Australia.
6 CSIRO Land & Water, Centre for Environment and Life Sciences, Underwood Ave,
Floreat WA 6014, Australia.
7 Biomolecular Interaction Centre, University of Canterbury, Private Bag 4800,
Christchurch, 8140, New Zealand.
8 Structural Biology Research Unit, Department of Clinical Laboratory Sciences,
University of Cape Town, Observatory, 7700, South Africa
9 Department of Plant Pathology and Emerging Pathogens Institute, University of Florida,
Gainesville, FL 32611, USA
10 Department of Life Sciences, Imperial College London, Silwood Park Campus,
Buckhurst Road, Ascot, Berkshire SL5 7PY, United Kingdom.
*Correspondence to: Carol Frost, [email protected] and Jason Tylianakis,
Abstract
Species have strong indirect effects on others, and predicting these effects is a central
challenge in ecology. Prey species sharing an enemy (predator or parasitoid) can be
linked by apparent competition, but it is unknown whether this process is strong enough
to be a community-wide structuring mechanism that could be used to predict future states
of diverse food webs. Whether species abundances are spatially coupled by enemy
movement across different habitats is also untested. Here, using a field experiment, we
show that predicted apparent competitive effects between species, mediated via shared
parasitoids, can significantly explain future parasitism rates and herbivore abundances.
These predictions are successful even across edges between natural and managed forests,
following experimental reduction of herbivore densities by aerial spraying over 20ha.
This result shows that trophic indirect effects propagate across networks and habitats in
important, predictable ways, with implications for landscape planning, invasion biology
and biological control.
Introduction
Communities frequently experience population reductions (e.g., via harvesting or native
species decline) or species additions (during invasions, biological control or species range
shifts). These changes can directly impact consumers or prey of the affected species1.
However, population changes may also indirectly affect the entire community via longer
pathways across the interaction network2,3. Unfortunately, these many subtle indirect
interactions4,5 limit our ability to predict the community-wide consequences of changes in
abundance of a focal species, because they can significantly alter population growth and
persistence6,7, and even affect species abundances and distributions as strongly as direct
feeding interactions8. In particular, the dynamics of different prey species can be linked
via shared enemies (predators or parasitoids), even if the prey never compete directly for
resources9. That is, an increase in the population of one prey species can cause a decrease
in the population of other prey species by driving increases in shared enemy abundance
and attack rates or changes to enemy behavior6. This phenomenon, termed ‘apparent
competition’9, can be common in food webs10, where it may be the most important
indirect interaction affecting pairwise species dynamics11.
There are several mechanisms by which enemy responses to prey population
growth can cause apparent competition. The timescale over which these mechanisms
occur can vary from within one prey generation, through aggregative12 or functional
responses13, to between prey generations, through numerical responses6, though
distinguishing between them for an entire community under field conditions is unfeasible,
and we do not attempt to do this here. Apparent mutualism is equally possible, if the
shared enemy can be satiated or switch to the most abundant prey species in the short
term9, thereby releasing less-abundant prey from consumer pressure. Apparent mutualism
could occur over the longer term if the population of one prey species cycles, such that it
repeatedly satiates an enemy, and thus repeatedly alleviates consumer pressure on another
prey species that shares the enemy14. However, fewer empirical examples of apparent
mutualism have been documented13,15,16. Despite numerous isolated examples of apparent
competition between species pairs7,13,17, it remains untested whether the simultaneous
pairwise effects of apparent competition across all species within a food web are strong
enough to detectably affect population dynamics of all species, even amidst the network
of direct interactions among them. The ability to predict the effects of changing
population densities on interactions among all other species would be invaluable in
addressing some of the most pressing questions in ecology and global environmental
change, such as how ecosystems will respond to native species decline or species
invasions.
Community-wide predictions of indirect interactions are further hindered by
species movement among habitats. Global land-use change creates mosaic landscapes of
managed and remnant natural habitats, and consumer movement among habitats is
predicted to drive resident prey species dynamics through direct and indirect effects18-20.
Yet, it remains untested whether mobile enemies dynamically couple herbivore
assemblages in multiple habitats via apparent competition, as predicted by theory18.
Entire suites of enemies can ‘spill over’ across habitat boundaries21, and if they couple
prey dynamics in the two habitats, this process could be an important mechanism by
which anthropogenic habitats impact entire food webs in natural and managed areas
throughout the landscape20.
Here we test: 1) whether apparent competition influences community-wide
parasitism rates and changes in herbivore abundance in host-parasitoid interaction
networks (food webs) at the interface between native and plantation forests. In so doing,
we also test: 2) whether the future parasitism rate and abundance of each herbivore host
species in the community can be predicted from quantitative food-web data on parasitoid
overlap between hosts, as well as information about changes in abundance of all other
hosts. We further test: 3) whether such predictions are possible across a habitat edge, or
whether the edge hinders parasitoid movement or changes parasitoid host selection such
that predicted apparent competitive linkages between herbivore populations on either side
of the edge are not realized. We conducted a simultaneous study of adult parasitoid
movement between the two forest habitats considered here21. That study showed that
parasitoids of many of the same species considered here moved between habitats
throughout the season. However, more individuals moved from plantation to native forest
than in the other direction, likely due to the higher productivity of plantation relative to
native forest21. Thus, it could be that apparent competitive effects are asymmetrical
between habitats, with stronger effects from herbivores in plantation forest on herbivores
in native forest.
Our approach (see overview in Fig. 1) was to first determine a regional measure
of shared parasitism (i.e. the potential for apparent competition) between each pair of
herbivore species (foliage-dwelling Lepidoptera larvae) in the system, by collecting
quantitative food web data (i.e. numbers and identities of parasitoids attacking each host
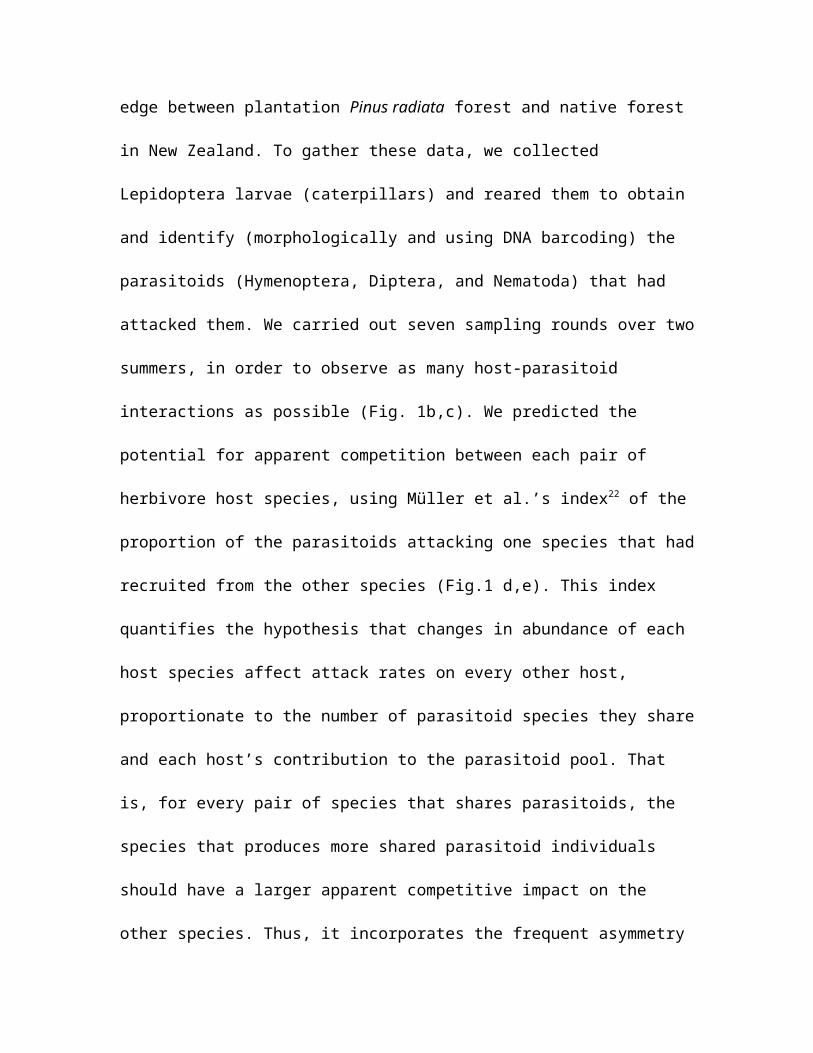
species) from a set of replicated training sites (Fig. 1a). Each site comprised samples
from either side of a habitat edge between plantation Pinus radiata forest and native
forest in New Zealand. To gather these data, we collected Lepidoptera larvae
(caterpillars) and reared them to obtain and identify (morphologically and using DNA
barcoding) the parasitoids (Hymenoptera, Diptera, and Nematoda) that had attacked
them. We carried out seven sampling rounds over two summers, in order to observe as
many host-parasitoid interactions as possible (Fig. 1b,c). We predicted the potential for
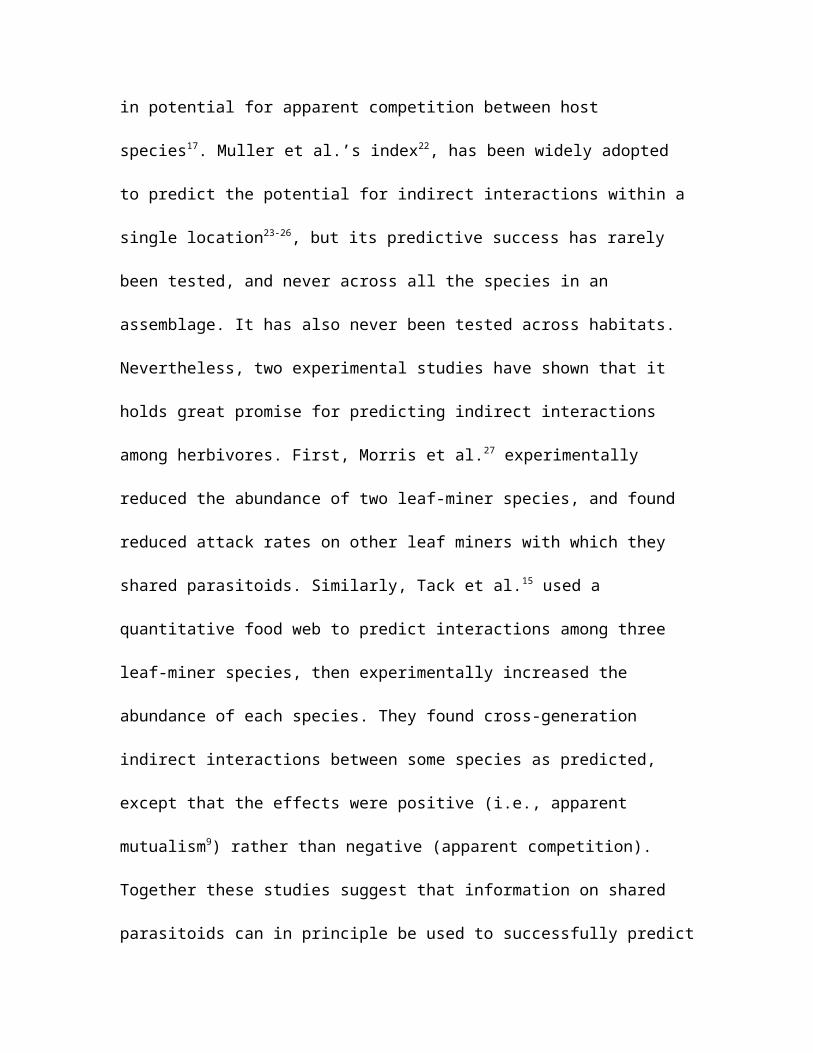
apparent competition between each pair of herbivore host species, using Müller et al.’s
index22 of the proportion of the parasitoids attacking one species that had recruited from
the other species (Fig.1 d,e). This index quantifies the hypothesis that changes in
abundance of each host species affect attack rates on every other host, proportionate to
the number of parasitoid species they share and each host’s contribution to the parasitoid
pool. That is, for every pair of species that shares parasitoids, the species that produces
more shared parasitoid individuals should have a larger apparent competitive impact on
the other species. Thus, it incorporates the frequent asymmetry in potential for apparent
competition between host species17. Muller et al.’s index22, has been widely adopted to
predict the potential for indirect interactions within a single location23-26, but its predictive
success has rarely been tested, and never across all the species in an assemblage. It has
also never been tested across habitats. Nevertheless, two experimental studies have
shown that it holds great promise for predicting indirect interactions among herbivores.
First, Morris et al.27 experimentally reduced the abundance of two leaf-miner species, and
found reduced attack rates on other leaf miners with which they shared parasitoids.
Similarly, Tack et al.15 used a quantitative food web to predict interactions among three
leaf-miner species, then experimentally increased the abundance of each species. They
found cross-generation indirect interactions between some species as predicted, except
that the effects were positive (i.e., apparent mutualism9) rather than negative (apparent
competition). Together these studies suggest that information on shared parasitoids can in
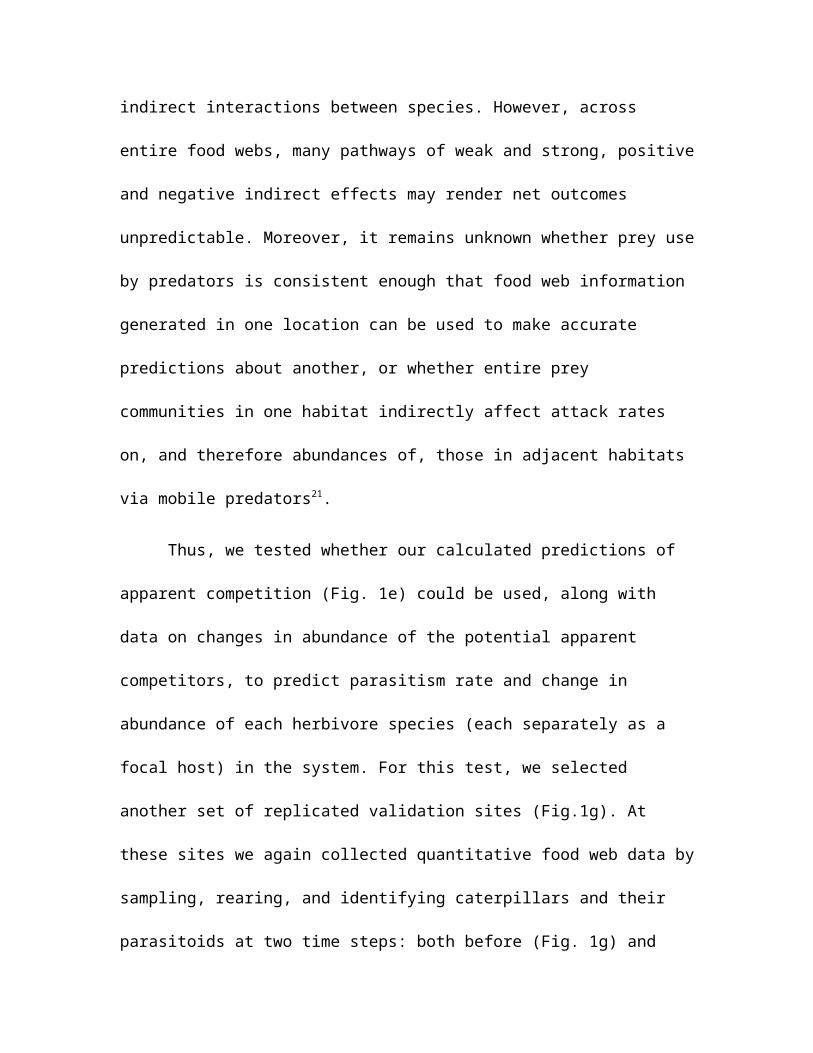
principle be used to successfully predict indirect interactions between species. However,
across entire food webs, many pathways of weak and strong, positive and negative
indirect effects may render net outcomes unpredictable. Moreover, it remains unknown
whether prey use by predators is consistent enough that food web information generated
in one location can be used to make accurate predictions about another, or whether entire
prey communities in one habitat indirectly affect attack rates on, and therefore
abundances of, those in adjacent habitats via mobile predators21.
Thus, we tested whether our calculated predictions of apparent competition (Fig.
1e) could be used, along with data on changes in abundance of the potential apparent
competitors, to predict parasitism rate and change in abundance of each herbivore species
(each separately as a focal host) in the system. For this test, we selected another set of
replicated validation sites (Fig.1g). At these sites we again collected quantitative food
web data by sampling, rearing, and identifying caterpillars and their parasitoids at two
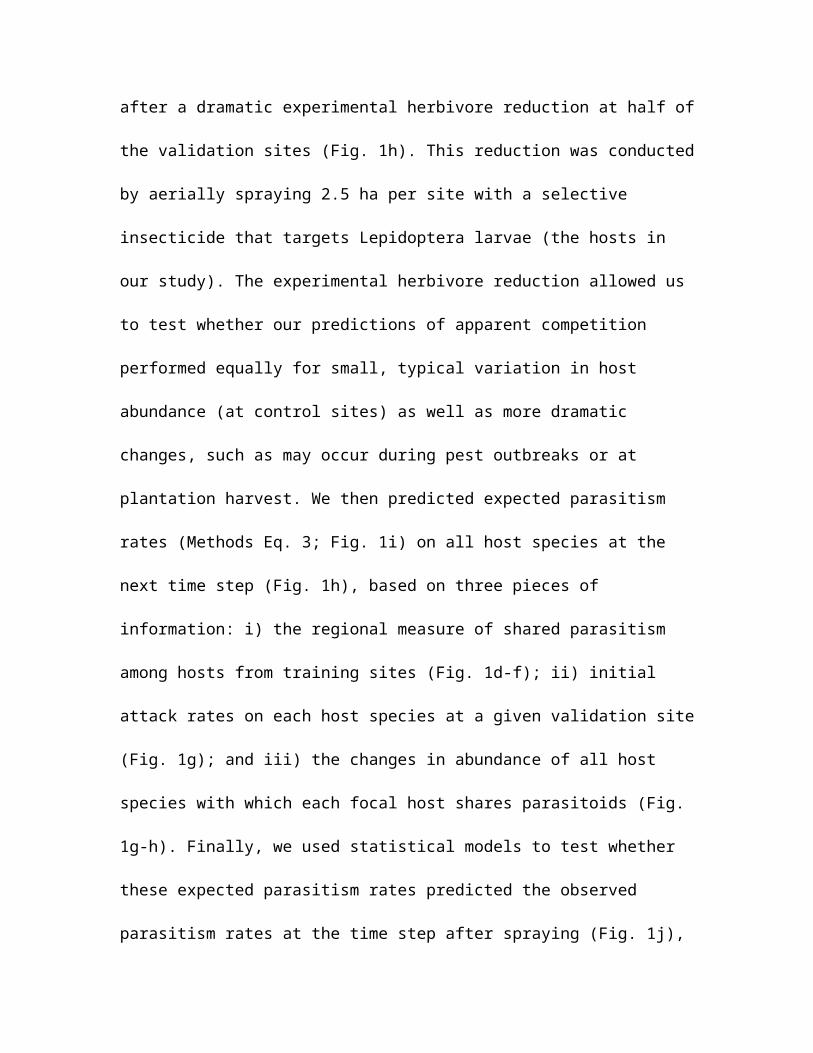
time steps: both before (Fig. 1g) and after a dramatic experimental herbivore reduction at
half of the validation sites (Fig. 1h). This reduction was conducted by aerially spraying
2.5 ha per site with a selective insecticide that targets Lepidoptera larvae (the hosts in our
study). The experimental herbivore reduction allowed us to test whether our predictions
of apparent competition performed equally for small, typical variation in host abundance
(at control sites) as well as more dramatic changes, such as may occur during pest
outbreaks or at plantation harvest. We then predicted expected parasitism rates (Methods
Eq. 3; Fig. 1i) on all host species at the next time step (Fig. 1h), based on three pieces of
information: i) the regional measure of shared parasitism among hosts from training sites
(Fig. 1d-f); ii) initial attack rates on each host species at a given validation site (Fig. 1g);
and iii) the changes in abundance of all host species with which each focal host shares
parasitoids (Fig. 1g-h). Finally, we used statistical models to test whether these expected
parasitism rates predicted the observed parasitism rates at the time step after spraying
(Fig. 1j), as well as changes in abundance between time steps (Fig. 1k). This test was
conducted for each host species that occurred in the validation sites at the later time step
(Fig. 1l).
We show that expected parasitism rate (our prediction of the final parasitism rate
for each herbivore host species, based on the assumption of apparent competition with
each other herbivore host species which occurred in the same site) significantly predicted
both observed parasitism rate at the ‘after’ time step, and the change in abundance of a
focal host between time steps. Expected parasitism rate predicted 31% of the variation in
change in host abundance, and 15% of the variation in observed parasitism rate.
Predictions worked equally well whether the focal host was in plantation or native forest,
suggesting that in this system the habitat edge does not significantly hinder parasitoid
movement or change host-selection behavior, and suggesting that herbivore population
changes in one forest type can have rapid and important effects on herbivore populations
across the habitat edge.
Results
Data description
Transect plus extra sampling at our training sites yielded 8321 caterpillars. Of
these, 2725 individuals from 70 species in 13 families were successfully reared to moth
or parasitoid emergence. These yielded 358 parasitism events by 46 species of
Hymenoptera, Diptera, and Nematoda parasitoids on 44 Lepidoptera species. These 358
parasitism events made up the data from which the training metaweb was constructed
(Figs. 1a-c, 2) and diAjB was calculated (Methods Eq. 3, Fig. 1d-f). The metaweb had a
binary connectance of 0.057, which is within the range of connectance values exhibited
in published quantitative food webs28.
Transect sampling at our validation sites yielded 5837 caterpillars that were
identifiable to (morpho)species level, and included 67 species. These made up the data
from which we calculated all abundance terms (njB, niA) in Eq. 3 and Eq. 6 (Fig. 1g-k). Of
these caterpillars, 2067 individuals from 60 species were successfully reared to moth or
parasitoid emergence, yielding 263 parasitism events by 36 species of parasitoid, in
Hymenoptera, Diptera, and Nematoda on 25 species of Lepidoptera. Extra sampling
yielded an additional 1121 identifiable caterpillars, of which 405 individuals from 65
species were successfully reared to moth or parasitoid emergence, yielding 40 additional
parasitism events. The transect plus extra sampling total of 303 parasitism events by 37
species of parasitoids on 26 species of Lepidoptera made up the data from which αiAl(t)
was calculated in Eqs. 3 and 5, from which αiAl(t+1) and niA(t+1) were calculated in Eq. 4, and
from which niAt was calculated in Eq. 5 (Fig. 1g-k).
Regional potential for apparent competition among species
From our regional quantitative food web data from training sites, pooled over all
sampling dates and sites (Fig. 2), we found that most parasitoid species were reared from
hosts in both plantation and native forest (yellow interactions in Fig. 2), and few
parasitoid species were specific to one forest type (green and purple interactions in Fig.
2). From these regional species interaction data, our calculations of potential for apparent
competition between all host species pairs (Methods Eq.1,2, Figs. 1d, 3) showed potential
for apparent competition between 41 host species (circles connected by lines in Fig. 3).
These calculations also showed potential for many cross-habitat apparent competitive
interactions (gray lines in Fig. 3).
Effects of experimental herbivore reduction
Our experimental herbivore reduction at validation sites was successful in
significantly reducing caterpillar numbers in treated plantation forests relative to control
plantation forests (Fig. 4a, Supplementary Table 1). However, caterpillar numbers were
also naturally lower in control plantation forests after the herbivore reduction treatment
than before. The lower caterpillar numbers at control sites in the after time step was likely
because of predation by invasive Vespula spp. wasps, which become very abundant in
New Zealand plantation and native forests in the months during which the ‘after’
collection occurred21, and which predate heavily on caterpillars29. Following the
experimental reduction in herbivore abundance in the treated plantation forests, which
occurred when many parasitoids were in their adult phase (Supplementary Fig. 1), it is
possible that attack rates could have been briefly higher in native forest next to treated
plantations, due to low host availability in plantations. However, we found no significant
interaction effect (Fig. 4b, Supplementary Table 2), indicating that, overall, hosts in
native forests were not attacked disproportionately more or less when their adjacent
plantation was sprayed. This result is not surprising. We would not expect apparent
competition effects to be strongly detectable in such an analysis, because it includes
‘noise’ in the attack rates such as unchanged parasitism rates for species in the native
forest that do not share parasitoids across the habitat edge, or that share parasitoids with
species whose abundances did not change drastically in response to the spray. Thus, to
truly test the importance of host reduction, we needed to weight this test by host species
changes in abundance combined with expectations of which host species might be
expected to exert apparent competition on one another due to sharing of parasitoids.
Apparent competition predicts community-wide parasitism
Our higher resolution test, in which we calculated the expected parasitism rates in
the after time step for each host species (Methods Eq. 3), showed that apparent
competition significantly structured host-parasitoid assemblages within and across
habitats in a predictable way. Our expected parasitism rate explained 15.6% of the
variation in observed parasitism rates across host species (z = 2.7, p = 0.007), and the
whole model (fixed plus random effects) explained 24.3% (Fig. 5a; Supplementary Table
3). This predictive ability was equally good for small natural or larger experimental
changes in host abundance (the interaction between expected parasitism rate and
herbivore reduction treatment was removed during model selection; i.e. expected
parasitism rate predicted observed parasitism rate equally well whether or not host
abundance was drastically changed experimentally). Significant predictive ability
remained even when within-habitat intraspecific effects were excluded from the
calculation of expected parasitism rates (Supplementary Table 4). Therefore the indirect
effects at work could not simply be explained by within-habitat delayed density
dependence. Importantly, this predictive capacity did not depend on the specific habitat
of the focal host (the host habitat by expected parasitism rate interaction was removed
during model selection; Fig. 5a, Supplementary Table 3). Rather, predicted apparent
competitive effects were realized equally for hosts in either habitat, such that the habitat
edge did not filter parasitoids and prevent some of the predicted interactions from
occurring. Furthermore, this same predictive ability could not be achieved by using just
initial parasitism rate for each focal host, calculated from quantitative food web data from
the initial time step at each site (z = 1.11, p = 0.266; Fig. 5 b; Supplementary Table 5.
Supplementary fig. 2a,b provides equivalent figures to 5 a,b with raw data.). Rather,
significant prediction required inclusion of the potential for apparent competition
between each host species (the diAjB in Methods Eq. 3) and the changes in abundance of
hosts with which the focal host shared parasitoids.
The number of species for which it was possible to calculate an expected
parasitism rate at each site was far lower than the number of species collected at each
site. In Fig. 5, each point represents a species within a site that was both collected and
successfully reared at both time steps, and was parasitized in the first time step (see Eq. 3,
Fig. 1i). However, the expected parasitism rates for these species within sites are based
on the potential for apparent competition with every other host species that we collected
in the site, whether or not it was parasitized or reared successfully, so the few data points
are predicted by data from the entire network, and allowed us to test community-wide
apparent competitive effects on future parasitism rates.
Within- and cross-habitat predictions were successful
In calculating the expected parasitism rate for each focal host, some of the
predicted attacks were from parasitoids shared with hosts in the same habitat, and some
were predicted to come from parasitoids shared with hosts in the adjacent habitat. We
tested whether the cross-habitat component to the prediction was necessary to achieve
predictive success, and also whether it was sufficient for predictive success. When we
separated out the within-habitat versus cross-habitat contributions to expected parasitism
rate for each host, and entered these as separate predictors in a model with observed
parasitism rate as the response variable, we found that the best model predicting observed
parasitism contained only within-habitat expected parasitism rate as a significant
predictor (z = 2.8, p = 0.005; Fig. 5 c, Supplementary Table 6), which explained 19.9% of
the variation in observed parasitism rate, while the whole model explained 27.4% of the
variation. That is, predictions based on food web data from only the host’s own habitat
(within-habitat expected parasitism rates) were sufficient to predict future parasitism
rates, without needing data from the adjacent habitat as well, even though parasitoids
shared with hosts in the adjacent habitat (Fig. 2) are known to move across the habitat
edge in this system21. However, cross-habitat expected parasitism rate also significantly
predicted observed parasitism rate when it was the only predictor in the model (z = 2.1, p
= 0.040; Fig. 5 d, Supplementary Table 7), wherein it explained 13.6% of the variation in
observed parasitism rate. Cross-habitat expected parasitism rate was not retained in the
best model as a predictor of observed parasitism rate because it explained the same
component of variation in observed parasitism rate as within-habitat expected parasitism
rate (Supplementary Table 6). Importantly, this collinearity between cross-habitat and
within-habitat expected parasitism rate suggests that either within- or cross-habitat
expected parasitism rate could be used with almost equivalent predictive success, and that
measuring both may be unnecessary. In all analyses, the correlations between expected
and observed parasitism rates were positive, suggesting that overall, the indirect effects
occurring were apparent competition rather than apparent mutualism (which is a
predator-mediated positive relationship between abundances of host species pairs15).
Predictions based on binary vs. quantitative food web data
These accurate predictions required quantitative food web data in order to predict
the occurrence and level of parasitism, though even with binary information on the
presence/absence of species links, some qualitative predictions could still likely be made.
Expected parasitism based on a binary regional food web was a marginally non-
significant predictor of observed parasitism (z=1.9, p = 0.056, with a partial regression
coefficient of 1.9 (SE = 0.99) for binary data (Supplementary Table 8a), compared with
2.3 (SE = 0.84) for quantitative data (Supplementary Table 3). When only cases of
observed (non-zero) parasitism were included, binary information slightly improved
predictions over those made from quantitative data (Supplementary Table 8 b,c compared
to Supplementary Tables 6, 7), but since real-world applications would likely require
predictions of occurrence of parasitism as well as of the level of parasitism when
parasitism occurred, our results suggest that quantitative data will yield more accurate
predictions. The moderate ‘success’ of the binary predictions suggests that apparent
competitive effects were not driven only by the abundance of species, but rather by
highly connected species that shared parasitoids with many others. Fortunately, these key
species can be easily identified in even binary food webs.
Apparent competition predicts changes in host abundance
Apparent competition entails a change in the abundance of two prey species in
response to altered attack rates by a shared enemy9. Above, we focus on attack rates
rather than any resulting changes in host abundance, because attack rates measure the
parasitoid-mediated top-down effects on host dynamics, without any confounding effects
driven by resource competition among hosts, attack by generalist predators, or other
environmental drivers. Changes in attack rates (when coupled with changes in growth
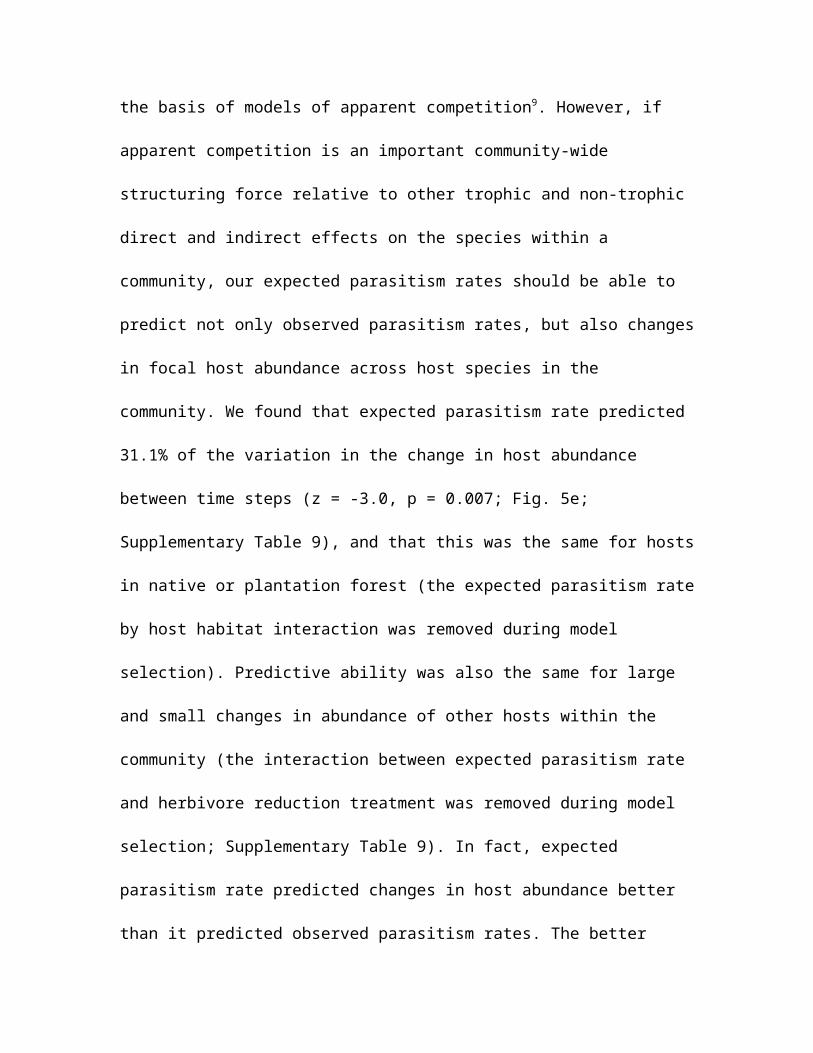
rates) also form the basis of models of apparent competition9. However, if apparent
competition is an important community-wide structuring force relative to other trophic
and non-trophic direct and indirect effects on the species within a community, our
expected parasitism rates should be able to predict not only observed parasitism rates, but
also changes in focal host abundance across host species in the community. We found
that expected parasitism rate predicted 31.1% of the variation in the change in host
abundance between time steps (z = -3.0, p = 0.007; Fig. 5e; Supplementary Table 9), and
that this was the same for hosts in native or plantation forest (the expected parasitism rate
by host habitat interaction was removed during model selection). Predictive ability was
also the same for large and small changes in abundance of other hosts within the
community (the interaction between expected parasitism rate and herbivore reduction
treatment was removed during model selection; Supplementary Table 9). In fact,
expected parasitism rate predicted changes in host abundance better than it predicted
observed parasitism rates. The better prediction of changes in host abundance than of
parasitism rates could have been because the time interval over which sampling was
conducted meant that we detected the effects of parasitism on abundances for more
species than we detected the precise window of parasitism. Again, simply knowing host
species’ initial parasitism rates was not sufficient to predict their changes in abundance
(Fig. 5f, Supplementary Table 10), but rather the predictions based on apparent
competition were necessary.
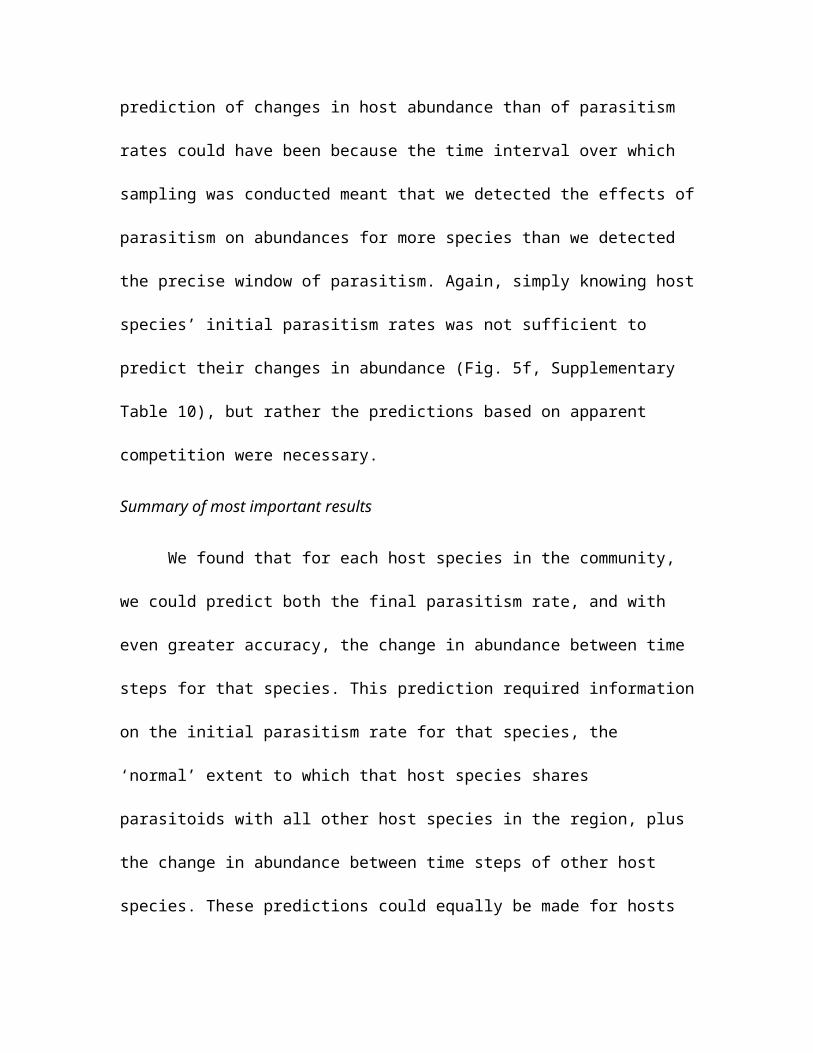
Summary of most important results
We found that for each host species in the community, we could predict both the
final parasitism rate, and with even greater accuracy, the change in abundance between
time steps for that species. This prediction required information on the initial parasitism
rate for that species, the ‘normal’ extent to which that host species shares parasitoids with
all other host species in the region, plus the change in abundance between time steps of
other host species. These predictions could equally be made for hosts in either native
forest or adjacent exotic plantation forest, and for large or small changes in abundances
of other host species in the system. These predictions even held when they were made for
hosts in one habitat, but based only on data from the other habitat, regardless of whether
the host’s habitat was native or plantation forest.
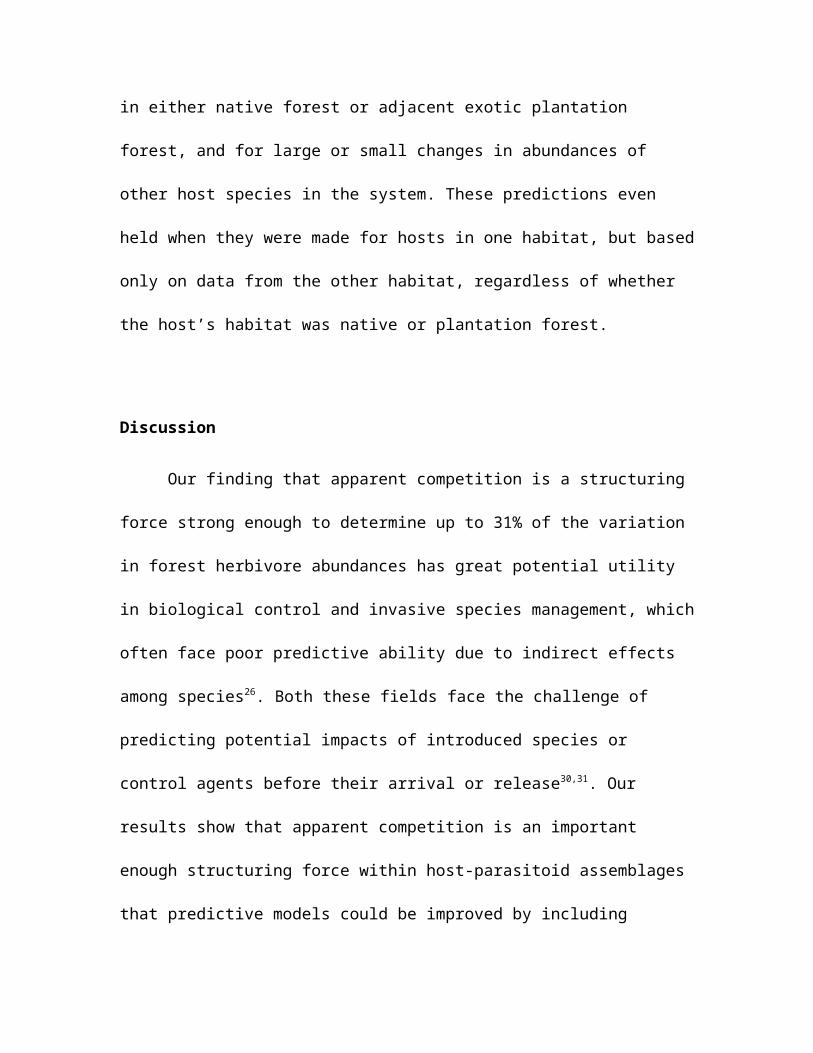
Discussion
Our finding that apparent competition is a structuring force strong enough to
determine up to 31% of the variation in forest herbivore abundances has great potential
utility in biological control and invasive species management, which often face poor
predictive ability due to indirect effects among species26. Both these fields face the
challenge of predicting potential impacts of introduced species or control agents before
their arrival or release30,31. Our results show that apparent competition is an important
enough structuring force within host-parasitoid assemblages that predictive models could
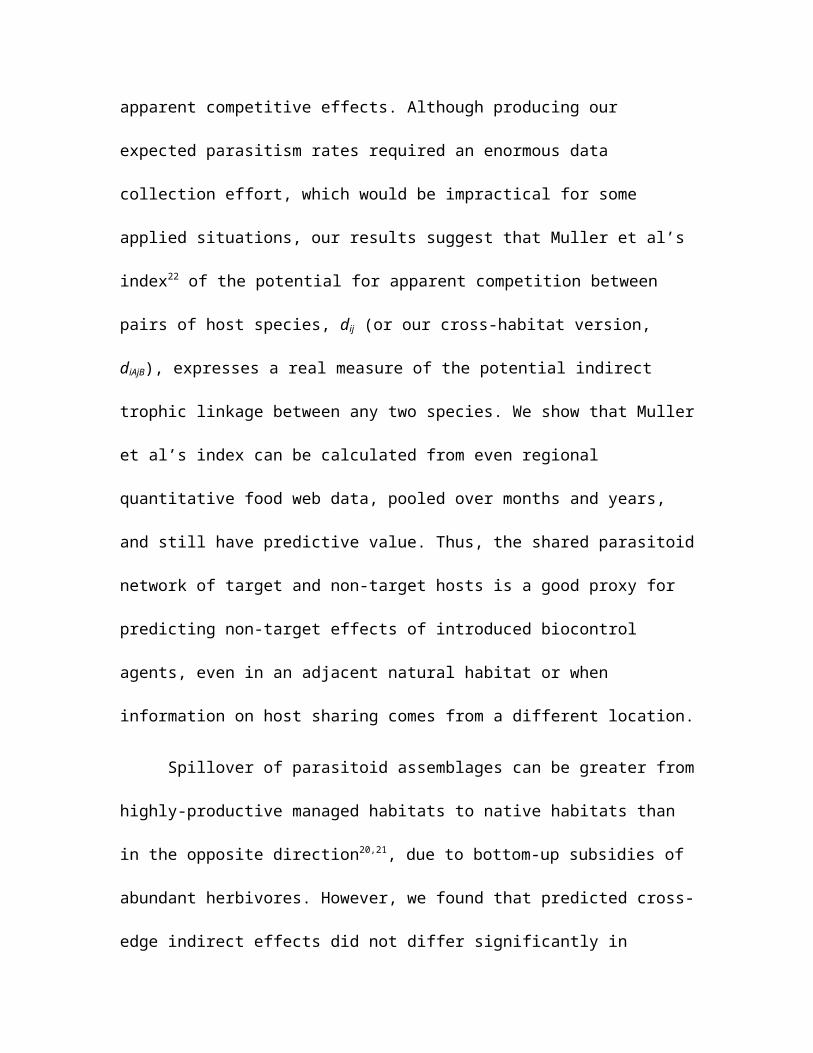
be improved by including apparent competitive effects. Although producing our expected
parasitism rates required an enormous data collection effort, which would be impractical
for some applied situations, our results suggest that Muller et al’s index22 of the potential
for apparent competition between pairs of host species, dij (or our cross-habitat version,
diAjB), expresses a real measure of the potential indirect trophic linkage between any two
species. We show that Muller et al’s index can be calculated from even regional
quantitative food web data, pooled over months and years, and still have predictive value.
Thus, the shared parasitoid network of target and non-target hosts is a good proxy for
predicting non-target effects of introduced biocontrol agents, even in an adjacent natural
habitat or when information on host sharing comes from a different location.
Spillover of parasitoid assemblages can be greater from highly-productive
managed habitats to native habitats than in the opposite direction20,21, due to bottom-up
subsidies of abundant herbivores. However, we found that predicted cross-edge indirect
effects did not differ significantly in magnitude (Fig. 6, Supplementary Table 11), though
there was a non-significant trend toward hosts in plantation forest having stronger
apparent competitive effects on hosts in native forest than vice versa, as might be
expected based on the higher relative abundance of herbivores in plantations21. The
strength of apparent competition between habitats depended on herbivore abundance and
attack rate, so higher intensity production systems with higher herbivore densities (e.g. of
pests) will tend to have the strongest apparent competitive effects on neighboring
habitats. Such effects would be exacerbated by land-sparing scenarios, in which
production systems are intensively managed for maximum productivity, but are
potentially adjacent to natural areas32. These impacts would be particularly likely when
the edge between habitats has a low structural contrast (such as between our two forest
types) that does not impede consumer movement33, and when species overlap among
habitats is high, as was the case in this system (Fig. 2). This stronger cross-habitat
apparent competition between hosts when the habitats and their species are more similar
poses a risk to using buffer zones of similarly-structured habitats, such as plantations,
around conservation areas34, because indirect effects on native communities are likely to
be greatest when more natural enemy species are shared with productive systems (i.e.
when the habitats have high species overlap). Host and parasitoid21 species composition
were indistinguishable (Supplementary Fig. 3a, b), and food-web structure was very
similar (Supplementary Table 12) between our plantation and native forest edges.
Although apparent competitive effects between habitats will be higher when the two
habitats have high species similarity, predictions should work even when there are fewer
shared species across the edge, such as at an agroecosystem-forest edge, because the level
of regional parasitoid overlap is incorporated into the expected parasitism rate (see
Methods Eq. 3; Fig. 1f). Nevertheless, the cross-habitat apparent competitive effects that
we found are likely an edge effect rather than a coupling of interior habitat populations.
Cross-habitat apparent competition is mediated by mobile predators, and cross-habitat
predator subsidies are likely to decrease with distance from the habitat edge towards the
interior. That said, modern landscapes are often fine-scale mosaics of different land use
types, with a proliferation of habitat edges that give prominence at a landscape scale to
edge effects.
Our finding that the signal of apparent competition could be detected across an
entire community, and even across habitats, is significant for three main reasons. First,
apparent competition has previously been posited to structure host-parasitoid
assemblages11, and our results demonstrate empirically that sharing of parasitoids can
determine attack rates on hosts and changes in host abundances across an entire network.
Second, we show that network-wide predictions of attack rates and changes in host
abundances can be made accurately enough to succeed even though the time step across
which we made predictions would not have matched the biology of all species involved,
and we used a regional rather than site-specific assessment of shared parasitism. Most
importantly, our results demonstrate for the first time that entire food webs of natural
habitats in production landscapes are subjected to indirect effects from adjacent
production areas, such that food webs in multiple habitats function as a single metaweb
of direct and indirect linkages among species across the landscape.
Methods
Study sites and sampling overview
We selected two sets of forest edge sites between plantation Pinus radiata and native
southern beech (Nothofagaceae) forest: eight training sites, and 16 validation sites, in the
Nelson/Marlborough region of South Island, New Zealand (Supplementary Fig. 4). At the
training sites, we collected species interaction data to create a regional ‘metaweb’ (a
single web made up of all the webs from separate sites; see below; Fig. 1a-c). The
purpose of this metaweb was to maximize resolution of potential host-parasitoid linkages,
from which to derive predictions about the potential for indirect interactions based on
shared parasitoids (Fig. 1d-e). The training sites were at least 2.7 km apart, and at least 1
km from any of the 16 experimental validation sites, and interactions were sampled seven
times over two summer seasons (season 1: December 2009, January, February 2010;
season 2: October, November 2010, January, February 2011; Fig. 1a).
Toward the end of the training data collection, in early 2011, we experimentally
reduced herbivore abundance on the plantation side of the edge in half of our validation
sites (at eight herbivore reduction sites), and each of these was paired with a control site,
within eight spatial blocks (Fig. 1h). Spatial blocks were at least 2.7 km apart, and within
each block the pair of validation edge sites (one herbivore reduction site paired with one
control site) was at least 1 km apart, but not more than 2.7 km apart. Validation sites were
sampled twice before the herbivore reduction treatment (October, November 2010; Fig.
1g) and twice after the herbivore reduction treatment (January, February 2011; Fig. 1h),
in a BACI (before-after controlled intervention) design. The pine forests at our edges
were between 17 and 28 years of age, with trees mature enough that the canopies were
closed. We describe the understory vegetation composition of the two forest types
elsewhere21,35. Each forest (plantation or native) was large enough to have an interior
location at least 400 m from all edges.
Herbivore reduction at half of the validation sites
Herbivore abundances fluctuate through time, though occasionally there are large
changes in abundance following harvesting, pesticide application, or other events such as
disease spread or climatic extremes. To ensure that our results would be applicable to
both large and small changes in abundance, we generated large changes in herbivore
abundance on the plantation side of the edge at each herbivore reduction site, with the
expectation that this would reduce the in situ production of parasitoids and thereby affect
parasitism rates in the plantation, and possibly in the adjacent native forest. We applied
an herbivore reduction treatment to one of the validation sites in each spatial block,
leaving the other as a control. We timed our herbivore reduction experiment to be
roughly between parasitoid larval generations, such that most parasitoids present would
be in adult form, and thus not killed inside hosts during the herbivore reduction spray
(Supplementary Fig. 1).
On 30 December, 2010 and again on 9 January, 2011, we sprayed the plantation
forest at each herbivore reduction site with Delfin WG (Certis, USA L.L.C.), a
commercial formulation of Bacillus thuringiensis var. kurstaki - an organic, non-
persistent pesticide. This bacterial strain kills larval Lepidoptera (our hosts) upon
ingestion, but does not affect other insects. We sprayed an area of 2.5 ha at each
herbivore reduction site (250 m along the edge, with the sampling transect at the centre,
by 100 m into the interior of the pine forest), using a helicopter with micron air nozzles
(droplet size approx. 100 microns). In each spray run we applied 4.5 kg/ha of Delfin WG,
mixed with 0.125 L/ha of the wetting agent Du-Wet (Elliot Chemicals Ltd., Auckland,
NZ), and water according to aerial spray guidelines. These amounts and timing were
according to the manufacturers’ instructions for maximal effectiveness, and comparable
to amounts found to be maximally effective against lepidopteran pests (Tortricidae) in
North American coniferous forests36.
We used transect data on caterpillar abundances before and after the herbivore
reduction treatment (see next section) to test whether the treatment had the desired effect.
We fitted a generalized linear mixed model with a Poisson error distribution (including
the canonical log link function), and caterpillar abundance in plantation forest as the
response variable. The predictors were collection (two levels: with the two before-
herbivore-reduction collections pooled into one “before” sample vs. the two after-
herbivore-reduction collections pooled into one “after” sample), treatment (herbivore
reduction vs. control) and the collection x treatment interaction as fixed effects. Forest
type, nested within site, nested within block were included as random factors to account
for the non-independence of repeated measures at the before and after time steps. As
desired, the spray significantly reduced caterpillar abundance in the herbivore reduction
treatments relative to the control treatments (interaction effect Z = -3.18, p = 0.002, Fig.
4a, light green bars; Supplementary Table 1).
Sampling of species and interactions
Sampling procedures were the same at training and validation sites (Fig. 1a, g, h). To
collect quantitative food-web data from which to assess indirect species interactions, we
sampled lepidopteran larvae (caterpillars) and their parasitoids from the adjacent native
and plantation forests at each site. In each sampling round, we collected caterpillars at
each site by establishing one 50 m transect in each forest type, 10 m from and parallel to
the edge, which we designated as the last row of pine trees abutting the native forest. The
10 m distance was a compromise between a small spatial scale over which parasitoids
would be likely to disperse37, and a distance from the edge great enough that the
vegetation was distinct from that of the adjacent habitat.
We sampled all vegetation within 1 m on either side of each transect, up to a
height of 2 m, by beating each plant and holding a sheet underneath to catch all of the
caterpillars that were dislodged. At ten points (i.e. at 5 m intervals along each transect),
we sampled the lower canopy up to a height of 9 m, within an area of 1 m2, by clipping
all vegetation using an extendable pole with a clipper head on the end. If canopy foliage
was not reachable at a designated clipping point, we clipped four or five branches (an
approximately standard number of leaves) from the nearest reachable point. We beat all
the clippings over large sheets and collected the caterpillars as for the understory
samples. When transect sampling yielded fewer than 50 individuals, we carried out extra
sampling of vegetation on the non-edge side of the transect, and as near to the transect as
possible, until either 50 caterpillars were found, or we had sampled for two person-hours.
We used these extra sampling caterpillars to obtain more accurate estimates of per-capita
parasitism rate and to identify parasitoid-host interactions, but did not include them in
any herbivore abundance calculations.
We housed the collected caterpillars individually, and reared each to adulthood or
parasitoid emergence by feeding it foliage of the host plant on which it had been found,
supplemented with artificial diet formulated for Beet Army Worm (Noctuidae; Bio-Serv
Entomology Custom Research Diets and Environmental Enrichment Products, New
Jersey, USA). After emergence, parasitoids and moths were identified to species level
where possible using available taxonomic information38-41 and expert assistance (see
Acknowledgements), and otherwise to morphospecies (hereafter species; Fig. 1b, g, h).
Congeneric lepidopteran species that were indistinguishable as larvae were lumped,
because when parasitoids emerged, larval morphology was our only means of identifying
the host. However, there were only 11 taxa lumped in this way, and these should not have
affected the results of the study other than to create a more conservative assessment of
whether indirect effects are important in structuring communities. The assessment would
have been more conservative because erroneously lumping two distinct species in this
analysis would label some of the interspecific indirect effects on either of the lumped
species as intraspecific effects. In part of our analysis we removed the contribution of
intraspecific effects to the expected parasitism rates, so this lumping of species would
only have made us less likely to find that expected parasitism rates significantly predicted
observed parasitism rates.
We found parasitism by Hymenoptera, Diptera (Tachinidae), and Nematoda
(Mermithidae). Although little is known about the dispersal capabilities of Nematoda
relative to Hymenoptera and Diptera, there is evidence that Nematoda can disperse long
distances by phoresis42, by infected adults43, and by wind44. These nematodes also killed
the host before emerging, and thus could be accurately described as parasitoids.
Therefore, we included parasitism events by Nematoda in our analysis, in order to
consider the most complete host-parasitoid assemblage possible rather than an arbitrary
subset of this guild based on taxonomy.
Parasitoid molecular identification
Most of the parasitoid wasps collected were of undescribed species. Therefore, in order to
match males with females (which may have different morphology), we DNA-barcoded
representative female specimens that covered the observed morphological variation
within each morphospecies, and all male specimens, in order to link these genetically to
the female taxa. To identify nematode parasitoids we used an exclusively molecular
technique.
To molecularly match male and female parasitoid Hymenoptera and to check
morphospecies, we amplified and sequenced the Cytochrome c oxidase subunit I (COI)
region of the mitochondrial DNA. We removed a leg from each wasp, crushed it, and
performed a DNA extraction using the prepGEM™ Insect kit (ZyGEM Corporation Ltd.,
New Zealand). The extracted DNA was used as a template to amplify the target COI
region using the primer pair HCO2198 (Folmer): 5’-TAA ACT TCA GGG TGA CCA
AAA AAT CA-3’ and LCO1490 (Folmer): 5’-GGT CAA CAA ATC ATA AAG ATA
TTG G-3’45, with KAPA Blood PCR Kit (Kapa Biosystems, USA). We used 50 µL
reactions and the following thermal cycling conditions: 94ºC for 3 min, 30 cycles of 94ºC
(30 sec), 52ºC (30 sec), 72ºC (40 sec), and a final extension of 72ºC for 2 min. 10µl of
the amplified product was resolved on a 1% agarose gel stained with SYBR® Safe DNA
Gel Stain (Life Technologies, USA) to check for correct amplification of the ~650 bp
product. The amplicons were purified using GenCatch PCR Purification Kit (Epoch Life
Science Inc., USA), and the purified product was Sanger sequenced at Macrogen Inc.
(Seoul, Korea). The resulting sequence reads were checked and edited using MEGA46
version 5.
We then used Sequence Demarcation Tool47 v.1.2 to calculate pair-wise similarity
for each pair of aligned sequences, and used MUSCLE48 to re-align the sequences and
cluster them based on similarity scores, using a rooted neighbor-joining tree. We used a
matrix of species-by-species similarity scores47 to match unidentified males to female
morphospecies, and to lump within genera those morphospecies that sequence similarity
suggested should be considered a single species. We did not set a strict percent similarity
species demarcation criterion because we did not sequence all of our specimens, and
therefore we could not use molecular information to split morphospecies. Rather, we
lumped morphospecies based on obvious percent similarity groupings in the species-by-
species similarity matrix. The lowest percent similarity between lumped morphospecies
was 96.05%. All insect parasitoid specimens have been deposited at the New Zealand
Arthropod Collection, Auckland, NZ (Tachinidae and Hymenoptera other than
Braconidae), and the Museum of New Zealand Te Papa Tongarewa, Wellington, NZ
(Braconidae), and the COI sequences of the barcoded wasps have been uploaded onto
GenBank (KM106851 - KM107193).
To identify all individual nematode parasitoids, we used an exclusively molecular
technique. The total DNA was extracted using the Extract-N-Amp™ Tissue PCR Kit
(Sigma-Aldrich, USA). We amplified a ~1 kb region of the 18S ribosomal RNA
sequence, using the primer pair Nem_18S_F: 5’- CGC GAA TRG CTC ATT ACA ACA
GC - 3’ and Nem_18S_R: 5’- GGG CGG TAT CTG ATC GCC - 3’49, with KAPA Blood
PCR Kit (Kapa Biosystems, USA). We used the following thermal cycling conditions:
94ºC for 3 min, 30 cycles of 94ºC (30 sec), 55ºC (30 sec), 72ºC (1 min), and a final
extension of 72ºC for 2 min. We used the same purification, sequencing, and analysis
methods for the nematode amplicons as for the Hymenoptera amplicons. The GenBank
accession numbers for the nematode sequences are KP307028 - KP307059.
Data analysis: Regional measure of shared parasitism
To generate a regional quantitative measure of shared parasitoids for each host species
pair in the region, with maximum possible resolution, we created a quantitative food web
for the region (the ‘metaweb’ of pooled data from our training sites, Figs. 1b,c). We then
used this regional metaweb to calculate a quantitative measure of shared parasitoids, or
the potential for apparent competition, dij (Ref 22) (the dependence of parasitoids of host
species i on host species j; Fig. 1d,e). This dependence, dij, measures the proportion of
parasitoids attacking host species i that recruited from host species j, for every pair of
host species in a community22:
(1)
where α is the link strength (i.e. number of attacks), i and j are a focal host species
pair, m is all host species from 1 to H (the total number of host species), k is a parasitoid
species, and l is all parasitoid species, from 1 to P (the total number of parasitoid
species).
However, to extend this equation to multiple habitats, we indexed host species by
habitat (Fig. 2c) such that, for example, species i in habitat A (e.g. plantation forest)
would be treated as a separate species from species i in habitat B (e.g. native forest) in
Equation 1. Effectively, this expanded Equation 1 to explicitly consider two habitats,
each containing hosts that share parasitoids, which move freely between habitats.
Although it is not possible to know the extent to which each parasitoid individual views
the native/plantation edge as a boundary, our previous work in this region found
considerable movement of adults of our parasitoid species in both directions across the
edge21. Furthermore, we incorporated habitat effects into our hypothesis tests to
determine whether this assumption was violated. Thus, we calculated diAjB, the habitat-
specific contribution to parasitism of host i by parasitoids of host j:
(2)
where diAjB is the proportion of parasitoids attacking species i in habitat A that were
reared from species j in habitat B. A is the habitat of host species i, B is the habitat of host
species j, Hq is the total number of host species from the total pool of q habitats
producing parasitoids. For all calculations with Equation 2 in this study, q includes both
the native and plantation forests. All other variables are as defined in Equation 1.
The first part of Equation 2 represents the fraction of attacks by parasitoid species
k on host species i in habitat A out of the total number of attacks by all of the P species of
parasitoid on host i in habitat A. This is then multiplied by the number of parasitoids of
species k that were reared out of host species j in habitat B during the same sampling
period, divided by the total number of individuals of parasitoid species k that were reared
out of all of the H host species in either of the habitats considered.
In the case where A = B, diAjB measures within-habitat shared parasitism, and when
A ≠ B, diAjB measures cross-habitat shared parasitism. However, in both of these cases q =
2, since even for parasitism within only one of the habitats, both habitats will contribute
to the total pool of parasitoids. If the total pool of parasitoids occurs in only one habitat,
Equation 2 simplifies to Equation 1 (when A = B and q = 1). When i = j, diAjB measures
the proportion of parasitoids attacking species i that recruit from species i in the same (A
= B) or different (A ≠ B) habitat (i.e. the intraspecific contribution of i to its own
parasitoid pool).
Expected, observed and initial parasitism rates
We tested whether we could use knowledge of the proportions of shared parasitoids (diAjB
values) between host species in our training metaweb (Fig. 1e), as well as initial attack
rates from (pre-treatment) time t at our validation sites (Fig. 1g), to predict parasitism
rates at (post-treatment) time t + 1 at the validation sites (Fig. 1h), given known changes
in host abundances (Fig. 1g, h). Parasitism rate refers to the number of parasitism events
divided by the number of hosts sampled. We first calculated the expected parasitism rate
at time t + 1 of host species i in habitat A using:
(3)
where n is host abundance, t is a time step (before or after sampling dates), and all
other variables are defined as in Equation 2. Here, when q = 2, B can take values of either
habitat. When q = 1, B is limited to being either one habitat or the other (here plantation
or native forest). That is, when q = 2, this equation calculates the expected parasitism rate
of host i in habitat A based on potential apparent competition with hosts in the same and
the adjacent habitat. When q = 1 it calculates the expected parasitism rate of host i in
habitat A based on potential apparent competition with hosts either in plantation or in
native forest. In both cases, A can take values of either habitat. We calculated diAjB from
the metaweb (transect plus extra sampling data for maximum resolution on interactions)
from our training sites (Fig. 1d, e), and αiAl(t) (transect plus extra sampling data) and njB(t)
(transect data only, for a standardized measure of abundance) from our validation sites in
the pre-herbivore-reduction (time t) samples (in both reduction and control sites; Fig. 1g).
We calculated njB(t+1) (transect data only) and niA(t+1) (transect plus extra sampling data,
since αiAl(t) was calculated from transect plus extra sampling data) from the post-
herbivore-reduction samples (also in both reduction and control sites; Fig. 1h). Equation
3 calculates, for every host j (in either habitat) that shares parasitoids with host i in
habitat A, the expected per capita attack rate on host i of parasitoids that were reared from
host j. This expected per capita attack rate on host i due to parasitoids from host j is then
multiplied by the t + 1 abundance of species j to convert the rate to a number of
parasitism events. When summed over all H, this gives the expected number of attacks
(not rate) on species i at time t + 1, which can then be divided by the abundance of
species i at time t + 1 to give the expected parasitism rate (Fig. 1i). In cases where more
attacks were predicted than hosts were collected in the t + 1 collection, expected
parasitism rates were greater than one. We reduced these expected parasitism rates to 1 in
our analysis because our definition of parasitism rate was parasitized hosts / total hosts
(i.e. host centric), so rates greater than one are not possible.
Equation 3 is written such that the expected parasitism rate of host i increases in
proportion to the abundance of host j. Thus, it assumes apparent competition between
hosts that share parasitoids, rather than apparent mutualism. A positive correlation
between expected and observed parasitism rate would therefore suggest that apparent
competition is more important than apparent mutualism, whereas a negative correlation
would suggest that apparent mutualism is more important than apparent competition.
For the entire herbivore assemblage, we tested whether this expected parasitism
rate significantly predicted the observed parasitism rate of each host species i at time t +
1, which was calculated as:
(4)
where all variables are defined and calculated as in equation 3 (Fig. 1j).
To test whether predictions based on apparent competition were necessary to predict
observed parasitism rates, we also tested whether observed parasitism rates could be
predicted simply by using initial parasitism rates:
(5)
where all variables are defined as above and both αiAl(t) and niAt are calculated from
transect plus extra sampling data.
Finally, because apparent competition is defined as a change in abundance, rather
than parasitism rate, of one species as a result of an indirect interaction with another
species via a shared predator, we tested whether our expected parasitism rate for all
species i could predict the change in abundance between time steps for all species i (Fig.
1k). Change in abundance was calculated as:
(6)
where all variables are defined as above and niA(t+1) and niAt are calculated from
transect data only.
Hypothesis testing
We first tested whether expected parasitism rate based on shared parasitoids from both
habitats could predict observed parasitism rate (Fig. 1l). This test was to determine
whether parasitoid-mediated indirect effects structure attack rates across the entire host-
parasitoid assemblage to the extent that quantitative food webs can be used to predict
parasitism rates. Unlike in previous studies15,27,50, these hosts were not chosen based on
predicted strength of interactions, but rather included all the hosts that were attacked at
time t+1. This test assumed that one pool of parasitoids was shared between the two
adjacent habitats, with a habitat term included in the model to determine whether
violation of this assumption was masking a relationship between expected and observed
parasitism rate. The interaction between the habitat term and expected parasitism rate
tested whether predictive power of expected parasitism rate depended on the habitat of
host i, since the habitat edge might filter natural enemies in one direction33, and therefore
make parasitism rates in one habitat less predictable because of the cross-habitat
contribution to the expected parasitism rate.
We used a generalized linear mixed model (GLMM) with a binomial distribution, in
which OiA(t+1) (Equation 4) was predicted by EiA(t+1) (Equation 3), habitatA, herbivore
reduction treatment, and all interactions, with forest nested within site nested within
block included as random factors. A significant three-way EiA(t+1)*habitatA*herbivore
reduction treatment interaction would mean that expected parasitism rate predicts
observed parasitism rate with different success depending on the habitat of the focal host,
and that predictive ability within habitat also depends on the magnitude of change in host
abundance.
In all analyses, to select the best model we first selected the optimal random factor
structure51. We ran the full model, as well as models with all combinations of nested
random factors or each random factor singly, and selected the model with the lowest
Akaike Information Criterion (AIC) value52. Then, using this optimal random factor
structure, we selected the best-fitting fixed effects structure, again by running the full
model as well as all possible simpler models, and selecting the one with the lowest AIC
value. Where models differed by less than 2 AIC points, we selected the simpler model to
adhere to the principle of parsimony. All generalized linear mixed models were tested in
the lme4 package53 in R version 3.1.254. Here and in all subsequent analyses we tested for
overdispersion, and found that models were not overdispersed (i.e. the ratio of the sum of
squared Pearson residuals to residual degrees of freedom was < 2 and non-significant
when tested with a Chi-squared test.). To calculate the percent of variation explained by
expected parasitism rate in this and all subsequent analyses using mixed effects models,
we calculated Nakagawa and Schielzeth’s marginal R2 (R2GLMM(m))55. We also calculated
conditional R2 (R2GLMM(c)) to look at the variation explained by the fixed and random
effects. For linear models we report multiple R2. To test how the inclusion of each fixed
effect changed the variance components at different levels of the mixed model, we
calculated the percent change in variance for each level (PCV) by comparing the final
model with a null (intercept only) model that had the same random effects structure55.
We were interested in whether the contribution to expected parasitism rate by
interspecific and cross-habitat intraspecific indirect effects could predict observed
parasitism rates. To test this, we repeated the above hypothesis tests, this time excluding
within-habitat intraspecific contributions (i.e. delayed density-dependent parasitism,
where i = j and A = B) to the expected parasitism rate calculation. To test whether
predictions based on apparent competition could better predict observed parasitism rate
than could initial parasitism rate, we repeated the above hypothesis tests, but with initial
parasitism rate as the response variable.
To better understand our initial results, we tested whether predicted cross-habitat
indirect effects were realized, or whether the predictive ability of expected parasitism rate
is largely due to its prediction of within-habitat effects. For this analysis we included only
cases in which parasitism was observed at t+1, because zero-values (no parasitism) could
not be attributed to either within- or cross-habitat hosts. We separated the expected
parasitism rates into the expected attacks based on cross-habitat versus within-habitat
host abundances. To calculate cross-habitat vs. within-habitat expected parasitism rates,
we set q equal to 1 in Equation 3, and first set B (the habitat of host j) to be plantation
forest. These settings allowed us to calculate expected parasitism rates for host i in both
plantation and native forest based on apparent competition with hosts in plantation forest.
For host i in plantation forest, this would produce within-habitat expected parasitism
rates, and for host i in native forest, this would produce cross-habitat expected parasitism
rates. We then set B to be native forest, and again calculated EiA(t+1) for host i. For host i in
plantation forest, this produced cross-habitat expected parasitism rates, and for host i in
native forest, this produced within-habitat expected parasitism rates. This process
produced both within- and cross-habitat expected parasitism rates for each host species i
in plantation forest, and each host species i in native forest. To test whether cross-habitat
expected parasitism rates predicted observed parasitism rate, and whether they predicted
a component of the variation in observed parasitism rate beyond that predicted by within-
habitat expected parasitism rate, we used a GLMM with a binomial distribution and
OiA(t+1) as the response variable. Within-habitat and cross-habitat expected parasitism rates
were included as separate fixed predictors, and forest within site within block were
included as nested random factors in the full model, before selection of the best random
and then fixed effect structure. Expected parasitism rates were log-transformed to achieve
a more even distribution of values and improve linear model fit (but results were not
qualitatively different without this transformation; data not shown). Hypothesis tests were
based on partial coefficients, so if both fixed effects were retained in the final model, a
significant effect of the cross-habitat term would indicate additional explanatory power
beyond that of within-habitat expectation or any collinearity among the two predictors.
R2GLMM(m), R2
GLMM(c), and PCV were calculated as above.
To test whether expected parasitism rate could predict change in host abundance, we
used a linear mixed effects model with change in host abundance, ΔniA, as the response
variable, EiA(t+1), HabitatA, and herbivore reduction treatment as fixed predictor variables,
and forest nested within site nested within block as random factors. We checked
assumptions of normality and homogeneity of variance, and since during our random
factor selection procedure, we found that the random factors did not account for any of
the variance in change in host abundance, in the end we used a linear model. We also
tested whether initial parasitism rate could be predicted by change in host abundance
using a linear model with ΔniA, as the response variable and IiAt, HabitatA, and herbivore
reduction treatment as fixed predictor variables.
A significant interaction effect between habitatA and expected parasitism rate in the
first model described would mean that cross-habitat indirect effects occur asymmetrically
(across habitat types) in the number of expected interactions that are realized. However,
we also tested whether the magnitude of predicted indirect effects was stronger in one
direction or the other (based on previous results of asymmetric flow of parasitoids from
plantation to native forest21), and compared this to the within-habitat strengths of
predicted indirect effects. To do this we tested whether diAjB was significantly different for
host pairs depending on the habitats of the indirectly ‘affected’ (species i) versus
‘affecting’ (species j) hosts (habitatAB). For this test, we used data from the metaweb
sampled at training sites, since this was sampled over the largest time period, and would
therefore include the largest sample of potential apparent competitive/mutualistic
linkages. We used an ANOVA to test whether the magnitude of log diAjB was related to the
identities of A and B in habitatAB, where habitatAB could be PN (Pine-Native), NN, NP, or
PP. (For example, ‘PN’ refers to the situation where host i, the host affected by apparent
competition, is in plantation forest and host j, the host causing apparent competitive
effects, is in native forest.)
Data availability
Computer code for all analyses presented here is available from the authors upon
request. All relevant data are also available from the authors upon request. The GenBank
accession numbers for the nematode sequences are KP307028 - KP307059. All insect
parasitoid specimens have been deposited at the New Zealand Arthropod Collection,
Auckland, NZ (Tachinidae and Hymenoptera other than Braconidae), and the Museum of
New Zealand Te Papa Tongarewa, Wellington, NZ (Braconidae), and the COI sequences
of the barcoded wasps have been uploaded onto GenBank (KM106851 - KM107193).
This article is based on a doctoral thesis chapter56.
References1. Symondson, W. O. C., Sunderland, K. D. & Greenstone, M. H. Can generalist
predators be effective biocontrol agents? Annu. Rev. Entomol. 47, 561–594 (2002).
2. Montoya, J. M., Woodward, G., Emmerson, M. C. & Solé, R. V. Press perturbations and indirect effects in real food webs. Ecology 90, 2426–2433 (2009).
3. Estes, J. A et al. Trophic downgrading of planet Earth. Science 333, 301–306 (2011).
4. Suttle, K. B., Thomsen, M. A. & Power, M. E. Species interactions reverse grassland responses to changing climate. Science 315, 640–642 (2007).
5. Novak, M. et al. Predicting community responses to perturbations in the face of imperfect knowledge and network complexity. Ecology 92, 836–836 (2011).
6. Bonsall, M. B. & Hassell, M. P. Apparent competition structures ecological assemblages. Nature 388, 371–373 (1997).
7. Menge, B. A. Indirect effects in marine rocky intertidal interaction webs : Patterns and importance. Ecol. Monogr. 65, 21–74 (2008).
8. O’Connor, N. E., Emmerson, M. C., Crowe, T. P. & Donohue, I. Distinguishing between direct and indirect effects of predators in complex ecosystems. J. Anim. Ecol. 82, 438–448 (2013).
9. Holt, R. D. Predation, Apparent Competition, and the Structure of Prey Communities. Theor. Popul. Biol. 229, 197–229 (1977).
10. Bascompte, J. & Melián, C. J. Simple trophic modules for complex food webs. Ecology 86, 2868–2873 (2005).
11. Morris, R. J., Lewis, O. T. & Godfray, H. C. J. Apparent competition and insect community structure: towards a spatial perspective. Ann. Zool. Fennici 42, 449–462 (2005).
12. Müller, C. B. & Godfray, H. C. J. Apparent competition between two aphid species. J. Anim. Ecol. 66, 57–64 (1997).
13. Long, W. C., Gamelin, E. F., Johnson, E. G. & Hines, A. H. Density-dependent indirect effects: Apparent mutualism and apparent competition coexist in a two-prey system. Mar. Ecol. Prog. Ser. 456, 139–148 (2012).
14. Abrams, P. A., Holt, R. D. & Roth, J. D. Apparent competition or apparent mutualism? Shared predation when populations cycle. Ecology 79, 201–212 (1998).
15. Tack, A. J. M., Gripenberg, S. & Roslin, T. Can we predict indirect interactions from quantitative food webs? - An experimental approach. J. Anim. Ecol. 80, 108–118 (2011).
16. Van Maanen, R., Messelink, G. J., Van Holstein-Saj, R., Sabelis, M. W. & Janssen, A. Prey temporarily escape from predation in the presence of a second prey species. Ecol. Entomol. 37, 529–535 (2012).
17. Chaneton, E. J. & Bonsall, M. B. Enemy-mediated apparent competition: empirical patterns and the evidence. Oikos 88, 380–394 (2000).
18. Holt, R. D. & Hochberg, M. E. Indirect interactions, community modules and biological control: a theoretical perspective. In Eval. Indirect Ecol. Eff. Biol. Control (Wajnberg, E., Scott, E. & Quimby, P. C.) 13–37 (CAB International, 2001).
19. McCann, K. S., Rasmussen, J. B. & Umbanhowar, J. The dynamics of spatially coupled food webs. Ecol. Lett. 8, 513–523 (2005).
20. Rand, T. A., Tylianakis, J. M. & Tscharntke, T. Spillover edge effects: The dispersal of agriculturally subsidized insect natural enemies into adjacent natural habitats. Ecol. Lett. 9, 603–614 (2006).
21. Frost, C. M., Didham, R. K., Rand, T. A., Peralta, G. & Tylianakis, J. M. Community-level net spillover of natural enemies from managed to natural forest. Ecology 96, 193–202 (2014).
22. Müller, C. B., Adriaanse, I. C. T., Belshaw, R. & Godfray, H. C. J. The Structure of an aphid-parasitoid community. J. Anim. Ecol. 68, 346–370 (1999).
23. Schönrogge, K. & Crawley, M. J. Quantitative webs as a means of assessing the impact of alien insects. J. Anim. Ecol. 69, 841–868 (2000).
24. Lewis, O. T. et al. Structure of a diverse tropical forest insect-parasitoid community. J. Anim. Ecol. 71, 855–873 (2002).
25. Van Veen, F. J. F., Müller, C. B., Pell, J. K. & Godfray, H. C. J. Food web structure of three guilds of natural enemies: Predators, parasitoids and pathogens of aphids. J. Anim. Ecol. 77, 191–200 (2008).
26. Carvalheiro, L. G. et al. The potential for indirect effects between co-flowering plants via shared pollinators depends on resource abundance, accessibility and relatedness. Ecol. Lett. 17, 1389–1399 (2014).
27. Morris, R. J., Lewis, O. T. & Godfray, H. C. J. Experimental evidence for apparent competition in a tropical forest food web. Nature 428, 310–313 (2004).
28. Dunne, J. A., Williams, R. J. & Martinez, N. D. Network structure and biodiversity loss in food webs: Robustness increases with connectance. Ecol. Lett. 5, 558–567 (2002).
29. Beggs, J. R. & Rees, J. S. Restructuring of Lepidoptera communities by introduced Vespula wasps in a New Zealand beech forest. Oecologia 119, 565–571 (1999).
30. Louda, S. M., Pemberton, R. W., Johnson, M. T. & Follett, P. A. Nontarget effects--the Achilles’ heel of biological control? Retrospective analyses to
reduce risk associated with biocontrol introductions. Annu. Rev. Entomol. 48, 365–396 (2003).
31. Russell, F. L., Louda, S. M., Rand, T. A. & Kachman, S. D. Variation in herbivore-mediated indirect effects of an invasive plant on a native plant. Ecology 88, 413–423 (2007).
32. Green, R. E., Cornell, S. J., Scharlemann, J. P. W. & Balmford, A. Farming and the fate of wild nature. Science 307, 550–555 (2005).
33. Eycott, A. E. et al. A meta-analysis on the impact of different matrix structures on species movement rates. Landsc. Ecol. 27, 1263–1278 (2012).
34. Brockerhoff, E. G., Jactel, H., Parrotta, J. A., Quine, C. P. & Sayer, J. Plantation forests and biodiversity: Oxymoron or opportunity? Biodivers. Conserv. 17, 925–951 (2008).
35. Peralta, G., Frost, C. M., Rand, T. A., Didham, R. K. & Tylianakis, J. M. Complementarity and redundancy of interactions enhance attack rates and spatial stability in host-parasitoid food webs. Ecology 95, 1888–1896 (2014).
36. Bauce, E., Carisey, N., Dupont, A. & van Frankenhuyzen, K. Bacillus thuringiensis subsp. kurstaki aerial spray prescriptions for balsam fir stand protection against spruce budworm (Lepidoptera: Tortricidae). J. Econ. Entomol. 97, 1624–1634 (2004).
37. Elzinga, J. A., van Nouhuys, S., van Leeuwen, D. J. & Biere, A. Distribution and colonisation ability of three parasitoids and their herbivorous host in a fragmented landscape. Basic Appl. Ecol. 8, 75–88 (2007).
38. Huddleston, T. The braconid genus Meteorus in New Zealand (Insecta: Hymenoptera). J. Nat. Hist. 20, 255–265 (1986).
39. Austin, A. D. & Dangerfield, P. C. Synopsis of Australasian Microgastrinae (Hymenoptera: Braconidae), with a key to genera and description of new taxa. Invertebr. Taxon. 6, 1–76 (1992).
40. Berry, J. A. Meteorus pulchricornis (Wesmael) (Hymenoptera: Braconidae: Euphorinae), a new record for New Zealand. New Zeal. Entomol. 20, 45–48 (1997).
41. van Achterberg, C., Berndt, L., Brockerhoff, E. & Berry, J. A new species of genus Aleiodes Wesmael from New Zealand (Hymenoptera: Braconidae: Rogadinae). Zool. Meded. 78, 301–311 (2004).
42. Kruitbos, L. M., Heritage, S. & Wilson, M. J. Phoretic dispersal of entomopathogenic nematodes by Hylobius abietis. Nematology 11, 419–427 (2009).
43. Gordon, R., Ebsary, B. A. & Bennett, G. F. Potentialities of Mermithid nematodes for the biocontrol of blackflies (Diptera: Simuliidae) - a review. Exp. Parasitol. 33, 226–238 (1973).
44. Carroll, J. J. & Viglierchio, D. R. On the transport of nematodes by the wind. J. Nematol. 476–483 (1981).
45. Folmer, O., Black, M., Hoeh, W., Lutz, R. & Vrijenhoek, R. DNA primers for amplification of mitochondrial cytochrome c oxidase subunit I from diverse metazoan invertebrates. Mol. Mar. Biol. Biotechnol. 3, 294–299 (1994).
46. Tamura, K. et al. MEGA5: Molecular Evolutionary Genetics Analysis Using Maximum Likelihood, Evolutionary Distance, and Maximum Parsimony Methods. Mol. Biol. Evol. 28, 2731–2739 (2011).
47. Muhire, B. M., Varsani, A. & Martin, D. P. SDT : A Virus Classification Tool Based on Pairwise Sequence Alignment and Identity Calculation. PLoS ONE 9, (2014).
48. Edgar, R. C. MUSCLE: a multiple sequence alignment method with reduced time and space complexity. BMC Bioinformatics 5, 113 (2004).
49. Floyd, R. M., Rogers, A. D., Lambshead, P. J. D. & Smith, C. R. Nematode-specific PCR primers for the 18S small subunit rRNA gene. Mol. Ecol. Notes 5, 611–612 (2005).
50. Kaartinen, R. & Roslin, T. Apparent competition leaves no detectable imprint on patterns of community composition: Observations from a natural experiment. Ecol. Entomol. 38, 522–530 (2013).
51. Zuur, A., Ieno, E. N., Valker, N., Saveliev, A. A. & Smith, G. M. Mixed Effects Models and Extensions in Ecology with R. (Springer, 2009).
52. Burnham, K. P. & Anderson, D. R. Model selection and multimodel inference: a practical information-theoretic approach. (Springer, 2002).
53. Bates, D., Maechler, M., Bolker, B. M. & Walker, S. lme4: Linear mixed-effects models using Eigen and S4. (2014).
54. R Core Team. R: A language and environment for statistical computing. (2014).
55. Nakagawa, S. & Schielzeth, H. A general and simple method for obtaining R2 from generalized linear mixed-effects models. Methods Ecol. Evol. 4, 133–142 (2013).
56. Frost, C. M. Spillover and species interactions across habitat edges between managed and natural forests. 2013. University of Canterbury. Christchurch, New Zealand.
57. Dormann, C. F., Gruber, B. & Fründ, J. Introducing the bipartite Package: Analysing Ecological Networks. R news 8, 8–11 (2008).
Acknowledgements
We thank Nelson Forests Ltd., Merrill & Ring, Hancock Timber Resource Group, M.
Turbitt, D. Bryant, N. Buchanan, L. and P. Douglas, and the Department of
Conservation for forest access. J. Dugdale, J. Berry, and R. Schnitzler provided
taxonomic assistance. J., B., D., D., and S. Ladley, D. Conder, N. Etheridge, and D.
Payton assisted with field and lab logistics. Y. Brindle, C. Hohe, S. Litchwark, S. Hunt,
A. McLeod, L. O’Brien, A. Knight, L. Williamson, T. Lambert, H. McFarland, E. Allen, C.
Thomas, R. McGee, K. Trotter, T. Watson, V. Nguyen, A. Young, D. Davies, and M.
Bartlett assisted with caterpillar collection and rearing. The Tylianakis and Stouffer
labs, J. Beggs, H.C.J. Godfray, K.S. McCann, and T. Roslin provided comments on the
manuscript. C.M.F. was supported by the Natural Sciences and Engineering Research
Council of Canada, Education New Zealand, and the University of Canterbury. The
project itself, J.M.T and G.P. were supported by the Marsden Fund (UOC-0802).
R.K.D. was funded by an Australian Research Council Future Fellowship
FT100100040. A.V. is supported by the National Research Foundation of South
Africa. J.M.T. is funded by a Rutherford Discovery Fellowship, administered by the
Royal Society of New Zealand.
Author Contributions
CMF and GP carried out field work and identification of samples, CMF wrote the first
draft of the manuscript and carried out the statistical analysis with input from JMT
and RKD. JMT, RKD and TAR secured funding and developed the idea with CMF. AV
led the DNA barcoding and molecular identification of specimens, with CMF and GP.
All authors commented on manuscript drafts and contributed to writing.
Competing financial interests
The authors declare no conflicts of interest.
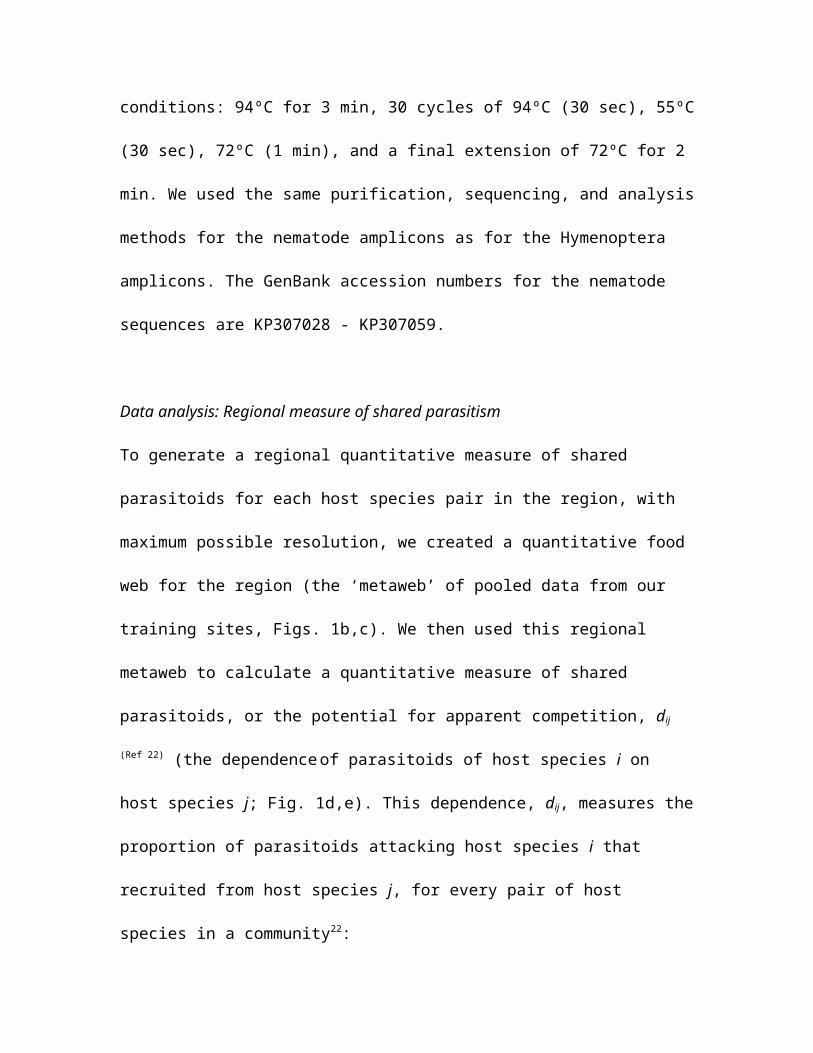
Figure legends
Figure 1. Summary of methods. Sampling at training sites produced a measure of
shared parasitism for each species pair among all species found in the region. (a)
Lepidopteran larvae were collected along transects within native and plantation
forest at eight forest edge sites. (b) Larvae were identified and reared to determine
parasitism rates and parasitoid (Hymenoptera, Diptera, and Nematoda) identities.
(c) Data were pooled across sites and sampling dates, but kept separate by forest
type, in order to produce one regional quantitative food web (host-parasitoid
matrix), in which host habitat was explicit. (d) The potential for apparent
competition, diAjB, was calculated for each host pair within and across habitats. (e)
This diAjB value was the regional measure of shared parasitism used to calculate
Expected parasitism rate in Eq. 3 (f, i). (g) We sampled at control and herbivore
reduction validation sites at two time steps (g-h), before and after the aerial spray
herbivore reduction treatment, which occurred between time steps (h). This allowed
measurement of the initial attack rates and initial host abundances (g) and changes
in host abundances (g-h) necessary to calculate Expected parasitism rate (i), as well
as measurement of the final attack rates and final host abundances (h) necessary to
calculate Observed parasitism rates (j) and change in focal host abundances (k). We
used generalized linear mixed models to test whether Expected parasitism rate
significantly predicted Observed parasitism rate and change in focal host abundance
(l) at validation sites, and thus whether apparent competition structures host-
parasitoid assemblages in a predictable manner.
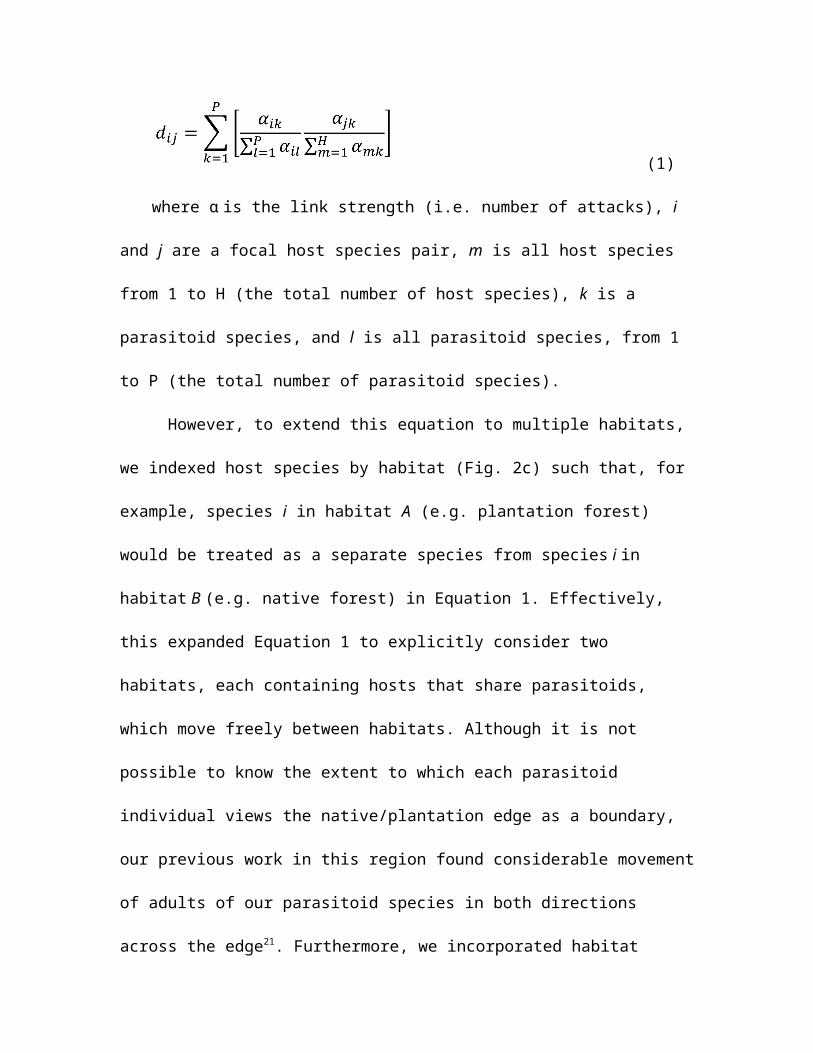
Figure 2. Regional metaweb built from quantitative food-web data. Data were
collected at habitat edges between native forest and exotic plantation forest and are
pooled across eight training sites and seven sampling dates. Bars on the left
represent herbivore host species in native forest (blue) or plantation forest (red),
and bar thickness is proportional to number of parasitism events (358 total
parasitism events from 2725 individual hosts reared). Bars on the right represent
parasitoid species, and lines connecting parasitoids and host species denote
parasitism, with parasitoids attacking hosts in native forest only (green), plantation
forest only (purple), or both forest types (yellow). Parasitoid bar thickness is
proportional to attack rate56. Numbers adjacent to host names correspond to the
host numbers in Fig. 2.
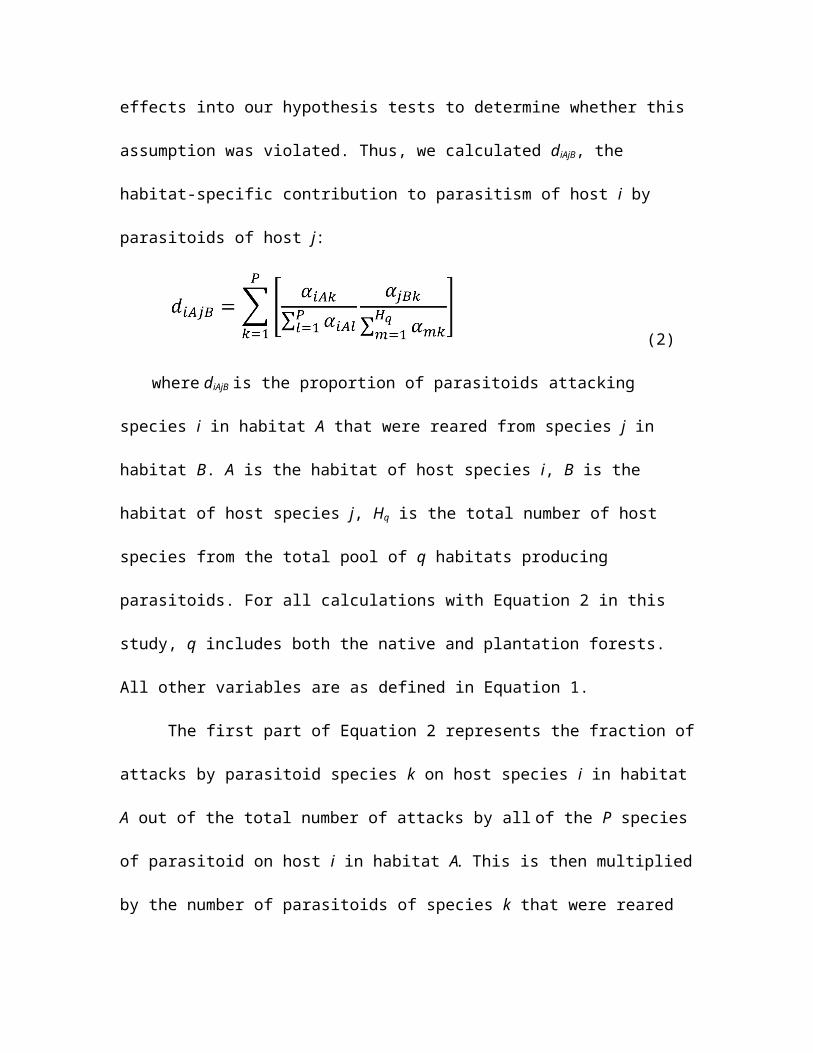
Figure 3. Parasitoid overlap graph for the region. Data compiled from training sites
(358 total parasitism events from 2725 individual hosts reared). This figure shows
the potential for apparent competition between all parasitized herbivore host
species in native forest (blue) and plantation forest (red). Numbers represent host
species (see Fig. 2 for names), some of which are found in both habitats. Host circle
size is proportional to the number of parasitoids recruiting from that host species,
and circle fill represents the proportion of self-loops, i.e. parasitoids attacking the
same species from which they recruit. Lines between hosts represent sharing of
parasitoids between those host species, with line thickness proportional to export of
parasitoids11,57. Blue lines denote sharing of parasitoids by hosts within the native
forest, red lines denote sharing of parasitoids by hosts within the plantation forest,
and gray lines denote sharing of parasitoids between hosts in different habitats (the
latter allowing cross-habitat apparent competition).
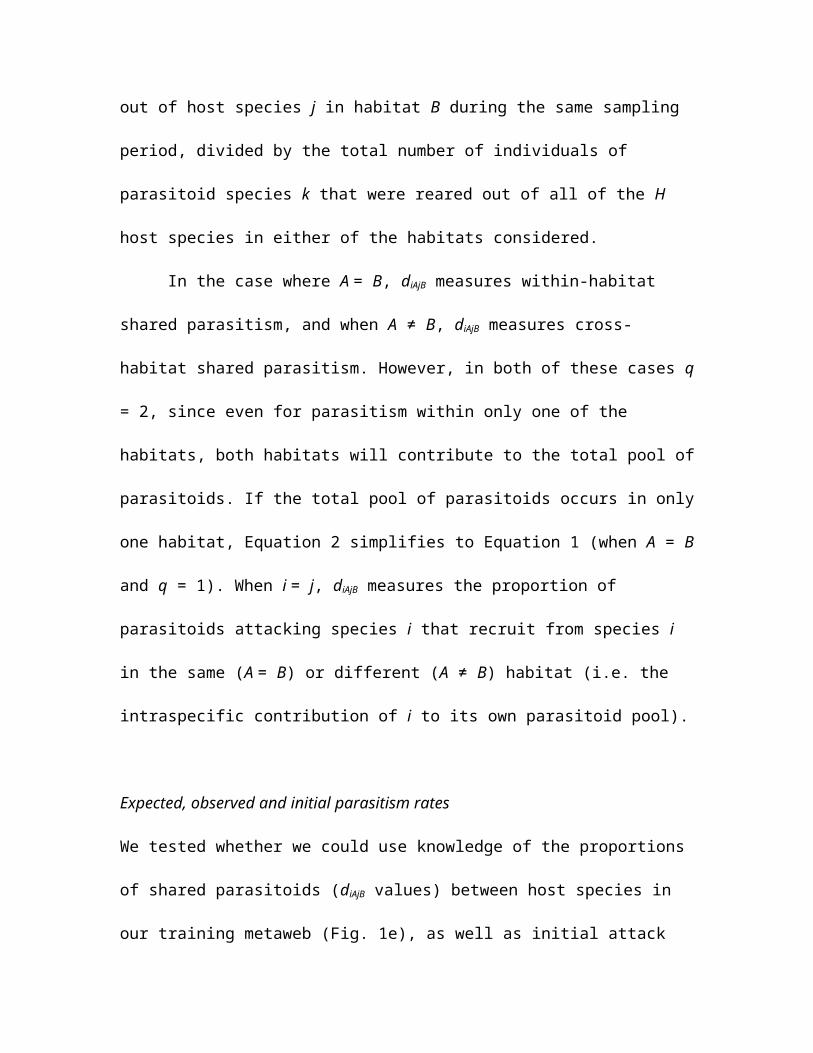
Figure 4. Community average effects of experimental herbivore reduction.
Experimental herbivore reduction (a) reduced caterpillar abundance in treated
plantation forest relative to in control plantation forest (GLMM; z = -3.2, P = 0.002)
and (b) may have affected caterpillar parasitism rates in adjacent native forest
(though the effect of experimental herbivore reduction on parasitism rates was non-
significant, as tested with a GLMM in which the interaction between herbivore
reduction treatment and collection was removed during model selection). H is
herbivore reduction treatment, C is control. Solid orange lines indicate a contrast
significant at α = 0.05. Error bars are S.E.M. In (a) and (b) n = 8 pairs of treatment
and control sites as replicates.
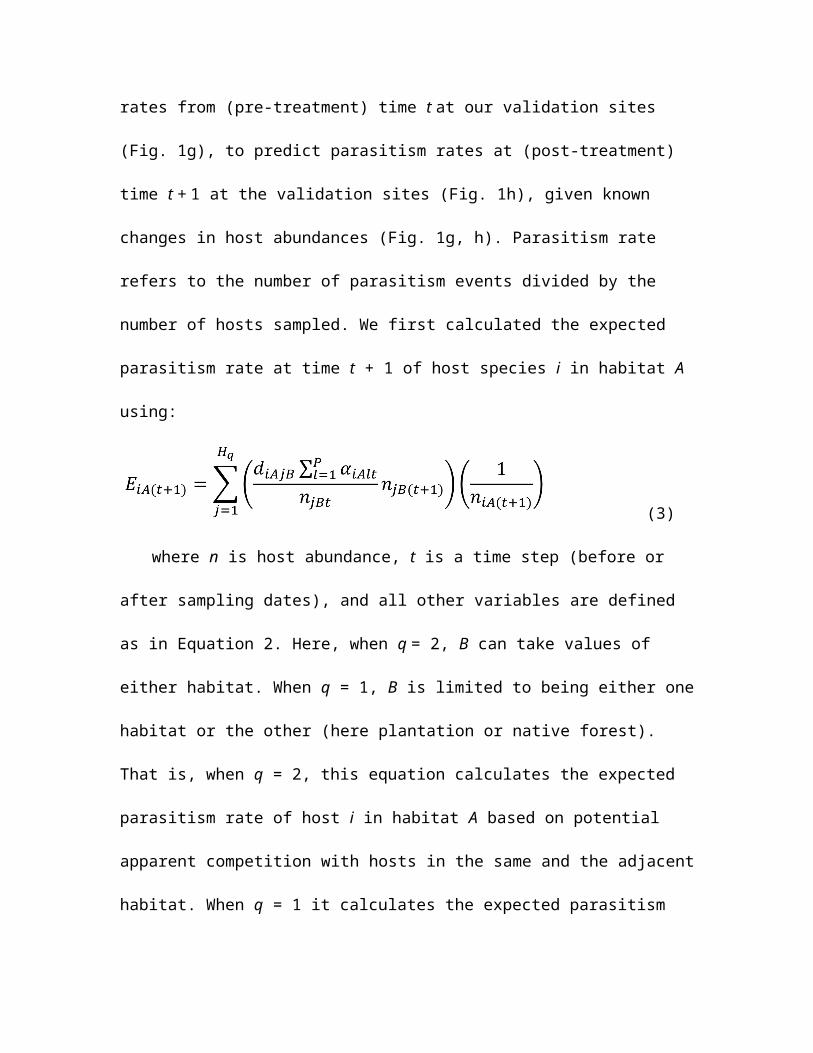
Figure 5. Predictions of parasitism rate and change in host abundance. (a) Expected
parasitism rate predicted observed parasitism rate (GLMM; z = 2.7, P = 0.007,
R2(GLMM(m) = 0.16), whereas (b) initial parasitism rate did not predict observed
parasitism rate (GLMM; z = 1.1, P = 0.266). Observed parasitism rate was also
significantly predicted by expected parasitism rates calculated with only (c) data
from within the same forest as the focal host (GLMM; z = 2.8, P = 0.005, R2GLMM(m) =
0.20), or (d) data from the forest adjacent to the focal host’s habitat (GLMM; z = 2.1,
P = 0.040, R2(GLMM(m) = 0.14). (e) Expected parasitism rate also significantly predicted
change in host abundance (linear model; z-value = -3.0, P = 0.007, R2 = 0.31), but (f)
initial parasitism rate did not predict change in host abundance (linear model; initial
parasitism rate was removed as a predictor during model selection). In (a) – (d),
residuals of the best model excluding the predictor on the x-axis are plotted, and
raw data are plotted in (e) and (f). Residuals are deviations of the logit-linked data
from the best model, and show the unexplained variation in the data remaining once
variation due to the other fixed and random effects in the model have been
accounted for. That is, they show the variation in the data that we are hoping to
explain with the predictor on the x-axis. Each point represents a species within a
site that was collected and successfully reared at both time steps, and was
parasitized in the first time step (see Eq. 3, Fig. 1i). In (a) and (b) closed circles (red)
represent hosts in plantation forest and open circles (blue) represent hosts in native
forest, though only one fitted line is presented because there was no significant
habitatA x expected parasitism rate interaction (in (a) the interaction term was
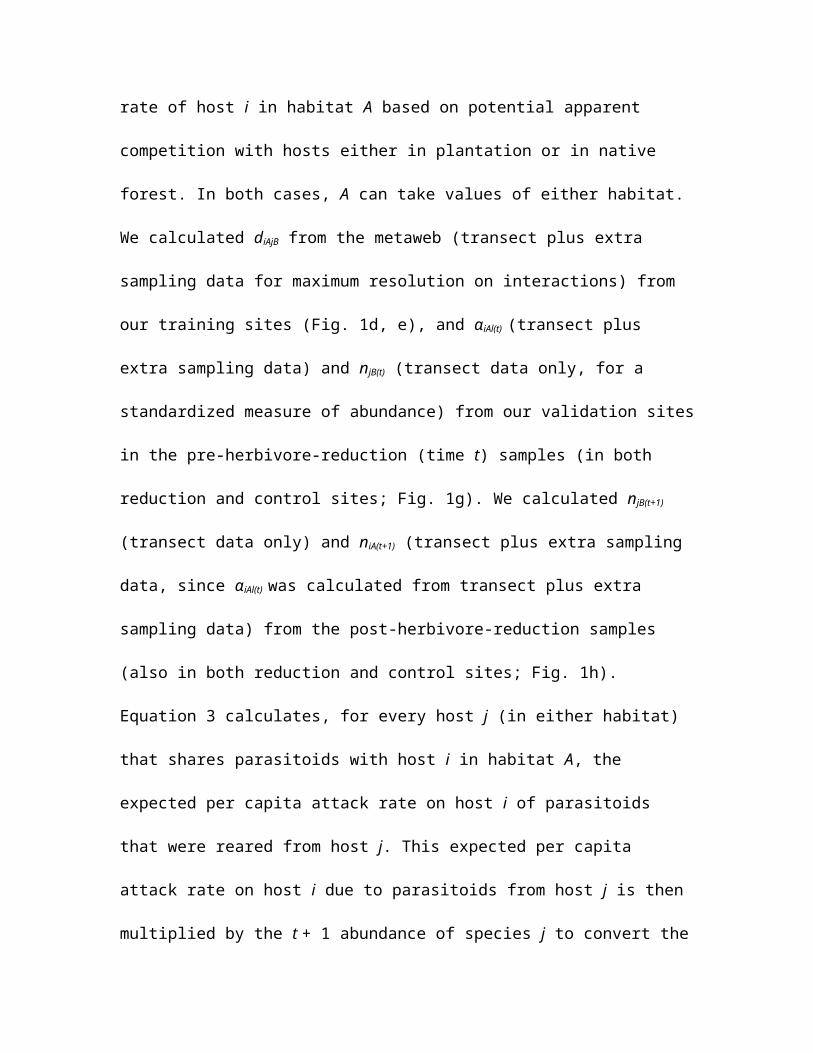
removed during model selection; (b) interaction z = 1.9, P = 0.060). In all panels, n =
8 pairs of treatment and control sites as replicates.
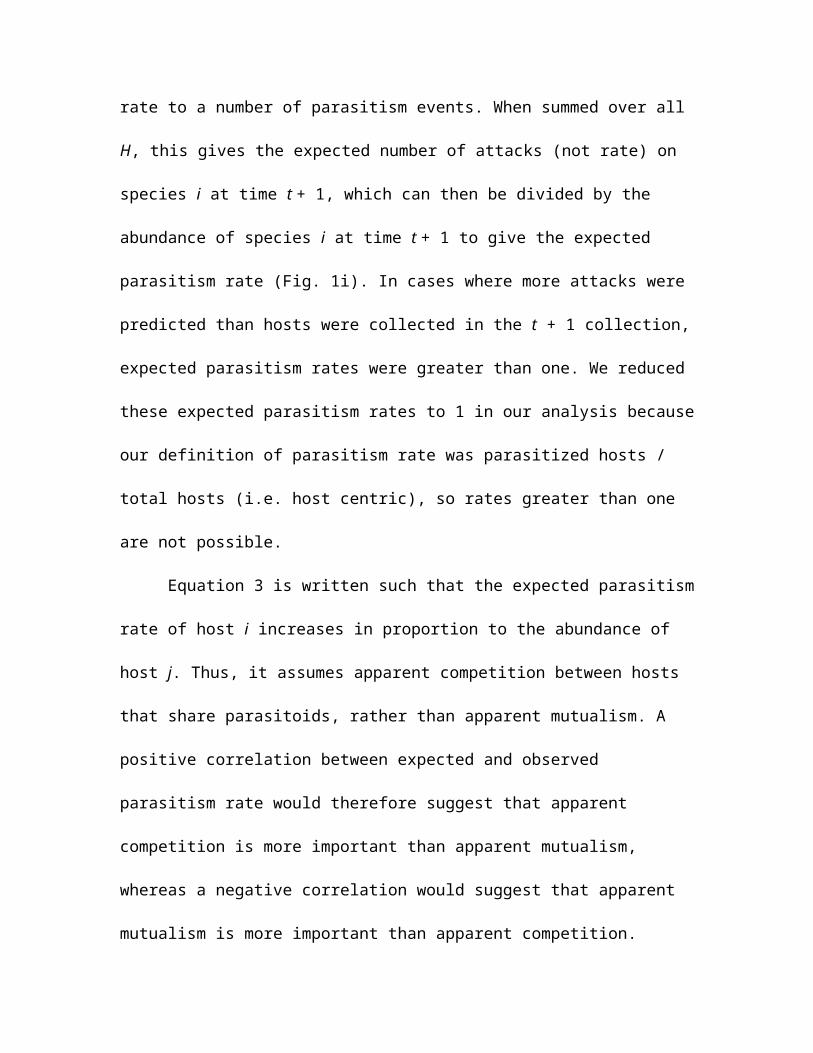
Figure 6.Magnitude of the potential for indirect effects (diAjB) among host species. N
and P refer to native forest and plantation forest, respectively, such that, for
example, PN refers to the situation where host i (the species that is affected) is in
plantation forest and host j (the species that generated the parasitoids attacking
species i) is in native forest. The potential for hosts in plantation forest to affect
hosts in native forest (NP) was not significantly greater than the potential for hosts
in native forest to affect hosts in plantation forest (PN) through apparent
competition (linear model: t = 1.9, P = 0.065). Letters above the bars are post-hoc
mean comparisons. Error bars represent S.E.M. Data for this analysis were from the
regional metaweb (see Fig. 2), so sites were pooled, and habitat-specific species
pairs were replicates (PN: n = 178; NN: n = 255; NP: n = 178; PP: n = 155).