Embed Size (px)
Citation preview
© 2018 Padilla-Bernal et al.423
International Food and Agribusiness Management ReviewVolume 21 Issue 3, 2018; DOI: 10.22434/IFAMR2017.0015
Received: 8 February 2017 / Accepted: 13 December 2017
OPEN ACCESS
Views on sustainability and the willingness to adopt an environmental management system in the Mexican vegetable sector
REVIEW ARTICLE
Luz E. Padilla-Bernal a, Alfredo Lara-Herrerab, Alberto Vélez Rodríguezc, and María L. Loureirod
aProfessor-Researcher, Academic Unit of Accounting and Administration, Autonomous University of Zacatecas, Comercio y Administracion s/n. Col. Progreso, Zacatecas, Zac., Mexico
bProfessor-Researcher, Academic Unit of Agronomy, Autonomous University of Zacatecas, Carr. Zacatecas-Guadalajara Km 15.5 Cieneguitas, Zac., Mexico
cProfessor-Researcher, Academic Unit of Electrical Engineering, Autonomous University of Zacatecas, Av. Ramón López Velarde 801, Zacatecas, Zac., Mexico
dProfessor-Researcher, Department of Economic Theory, University of Santiago de Compostela, Avda. das Ciencias s/n, 15782 Santiago de Compostela, Spain
Abstract
In Mexico, agriculture’s main environmental problems are related to water resources, deforestation and soil erosion. These problems are more acute in arid or semiarid regions such as in the state of Zacatecas. Environmental management systems (EMS) can be an alternate means for improving environmental conditions. In this study, factors that determine willingness to adopt an EMS in the vegetable production units of the state of Zacatecas were identified. We also analysed views on sustainability and production practices oriented toward environmental management and care of natural resources, as well as drivers and barriers to EMS adoption. Factors determining EMS adoption were level of education, awareness of the importance of caring for and protecting natural resources, application of agricultural practices oriented toward protecting the environment, and ignorance of environmental problems.
Keywords: environmental management systems, natural resource management, vegetable sectorJEL code: Q15, Q56
Corresponding author: [email protected]
http
://w
ww
.wag
enin
gena
cade
mic
.com
/doi
/10.
2243
4/IF
AM
R20
17.0
015
- T
uesd
ay, M
arch
20,
201
8 11
:30:
17 A
M -
Uni
vers
ity o
f M
inne
sota
- T
win
Citi
es I
P A
ddre
ss:1
34.8
4.17
.184

International Food and Agribusiness Management Review424
Padilla-Bernal et al. Volume 21, Issue 3, 2018
1. Introduction
The agricultural sector greatly depends on natural resources for production (Aigner et al., 2003; FAO, 2012a) and can both harm and benefit the environment. Today’s agricultural practices contribute around a third of greenhouse effect gases, but the use of good practices can neutralize carbon as well as create environmental services and generate renewable energy while, at the same time, contribute to food security (FAO, 2012a).
In this context, actions that help to guarantee the sustainability of the agricultural sector are of growing importance. The agricultural production units (PUs) that form part of the food production supply chain, in terms of sustainability, face great challenges and opportunities. This involves maintaining a supply of safe, healthy products, confronting environmental impacts generated by agriculture and putting into practice standards of fair labour.
In the case of Mexico, the main agro-environmental problems are associated with water resources and deforestation. Moreover, the growing importance of soil pollution through misuse of chemical products, emission of greenhouse effect gases and soil erosion are also highlighted (OCDE, 2008; SEMARNAT, 2006). According to data from INEGI (2009), the technology used in most of the agricultural area of Mexico is based on the use of chemical fertilizers, herbicides and insecticides, while organic fertilizers are used to on a much smaller scale (García-Gutiérrez and Rodríguez-Meza, 2012). However, these problems can be reduced by implementing an integral program of care and protection of the environment that involves adopting improved agricultural practices, conservation measures and management of environmental impacts.
In arid or semiarid regions, as in the state of Zacatecas, these problems are much more acute. In 2014 in Zacatecas, 87.7% of the agricultural area was rainfed and 12.3% was irrigated (SIAP-SAGARPA, 2015). Irrigation water is extracted from 34 aquifers, of which 14 (41%) is overexploited, according to CNA (2015). Ground water is used to irrigate nearly 150,000 h, 12% of the cultivated area of the state (SIAP-SGARPA, 2015). On 32.8% of this area, seven vegetables are cultivated (chilis, onions, tomatillos, potatoes, garlic, tomatoes and lettuce), generating 62.3% of the value of the production on this area.
Sustainability in this context has become a huge challenge for PUs of the agricultural sector. One step toward handling this problem is transparency in terms of the impact of the production processes of organizations on their ecological and social environment. Consumers, civil society and other agents involved in the supply chain increasingly require that enterprises consider the social and environmental consequences of their activities (Hartmann, 2011:299-304). As an alternative means for improving environmental conditions, independent of normative aspects (Darnall and Sides, 2008:95-97), a series of mechanisms of voluntary adoption have emerged to contribute to the process (Grolleau et al., 2007; Khanna, 2001; Segerson, 2013). Environmental management systems (EMS) and several production protocols that can be used for certification and/or labelling are found among these mechanisms (FAO 2012b, 2014). Although these mechanisms are voluntary, their application with verifiable criteria and standards can be a prior condition for entering some markets.
Although EMSs are widely applied in different industrial sectors, they are less used in the agricultural sector, especially in developing countries (Raymond, 2012). A growing number of publications have studied, theoretically and empirically, what determines adoption of voluntary measures of environmental management in non-agricultural sectors (e.g. Arora and Carson, 1995; Blackman, 2008; Del Brío and Junquera, 2003; Merli et al., 2016; Rezessy and Bertoldi, 2011; Videras and Alberini, 2000). Application of EMSs mainly in the industrial sector has made agricultural producers perceive them as not applicable for them, too complex, difficult and costly (Carruthers, 2005). One of the main barriers to adopting an EMS is the scepticism about the results in terms of improving the environment and the benefits of applying one to their PUs. According to Segerson (2013) there are serious doubts about the effectiveness and efficiency of these mechanisms for achieving the proposed goals. The lack of information on applying EMSs in agriculture generates uncertainty regarding the benefits and costs of their implementation (Carruthers, 2005; Carruthers and Vanclay, 2012; Williams, 2009).
http
://w
ww
.wag
enin
gena
cade
mic
.com
/doi
/10.
2243
4/IF
AM
R20
17.0
015
- T
uesd
ay, M
arch
20,
201
8 11
:30:
17 A
M -
Uni
vers
ity o
f M
inne
sota
- T
win
Citi
es I
P A
ddre
ss:1
34.8
4.17
.184

International Food and Agribusiness Management Review425
Padilla-Bernal et al. Volume 21, Issue 3, 2018
According to SEMARNAT (2006), most of the agricultural PUs in Mexico report a lack of information on natural resources management and on care and protection of the environment. Likewise, few studies report growers’ views of the impact agriculture has on the environment, the importance they give to the sustainability of their PUs, the environmental performance of their PUs or their views on the drivers and barriers to adopting an EMS in this sector. The aim of this study was to help fill the information gap existing in the situation of adoption of voluntary measures of environmental management in the PUs of the agricultural sector. This would allow the different agents involved in the sector’s development to have information to aid in planning their activities in the short and medium term and contribute to the economic, social and ecological sustainability of this productive sector.
The objective of this study is to identify the factors that determine the probability that a vegetable PU in the state of Zacatecas adopt an EMS. Also, views on sustainability and production practices oriented toward environmental management and care of natural resources in the PUs were determined as were the drivers and barriers to EMS adoption. Elements are provided that contribute to development of an EMS for the agricultural sector in Mexico. The study adapted the ‘perceptions’ on sustainability proposed by Rankin et al. (2011), who designed a structure for establishing levels of sustainability in agribusinesses in terms of perceptions, actions and performance criteria. Likewise, we followed the proposal of Hauschildt and Schulze-Ehlers (2014), who connected sustainability views, drivers and barriers to concrete acquisition of practices for sustainability in the industry of food services. It should be mentioned that, although there currently exist diverse tools, measurements and standards that cover different dimensions of sustainability in the PUs and the supply chain (FAO, 2014; ISS, 2009), in our study only environmental sustainability and its management are addressed.
The research questions were the following. What are the views on sustainability of the growers or technicians of the vegetable PUs? What is the level of environmental performance of the vegetable PUs? What are the drivers and barriers to EMS adoption in the vegetable sector? What are the factors that determine the probability of the willingness to adopt an EMS in the vegetable PUs in the state of Zacatecas?
2. Factors that affect adoption of sustainable agricultural practices
As we have indicated, there is little literature on application and adoption of an EMS in agriculture. There is, however, a large body of studies related to the adoption of innovations and practices designed to reduce the environmental impact of agriculture (e.g. Ajayi, 2007; Blesh and Barrett, 2006; Kontogeorgos et al., 2015; Welsh and Rivers, 2011). These papers include debates over how views of the world and sustainability, or attitudinal variables, as well as the characteristics of the grower, influence decision-making and the environmental performance of the production unit (Welsh and Rivers, 2011).
To determine which variables correlate with adoption or acquisition of more awareness in the application of sustainable agricultural practices in a statistically significant way, based on previous theorization and statistical tests, researchers have regularly applied logistic regression models or probit (Feder et al., 1985; Knowler and Bradshaw, 2007). For example, Arellanes and Lee (2003) analysed the determiners of adopting minimum tillage in Honduras. Likewise, Ma et al. (2009), to explore factors that underlie the attitude of producers toward agricultural production and their environmental awareness, applied a model of logistic regression. The results revealed that age, education and agricultural economic efficiency were the three factors that affect the attitude of local producers toward agricultural production. Moreover, Kontogeorgos et al. (2015), using logistic regression, determined that farming experience, consumption of their own produce and recycling agrochemical containers defined the level of environmental conscientiousness of young producers in Central Macedonia, Greece.
Studies that seek the reasons for adopting or not adopting sustainable agricultural practices show that there are numerous independent variables that regularly explain adoption. However, as Knowler and Bradshaw (2007) state, there is not enough empirical evidence to conclude that there are universally significant variables that
http
://w
ww
.wag
enin
gena
cade
mic
.com
/doi
/10.
2243
4/IF
AM
R20
17.0
015
- T
uesd
ay, M
arch
20,
201
8 11
:30:
17 A
M -
Uni
vers
ity o
f M
inne
sota
- T
win
Citi
es I
P A
ddre
ss:1
34.8
4.17
.184

International Food and Agribusiness Management Review426
Padilla-Bernal et al. Volume 21, Issue 3, 2018
explain adoption of sustainable agricultural practices. To promote adoption of practices aimed to reduce the environmental impact of agriculture, focalized effort must be made in accord with the particular conditions of the growers and the region.
3. Materials and methods
To determine the probability that a PU adopt an integral program of care and protection of the environment, denominated EMS, a logistic regression model was used. The views of sustainability of the surveyed personnel and the drivers and barriers to adopting an EMS were evaluated with a principal components analysis (PCA). The production practices of the PUs oriented toward environmental management and care of natural resources were determined by calculating the environmental performance index (EPI), following the proposal of Carruthers (2005). The statistical analysis was done with SPSS v23 software.
3.1 Sources of information and determination of the sample
Using interviews with four technicians from vegetable PUs to identify their production and environmental protection practices, as well as a review of literature on sustainability and environmental management, a questionnaire was designed. The questionnaire was divided into five sections (Supplementary Table S1). The first poses questions relative to their views on sustainability. The second section enquires into the orientation of the PU toward environmental management and care of natural resources. The third section requests information on their strategies aimed at adoption of an EMS (barriers and drivers). In the first three sections, the responses are measured with a five-point Likert scale. Section four is called certification and adoption of an EMS. In this section there is one dichotomous question about the existence of certifications related to quality, food safety and environmental management and one open question about the type of certifications obtained by the PU. Also in this section, a dichotomous question is asked about the willingness of the PU to adopt an integral program of care and protection of the environment. Finally, section five contains questions about the PU and socioeconomic information of the interviewee. The questionnaire was given to technicians or owners of the PUs. The questionnaire was piloted in February 2015.
The number of producers or technicians to be interviewed was determined by obtaining a representative sample of the PUs that cultivate vegetables. The universe from which the sample was selected was the census of vegetable growers (chili, tomatoes and garlic) available in SAGARPA, Zacatecas Delegation, and associations of growers such as the Cluster de Agricultura Protegida, A.C. and the Sistema Producto Tomate. The sampling method was simple random (Mendenhal and Reinmuth, 1981). The sample was determined with a confidence level of 95%, a level of variability of 0.25 (considering a criterion of maximum variance and a level of precision of 7%). Considering a universe of 2,204 growers registered in the censuses (chili=1,749, tomato=278 and garlic=177) and adjusting with a finite population correction factor, the minimum sample was 180 questionnaires. During the period of March through July 2015, 207 questionnaires were applied, and of these, 202 were completely answered and useful for the study. The criteria for selection of the PUs to be surveyed were the following: (1) an area of ≥10 hectares of vegetable crops cultivated in the field or one hectare under protected agriculture; (2) agricultural activity reported in 2014; and (3) willingness of the owner or technician to respond to questions. The characteristics of the PUs surveyed are presented in Table 1.
3.2 Information processing
To determine the probability of adopting an EMS, a logistic regression model was used, applying the technique of maximum likelihood. The dependent variable, WEMS, is a binary variable equal to 1 if the PU is willing to adopt an EMS and 0 otherwise.
The independent, or explanatory, variables were classified in the following way: characteristics of the PU and interviewee, views on sustainability, environmental performance of the PU, and drivers and barriers to adopting an EMS. Some of the variables are observed and others were constructed through the following
http
://w
ww
.wag
enin
gena
cade
mic
.com
/doi
/10.
2243
4/IF
AM
R20
17.0
015
- T
uesd
ay, M
arch
20,
201
8 11
:30:
17 A
M -
Uni
vers
ity o
f M
inne
sota
- T
win
Citi
es I
P A
ddre
ss:1
34.8
4.17
.184

International Food and Agribusiness Management Review427
Padilla-Bernal et al. Volume 21, Issue 3, 2018
methodology. The characteristics of the PUs and the interviewees considered were market and level of education. These were processed as dichotomous variables (Table 2); the variable market took the value of 1 if the PU commercialized its produce on national and/or international markets and 0 if sold only in the local market. In the case of the variable education, 1 was given if the interviewee had a high school or higher (bachelor’s or graduate) education and 0 otherwise.
Table 1. Characteristics of the production units (PUs) surveyed. Characteristic Variable Quantity Percentage
Area cultivated in all of the PUs and method of cultivation
Field (ha) 8,568.8 95.4Protected agriculture (ha) 415.5 4.6Total (ha) 8,984.2 100.0
Method of cultivation in PU Only field cultivation 123 60.9Only protected agriculture 36 17.8Both field and protected agriculture 43 21.3
Type of market where they sell their produce
Local 76 37.6National 64 31.7Local, national 54 26.7Local, national and international 8 3.5
Certifications of the PU Some type of certification 37 18.3No certification 165 81.7
Interviewee level of education Elementary 38 18.8Secondary 44 21.8High school 31 15.3Bachelor´s degree 76 37.6Graduate degree 13 6.4
Gender of the interviewees Female 17 8.4Male 185 91.6
Table 2. Definition of variables and sample statistics. Factors Variable Definition Mean Standard
deviation
Willingness to adopt an Environmental management systems (EMS)
WEMS 1 if the production unit (PU) is willing to adopt a program of care and protection of the environment
0.866 0.341
Characteristics of PU and interviewees
Market 1 if PU sells its produce in domestic or international markets
0.624 0.486
Education 1 if interviewee has high school or higher education
0.594 0.492
Views on sustainability F1_RIO Driven by profitability; innovative and organizational
3.619 0.788
F2_societal Social 3.917 0.791F3_compliant Normative 4.010 0.803
PU environmental performance EPI Environmental performance index 6.528 1.691Motivators and barriers to EMS adoption
M1_internal Internal motivators 4.066 0.787B1_informa Barriers availability of resources
and information 3.883 0.812
B2_time Barriers availability of time 3.252 1.067
http
://w
ww
.wag
enin
gena
cade
mic
.com
/doi
/10.
2243
4/IF
AM
R20
17.0
015
- T
uesd
ay, M
arch
20,
201
8 11
:30:
17 A
M -
Uni
vers
ity o
f M
inne
sota
- T
win
Citi
es I
P A
ddre
ss:1
34.8
4.17
.184

International Food and Agribusiness Management Review428
Padilla-Bernal et al. Volume 21, Issue 3, 2018
Views on sustainability were determined by the responses to sixteen questions, adapting the proposals of Rankin et al. (2011) and Hauschildt and Schulze-Ehlers (2014). Interviewees were asked to respond to statements on a scale of 1 to 5: 1=don’t agree to 5=totally agree. For greater clarity and to reduce the variety of views on sustainability, the responses were subjected to a PCA with Varimax rotation. The PCA revealed three statistically significant factors. The criterion for preserving an indicator in a factor was factorial loads equal to or greater than 0.5, and for a factor, a Cronbach’s alpha coefficient greater than or equal to 0.70. The Cronbach’s alpha coefficient is a widely used measure of reliability. According to Curkovic (2003), this coefficient should have a value of 0.70 or higher for more precise constructs and of 0.55 to 0.69 for moderately broad constructs. Following the five levels of sustainability proposed by Rankin et al. (2011), the factors were denominated ‘driven by profitability, innovative and organizational’, ‘Social’ and ‘Normative’. These factors were converted into the variables F1_RIO, F2_societal and F3_compliant (Table 2).
In the same way, to determine the perception of drivers and barriers to EMS adoption, interviewees were asked to respond to seven questions in each case on a scale of 1 to 5, in which 1=not important to 5=highly important. To reduce the variety of drivers and barriers, the responses were also subjected to a PCA with Varimax rotation. The analysed indicators were obtained based on the proposals of Carruthers (2005); Carruthers and Vanclay (2012); Corbett et al. (2003); Grolleau et al. (2007); Massoud et al. (2010) and Merli et al. (2016). The PCA of the motivators resulted in two factors: ‘internal drivers’ and ‘competitiveness and compliance’. Because of Cronbach’s alpha coefficient obtained in the latter factor, it was excluded from the logistic regression model and only the variable M1_internal was retained (Table 2).
The PCA of the barriers to EMS adoption revealed two significant factors: ‘availability of resources and information’ and ‘availability of time’. The two factors were converted into the variables B1_informa and B2_ time (Table 2).
The level of environmental performance of the PU was obtained by calculating the variable EPI, based on Carruthers (2005). To this end, the interviewees self-evaluated by answering groups of questions (indicators) referring to the following variables: water, soil, biodiversity, agrochemicals, pollution, waste management, environmental management of the business. The response scale given was 1 to 5, where 1=does not apply or not done and 5=always applies or always done. The EPI by variable represents the relationship between the score of the level studied relative to the highest possible score. To make all of the scores comparable, the highest score considered was ten. The EPI was obtained as averages of the considered variables.
The linear model proposed for determining the factors that influence willingness to adopt an EMS is the following:
Y* = α + Σ4j=1βjXji + μi, i=1, 2, 3, …, N (1)
where X1i represents a vector of variables with characteristics of the PU and interviewees (dichotomous variables Market, Schooling), X2i presents the views on sustainability (F1_RIO, F2_societal, F3_compliant), X3i environmental performance of the PU (EPI) and X4i drivers and barriers to EMS adoption (M1_interno, B1_informa, B2_time). β1-β4 are the coefficients (vectors or scalers) to be estimated, α and μ are the intercept and error term, respectively. The interpretation of the latent variable in models of this type are the potential advantages of adopting an EMS, that is, the perceived difference between adopting and not adopting an EMS. The model is of discrete election with a dichotomous variable indicating the willingness to accept EMS adoption, as the dependent variable Yi:
Y = 1 yes Y* > 0,
Y = 0 otherwise
http
://w
ww
.wag
enin
gena
cade
mic
.com
/doi
/10.
2243
4/IF
AM
R20
17.0
015
- T
uesd
ay, M
arch
20,
201
8 11
:30:
17 A
M -
Uni
vers
ity o
f M
inne
sota
- T
win
Citi
es I
P A
ddre
ss:1
34.8
4.17
.184
International Food and Agribusiness Management Review429
Padilla-Bernal et al. Volume 21, Issue 3, 2018
4. Results and discussion
4.1 Views on sustainability in the production units
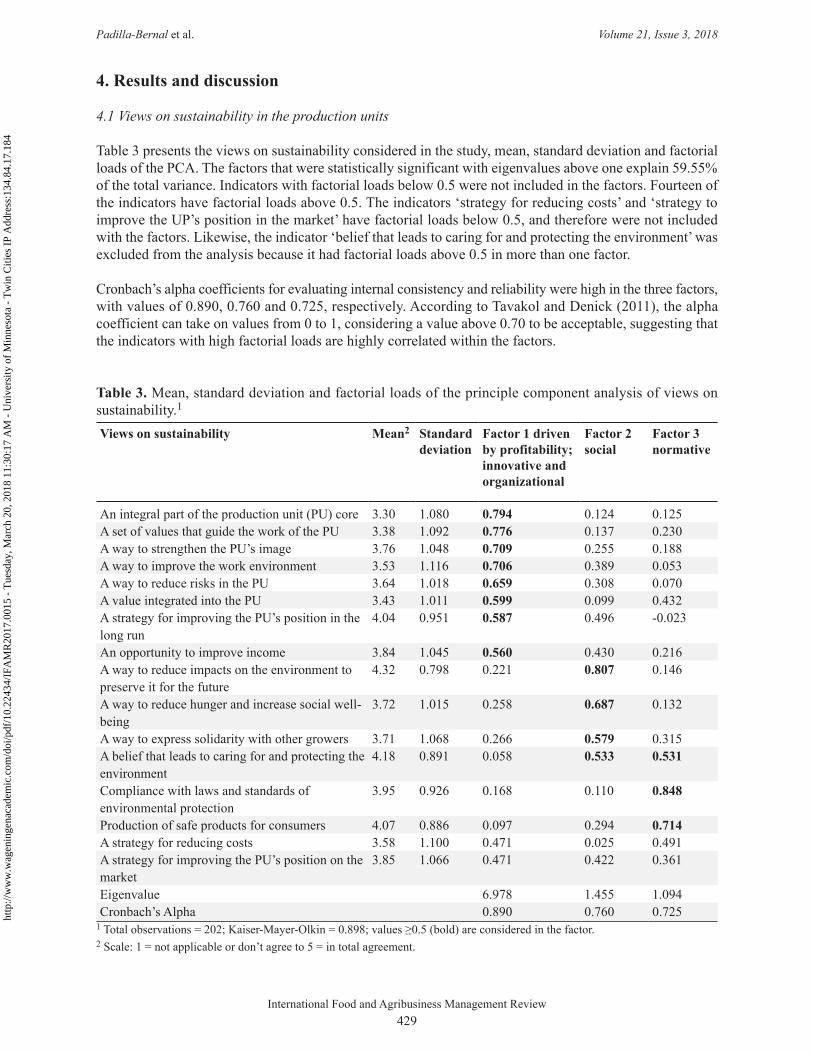
Table 3 presents the views on sustainability considered in the study, mean, standard deviation and factorial loads of the PCA. The factors that were statistically significant with eigenvalues above one explain 59.55% of the total variance. Indicators with factorial loads below 0.5 were not included in the factors. Fourteen of the indicators have factorial loads above 0.5. The indicators ‘strategy for reducing costs’ and ‘strategy to improve the UP’s position in the market’ have factorial loads below 0.5, and therefore were not included with the factors. Likewise, the indicator ‘belief that leads to caring for and protecting the environment’ was excluded from the analysis because it had factorial loads above 0.5 in more than one factor.
Cronbach’s alpha coefficients for evaluating internal consistency and reliability were high in the three factors, with values of 0.890, 0.760 and 0.725, respectively. According to Tavakol and Denick (2011), the alpha coefficient can take on values from 0 to 1, considering a value above 0.70 to be acceptable, suggesting that the indicators with high factorial loads are highly correlated within the factors.
Table 3. Mean, standard deviation and factorial loads of the principle component analysis of views on sustainability.1
Views on sustainability Mean2 Standard deviation
Factor 1 driven by profitability; innovative and organizational
Factor 2 social
Factor 3 normative
An integral part of the production unit (PU) core 3.30 1.080 0.794 0.124 0.125A set of values that guide the work of the PU 3.38 1.092 0.776 0.137 0.230A way to strengthen the PU’s image 3.76 1.048 0.709 0.255 0.188A way to improve the work environment 3.53 1.116 0.706 0.389 0.053A way to reduce risks in the PU 3.64 1.018 0.659 0.308 0.070A value integrated into the PU 3.43 1.011 0.599 0.099 0.432A strategy for improving the PU’s position in the long run
4.04 0.951 0.587 0.496 -0.023
An opportunity to improve income 3.84 1.045 0.560 0.430 0.216A way to reduce impacts on the environment to preserve it for the future
4.32 0.798 0.221 0.807 0.146
A way to reduce hunger and increase social well-being
3.72 1.015 0.258 0.687 0.132
A way to express solidarity with other growers 3.71 1.068 0.266 0.579 0.315A belief that leads to caring for and protecting the environment
4.18 0.891 0.058 0.533 0.531
Compliance with laws and standards of environmental protection
3.95 0.926 0.168 0.110 0.848
Production of safe products for consumers 4.07 0.886 0.097 0.294 0.714A strategy for reducing costs 3.58 1.100 0.471 0.025 0.491A strategy for improving the PU’s position on the market
3.85 1.066 0.471 0.422 0.361
Eigenvalue 6.978 1.455 1.094Cronbach’s Alpha 0.890 0.760 0.725
1 Total observations = 202; Kaiser-Mayer-Olkin = 0.898; values ≥0.5 (bold) are considered in the factor.2 Scale: 1 = not applicable or don’t agree to 5 = in total agreement.
http
://w
ww
.wag
enin
gena
cade
mic
.com
/doi
/10.
2243
4/IF
AM
R20
17.0
015
- T
uesd
ay, M
arch
20,
201
8 11
:30:
17 A
M -
Uni
vers
ity o
f M
inne
sota
- T
win
Citi
es I
P A
ddre
ss:1
34.8
4.17
.184

International Food and Agribusiness Management Review430
Padilla-Bernal et al. Volume 21, Issue 3, 2018
The PCA found similarities among the levels of organization sustainability proposed by Rankin et al. (2011). A factor was identified in which indicators are found that show that the PUs only perform actions in favour of the environment or society to comply with established laws and industrial standards (Level 1). Another factor includes indicators that comprise the aspects relative to what the authors define as ‘Driven by profitability; innovative and organizational’ (Levels 2, 3, and 4) and a third factor that considers indicators whose social aspects are of prime importance. It should be pointed out when asked the question about the importance of sustainability in the PU, 64.8% of the interviewees answered that it was important or very important. However, 12.4% said it was not important or had little importance.
4.2 Production practices oriented toward environmental management and care of natural resources
Regarding practices aimed toward production and care of the environment and carried out in the PUs studied, it was found that the activities that are most neglected are those related to the business’ environmental management (5.54), which include aspects such as designing formal environmental contingency plans, program for reducing solid and green waste, training program in environmental aspects for workers, use of technology that save water and energy, that is, actions that would lead to environmental management. Water is another of the variables that had one of the lowest values (5.99). To evaluate this variable, the following aspects were analysed: care to avoid polluting the aquifers, analysis of irrigation water, irrigation application efficiency and rainwater harvesting.
The variables biodiversity and agrochemicals, which represent conservation of the region’s flora and fauna, and use and handling of agrochemicals applied to the crops have higher average indexes (7.33 and 7.18) (Table 4). In the case of agrochemicals, the following was included: suitable storage of agrochemicals, efficient application of agrochemicals to crops, integrated pest management and use of only those agrochemicals authorized by regulating organisms. The high value obtained in the variable biodiversity is attributed to some growers’ awareness that prevents them from harming animals of the region and of the region’s scarce vegetation. The value obtained in the case of agrochemicals is mostly attributed to government divulgation programs that promote good use and handling of agrochemicals (BUMA) (SENASICA, 2014) and reducing pollution during their application – Sistema de Reducción de Riesgos de Contaminación de Producción Primaria de Vegetales (SRRC) (SENASICA, 2010).
By groups of PUs, classified by market type, the lowest index was obtained by the PUs that sell their produce only on the local market (5.78), while the highest (6.98) was for the group that sell their produce mostly on the national and/or international markets. The t test for equality of means showed that there are significant differences in the seven averages of the evaluated variables of environmental performance (water, soil, biodiversity, agrochemicals, pollution, waste management and business environmental management), as
Table 4. Environmental performance in the vegetable production units by market type.Variable Local Local, domestic and/
or internationalIndex
Mean Standard deviation
Mean Standard deviation
Mean Standard deviation
Water 5.44 1.72 6.32 1.64 5.99 1.72Soil 5.92 1.58 7.15 1.88 6.69 1.87Biodiversity 6.91 1.68 7.58 1.69 7.33 1.71Agrochemicals 6.06 2.19 7.85 1.91 7.18 2.19Pollution 6.04 2.00 7.30 1.92 6.82 2.04Waste management 5.13 2.41 6.74 2.53 6.13 2.60Business environmental management 4.89 2.30 5.93 2.09 5.54 2.22Environmental performance index 5.78 1.61 6.98 1.58 6.53 1.69
http
://w
ww
.wag
enin
gena
cade
mic
.com
/doi
/10.
2243
4/IF
AM
R20
17.0
015
- T
uesd
ay, M
arch
20,
201
8 11
:30:
17 A
M -
Uni
vers
ity o
f M
inne
sota
- T
win
Citi
es I
P A
ddre
ss:1
34.8
4.17
.184

International Food and Agribusiness Management Review431
Padilla-Bernal et al. Volume 21, Issue 3, 2018
well as in the EPI, between the PUs that are mostly oriented toward local markets and those that are oriented toward national and international markets (P<0.05), suggesting that the market in which the PUs sell their produce marks differences in their production practices and care of the environment.
It should be highlighted that 37 (18.3%) of the PUs studied have some type of certification related to safety or quality of their produce, environmental protection and/or well-being of their workers, such as PrimusLabs, Buenas Prácticas Agrícolas and BUMA. The other 165 (81.7%) have never been certified. In the group of certified PU there are eight that ship their produce to international markets.
4.3 Drivers and barriers to adopting an environmental management system
According to Carruthers and Vanclay (2012), EMS adoption is multi-dimensional, encompassing different factors, such as pressure from consumers and other actors of the value chain and the desire to improve performance and implement an integrated management system (Grolleau et al., 2007; Carruthers and Vanclay, 2012), among other aspects. Although it should be pointed out that factors change over time can vary in accord with individual circumstances and context.
Table 5 presents the factorial loads of the PCA, the mean and standard deviation of the seven drivers of EMS adoption analysed. Two factors resulted in eigenvalues above one: ‘Internal drivers’ and ‘competitiveness and compliance’, explaining 64.6% of the total variance. The seven indicators showed factorial loads above 0.5. The factor denominated ‘internal drivers’ had a Cronhach’s alpha coefficient above 0.7, while in the factor ‘competitiveness and compliance’, this coefficient was 0.629, and so, was excluded from later analyses.
The drivers the interviewees considered most important for adopting an EMS were that it facilitates access to national and international markets (4.51) and reduces production costs (4.38), followed by PU sustainability (4.21). These responses are congruent with the findings of Carruthers (2005); Carruthers and Vanclay (2012) and SAI Platform (2015) in that the market is a determining factor for application of good agricultural practices.
In terms of barriers to EMS adoption (Carruthers, 2005; Carruthers and Vanclay, 2012; Grolleau et al., 2007; Massoud et al., 2010; Merli et al., 2016; Williams et al., 2000), Table 6 presents the mean, standard deviation and two factors resulting from the PCA. These were denominated ‘availability of resources and information’ and ‘availability of time’ and had eigenvalues above one and Cronbach’s alpha coefficients above 0.7. They explained 62.2% of the variance. The factorial loads of all the indicators surpassed 0.5.
Table 5. Drivers to adopting an environmental management system.1
Drivers Mean2 Standard deviation
Factor 1 internal
Factor 2 competitiveness and compliance
Consistency with personal principles 3.92 0.989 0.896 0.116Prevent harm to workers 4.01 0.990 0.863 0.117Improve the production unit’s image 4.11 0.978 0.656 0.404Improve production unit sustainability 4.21 0.886 0.646 0.436Reduce production costs 4.38 0.902 0.041 0.807Facilitate access to national and international markets 4.51 0.806 0.251 0.746Compliance with norms for environmental protection 3.76 0.963 0.406 0.560Eigenvalue 3.515 1.011Cronbach’s alpha 0.835 0.629
1 Total observations = 202; Kaiser-Mayer-Olkin = 0.839; values ≥0.5 (bold) are considered in the factor.2 Scale: 1 = not important to 5 = highly important.
http
://w
ww
.wag
enin
gena
cade
mic
.com
/doi
/10.
2243
4/IF
AM
R20
17.0
015
- T
uesd
ay, M
arch
20,
201
8 11
:30:
17 A
M -
Uni
vers
ity o
f M
inne
sota
- T
win
Citi
es I
P A
ddre
ss:1
34.8
4.17
.184

International Food and Agribusiness Management Review432
Padilla-Bernal et al. Volume 21, Issue 3, 2018
Lack of government support (4.17) and additional expenses for monitoring, training, infrastructure and equipment (3.91) were the two indicators that, on average, the interviewees declared to be the most important barriers to EMS adoption. Another two barriers that had values above 3.70 were not knowing how to quantify environmental damage (3.84) and ignorance of environmental aspects and their management (3.78), similar to results found by Massoud et al. (2012). Regarding the indicators relative to information on environmental management, Carruthers and Vanclay (2012) point out that EMS users know more about their enterprise’s impacts and look for solutions more actively than non-users. The factor denominated ‘availability of time’ comprises the indicators ‘too much paperwork and documented requirements (3.26) and ‘lack of time for planning and implementing environmental actions’ (3.24).
The results obtained show that lack of financial resources and ignorance of environmental problems are the most important barriers to EMS adoption in the vegetable PUs of Zacatecas. Interviewees assigned more importance to these aspects than to time and work required by the application of activities related to environmental management. These results agree with Carruthers and Vanclay (2012), who consider that the costs, concerns for necessary skills, time and availability of resources are common barriers to EMS adoption and other agricultural practices.
4.4 Factors determining the probability of willingness of adopting an environmental management system
Table 7 presents the estimation results of the logistic regression model. To interpret the sensitivity of the willingness to accept EMS adoption relative to the explanatory variables, marginal effects are also reported. For the continuous independent variables, the marginal effects measure change in the estimated probability after an increase of one unit in the explanatory variable. In the case of discrete variables, the marginal effect is calculated as the difference between estimated probabilities and the sample means when the dummy variables take the value 1 and 0, respectively. The percentage of correct predictions was 95.0%. However, the percentage of correct predictions obtained with a model with only one intercept is 86.6%, which means that what is gained in the model conditioned by the explanatory variables is limited. The sensitivity, the proportion of observations correctly predicted as 1, and the specificity, the proportion of observations correctly
Table 6. Barriers to adopting an environmental management system.1
Barriers Mean2 Standard deviation
Factor 1 Availability of information and resources
Factor 2 Availability of time
Ignorance of environmental aspects and their management
3.78 1.122 0.820 0.161
Not knowing how to quantify environmental damage 3.84 1.086 0.775 0.018Additional expenses of monitoring, training, infrastructure and equipment
3.91 1.168 0.735 -0.076
No personnel in the production unit trained to carry out actions that contribute to protecting the environment
3.71 1.054 0.657 0.202
No government support 4.17 1.090 0.649 0.209Too much paperwork and documented requirements 3.26 1.187 0.105 0.885Lack of time for planning and implementing environmental actions
3.24 1.199 0.104 0.877
Eigenvalue 2.922 1.435Cronbach’s alpha 0.787 0.749
1 Total observations = 202; Kaiser-Mayer-Olkin = 0.723; values ≥0.5 (bold) are considered in the factor.2 Scale: 1 = not important to 5 = highly important.
http
://w
ww
.wag
enin
gena
cade
mic
.com
/doi
/10.
2243
4/IF
AM
R20
17.0
015
- T
uesd
ay, M
arch
20,
201
8 11
:30:
17 A
M -
Uni
vers
ity o
f M
inne
sota
- T
win
Citi
es I
P A
ddre
ss:1
34.8
4.17
.184

International Food and Agribusiness Management Review433
Padilla-Bernal et al. Volume 21, Issue 3, 2018
predicted as 0, are acceptable. The Cox and Snell R2 indicates that 41.1% of the variance of the dependent variable (WEMS) is explained by the explanatory variables.
The results of the model estimation showed that the statistically significant variables in WEMS were interviewee level of education (education), the social factor of views on sustainability (F2_societal), the EPI, and the barriers factor lack of resources and information (B1_informa). Significance of the variable Education shows that there is 6.96% higher probability that a PU accepts adopting an EMS if the technician or owner (interviewee) have high school or higher (bachelor’s or master’s) education than in PUs whose owners have lower levels of schooling. In a PU where there are technicians or owners with an opinion more oriented toward social aspects of sustainability, there is an increase of 8.77% in the probability of adopting an EMS for each unit of change in this factor (F2_societal). The likelihood that a PU adopt an EMS increases with improvements in production practices and care and protection of the environment. This is supported by the result of the variable EPI coefficient, which is positive and significant. The variable B1_informa (Barrier lack of availability of resources and information) resulted negative and statistically significant, meaning that the less the lack of financial resources and the less the ignorance of the environmental problems, the greater the probability that the PU adopt an EMS.
5. Conclusions and recommendations
Three factors summarize the growers’ views on sustainability: (1) profitability and innovative and organizational aspects of the PU; (2) social aspects; and (3) compliance with the norms relative to care and protection of the environment. Most of the growers believe that sustainability is important for their PU. However, when they self-evaluated the application of production practices oriented to care of natural resources and environmental management, the EPI showed that there is still much to improve in production and commercialization practices to achieve a more sustainable sector. This is more visible in the activities relative to care of water
Table 7. Estimation of the logistic regression model.Parameter Estimator Wald statistic Marginal effects
Intercept -15.0392 11.89 Market 0.4978 0.39 0.0195Education 1.7782 4.30 0.0696**
F1_RIO 0.0996 0.01 0.0039F2_societal 2.2432 7.84 0.0877***
F3_compliant 1.1864 3.16 0.0464EPI 1.2974 5.81 0.0507**
M1_internal 1.0110 1.84 0.0395B1_informa -1.8341 4.78 -0.0717**
B2_time 0.1973 0.20 0.0077Nagelkerke R2 0.754Cox and Snell R2 0.411Log likelihood -52.01Proof of likelihood χ2 (9) 106.880Correct predictions (percentage) 95.0Correct predictions with intercept 86.600Sensitivity (proportion of observations correctly predicted as 1) 97.7Specificity (proportion of observations correctly predicted as 0) 77.8Number of observations 202.0Number of observations that accept adoption of an integral program of care and protection of the environment 175
**, *** = level of significance of the parameter at 5 and 1%, respectively. Marginal effects are calculated based on the sample means.
http
://w
ww
.wag
enin
gena
cade
mic
.com
/doi
/10.
2243
4/IF
AM
R20
17.0
015
- T
uesd
ay, M
arch
20,
201
8 11
:30:
17 A
M -
Uni
vers
ity o
f M
inne
sota
- T
win
Citi
es I
P A
ddre
ss:1
34.8
4.17
.184

International Food and Agribusiness Management Review434
Padilla-Bernal et al. Volume 21, Issue 3, 2018
and establishment of formal strategies for environmental protection. However, it should be pointed out that when the PUs are more oriented toward national and international markets, there is a marked difference in EPI values, showing that the market is a determining factor in application of actions that lead to adoption of better agricultural practices and environmental performance of the PU.
Growers exhibited lack of information regarding what caring for and protecting the environment involves and how an EMS would be applied to agriculture. They are uncertain in terms of what the benefits and costs of its implementation would contribute to their PU. Aspects were reaffirmed in determining factors that impact the probability of willingness of adopting an EMS in vegetable PUs. Those aspects were level of education of the technician or owner of the PU, clear conviction of the importance of caring for and protecting natural resources for future generations and of increasing social well-being, application of agricultural practices oriented toward protection and care of the environment, ignorance of environmental problems, as well as lack of sufficient financial resources to deal with the situation. For this reason, we recommend promoting information on agriculture’s impacts on the environment and the benefits of the PU’s adopting more environment-friendly production practices. This can take two directions. On the one hand, adopting sustainable production practices and managing environmental impact should be promoted by providing information on the benefits of natural resource sustainability, and on the other, by divulging the advantages for the market and for the PU of having ‘greener’ production and contributing to care and protection of the environment.
Overcoming the barriers to EMS adoption is an important step prior to deciding its implementation. Having clear knowledge of the advantages of improving natural resource management to care for and protect the environment could contribute to reducing producers’ perceived barriers.
For a mechanism of voluntary adoption to be effective as an EMS in the agricultural sector, suitable incentives for participation should be considered in the design and implementation. That is, at the government level, a strategy could be developed around three fundamental axes. First, the design of an integral program of care and protection of the environment should consider management of the agricultural PUs’ impacts, recognize the heterogeneity of the producers, and prescribe the manner in which the program will be monitored. Second, economic incentives should be provided to the PUs that are involved in the program and show effective results. Third, extension services should be offered to facilitate the producers’ adoption of the program.
Supplementary material
Supplementary material can be found online at https://doi.org/10.22434/IFAMR2017.0015.
Table S1. Sections and questions included in the questionnaire.
References
Aigner, D.J., J. Hopkins and R. Johansson. 2003. Beyond compliance: sustainable business practices and the bottom line. American Journal of Agricultural Economics 85(5): 1126-1139.
Ajayi, O.C. 2007. User acceptability of sustainable soil fertility technologies: lessons from farmers’ knowledge, attitude and practice in Southern Africa. Journal of Sustainable Agriculture 28(3): 121-143.
Arellanes, P. and D. Lee. 2003. The determinants of adoption of sustainable agriculture technologies: evidence from the hillsides of Honduras. Proceedings of the 25th International Conference of Agricultural Economists. Available at: http://purl.umn.edu/25826.
Arora, S. and T. Cason. 1995. An experiment in voluntary environmental regulation: participation in EPA’s 33/50 program. Journal of Environmental Economics and Management 28(3): 271-286.
Blackman, A. 2008. Can voluntary environmental regulation work in developing countries? Lessons from case studies. Policy Studies Journal 36(1): 119-141.
Blesh, J.M. and G.W. Barrett. 2006. Farmers attitudes regarding agro landscape ecology: a regional comparison. Journal of Sustainable Agriculture 28(3): 121-143.
http
://w
ww
.wag
enin
gena
cade
mic
.com
/doi
/10.
2243
4/IF
AM
R20
17.0
015
- T
uesd
ay, M
arch
20,
201
8 11
:30:
17 A
M -
Uni
vers
ity o
f M
inne
sota
- T
win
Citi
es I
P A
ddre
ss:1
34.8
4.17
.184
International Food and Agribusiness Management Review435
Padilla-Bernal et al. Volume 21, Issue 3, 2018
Carruthers, G. 2005. Adoption of environmental management systems in agriculture. An analysis of 40 case studies. No. 05/032. RIRDC Australian Government, Canberra, Australia.
Carruthers, G. and F. Vanclay. 2012. The intrinsic features of environmental management systems that facilitate adoption and encourage innovation in primary industries. Journal of Environmental Management 110: 125-134.
Comisión Nacional del Agua (CNA). 2015. Disponibilidad de agua subterránea (DOF 20 de abril de 2015). Available at: https://tinyurl.com/y7kht24o.
Corbett, C., A. Luca and J.N. Pan. 2003. Global perspectives on global standards: a 15-economy survey of ISO 9000 and ISO 14000. ISO Management Systems, pp. 31-40. Available at: https://tinyurl.com/y7ze7jqc.
Curkovic, S. 2003. Environmentally responsible manufacturing: the development and validation of a measurement model. European Journal of Operational Research 146: 130-155.
Darnall, N. and S. Sides. 2008. Assessing the performance of voluntary environmental programs: does certification matter? The Policy Studies Journal 36(1): 95-117.
Del Brío, J.A. and B. Junquera. 2003. Influence of the perception of the external environmental pressures on obtaining the ISO 14001 standard in Spanish industrial companies. International Journal of Production Research 41(2): 337-348.
Feder, G., R. Just and D. Zilberman. 1985. Adoption of agricultural innovations in developing countries: a survey. Economic Development and Cultural Change 33(2): 255-298.
Food and Agriculture Organization of the United Nations (FAO). 2012a. Greening the economy with agriculture. In: Greening the economy with agriculture, edited by N. El-Hage Scialabba. FAO, Rome, Italy, pp. 2-6.
Food and Agriculture Organization of the United Nations (FAO). 2012b. Sustainability assessment of food and agriculture systems. Guidelines. (Test Version 1.0). Available at: https://tinyurl.com/y8szzrw4.
Food and Agriculture Organization of the United Nations (FAO). 2014. Sustainability assessment of food and agriculture systems. Guidelines. (Version 3). Available at: https://tinyurl.com/pl5jqqs.
García-Gutiérrez, C. and G.D. Rodríguez-Meza. 2012. Problemática y riesgo ambiental por el uso de plaguicidas en Sinaloa. Ra Ximhai 8(3): 1-10.
Grolleau, G., N. Mzoughi and A. Thomas. 2007. What drives agrifood firms to register for an Environmental Management System?. European Review of Agricultural Economics 34(2): 233-255.
Hartmann, M. 2011. Corporate social responsibility in the food sector. European Review of Agricultural Economics 38(3): 297-324.
Hauschildt, V. and B. Schulze-Ehlers. 2014. An empirical investigation into the adoption of green procurement practices in the German Food Service Industry. International Food and Agribusiness Management Review 17(3): 1-32.
Instituto Nacional de Estadística y Geografía (INEGI). 2009. VIII Censo agrícola, ganadero y forestal. Estados Unidos Mexicanos. Censo Agropecuario 2007, INEGI, Aguascalientes, Mexico.
Intertek Sustainability Solutions (ISS). 2009. Agriculture standards benchmark study 2009. Sustainable Agriculture Initiative (SAI) Platform. Available at: https://tinyurl.com/ycktl588.
Khanna, M. 2001. Non-mandatory approaches to environmental protection. Journal of Economic Surveys 15: 291-324
Knowler, D. and B. Bradshaw. 2007. Farmers’ adoption of conservation agriculture: a review and synthesis of recent research. Food policy 32: 25-48.
Kontogeorgos, A., M. Tsampra and F. Chatzitheodoridis. 2015. agricultural policy and the environment protection through the eyes of new farmers: evidence from a country of southeast Europe. Procedia Economics and Finance 19: 296-303.
Ma, Y., L. Chen, X. Zhao, H. Zheng and Y. Lü. 2009. What motivates farmers to participate in sustainable agriculture? Evidence and policy implications. International Journal of Sustainable Development and World Ecology 16(6): 374-380.
Massoud, M.A., R. Fayad, M. EI-Fadel and R. Kamleh. 2010. Drivers, barriers and incentives to implementing environmental management systems in the food industry: a case of Lebanon. Journal of Cleaner Production 18(3): 200-209.
http
://w
ww
.wag
enin
gena
cade
mic
.com
/doi
/10.
2243
4/IF
AM
R20
17.0
015
- T
uesd
ay, M
arch
20,
201
8 11
:30:
17 A
M -
Uni
vers
ity o
f M
inne
sota
- T
win
Citi
es I
P A
ddre
ss:1
34.8
4.17
.184
International Food and Agribusiness Management Review436
Padilla-Bernal et al. Volume 21, Issue 3, 2018
Mendenhall, W. and J. Reinmuth. 1981. Estadística para administración y economía. Wadsworth International/Iberoamericana, San Francisco, CA, USA.
Merli, R., M. Preziosi and C. Ippolito. 2016. Promoting sustainability through EMS application: a survey examining the critical factors about EMAS registration in Italian organizations. Sustainability 8(197): 1-14.
OCDE. 2008. Desempeño Ambiental la Agricultura desde 1990, OCDE, Paris, France.Rankin, A., A.W. Gray, M.D. Boehlje and C. Alexander. 2011. Sustainability strategies in U.S. agribusiness:
understanding key drivers, objectives, and actions. International Food and Agribusiness Management Review 14(4):1-20.
Raymond, R. 2012. Improving food systems for sustainable diets in a green economy, In: Greening the economy with agriculture, edited by N. El-Hage Scialabba. FAO, Rome, Italy, pp. 132-184.
Rezessy, S. and P. Bertoldi. 2011. Voluntary agreements in the field of energy efficiency and emission reduction: review and analysis of experiences in the European Union. Energy Policy 39(11): 7121-7129.
SAI Platform. 2015. Partnering with farmers towards sustainable agriculture: overcoming the hurdles and leveraging the drivers. Practitioners’ guide 2.0. Available at: https://tinyurl.com/ycycd7xq.
Secretaría de Medio Ambiente y Recursos Naturales (SEMARNAT). 2006. La gestión ambiental en México. SEMARNAT, Ciudad de México. C.P, Mexico.
Segerson, K. 2013. When is reliance on voluntary approaches in agriculture likely to be effective? Applied Economic Perspectives and Policy 35(4): 565-592.
Servicio Nacional de Sanidad, Inocuidad y Calidad Alimentaria (SENASICA). 2014. Buen Uso y Manejo de Agroquímicos. Available at: https://tinyurl.com/ybruosfx.
Servicio Nacional de Sanidad, Inocuidad y Calidad Alimentaria (SENASICA). 2010. Lineamientos generales para la operación y certificación de sistemas de reducción de riesgos de contaminación en la producción primaria de alimentos de origen agrícola. DGIAAP-SAGARPA, Ciudad de México, Mexico.
Servicios de Información Agroalimentaria y Pesquera (SIAP-SAGARPA). 2015. Producción anual. Available at: https://tinyurl.com/y8yfpbvc.
Tavakol, M and R. Dennick. 2011. Making sense of Cronbach’s alpha. International Journal of Medical Education 2: 53-55.
Videras, J. and A. Alberini. 2000. The appeal of voluntary environmental programs: which firms participate and why? Contemporary Economic Policy 18(4): 449-461.
Welsh, R. and R.Y. Rivers. 2011. Environmental management strategies in agriculture. Agriculture and Human Values 28(3): 297-302.
Williams, T. 2009. Environmental management in agriculture and the rural industries: voluntary approaches to sustainability and globalization imperatives. RIRDC. No. 09/023. Australian Government. Union Offset Printing, Canberra, Australia.
Williams, H., A. van Hooydonk. P. Dingle and D. Annandale. 2000. Developing tailored environmental management systems for small businesses. Eco-management and Auditing 7(3): 106-113.
http
://w
ww
.wag
enin
gena
cade
mic
.com
/doi
/10.
2243
4/IF
AM
R20
17.0
015
- T
uesd
ay, M
arch
20,
201
8 11
:30:
17 A
M -
Uni
vers
ity o
f M
inne
sota
- T
win
Citi
es I
P A
ddre
ss:1
34.8
4.17
.184