Embed Size (px)
Citation preview

Summary
The Annual Residents’ Survey is designed to
collect data on resident perceptions about the
Council, local services and the area. The survey
captures the views of 1,100 Tower Hamlets
residents and the results were recently
published on the Council’s website.
This briefing analyses the results in more detail
and explores how the views of residents vary by
social grade. Key findings include:
Views about services, and views about
different aspects of the Council’s image,
showed very little variation by social grade.
However, overall satisfaction with the Council
was lower among residents from social grade
DE: 62 vs. 71 per cent (average).
DE residents were also a bit less likely than
average to feel the Council was open and
transparent about its activities (44 vs. 52 per
cent). However, the proportion who said they
trusted the Council was similar across all
social grades (all had trust ratings close to
the average of 72 per cent).
DE residents were more likely than AB
residents to have contacted the Council over
the last year (78 vs. 65 per cent), but less
likely to say that they had found that contact
easy (76 vs. 89 per cent).
AB residents expressed a far stronger
preference for online methods of contact with
the Council than DE residents, while C2 and
DE residents were more likely to prefer
telephone contact. DE residents were the
most likely to express a preference for
visiting Council offices in person (23 per
cent).
Consistent with contact preferences, internet
access varies significantly by social grade:
99 per cent of AB residents had access to
the internet compared with only 79 per cent
of DE residents.
AB internet users were more likely than DE
users to use the internet for transactional
purposes. For example, 77 per cent of AB
internet users did internet banking compared
with only 44 per cent of DE users.
There was a mixed picture in relation to
views about the area by social grade. On the
one hand, DE residents were significantly
less likely than average to feel they could
influence decisions in their local area (36 vs.
49 per cent). However, area satisfaction
levels and cohesion ratings showed little
variation by social grade, and were positive
across all groups.
Concerns about drug use and rubbish/litter in
the local area were similar across social
grades, though views varied on the issues of
drunkenness and vandalism - C2 residents
were more likely than average to be
concerned about these issues while AB
residents had lower levels of concern.
Tower Hamlets Annual Residents’ Survey 2016
Topic report: Views by social grade
Contents
About the Survey ........................................ 2
Interpretation of survey data ....................... 2
What is social grade? ................................. 3
Characteristics by social grade ................... 4
Image of the Council ................................... 5
Service ratings ............................................ 6
Council satisfaction ..................................... 6
Transparency and Trust .............................. 6
Contact with the Council ............................. 7
Preferred ways to get information ............... 8
Internet access and use .............................. 9
Concerns and worries ............................... 10
Cohesion and the area ............................. 10
Influencing decisions ................................ 11
Concerns about anti-social behaviour ....... 12
Further information ................................... 12
Appendix: Data table ................................ 13

Tower Hamlets Annual Residents’ Survey 2016: Views by social grade
Page 2
About the Survey
The Annual Residents’ Survey is designed to collect data on resident perceptions about
the Council, local services and the area. The questions are closely tied to service
priorities and are designed to provide context for policy development, service delivery
and review. The main topics covered are:
Views about the image of the
Council;
Transparency and trust;
Satisfaction with services;
Contact with the Council;
Personal concerns and worries;
Views about anti-social behaviour;
Satisfaction with the local area;
Cohesion and engagement;
Demographic data.
The survey was carried out by an independent market research company - Westco
Trading - on behalf of the Council, and comprised 1,100 face to face interviews during
January to March 2016. The methodology was designed to ensure that the sample
drawn is representative of the borough’s population generally. Residents were
interviewed at 140 different sample points across the borough and sampling quotas
were set on age, gender, ethnicity and working status to ensure that the sample
reflected the characteristics of the population.
A summary of the main survey results can be found on the Council’s website:
http://www.towerhamlets.gov.uk/lgnl/council_and_democracy/consultations/annual_resid
ents_survey.aspx
This briefing is one of a series of topic reports that analyse the results in more detail.
The analysis explores how the views of residents from different social grades vary
across survey topics.
Interpretation of survey data
All figures presented are survey estimates, not precise measures, and as such, they
have a degree of sampling variability attached to them. The concept of ‘statistical
significance’ is used here to highlight those differences that are likely to reflect ‘real’
differences between groups, as opposed to those which may be reflecting sampling
volatility.
Confidence intervals attached to individual survey estimates for social class groups can
be quite wide, often in the region of ± 4 to 6 percentage points. Furthermore, for findings
for a particular social grade population to be ‘significantly’ different to the average, the
difference between the two percentages often needs to be in the region of 6 points or
more (though this does vary depending on the comparison in question).
However, even when a highlighted difference is statistically significant, it may be only
just be within the bounds of significance, so some caution is required on interpretation of
findings based on survey data. Generally speaking, the larger the percentage point
differences, the more confident we can be that the difference is reflecting reality.
All figures presented are rounded to the nearest percentage point.

Tower Hamlets Annual Residents’ Survey 2016: Views by social grade
Page 3
What is social grade?
Social grade is a socio-economic classification system based on occupation and it
enables a household to be classified according to the current (or previous) occupation of
the Chief Income Earner. Data are also collected about those who have retired, and
about households with no one in work. The classification used here is based on the
Market Research Society classification system (Table 1).
Social grade was collected for 99 per cent of all respondents in the survey (1,089 out of
1,100). For analytical purposes, some groups have been combined to boost sample
numbers and four groups are compared throughout this report (AB, C1, C2 and DE).
Social grade provides a proxy for likely household income as social grade AB
households are typically those on higher incomes while those in social grade DE
households are typically those on lower incomes.
Table 1: Social grade groups (market research classification system)
Groups used for
analysis and
sample size
A High managerial, administrative or professional
AB 267
(24%)
Professional people, very senior managers in business or commerce or top
civil servants. Retired people, previously grade A, and their widows.
B Intermediate managerial, administrative or professional
Middle management executives in large organisations, with appropriate
qualifications. Principal officers in local government and civil service.
Top management, owners of small business concerns, educational &
service establishments.
Retired people, previously grade B, and their widows.
C1 Supervisory, clerical and junior managerial, administrative or
professional
C1 346
(31%)
Junior management, owners of small establishments, and all others in non-
manual positions. Jobs in this group have very varied responsibilities and
educational requirements.
Retired people, previously grade C1, and their widows.
C2 Skilled manual workers
C2 208
(19%)
All skilled manual workers, and those manual workers with responsibility
for other people.
Retired people, previously grade C2, with pensions from their job.
Widows, if receiving pensions from their late husband's job.
D Semi and unskilled manual workers
DE 268
(24%)
All semi-skilled and un-skilled manual workers, apprentices and trainees to
skilled workers.
Retired people, previously grade D, with pensions from their job.
Widows, if receiving a pension from their late husband's job.
E State pensioners, casual workers, long term unemployed/workless
Those entirely dependent on the state long-term, through sickness,
unemployment, old age or other reasons.
Those unemployed for more than six months (otherwise classified on
previous occupation).
Casual workers and those without a regular income.
Households without a Chief Income Earner.

Tower Hamlets Annual Residents’ Survey 2016: Views by social grade
Page 4
Characteristics by social grade
The demographic and socio-economic profile of different social grade populations in the
borough are quite different, and this is reflected in the survey samples being compared
(figure 1). Key differences1 include:
Age: Social grade DE respondents have an older age structure than those from AB
households: 21 per cent of DE respondents were aged over 60 or over, compared
with only 6 per cent of AB households. Conversely, AB and C1 respondents were
more likely to be young adults aged 18-34 (58 and 63 per cent).
Ethnicity: C2 and DE respondents were far more likely to be from BME (Black and
Minority Ethnic) groups compared with AB and C1 respondents. Around two thirds of
C2DE respondents were from BME groups compared with 36 per cent of AB
respondents and 55 per cent of C1 respondents.
Housing tenure: DE and C2 households were far more likely to be living in social
housing (69 and 58 per cent) compared with only 32 per cent of C1 households and
13 per cent of AB households.
Employment: DE respondents were the least likely to be in employment (32 per
cent), while AB respondents were the most likely (86 per cent). Around two thirds of
those living in C1 and C2 households were in work (71 and 65 per cent).
Length of residence: DE respondents are the most likely to be well established residents, while AB respondents are more likely to be newer to the borough: two thirds of DE residents had lived in the borough for ten years or more compared with only 39 per cent of AB residents.
1 All differences highlighted are statistically significant.

Tower Hamlets Annual Residents’ Survey 2016: Views by social grade
Page 5
Image of the Council
Residents were asked about 12 different aspects of the Council’s image (table 2).
There was little significant variation in views by social grade. The one exception was that
respondents from social grade C2 were more likely than average to agree with the
statement ‘My Council provides good value for money for the council tax I pay’ (68 vs. 60
per cent).
Table 2. Views about the Image of the Council by social grade, Tower Hamlets, 2016
Social grade
All AB C1 C2 DE
Image of the Council: % agree with statement a great deal/to some extent
My Council:
Is making the local area a better place for people to live 77 75 77 79 76
Has staff who are friendly and polite 75 76 77 74 72
Is doing a good job 72 73 73 72 68
Keeps residents informed about what they are doing 71 75 72 70 66
Is efficient and well run 67 67 67 68 65
Is doing a better job now than one year ago 61 58 62 63 61
Provides good value for money for the council tax I pay 60 61 60 68 54
Listens to concerns of local residents 57 54 57 61 55
Involves residents when making decisions 55 55 55 58 53
Responds quickly when asked for help 55 54 54 60 56
Is difficult to get through to on the phone 49 44 50 53 49
Doesn't do enough for people like me 49 46 47 53 53
Sample size
267 346 208 268 Source: Tower Hamlets Annual Residents Survey, 2016 (Westco Trading) Notes: Shaded figures in bold are significantly different to average (and other groups).
Table 3. Views about services by social grade, Tower Hamlets, 2016
Social grade
All AB C1 C2 DE
Service ratings (views of all residents): % rating service as good, very good, excellent
Public transport 80 80 77 82 82
Street lighting 78 80 75 79 79
Refuse collection 70 73 68 70 70
Street cleaning 70 68 70 74 71
Parks and open spaces 69 75 67 71 66
Local health services 69 69 63 70 75
Recycling facilities 66 68 65 66 66
Libraries/IDEA stores 62 66 59 64 62
Leisure and sports facilities 61 63 61 63 60
Policing 59 60 60 59 58
Repair of roads and pavements 58 62 56 52 62
Collection of council tax 57 63 55 54 58
Parking services 42 46 41 45 37
Sample size
267 346 208 268
Source: Tower Hamlets Annual Residents Survey, 2016 (Westco Trading)
Notes: Shaded figures in bold are significantly different to average (and other groups).

Tower Hamlets Annual Residents’ Survey 2016: Views by social grade
Page 6
Service ratings
Table 3 compares service ratings across 13 different service areas by social grade.
Ratings relate to the views of all residents regardless of whether they use the service or
not. For most services (12 out of 13), there was no significant variation in views by social
grade. The only exception was in relation to views about local health services: social
grade DE respondents were more likely than average to rate health services positively
(75 vs. 69 per cent). This may reflect the slightly older age profile of the social grade DE
population, as older people tend to rate health services a bit more highly.
Council satisfaction
After being asked about individual services, residents were then asked ‘Taking
everything into account, how satisfied or dissatisfied are you with the way Tower
Hamlets Council runs things?’ In response, over two thirds (71 per cent) said they were
very or fairly satisfied with the Council. Those from social grade DE were the least
positive – with only 62 per cent saying they were satisfied, while those from social grade
C2 were more positive than average (78 per cent) (figure 2).
Transparency and Trust
DE respondents were also the least likely to agree that the Council was open and
transparent about its activities (44 per cent cent), while all other groups had agreement
levels of more than half.
However, on the issue of trust there was no significant variation in views by social grade:
72 per cent of respondents said they trusted the Council a great deal or a fair amount,
and all groups had trust levels close to the average.

Tower Hamlets Annual Residents’ Survey 2016: Views by social grade
Page 7
Contact with the Council
Almost three quarters (72 per cent) of those
sampled had contacted the Council in the last
year.
This varies by social grade, with DE
households being most likely to have been in
contact with the Council and AB households
being the least likely (78 vs. 65 per cent).
Of those that made contact, most said it had
been very, or fairly, easy (83 per cent). AB
households were the most likely to find
contact easy (89 per cent), while DE
households were the least likely (76 per cent).
Table 4
Current method of contact
The way residents contact the Council varies significantly by social grade. AB
respondents were far more likely than other groups to use online methods. For example,
39 per cent of AB residents had used email to contact the Council compared with 14 per
cent of DE residents.
While telephone contact remains the most popular method of contact for all groups, AB
households were less likely than average to have made contact by phone (68 per cent
vs. 77 per cent). This reflects a lower level of landline telephone use (43 per cent vs. 54
per cent) as levels of mobile use were fairly similar across groups.
Table 4. Contact with the Council by social grade, Tower Hamlets, 2016
Social grade
All
AB C1 C2 DE
% total
How easy did you find it to contact the council? (base: those who had contacted Council)
Very/fairly easy 83 89 82 87 76
Not very easy/not at all easy 16 10 17 13 23
Don't know 1
2 1 0 1
Which method (s) did you use? (base: those who contacted the Council)
Telephone - any (landline and/or mobile) 77
68 80 84 79
Telephone - landline 54
43 53 66 60
Telephone - mobile 32
31 35 27 31
Email 23
39 21 17 14
Council website 16
26 16 12 8
Visit to a council office 12
6 8 12 23
Letter 11
5 10 13 15 Source: Tower Hamlets Annual Residents Survey, 2016 (Westco Trading) Notes: Shaded figures are significantly different to average and other groups.

Tower Hamlets Annual Residents’ Survey 2016: Views by social grade
Page 8
Future contact
Respondents were also asked how they would like to contact the Council in the future,
and similar patterns emerge. AB residents expressed a stronger preference for online
contact compared with other groups, while DE residents were the least likely to prefer
online methods (figure 4). For example, AB residents were more than three times as
likely as DE residents to express a preference for email contact (49 vs. 14 per cent).
DE and C2 households were far more likely than AB households to prefer telephone
contact. Again, this reflects stronger preference for contact via a landline telephone as
mobile preferences were similar.
DE residents were the only group to express any significant preference for visiting the
Council offices in person (23 per cent).
Preferred ways to get information2 Residents were asked how they would prefer to receive information about the Council
and its services, and again, similar patterns emerge with AB residents having a stronger
preference for online sources: AB residents were twice as likely as DE residents to say
they would like to get information via the Council’s website (57 vs. 28 per cent), while DE
residents had a stronger preference for printed information compared with other groups
(36 per cent vs. 23 per cent on average).
2 Question wording: Thinking about ways you get information about the Council, which of these
sources of information would you prefer to use to find out about Tower Hamlets Council and the services it provides?

Tower Hamlets Annual Residents’ Survey 2016: Views by social grade
Page 9
Internet access and use
Contact preferences may, in part, reflect levels of
internet access across social grades, as well as
differences in how extensively groups use the
internet for different purposes.
The vast majority of AB and C1 respondents had
access to the internet (99 and 97 per cent),
compared with only 79 per cent of DE households
(figure 5).
The lower level of internet access among DE
respondents may, in part, reflect the older age
structure of this group, as internet access is
strongly related to age.
Analysis of how residents access the internet, and
what they use it for, also reveals significant differences between social grades –
particularly between AB and DE internet users (figure 6).
AB internet users were more likely than DE users to access the internet on various
platforms. For example, 78 per cent of AB users accessed the internet via a laptop
compared with 55 per cent of DE users. AB residents were also more likely than DE
users to be tablet users (57 vs. 25 per cent). While use of a smartphone to access the
internet was popular across all groups, it was a bit lower among DE internet users (71
per cent vs. 83 per cent on average).

Tower Hamlets Annual Residents’ Survey 2016: Views by social grade
Page 10
Internet users from social grade AB were also more DE residents to use the internet for
a wider range of purposes. Differences in usage were particularly wide in relation to
using the internet for transactional purposes. For example, 77 per cent of AB internet
users said they did internet banking, compared with only 44 per cent of DE users.
Similarly, AB users were twice as likely as DE users to say they had paid for Council
services online (49 vs. 23 per cent).
Appendix table A1 provides more detail on internet use for all social grade populations.
Concerns and worries
AB residents were less likely than average to rate crime or a lack of jobs as one of their
top concerns, but were more likely than other groups to worry about pollution of the
environment. In contrast, DE residents were the least likely to cite pollution as one of
their top concerns, and also less likely than average to be worried about the quality of
the health service or the level of council tax (table 5).
AB residents were less likely than other groups to say they were worried about the
impact of public spending cuts (51 vs. 60 per cent)3.
Table 5. Concerns and worries by social grade, Tower Hamlets, 2016
Social grade
All
AB C1 C2 DE
% total
Top personal concerns: % citing concern as one of their top 3 personal concerns
Crime 39 32 43 45 37
Lack of affordable housing 32 35 34 32 27
Litter\dirt in streets 30 30 32 31 25
Lack of jobs 20 11 22 25 22
Traffic congestion 17 18 18 19 14
Quality of health service 17 19 20 14 12
Level of council tax 16 20 16 16 11
Pollution of the environment 14 22 14 11 7
Number of homeless people 11 9 15 11 9
Worries about being impacted by cuts in spending on public services
Very/fairly worried 60 51 64 61 64 Source: Tower Hamlets Annual Residents Survey, 2016 (Westco Trading) Notes: Shaded figures are significantly different to average & other groups.
Cohesion and the area
When it comes to views about cohesion and satisfaction with the local area, views were
similar across social grades (figure 7):
Cohesion: On average, 87 per cent of residents agreed with the statement: ‘this local
area is a place where people from different backgrounds get on well together’.
Ratings across social grades were all close to the average (between 85-89 per cent).
3 Question wording was: Thinking about the next year, how worried are you that you or your family will
suffer directly from cuts in spending on public services such as health, education or welfare benefits?

Tower Hamlets Annual Residents’ Survey 2016: Views by social grade
Page 11
Area satisfaction: Similarly, the majority of residents said they were very, or fairly,
satisfied with the area as a place to live (83 per cent), and again ratings across all
social grades were fairly close to the average.
Influencing decisions
However, there were significant differences in views about the extent to which people
felt they could influence decisions affecting their local area. DE residents were the least
likely to feel they could influence decisions on their local area while those from social
grade C2 were the most likely to agree (36 vs. 59 per cent).

Tower Hamlets Annual Residents’ Survey 2016: Views by social grade
Page 12
Concerns about anti-social behaviour
Residents were asked to say whether they felt different anti-social behaviour (ASB)
issues were a big problem in their local area (figure 8).
Worries about rubbish/litter lying around and the problem of drug use or dealing topped
the list of issues residents were most concerned about. On both these issues, around
half of those surveyed felt these issues were a very, or fairly, big problem in their area
(48 and 51 per cent respectively) and views were similar across all four social grades.
However, perceptions in relation to drunkenness and vandalism did show some variation
by social grade:
The issue of ‘people being drunk or rowdy in public places’ was seen as a big
problem by 39 per cent of those surveyed – concern was higher among C1 residents
households (45 per cent) and lower among AB residents (31 per cent).
Similarly, C1 residents were the most likely to see vandalism, graffiti, and deliberate
damage to property or vehicles as a big problem in their area (40 per cent) while AB
residents were the least likely to see it as a big problem (27 per cent).
Success in dealing with ASB
Views about the extent to which services were successfully dealing with ASB were
similar across social grades. Over half of those surveyed (56 per cent) agreed that police
and other local public services were successfully dealing with ASB issues in their local
area – ratings by social grade were all close to the average (53-59 per cent).
Appendix table A1 summarises views by social grade across all topics.
Further information
This briefing was produced by the Council’s Corporate Strategy and Equality Service. The
main Annual Residents Survey results for 2016, and for previous years, can be found on
the Council’s website:
http://www.towerhamlets.gov.uk/lgsl/851-
900/867_consultation/annual_residents_survey.aspx
For queries about the survey, please contact the Council’s Corporate Research Unit

Appendix: Data tables
Source: Tower Hamlets Annual Residents’ Survey (Westco Trading)
Notes: Sample size = 1,100: AB (267); C1 (346); C2 (208); DE (268); 11 unknown.
Shaded figures in bold are significantly different to the average (and one or more of the other
groups) ie differences are statistically significant.
Page 13
Table A1. Tower Hamlets Annual Residents' Survey: views compared by social
grade, 2016 Appendix: Data table
Shaded figures = significantly different from the average (total)
Total AB C1 C2 DE
% totals
Image of the Council statements (% agree with statement a great deal/to some extent)
'My council is…':
Making the local area a better place for people to live 77 75 77 79 76
Has staff who are friendly and polite 75 76 77 74 72
Is doing a good job 72 73 73 72 68
Keeps residents informed about what they are doing 71 75 72 70 66
Is efficient and well run 67 67 67 68 65
Is doing a better job now than one year ago 61 58 62 63 61
Provides good value for money for the council tax I pay 60 61 60 68 54
Listens to concerns of local residents 57 54 57 61 55
Involves residents when making decisions 55 55 55 58 53
Responds quickly when asked for help 55 54 54 60 56
Is difficult to get through to on the phone 49 44 50 53 49
Doesn't do enough for people like me 49 46 47 53 53
Service ratings (views of all residents): % rating service as good, very good, excellent
Public transport 80 80 77 82 82
Street lighting 78 80 75 79 79
Refuse collection 70 73 68 70 70
Street cleaning 70 68 70 74 71
Parks and open spaces 69 75 67 71 66
Local health services 69 69 63 70 75
Recycling facilities 66 68 65 66 66
Libraries/IDEA stores 62 66 59 64 62
Leisure and sports facilities 61 63 61 63 60
Policing 59 60 60 59 58
Repair of roads and pavements 58 62 56 52 62
Collection of council tax 57 63 55 54 58
Parking services 42 46 41 45 37
Overall satisfaction: Taking everything into account, how satisfied or dissatisfied are you with the way Tower Hamlets runs things?
Very/fairly satisfied 71 71 73 78 62
To what extent do you agree or disagree that Tower Hamlets Council is open and transparent about its activities?
Definitely/tend to agree 52 52 56 53 44

Appendix: Data tables
Source: Tower Hamlets Annual Residents’ Survey (Westco Trading)
Notes: Sample size = 1,100: AB (267); C1 (346); C2 (208); DE (268); 11 unknown.
Shaded figures in bold are significantly different to the average (and one or more of the other
groups) ie differences are statistically significant.
Page 14
Table A1. Tower Hamlets Annual Residents' Survey: views compared by social
grade, 2016 Appendix: Data table
Shaded figures = significantly different from the average (total)
Total AB C1 C2 DE
% totals
How much do you trust Tower Hamlets Council?
Trust (a great deal/a fair amount) 72 74 72 74 69
How easy did you find it to contact the council? (base: those who had contacted Council in last year)
Very/fairly easy 83 89 82 87 76
Not very easy/not at all easy 16 10 17 13 23
Don't know 1 2 1 0 1
Contact with the Council in the past year
Have contacted the Council 72 65 73 74 78
Have not contacted the Council 28 35 27 26 22
If you have contacted the Council in the last year, which method (s) did you use (Note: only methods used by 2% or more of the population listed. Multiple response possible)
Telephone - any (landline and/or mobile) 56 44 59 62 61
Telephone - landline 39 28 38 49 47
Telephone - mobile 23 20 26 20 24
Email 16 26 15 13 11
Council website 11 17 11 9 7
Visit to a council office 9 4 6 9 18
Letter 8 3 7 9 12
Haven't contacted the Council in the past year 28 35 27 26 22
If you have contacted the Council in the last year, which method (s) did you use (Note: only methods used by 2% or more of the population listed. Multiple response possible)
Percentages (base: all those who had contacted the Council over the last year)
Telephone - any (landline and/or mobile) 77 68 80 84 79
Telephone - landline 54 43 53 66 60
Telephone - mobile 32 31 35 27 31
Email 23 39 21 17 14
Council website 16 26 16 12 8
Visit to a council office 12 6 8 12 23
Letter 11 5 10 13 15
Appendix: Data tables
Source: Tower Hamlets Annual Residents’ Survey (Westco Trading)
Notes: Sample size = 1,100: AB (267); C1 (346); C2 (208); DE (268); 11 unknown.
Shaded figures in bold are significantly different to the average (and one or more of the other
groups) ie differences are statistically significant.
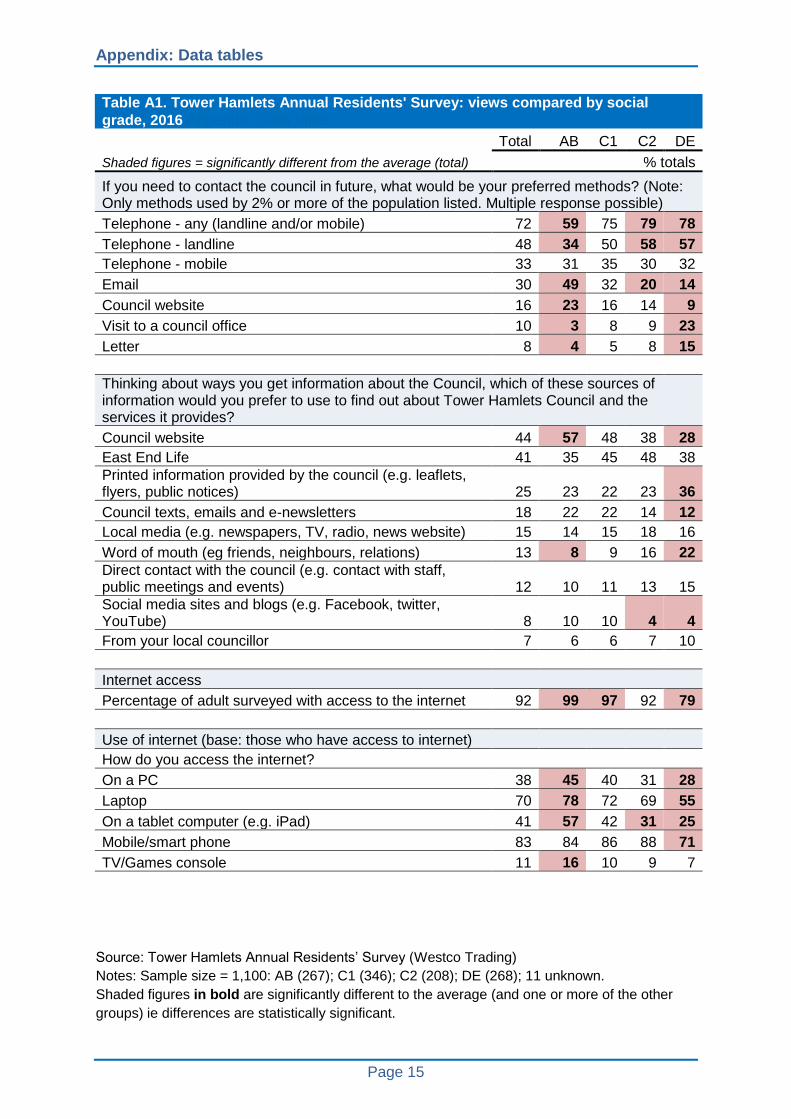
Page 15
Table A1. Tower Hamlets Annual Residents' Survey: views compared by social
grade, 2016 Appendix: Data table
Shaded figures = significantly different from the average (total)
Total AB C1 C2 DE
% totals
If you need to contact the council in future, what would be your preferred methods? (Note: Only methods used by 2% or more of the population listed. Multiple response possible)
Telephone - any (landline and/or mobile) 72 59 75 79 78
Telephone - landline 48 34 50 58 57
Telephone - mobile 33 31 35 30 32
Email 30 49 32 20 14
Council website 16 23 16 14 9
Visit to a council office 10 3 8 9 23
Letter 8 4 5 8 15
Thinking about ways you get information about the Council, which of these sources of information would you prefer to use to find out about Tower Hamlets Council and the services it provides?
Council website 44 57 48 38 28
East End Life 41 35 45 48 38
Printed information provided by the council (e.g. leaflets, flyers, public notices) 25 23 22 23 36
Council texts, emails and e-newsletters 18 22 22 14 12
Local media (e.g. newspapers, TV, radio, news website) 15 14 15 18 16
Word of mouth (eg friends, neighbours, relations) 13 8 9 16 22
Direct contact with the council (e.g. contact with staff, public meetings and events) 12 10 11 13 15
Social media sites and blogs (e.g. Facebook, twitter, YouTube) 8 10 10 4 4
From your local councillor 7 6 6 7 10
Internet access
Percentage of adult surveyed with access to the internet 92 99 97 92 79
Use of internet (base: those who have access to internet)
How do you access the internet?
On a PC 38 45 40 31 28
Laptop 70 78 72 69 55
On a tablet computer (e.g. iPad) 41 57 42 31 25
Mobile/smart phone 83 84 86 88 71
TV/Games console 11 16 10 9 7

Appendix: Data tables
Source: Tower Hamlets Annual Residents’ Survey (Westco Trading)
Notes: Sample size = 1,100: AB (267); C1 (346); C2 (208); DE (268); 11 unknown.
Shaded figures in bold are significantly different to the average (and one or more of the other
groups) ie differences are statistically significant.
Page 16
Table A1. Tower Hamlets Annual Residents' Survey: views compared by social
grade, 2016 Appendix: Data table
Shaded figures = significantly different from the average (total)
Total AB C1 C2 DE
% totals
What do you use the internet for?
Emails 81 88 85 80 67
Browsing for information about goods and services 64 71 66 61 55
Buying or selling goods and services online 57 67 60 58 40
Online news, newspapers or magazines 52 65 54 44 40
Internet banking 68 77 72 75 44
Playing or downloading games, films or music 42 51 42 36 37
Telephoning or making video calls over the internet (e.g. SKYPE) 41 50 43 37 32
Social media (e.g. such as Facebook or twitter) 64 67 67 61 56
Paying for council services (e.g. parking, council tax) 38 49 41 33 23
507 585 530 485 394
Top three personal concerns (note: only those concerns mentioned by more than 10 per cent of sample listed)
Crime 39 32 43 45 37
Lack of affordable housing 32 35 34 32 27
Litter\dirt in streets 30 30 32 31 25
Lack of jobs 20 11 22 25 22
Traffic congestion 17 18 18 19 14
Quality of Health Service 17 19 20 14 12
Level of council tax 16 20 16 16 11
Pollution of the environment 14 22 14 11 7
Number of homeless people 11 9 15 11 9
Thinking about the next year, how worried are you that you or your family will suffer directly from cuts in spending on public services such as health, education or welfare benefits?
Very/fairly worried 60 51 64 61 64
Cohesion: To what extent do you agree or disagree that this local area is a place where people from different backgrounds get on well together?
Agree (definitely/tend to) 87 89 88 87 85
Area: Thinking about your local area/neighbourhood, how satisfied are you with the area as a place to live?
Very/fairly satisfied 83 86 83 84 79
Do you agree or disagree that you can influence decisions affecting your local area?
Agree (definitely/tend to) 49 51 59 47 36

Appendix: Data tables
Source: Tower Hamlets Annual Residents’ Survey (Westco Trading)
Notes: Sample size = 1,100: AB (267); C1 (346); C2 (208); DE (268); 11 unknown.
Shaded figures in bold are significantly different to the average (and one or more of the other
groups) ie differences are statistically significant.
Page 17
Table A1. Tower Hamlets Annual Residents' Survey: views compared by social
grade, 2016 Appendix: Data table
Shaded figures = significantly different from the average (total)
Total AB C1 C2 DE
% totals
ASB concerns: % who think issue is a very / fairly big problem in their area
Rubbish and litter lying around 48 48 50 48 44
People being drunk or rowdy in public places 39 31 45 41 35
Vandalism, graffiti and other deliberate damage to property or vehicles 33 27 40 37 28
People using or dealing drugs 51 46 54 54 50
How much would you agree or disagree that the police and other local public services are successfully dealing with these issues in your local area?
Agree (strongly/tend to) 56 53 59 53 59
Length of residence: How long have you lived in the borough of Tower Hamlets?
Up to 2 years 17 19 21 12 11
Between 2 and 10 years 30 41 29 28 23
10 years or more 52 39 49 60 66
How likely or unlikely is it that you will move out of the Tower Hamlets Council area in the next twelve months?
Very/fairly likely 12 17 14 9 7
Sample size by social grade # 1100 267 346 208 268
# Social grade information was unknown for 11 respondents.