Embed Size (px)
Citation preview

Name:
GCSE BiologyRequired Practical
Lab BookPractical 1 Practical 6
Practical 2 Practical 7
Practical 3 Practical 8
Practical 4 Practical 9
Practical 5 Practical 10
GCSE Biology required practical activity 1: MicroscopyUse a light microscope to observe, draw and label a selection of plant and animal cells. A magnification scale must be included.
Method
1. Use a dropping pipette to put one drop of water onto a microscope slide.2. Separate one of the thin layers of the onion. 3. Peel off a thin layer of epidermal tissue from the inner surface.4. Use forceps to put this thin layer on to the drop of water that you have placed on the
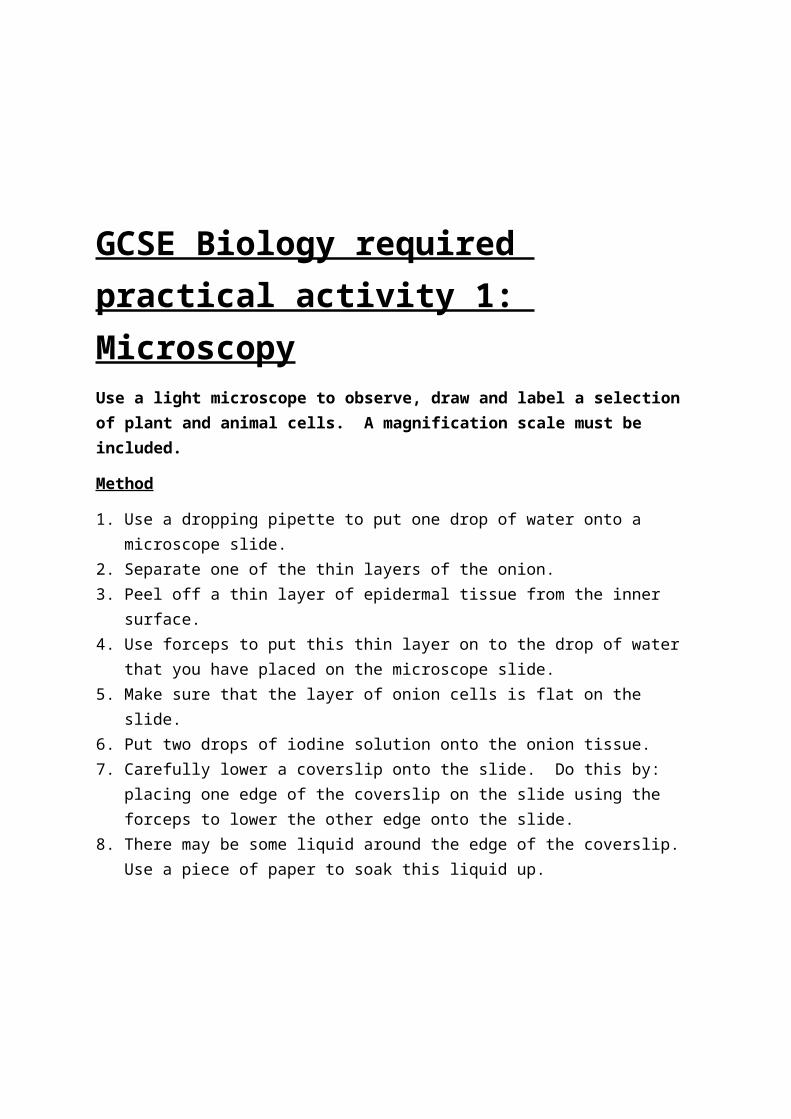
microscope slide.5. Make sure that the layer of onion cells is flat on the slide.6. Put two drops of iodine solution onto the onion tissue.7. Carefully lower a coverslip onto the slide. Do this by: placing one edge of the coverslip
on the slide using the forceps to lower the other edge onto the slide.8. There may be some liquid around the edge of the coverslip. Use a piece of paper to
soak this liquid up.
9. Put the slide on the microscope stage.10. Use the lowest power objective lens. 11. The end of the objective lens needs to almost touch the slide. Do this by turning the
coarse adjustment knob12. Now looking through the eyepiece, turn the coarse adjustment knob in the direction to
increase the distance between the objective lens and the slide. Do this until the cells come into focus.
13. Now rotate the nosepiece to use a higher power objective lens.14. Slightly rotate the fine adjustment knob to bring the cells into a clear focus and use the
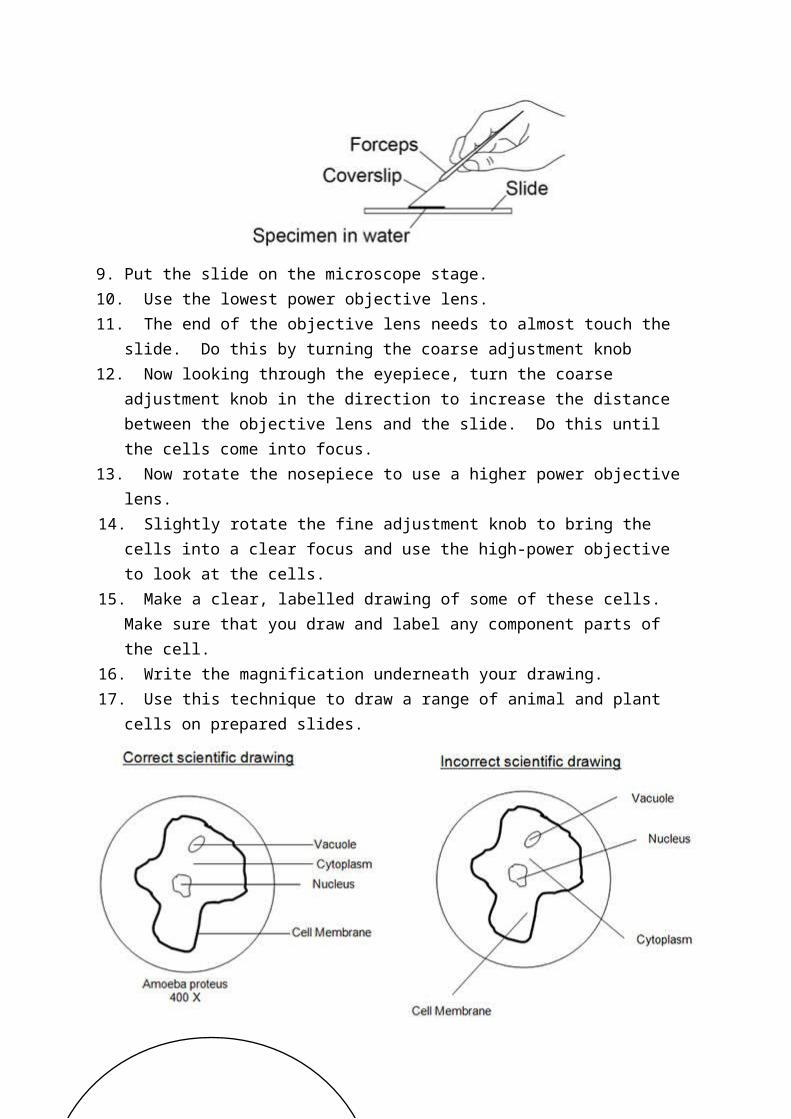
high-power objective to look at the cells. 15. Make a clear, labelled drawing of some of these cells. Make sure that you draw and
label any component parts of the cell. 16. Write the magnification underneath your drawing.17. Use this technique to draw a range of animal and plant cells on prepared slides.


GCSE Biology required practical activity 2: MicrobiologyInvestigating the effect of antiseptics on the growth of bacteria
Measure the diameter of the ‘clear zone’ around the disc. This is where there is no bacteria growing. The larger the clear zone, the more effective the antiseptic
Risk assessment
Ensure that your work spaces and hands are thoroughly cleaned before and after the experiment.
Care must be taken when handling microorganisms such as bacteria. You will use techniques called aseptic techniques during this experiment to avoid contamination.
Contamination can occur when microorganisms from:o the surroundings get into your experiment and spoil your resultso your experiment get into the surroundings and cause a potential health hazard.
Method:
1. Spray the bench where you are working with disinfectant spray. Then wipe with paper towels.
2. Mark the underneath of a nutrient agar plate (not the lid) with the wax pencilas follows (make sure that the lid stays in place to avoid contamination):
divide the plate into three equal sections and number them 1, 2 and 3 around the edge place a dot into the middle of each section around the edge write your initials, the date and the name of the bacteria (E. coli)
3. Wash your hands with the antibacterial hand wash.
4. Put different antiseptics onto the three filter paper discs. This can be done by either soaking them in the liquid or spreading the cream or paste onto them.

5. Carefully lift the lid of the agar plate at an angle. Do not open it fully.
6. Use forceps to carefully put each disc onto one of the dots drawn on with the wax pencil.
7. Make a note of which antiseptic is in each of the three numbered sections of the plate.
8. Secure the lid of the agar plate in place using two small pieces of clear tape. Do not seal the lid all the way around as this creates anaerobic conditions. Anaerobic conditions will prevent the E. coli bacteria from growing and can encourage some other very nasty bacteria to grow.
9. Incubate the plate at 25 °C for 48 hours.
10. Measure the diameter of the clear zone around each disc by placing the ruler across the centre of the disc. Measure again at 90° to the first measurement so that the mean diameter can be calculated.
Diameter of clear zone / mm
1 2 Mean
What type of graph should you draw for this type of data?


GCSE Biology required practical activity 3: OsmosisMethod
1. Cut out 5 potato tubes using the cork borer
2. Take the potato tubes and cut them into tubes exactly 4cm long (make sure you
have removed the skin as this is impermeable to water).
3. Record the mass of each potato tube.
4. Label the test tubes with the 5 concentrations of solution using a board pen.
5. Place one potato tube into each test tube.
6. Cover each tube with solution of the concentration labelled on the test tube.
7. Leave like this for 25 minutes.
8. Remove the potato tubes from the solution and gently dab them with tissue to
remove any excess solution.
9. Record their mass in the results table.
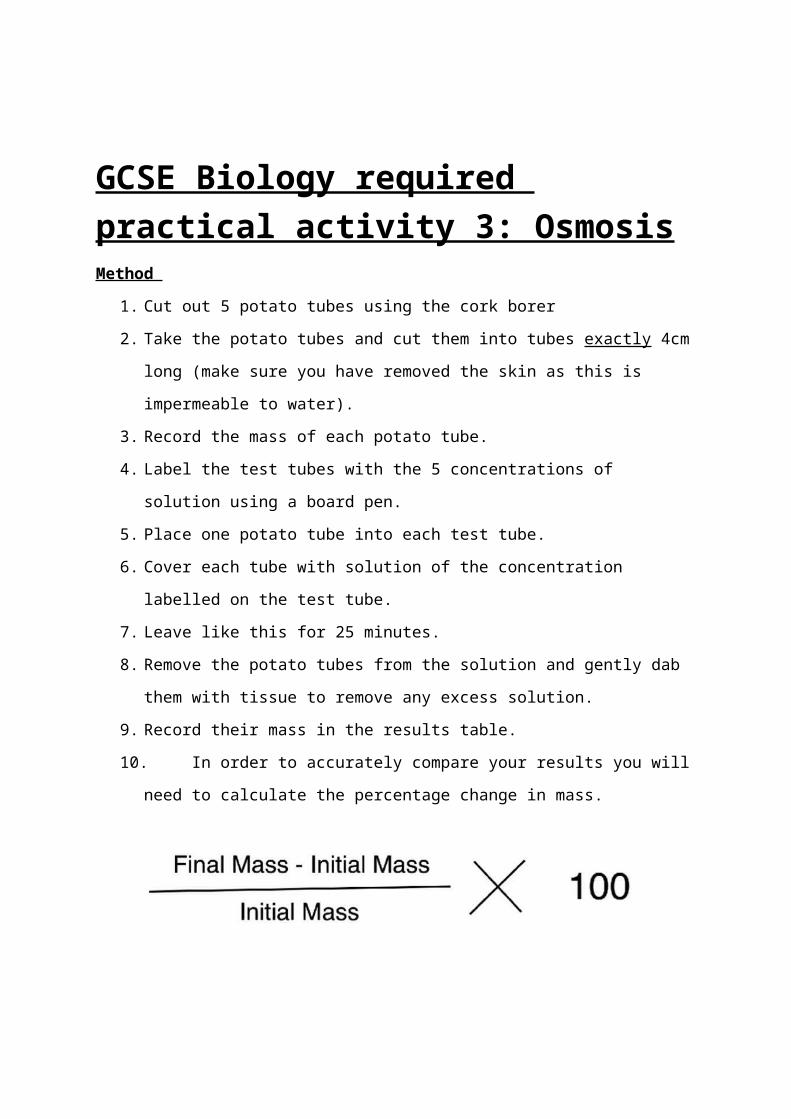
10. In order to accurately compare your results you will need to calculate the percentage
change in mass.

While you are waiting for osmosis to occur, answer these questions:
1. What would happen to a potato strip placed in salt solution more concentrated than
its cytoplasm?
……………………………………………………………………………………………………………………………………
……………………………………………………………………………………………………………………………………
2. Why would this happen?
……………………………………………………………………………………………………………………………………
……………………………………………………………………………………………………………………………………
……………………………………………………………………………………………………………………………………
……………………………………………………………………………………..
3. What would happen to a potato strip placed in salt solution more dilute than its
cytoplasm?
……………………………………………………………………………………………………………………………………
……………………………………………………………………………………………………………………………………
………………………………………………………..
4. Why would this happen?
……………………………………………………………………………………………………………………………………
……………………………………………………………………………………………………………………………………
……………………………………………………………………………………………………………………………………
……………………………………………………………………………………..
5. What would you say about the salt solution surrounding a potato strip in which no
change was observed?
……………………………………………………………………………………………………………………………………
……………….
……………………………………………………………………………………………………………………………………
………………………………………..
6. Explain your answer to Q. 5.
……………………………………………………………………………………………………………………………………
……………………………………………………………………………………………………………………………………
……………………………..
……………………………………………………………………………………………………………………………………
…………………………………………………….
Results:
Concentration of
salt solution /M
Start mass of
potato /g
Final mass of
potato /g
Change in mass of
potato /%

Analysis of results
1. What is the dependent variable in this experiment?
……………………………………………………………………………………………………………………………………
2. What is the independent variable in this experiment?
…………………………………………………………………………………………………………………………………
3. What are the control variables?
……………………………………………………………………………………………………………………………………
……………………………………………………………………………………………………………………………………
………………………………………………………
4. Why is it important to keep these the same?
……………………………………………………………………………………………………………………………………
……………………………
5. Describe two improvements which would increase the accuracy and reliability of this
investigation.
……………………………………………………………………………………………………………………………………
……………………………………………………………………………………………………………………………………
……………………………………………………………………………………………………………………………………
……………………………………………………………………………………………………………………………………
……………………………………………………………………………………………………………………
6. How could you find out what the concentration of the cytoplasm inside the potato
cell was?
……………………………………………………………………………………………………………………………………
……………………………………………………………………………………………………………………………………
……………………………………………………………………………………………………………………………………
………………………………………………………………………………………


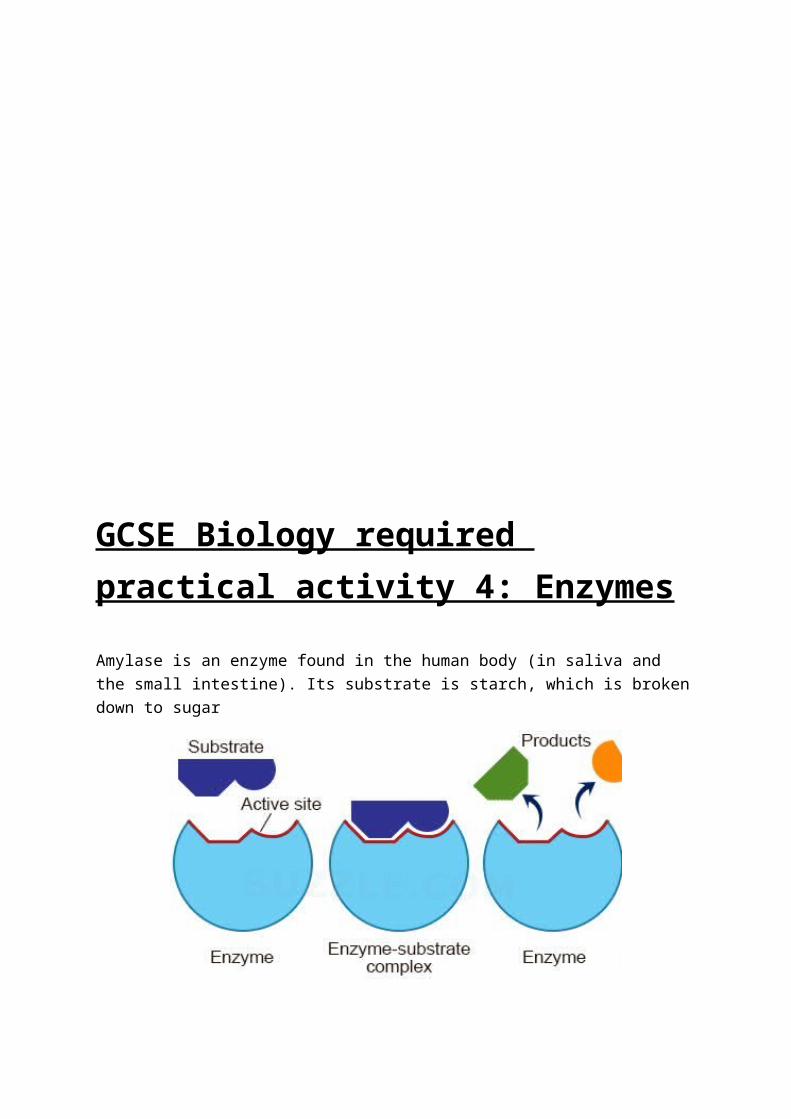
GCSE Biology required practical activity 4: Enzymes
Amylase is an enzyme found in the human body (in saliva and the small intestine). Its substrate is starch, which is broken down to sugar
Aim: An investigation to see how pH affects the rate amylase can break down starch.
We can test to see if starch is still present by using _ _ _ _ _ _ as an indicator ( _ _ _ _ _ if starch is present, _ _ _ _ _ if starch is absent)
Independent variable =
Dependent variable =
Control variables =
1)
2)
3)
4)
5)

Method:
• Take 2 test tubes
• Add 2ml of starch in one and 1ml of amylase and 1ml buffer in the other (a buffer is a chemical that resists change in pH)
• Leave them in a water bath for 5 minute
• While you are waiting, take a spotting tile and add a drop of iodine to each well
• Pour the starch into the amylase and buffer and press start on the stop watch. Give it a gentle swirl to mix the content.
• After 30 15 seconds, use a pipette to add one drop of the mixture into one well in your spotting tile. Look for a colour change
• Repeat each 30 seconds
• Stop when the iodine shows no starch is left (the reaction has finished)
• Record the time taken for the amylase to break down the starch
• Repeat using the other pHs.
Results:
Now take your results and convert them from time to rate. Write down in this box how to do this step

Results:
Rate of reaction /seconds-1
Plot two graphs – one for time and one for rate of reaction
Questions:
What is a buffer?
What is a water bath? Why are they used? Different types?
Does the iodine give you quantitative or qualitative information about the presence of starch?
Is this test objective (always true – no matter who does it) or subjective (open to peoples’ interpretation)?

This is a continuous sampling technique – what is the advantage to this? What is a disadvantage of this?
What can you do to ensure the drop of liquid you take from the reaction tube is representative of the contents of the tube?
What health and safety issues might there be with this experiment?


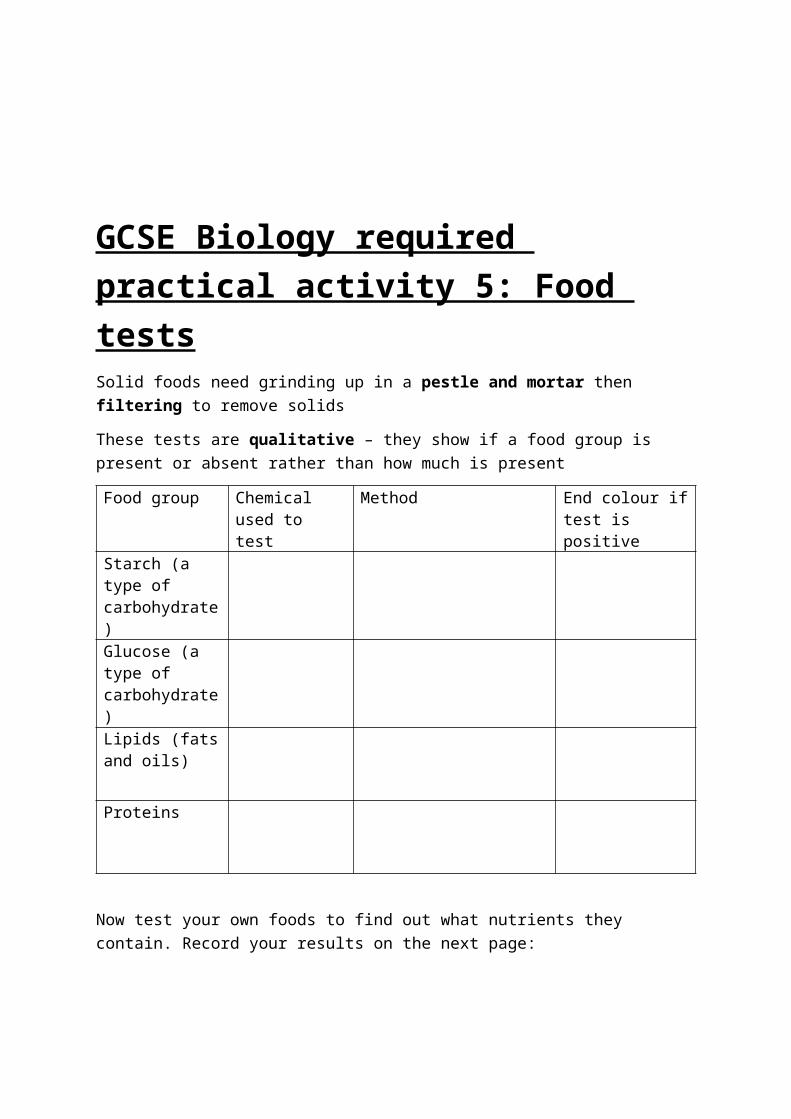
GCSE Biology required practical activity 5: Food testsSolid foods need grinding up in a pestle and mortar then filtering to remove solids
These tests are qualitative – they show if a food group is present or absent rather than how much is present
Food group Chemical used to test
Method End colour if test is positive
Starch (a type of carbohydrate)
Glucose (a type of carbohydrate)
Lipids (fats and oils)
Proteins
Now test your own foods to find out what nutrients they contain. Record your results on the next page:


GCSE Biology required practical activity 6: PhotosynthesisInvestigating the effect of light intensity on photosynthesis in pondweed
Plants use carbon dioxide and water to produce glucose and oxygen. This process is called photosynthesis. The rate of photosynthesis is affected by many factors, such as:
light intensity light wavelength.
Aquatic plants produce visible bubbles of oxygen gas into the surrounding water when they photosynthesise. These bubbles can be counted as a measure of the rate of photosynthesis. Pondweed is an example of an aquatic plant.
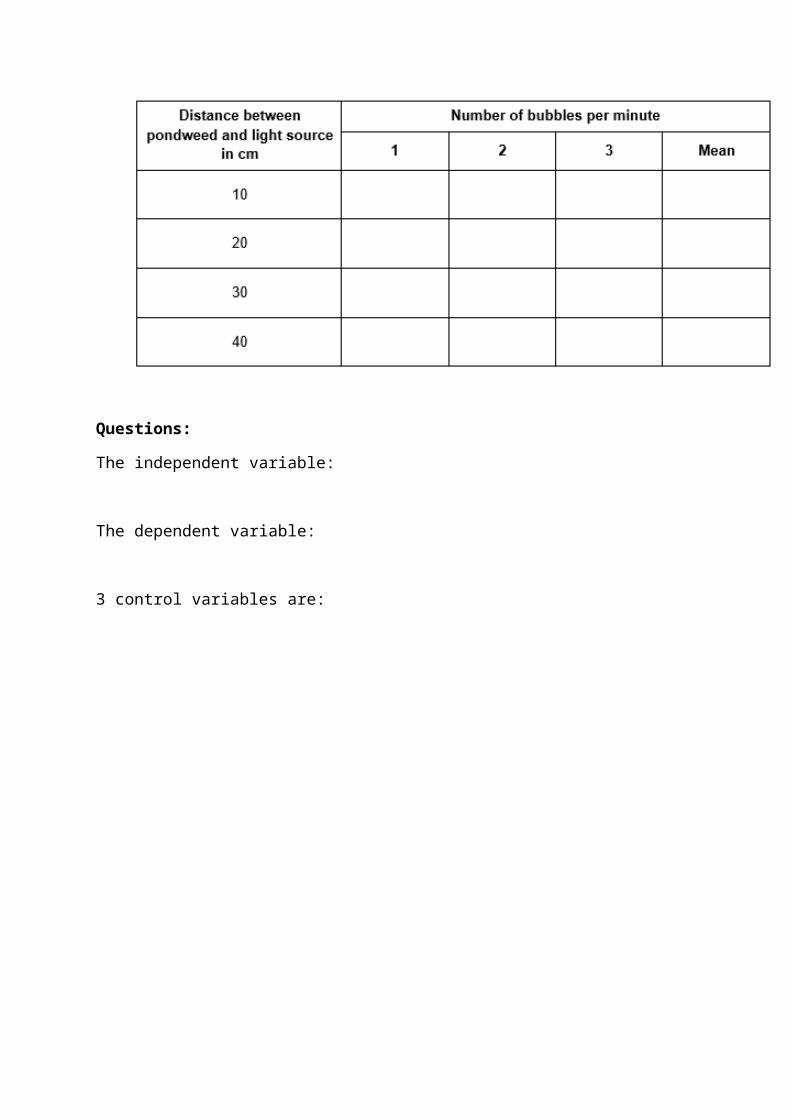
The effect of light intensity can be investigated by varying the distance between pondweed and a light source. The closer the light source, the greater the light intensity.
1. Set up a test tube rack containing a boiling tube at a distance of 10 cm away from the light source
2. Fill the boiling tube with the sodium hydrogen carbonate solution.
3. Put the piece of pondweed into the boiling tube with the cut end at the top. Gently push the pondweed down with the glass rod.
4. Leave the boiling tube for 5 minutes.
5. Start the stop watch and count the number of bubbles produced in one minute.
6. Repeat the count twice more. Then use the data to calculate the mean number of bubbles per minute.
7. Repeat steps 1‒7 with the test tube rack and boiling tube at distances of 20 cm, 30 cm and 40 cm from the light source
Questions:
The independent variable:
The dependent variable:
3 control variables are:


GCSE Biology required practical activity 7: Reaction TimeInvestigating whether practice reduces human reaction times
Messages travel very quickly around your body through the nervous system. This is so that you are able to respond to changes in the environment. The time it takes for you to respond to such a change is called your reaction time.
Athletes spend hours practising to try to reduce their reaction time. This is to help them improve their performance in their particular sport. Responding quicker to the starter’s pistol in a race can gain you the advantage over other runners.
You will conduct a simple, measurable experiment called the ruler drop test. From this you can determine whether your reaction time can be reduced with practice.
Method:
1. Use your weaker hand for this experiment. If you are right handed then your left hand is your weaker hand.
2. Sit down on the chair with good upright posture and eyes looking across the room.
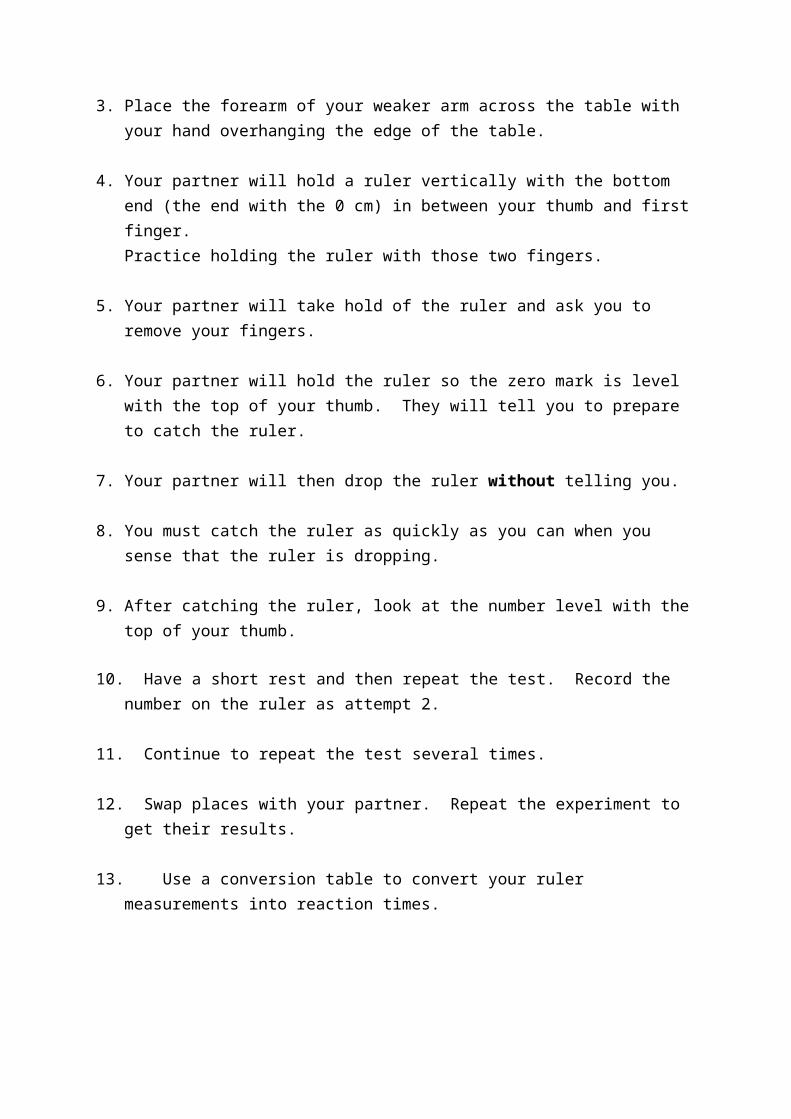
3. Place the forearm of your weaker arm across the table with your hand overhanging the edge of the table.
4. Your partner will hold a ruler vertically with the bottom end (the end with the 0 cm) in between your thumb and first finger. Practice holding the ruler with those two fingers.
5. Your partner will take hold of the ruler and ask you to remove your fingers.
6. Your partner will hold the ruler so the zero mark is level with the top of your thumb. They will tell you to prepare to catch the ruler.
7. Your partner will then drop the ruler without telling you.
8. You must catch the ruler as quickly as you can when you sense that the ruler is dropping.
9. After catching the ruler, look at the number level with the top of your thumb.
10. Have a short rest and then repeat the test. Record the number on the ruler as attempt 2.
11. Continue to repeat the test several times.
12. Swap places with your partner. Repeat the experiment to get their results.
13. Use a conversion table to convert your ruler measurements into reaction times.


GCSE Biology required practical activity 8: Plant responses Investigating the effect of light intensity on the growth of mustard seedlings
Light affects the distribution of auxins within the stems of newly germinated seeds. The effect of light on this growth can be determined by measuring the height of shoots with a ruler.
Method:
1. Set up three petri dishes containing cotton wool soaked in equal amounts of water.2. Put ten mustard seeds in each petri dish.3. Put the petri dishes in a warm place. They must not be disturbed or moved.4. Allow the mustard seeds to germinate.
Add more water if the cotton wool gets dry (equal amounts of water to each petri dish).5. Each petri dish should have the same number of seedlings after the seeds have
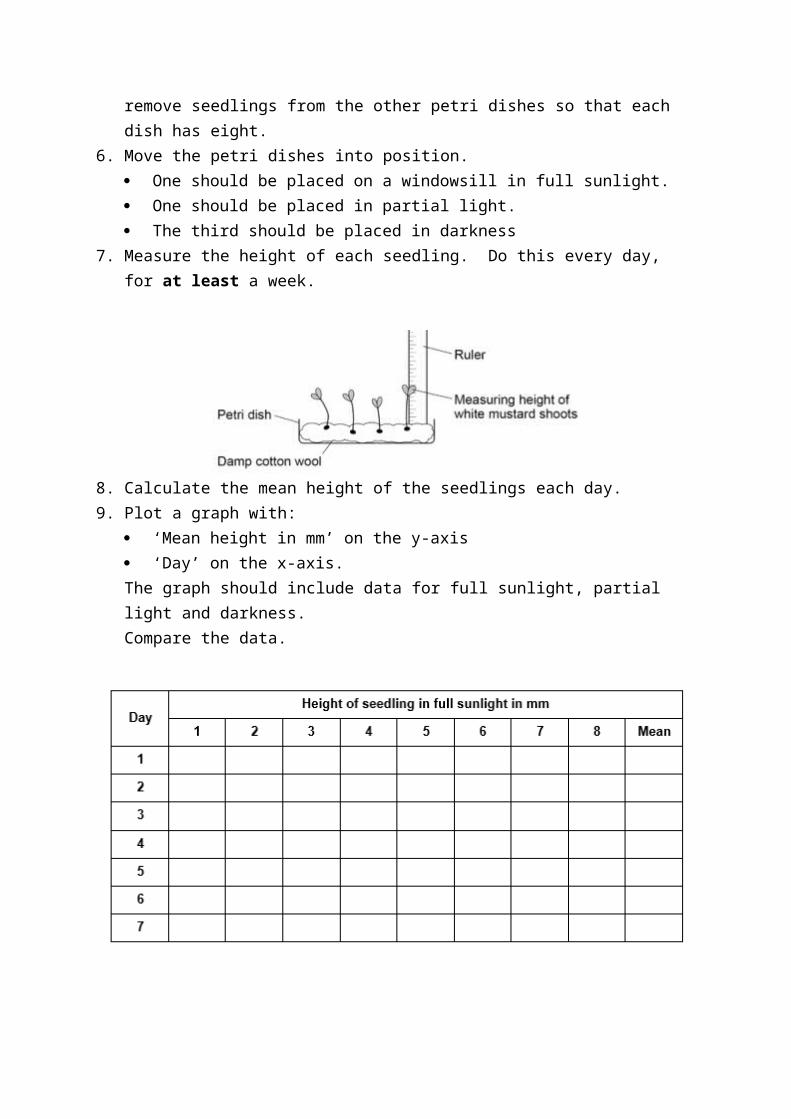
geminated. Remove excess seedlings from any dish that has too many.For example, one dish has eight seedlings which are the fewest compared to the other petri dishes. Therefore, remove seedlings from the other petri dishes so that each dish has eight.
6. Move the petri dishes into position. One should be placed on a windowsill in full sunlight. One should be placed in partial light. The third should be placed in darkness
7. Measure the height of each seedling. Do this every day, for at least a week.
8. Calculate the mean height of the seedlings each day. 9. Plot a graph with:
‘Mean height in mm’ on the y-axis ‘Day’ on the x-axis.The graph should include data for full sunlight, partial light and darkness. Compare the data.


GCSE Biology required practical activity 9: Field investigationsThere are two parts to this Investigation:
1. Investigating the population size of a plant species using random sampling
2. Investigating the effect of a factor on plant distribution using a transect line.
1. Investigating the population size of a plant species using random sampling.
1. Collect two numbers, one from each bag.2. Use the numbers and the tape measures to locate the first position for your quadrat.
3. Lay the 25cm x 25 cm quadrat on the ground.
4. Replace the numbers in the bags.
5. Count and record the number of plantain inside the quadrat.
6. Collect two more numbers from the bags and use them to locate the next site.
7. Replace the numbers in the bags for other students to use.
8. Count and record the number of plantain inside the quadrat. Repeat steps 1 – 5 until you have recorded the numbers of plantain in 10 quadrats.
10. Your teacher will show you how to estimate the population of plantain using the equation:
estimated population size = area sampled total area x number of plantain counted

2. Investigating the effect of a factor on plant distribution using a transect line
Your teacher will help you identify a species of plant to identify.
1. Lay the 30m tape measure in a line from the base of a tree to an open area of ground. 2. Put the 25cm x 25cm quadrat against the transect line. One corner of the quadrat
should touch the 0 m mark on the tape measure.3. Count the number of plants within the quadrat and record them in a table4. Move the quadrat 5 m up the transect line and count the number of plants again. Record in the table.
5. Continue to place the quadrat at 5 m intervals and count the number of plants in each quadrat.


GCSE Biology required practical activity 10: DecayBecause the natural process of decay in milk is slow, it is difficult to monitor in normal class time. Instead we have suggested an approach which speeds up the process through the addition of lipase. Therefore the procedure suggested should serve as a ‘model’ for the investigation of decay in milk. The fall in pH in natural decay would be due to the production of lactic acid. In this model, the fall in pH is due mainly to the production of fatty acids
Investigating the effect of temperature on the rate of decay of fresh milk by measuring pH change
You will use an alkaline solution of milk. When lipase is added to the milk the fat in the milk is broken down into fatty acids. This makes the pH lower.
Cresol red is an indicator that is purple in alkaline solutions of about pH 8.8. When the pH drops below pH 7.2 Cresol red becomes yellow.
Method:
1. Half fill one of the 250 cm3 beakers with hot water from the kettle. This will be the water bath.
2. Label two test tubes:
one ‘lipase’ one ‘milk’
3. In the ‘lipase’ test tube put 5 cm3 of lipase solution.4. In the ‘milk’ test tube put five drops of Cresol red solution.5. Use a calibrated dropping pipette to add 5 cm3 of milk to the ‘milk’ test tube.6. Use another pipette to add 7 cm3 of sodium carbonate solution to the ‘milk’ test tube.
The solution should be purple.
Put a thermometer into the ‘milk’ test tube
7. Put both test tubes into the water bath. Wait until the contents reach the same temperature as the water bath.
8. Use another dropping pipette to transfer 1 cm3 of lipase into the ‘milk’ test tube.
Immediately start timing.
10. Stir the contents of the ‘milk’ test tube until the solution turns yellow. 11. Record the time taken for the colour to change to yellow, in seconds.

12. Repeat steps 1‒11 for different temperatures of water bath. You can obtain temperatures below room temperature by using ice in the beaker instead of hot water.
13. Record your results in a table such as the one here. Plot a graph of your results.