Embed Size (px)
Citation preview

http://waikato.researchgateway.ac.nz/
Research Commons at the University of Waikato Copyright Statement:
The digital copy of this thesis is protected by the Copyright Act 1994 (New Zealand).
The thesis may be consulted by you, provided you comply with the provisions of the Act
and the following conditions of use:
Any use you make of these documents or images must be for research or private
study purposes only, and you may not make them available to any other person.
Authors control the copyright of their thesis. You will recognise the author’s right to
be identified as the author of the thesis, and due acknowledgement will be made to
the author where appropriate.
You will obtain the author’s permission before publishing any material from the thesis.

ASSOCIATION OF SINGLE NUCLEOTIDE POLYMORPHISMS IN SURFACTANT PROTEIN -A AND -D WITH OTITIS MEDIA
A thesis
submitted in partial fulfilment
of the requirements for the degree
of
Master of Science in Biological Sciences
at
The University of Waikato
by
CATHERINE MARGARET ELEANOR BARNETT
The University of Waikato
2007
ii
ABSTRACT
Otitis Media is one of the most common childhood diseases.
Recurrent acute otitis media (RAOM) is characterized by
repeated episodes of inflammation of the middle ear in
conjunction with middle ear fluid, and often with an inflamed or
bulging eardrum. Defective clearance by the Eustachian tube
results in mucus build-up and is characteristic of otitis media
with effusion (OME). Streptococcus pneumoniae, Haemophilus
influenzae, Moraxella catarrhalis, respiratory syncytial virus, and
rhinovirus are the most common contributors to otitis media
pathogenesis. In New Zealand, OME has been implicated with
conductive hearing loss in childhood and has been shown to
significantly impact on speech and language development. New
Zealand Maori and Polynesian children have displayed
significantly higher hearing test failure rates than European-
Caucasian children.
The collectins, Surfactant Protein (SP)-A and –D are encoded by
three genes (SP-A1, SP-A2, and SP-D) and are host defense
proteins present in the middle ear and Eustachian tube. Single
nucleotide polymorphisms (SNPs) in SP-A1 and SP-A2 have been
associated with increased or decreased susceptibility to otitis
media, meningococcal disease, and range of respiratory
diseases. Using allele-specific primers and real-time PCR with
SYBR® Green I melting curve analysis, four groups of individuals
were genotyped for eleven SP-A1, SP-A2, and SP-D SNPs:
European-Caucasian individuals with RAOM/OME; New Zealand

Abstract iii
Maori/Polynesian individuals with RAOM/OME; individuals with
meningococcal disease; and a control group. The computer
program, Haploview, was employed to perform χ2 analyses and
identify statistically significant associations of alleles/haplotypes
with RAOM/OME or meningococcal disease.
In the European-Caucasian population, two SP-A1 alleles, one
SP-A2 allele, and four haplotypes (CGAGC, 1A3, 1A9, and 1A10)
were found to be associated with increased risk of RAOM/OME (P
< 0.05). Conversely, haplotypes 6A2 and 1A2 were found to be
protective against susceptibility to RAOM/OME (P < 0.05). In
New Zealand Maori and Polynesian individuals, two SP-A1 alleles,
three SP-A2 alleles, one SP-D allele, and four haplotypes (6A8,
6A10, 1A3, and 1A10) were found to be associated with increased
risk of RAOM/OME (P < 0.05). An additional four haplotypes
(6A2, 1A0, 1A2, and TA) were determined to be protective against
susceptibility to RAOM/OME (P < 0.05). However, protective
SPA1/SPA2/SPD haplotype 6A2-1A0-TA was significantly under-
represented in the New Zealand Maori and Polynesian population
(P < 0.05). A single allele and haplotype were associated with
increased risk of meningococcal disease (P < 0.05).
The findings of this study confirm that specific genetic variants of
SP-A and SP-D are associated with either increased or decreased
risk of developing RAOM and/or OME. Furthermore, it was
demonstrated that New Zealand Maori and Polynesian individuals
appear to exhibit more haplotypes susceptible to RAOM/OME.
This may provide a partial explanation for the higher
RAOM/OME-related failure rates of hearing tests in New Zealand
Maori and Polynesian children. However, there are numerous
socio-economic and environmental factors that also contribute to
otitis media pathogenesis which were not considered in this

Abstract iv
study. The effects of the SP-A1, SP-A2, and SP-D alleles and
haplotypes on the bacterial/viral binding efficiencies of SP-A and
SP-D need to be investigated by further research, using a large
population, to confirm the association with susceptibility or
resistance with RAOM/OME.

Acknowledgements
v
ACKNOWLEDGEMENTS
To begin with, I must acknowledge the guidance,
encouragement, and expertise of my supervisors Dr Ray Cursons
and Mr Tony Cecire. It has been such a blessing to learn from
such knowledgeable and exceptional people. Thank you also to
Raewyn Towers for her excellent proof-reading and editing skills,
as well as much needed encouragement. You’ve been the best
‘lab-mum’ ever! Thanks to Professor Dick Wilkins for his expert
advice and ‘top-shelf’ jokes. Also, much appreciation goes to Dr
Patrick White for his exceptional proof-reading.
A big shout-out must go to the crazy lab-mates: Sho, Mandai,
Olivia and Vix. You guys encouraged me when I needed it,
provided advice (mostly useful), and made my time here heaps
of fun. I don’t think I would’ve have made it to the end without
friends like you.
A giant thanks goes to Dad for always being positive and never
doubting me. Also, thank you Mum, Lucie, and Emma for your
love, support, and encouragement. Thanks to my legendary
husband Simon, who has watched this whole rollercoaster and
has remained positive and supportive the entire time. You’re
definitely a keeper!
Finally, an infinite amount of appreciation goes to my biggest
fan. You are everything to me and this thesis is dedicated to you.
vi
TABLE OF CONTENTS
Page Abstract ii Acknowledgements v Table of Contents vi List of Tables x List of Figures xiv List of Abbreviations xxi List of Abbreviations for Commercial Suppliers xxiii CHAPTER ONE: INTRODUCTION AND LITERATURE REVIEW 1.1 Otitis Media 1 1.2 Surfactant 4 1.2.1 Structure of SP-A and SP-D 6 1.2.2 Function of SP-A and SP-D 7 1.2.3 SP-A and SP-D genes 10 1.2.4 Association of SP-A and SP-D with disease 13 1.3 Genetic diversity of SP-A and SP-D 14 1.3.1 SP-A Haplotypes 19 1.4 Genetic Techniques and Data Analysis 20 1.4.1 Real-time PCR 20 1.4.2 SYBR® Green I Melting Curve Analysis 23 1.4.3 Haploview 25 1.4.4 PolyPhen 26 1.5 Study Objectives 28 1.5.1 Objective One 28 1.5.2 Hypothesis One 28 1.5.3 Objective Two 28 1.5.4 Hypothesis Two 28 CHAPTER TWO: MATERIALS AND METHODS 2.1 Blood Samples 29
Table of Contents vii
2.1.1 Isolation of Genomic DNA 30 2.1.2 DNA Concentration and Integrity 31 2.2 Genotyping of SP-A1, SP-A2, and SP-D 31 2.2.1 PCR Optimization 34 2.2.2 Agarose Gel Electrophoresis 36 2.2.3 Real-Time PCR 37 2.2.4 SYBR® Green I Melting Curve Analysis 38 2.2.5 Sequencing of SP-A1, SP-A2, and SP-D PCR
Products 38 2.3 Analysis of Genotype Data 41 2.3.1 Haplotype Construction 41 2.3.2 χ2-Tests for RAOM/OME Association 42 2.3.3 Protein Phenotype Predictions 42 CHAPTER THREE: RESULTS 3.1 Isolation of Genomic DNA 44 3.2 Gradient PCR 45 3.3 Genotyping 51 3.3.1 Real-Time PCR and SYBR® Green I Melting
Curve Analysis 51 3.3.2 Confirmation by Agarose Gel Electrophoresis 59 3.3.3 Confirmation by DNA Sequencing 63 3.3.4 Raw Genotype Results 63
3.4 Haploview 65 3.4.1 European-Caucasian Population Statistics 67 3.4.2 Control Population Statistics 73 3.5 Allele and Haplotype Associations with RAOM/OME 78 3.5.1 Association of Single SNP Alleles with RAOM/OME 78 3.5.2 Association of Haplotypes with RAOM/OME 80 3.6 New Zealand Maori and Pacific Island Population 83 3.6.1 Association of Single SNP Alleles with
RAOM/OME in the New Zealand Maori and Pacific Island Population 88
3.6.2 Association of Haplotypes with RAOM/OME in the New Zealand Maori and Pacific Island Population 91
3.7 Association with Meningococcal Disease 95

Table of Contents viii
3.7.1 Association of Single SNP Alleles with Meningococcal Disease 96
3.7.2 Association of Haplotypes with Meningococcal Disease 98
3.8 PolyPhen Results 100 CHAPTER FOUR: DISCUSSION 4.1 Background 104 4.2 SP-A1, SP-A2, and SP-D Alleles and Haplotypes
associated with increased host susceptibility to RAOM/OME 108
4.2.1 SP-A1, SP-A2, and SP-D Alleles 108 4.2.2 SP-A1, SP-A2, and SP-D Haplotypes 111 4.3 SP-A1, SP-A2, and SP-D Alleles and Haplotypes
associated with host resistance to RAOM/OME 115 4.3.1 SP-A1, SP-A2, and SP-D Alleles 115 4.3.2 SP-A1, SP-A2, and SP-D Haplotypes 116 4.4 New Zealand Maori and Pacific Island RAOM/OME
Population 117 4.4.1 SP-A1, SP-A2, and SP-D Alleles associated with
increased host susceptibility to RAOM/OME in New Zealand Maori and Pacific Island individuals 118
4.4.2 SP-A1, SP-A2, and SP-D Haplotypes associated with increased host susceptibility to RAOM/OME in New Zealand Maori and Pacific Island individuals 121
4.4.3 SP-A1, SP-A2, and SP-D Alleles associated with increased host resistance to RAOM/OME in New Zealand Maori and Pacific Island individuals 123
4.4.4 SP-A1, SP-A2, and SP-D Haplotypes associated with increased host resistance to RAOM/OME in New Zealand Maori and Pacific Island individuals 123
4.5 Association of SP-A1, SP-A2, and SP-D Alleles and
Haplotypes with Meningococcal Disease 124 4.6 Copy Number Variants of SP-A1 and SP-A2 125 4.7 Study Limitations 128 4.7.1 Confounding Factors 128 4.7.2 Hardy-Weinberg Equilibrium 130

Table of Contents ix
4.8 Conclusions 131 4.9 Future Research 132 APPENDICES Appendix I: Ethics Information 134 Appendix II: Sequencing Results 143 AII.1 SPA1-19 144 AII.2 SPA1-50 146 AII.3 SPA1-62 148 AII.4 SPA1-133 150 AII.5 SPA1-219 152 AII.6 SPA2-9 154 AII.7 SPA2-91 156 AII.8 SPA2-140 158 AII.9 SPA2-223 160 AII.10 SPD-11 162 AII.11 SPD-160 164 Appendix III: Sample Information 166 AIII.1 RAOM/OME Population 167 AIII.2 Control Population 173 Appendix IV: Genotyping Results 176 REFERENCES 189

x
LIST OF TABLES
CHAPTER ONE: INTRODUCTION AND LITERATURE REVIEW Table 1.1. Single Nucleotide Polymorphisms and amino
acid differences in SP-A1. 17
Table 1.2. Single Nucleotide Polymorphisms and amino
acid differences in SP-A2. 18
Table 1.3. Single Nucleotide Polymorphisms in SP-D. 18
CHAPTER TWO: MATERIALS AND METHODS Table 2.1. Allele-specific primers for genotyping SP-A1,
SP-A2, and SP-D. 33
Table 2.2. Grouping of the 22 allele-specific reactions
based on PCR product length. 35
Table 2.3. Volume of reagents added to each 50μl allele-
specific PCR reaction for purification of PCR products for subsequent sequencing.
40
CHAPTER THREE: RESULTS Table 3.1. Example of Nanodrop readings for samples 120
– 127 of the case population. 45
Table 3.2. Optimal annealing temperature ranges for the
allele-specific primers. 51
Table 3.3. Melting temperatures for allele-specific products
amplified from SP-A1, SP-A2, and SP-D. 59
Table 3.4. Raw genotype data for SP-A1, SP-A2, and SP-D
alleles in case and control individuals. 64
List of Tables xi
Table 3.5. Quality statistics for the SP-A1, SP-A2, and SP-D, SNP loci genotyped in the European-Caucasian case population.
69
Table 3.6. Quality statistics for the SP-A1, SP-A2, and SP-
D, SNP loci genotyped in the control population. 74
Table 3.7. Single SNP allele associations with RAOM/OME. 79 Table 3.8. SP-A1 haplotypes in association with
RAOM/OME. 81
Table 3.9. SP-A2 haplotypes in association with
RAOM/OME. 82
Table 3.10. SP-D haplotypes in association with RAOM/OME. 83 Table 3.11. Quality statistics for the SP-A1, SP-A2, and SP-
D, SNP loci genotyped in a New Zealand Maori and Pacific Island case population.
84
Table 3.12. Allele associations with RAOM/OME seen in New
Zealand Maori and Pacific Island individuals. 89
Table 3.13. SP-A1 haplotypes in association with
RAOM/OME in the New Zealand Maori and Pacific Island case population.
91
Table 3.14. SP-A2 haplotypes in association with
RAOM/OME in the New Zealand Maori and Pacific Island case population.
93
Table 3.15. SP-D haplotypes in association with RAOM/OME
in the New Zealand Maori and Pacific Island case population.
95
Table 3.16. Genotypes of three individuals with
meningococcal disease at the eleven SNP loci within SP-A1, SP-A2, and SP-D.
96
Table 3.17. Association of specific SP-A1, SP-A2, and SP-D
alleles with meningococcal disease. 97
Table 3.18. SP-A1 haplotypes in association with
meningococcal disease. 98
Table 3.19. SP-A2 haplotypes in association with
meningococcal disease. 99
List of Tables xii
Table 3.20. SP-D haplotypes in association with meningococcal disease.
100
Table 3.21. Polymorphism phenotyping results for SP-A1 as predicted by PolyPhen.
101
Table 3.22. Polymorphism phenotyping results for SP-A2 as
predicted by PolyPhen.
102
Table 3.23. Polymorphism phenotyping results for SP-D as
predicted by PolyPhen.
103
APPENDIX III: SAMPLE INFORMATION
Table AIII.1 Sample information from the RAOM/OME
diagnosed population (Part One).
167
Table AIII.2 Sample information from the RAOM/OME
diagnosed population (Part Two).
168
Table AIII.3 Sample information from the RAOM/OME
diagnosed population (Part Three).
169
Table AIII.4 Sample information from the RAOM/OME
diagnosed population (Part Four).
170
Table AIII.5 Sample information from the RAOM/OME
diagnosed population (Part Five).
171
Table AIII.6 Sample information from the RAOM/OME
diagnosed population (Part Six).
172
Table AIII.7 Control population sample information. The
control population consisted of volunteer blood donors from the New Zealand Blood Service, Hamilton. M = Male, F = Female.
173

List of Tables xiii
APPENDIX IV: GENOTYPING RESULTS
Table AIV. 1 Raw genotype data for RAOM/OME individuals in the case population (Part One).
177
Table AIV.2 Raw genotype data for RAOM/OME individuals in
the case population (Part Two).
178
Table AIV.3 Raw genotype data for RAOM/OME individuals in
the case population (Part Three).
179
Table AIV.4 Raw genotype data for RAOM/OME individuals in
the case population (Part Four).
180
Table AIV.5 Raw genotype data for RAOM/OME individuals in
the case population (Part Five).
181
Table AIV.6 Raw genotype data for the control population
(Part One).
182
Table AIV.7 Raw genotype data for the control population
(Part Two).
183
Table AIV.8 Raw genotype data for the control population
(Part Three).
184
Table AIV.9 Raw genotype data for the control population
(Part Four).
185
Table AIV.10 Raw genotype data for the control population
(Part Five).
186
Table AIV.11. Raw genotype data for the control population
(Part Six).
187
Table AIV.12. Raw genotype data for the (A) New Zealand
Maori/Pacific Island population and the (B) meningococcal disease individuals.
188
xiv
LIST OF FIGURES
CHAPTER ONE: INTRODUCTION AND LITERATURE REVIEW Figure 1.1 Location of the middle ear cavity and Eustachian
tube within the human auditory system. 2
Figure 1.2
The structural organization of SP-A and SP-D. 7
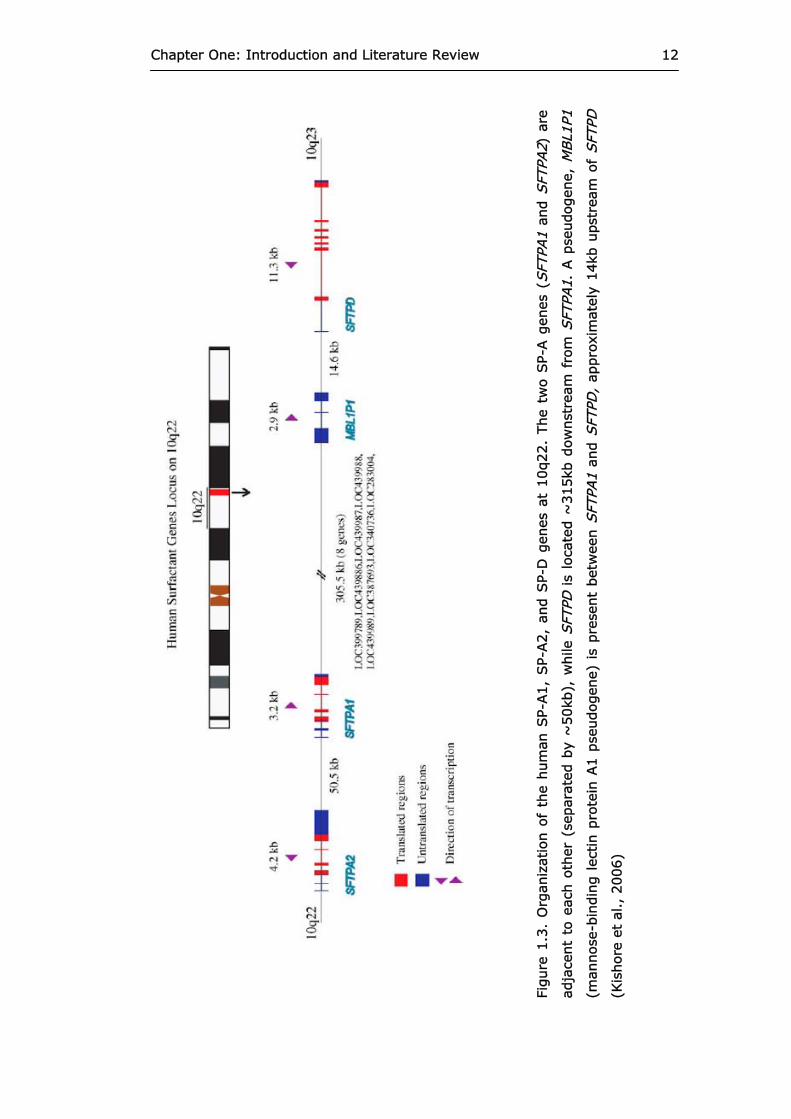
Figure 1.3 Organization of the human SP-A1, SP-A2, and SP-
D genes at 10q22. 12
Figure 1.4 Location of the SP-A and SP-D gene
polymorphisms. 16
Figure 1.5 Real-time PCR amplification curves. 23 Figure 1.6 SYBR® Green I melting curves. 25 CHAPTER THREE: RESULTS
Figure 3.1 Genomic DNA samples electrophoresed in a 2%
(w/v) agarose gel. 44
Figure 3.2 Gradient PCR products amplified from case
sample 24 using allele-specific primers SPA1-50G, SPA1-62A, and SPA1-62G.
47
Figure 3.3 Gradient PCR products amplified from case
sample 24 using allele-specific primers SPA1-140T, SPA2-223C, and SPA2-223A.
49
Figure 3.4 Gradient PCR products amplified from case
sample 24 using allele-specific primers SPD-11T, SPD-11C, and SPD-160A.
50
Figure 3.5 SYBR® Green I melting curves for multiple
reactions containing SPA1-19T and SPA1-19C allele-specific primers.
53

List of Figures xv
Figure 3.6 SYBR® Green I melting curves for multiple reactions containing SPA1-50C and SPA1-50G allele-specific primers.
53
Figure 3.7 SYBR® Green I melting curves for multiple
reactions containing SPA1-62A and SPA1-62G allele-specific primers.
54
Figure 3.8 SYBR® Green I melting curves for multiple
reactions containing SPA1-133A and SPA1-133G allele-specific primers.
54
Figure 3.9 SYBR® Green I melting curves for multiple
reactions containing SPA1-219C and SPA1-219T allele-specific primers.
55
Figure 3.10 SYBR® Green I melting curves for multiple
reactions containing SPA2-9A and SPA2-9C allele-specific primers.
55
Figure 3.11 SYBR® Green I melting curves for multiple
reactions containing SPA2-91G and SPA2-91C allele-specific primers.
56
Figure 3.12 SYBR® Green I melting curves for multiple
reactions containing SPA2-140C and SPA2-140T allele-specific primers.
56
Figure 3.13 SYBR® Green I melting curves for multiple
reactions containing SPA2-223C and SPA2-223A allele-specific primers.
57
Figure 3.14 SYBR® Green I melting curves for multiple
reactions containing SPD-11T and SPD-11C allele-specific primers.
57
Figure 3.15 SYBR® Green I melting curves for multiple
reactions containing SPD-160G and SPD-160A allele-specific primers.
58
Figure 3.16 Real-time PCR products amplified from case
samples 128 and 129 with SPA1-19T/C, SPA1-50G/C, SPA1-219C/T, and SPA2-223C/A allele-specific primers.
60
Figure 3.17 Real-time PCR products for allele-specific primers
SPA2-9A/C, SPA2-91G/C, SPA2-140C/T, and SPD-11T/C for case samples 128 and 129.
62
Figure 3.18 Excerpt of Haploview input file containing raw
genotype data. 65

List of Figures xvi
Figure 3.19 Flow diagram summarizing the process of Haploview Analysis.
66
Figure 3.20 Linkage disequilibrium plot of the eleven SNPs in
SP-A1, SP-A2, and SP-D detected within the European-Caucasian case population.
70
Figure 3.21 Constructed haplotypes for SP-A1, SP-A2, and
SP-D alleles seen in the European-Caucasian case population.
72
Figure 3.22 Linkage disequilibrium plot of the eleven SNPs in
SP-A1, SP-A2, and SP-D detected within the control population.
76
Figure 3.23 Constructed haplotypes for SP-A1, SP-A2, and
SP-D alleles seen in the control population. 77
Figure 3.24 Linkage disequilibrium plot of the eleven SNPs in
SP-A1, SP-A2, and SP-D detected in New Zealand Maori and Pacific Island individuals with RAOM/OME.
86
Figure 3.25 Constructed haplotypes for SP-A1, SP-A2, and
SP-D alleles seen in the New Zealand Maori and Pacific Island case population.
87
Figure 3.26 Amino acid sequence of human SP-A1 in FASTA
format. 100
Figure 3.27 Amino acid sequence of human SP-A2 in FASTA
format. 102
Figure 3.28 Amino acid sequence of human SP-D in FASTA
format. 103
APPENDIX II: SEQUENCING RESULTS
Figure AII.1
Sequence of PCR product amplified for SPA1-19. The PCR product length was expected to be 515 bp but sequencing reported 531 bp.
144
Figure AII.2
Parameters from BLAST search with SPA1-19 sequence.
144
Figure AII.3
First ten sequences producing significant alignments with SPA1-19.
144

List of Figures xvii
Figure AII.4
Alignment of Query sequence with: gb|AY198391.1| Homo sapiens surfactant, pulmonary-associated protein A1 (SFTPA1) gene, complete cds.
145
Figure AII.5
Sequence of PCR product amplified for SPA1-50. The PCR product length was expected to be 605 bp but sequencing reported 591 bp.
146
Figure AII.6
Parameters from BLAST search with SPA1-50 sequence.
146
Figure AII.7
First ten sequences producing significant alignments with SPA1-50.
146
Figure AII.8
Alignment of Query sequence with: gb|AY198391.1| Homo sapiens surfactant, pulmonary-associated protein A1 (SFTPA1) gene, complete cds.
147
Figure AII.9
Sequence of PCR product amplified for SPA1-62. The PCR product length was expected to be 959 bp but sequencing reported 936 bp.
148
Figure AII.10
Parameters from BLAST search with SPA1-62 sequence.
148
Figure AII.11
First ten sequences producing significant alignments with SPA1-62.
148
Figure AII.12
Alignment of Query sequence with: gb|AY198391.1| Homo sapiens surfactant, pulmonary-associated protein A1 (SFTPA1) gene, complete cds.
149
Figure AII.13
Sequence of PCR product amplified for SPA1-133. The PCR product length was expected to be 937 bp but sequencing reported 922 bp.
150
Figure AII.14
Parameters from BLAST search with SPA1-133 sequence.
150
Figure AII.15
First ten sequences producing significant alignments with SPA1-133.
150
Figure AII.16
Alignment of Query sequence with: gb|AY198391.1| Homo sapiens surfactant, pulmonary-associated protein A1 (SFTPA1) gene, complete cds.
151

List of Figures xviii
Figure AII.17
Sequence of PCR product amplified for SPA1-219. The PCR product length was expected to be 577 bp but sequencing reported 533 bp.
152
Figure AII.18
Parameters from BLAST search with SPA1-219 sequence.
152
Figure AII.19
First ten sequences producing significant alignments with SPA1-219.
152
Figure AII.20
Alignment of Query sequence with: gb|AY198391.1| Homo sapiens surfactant, pulmonary-associated protein A1 (SFTPA1) gene, complete cds.
153
Figure AII.21 Sequence of PCR product amplified for SPA2-9.
The PCR product length was expected to be 235 bp but sequencing reported 216 bp.
154
Figure AII.22 Parameters from BLAST search with SPA2-9
sequence. 154
Figure AII.23 First ten sequences producing significant
alignments with SPA2-9. 154
Figure AII.24 Alignment of Query sequence with:
gb|AY206682.1| Homo sapiens surfactant, pulmonary-associated protein A2 (SFTPA2) gene, complete cds.
155
Figure AII.25 Sequence of PCR product amplified for SPA2-91.
The PCR product length was expected to be 400 bp but sequencing reported 380 bp.
156
Figure AII.26 Parameters from BLAST search with SPA2-91
sequence.
156
Figure AII.27 First ten sequences producing significant
alignments with SPA2-91. 156
Figure AII.28 Alignment of Query sequence with:
gb|AY206682.1| Homo sapiens surfactant, pulmonary-associated protein A2 (SFTPA2) gene, complete cds.
157
Figure AII.29 Sequence of PCR product amplified for SPA2-140.
The PCR product length was expected to be 395 bp but sequencing reported 343 bp.
158

List of Figures xix
Figure AII.30 Parameters from BLAST search with SPA2-140 sequence.
158
Figure AII.31 First ten sequences producing significant
alignments with SPA2-140. 158
Figure AII.32 Alignment of Query sequence with:
gb|AY206682.1| Homo sapiens surfactant, pulmonary-associated protein A2 (SFTPA2) gene, complete cds.
159
Figure AII.33 Sequence of PCR product amplified for SPA2-223.
The PCR product length was expected to be 588 bp but sequencing reported 600 bp.
160
Figure AII.34 Parameters from BLAST search with SPA2-223
sequence. 160
Figure AII.35 First ten sequences producing significant
alignments with SPA2-223. 160
Figure AII.36 Alignment of Query sequence with:
gb|AY206682.1| Homo sapiens surfactant, pulmonary-associated protein A2 (SFTPA2) gene, complete cds.
161
Figure AII.37 Sequence of PCR product amplified for SPD-11.
The PCR product length was expected to be 200 bp but sequencing reported 174 bp.
162
Figure AII.38 Parameters from BLAST search with SPD-11
sequence. 162
Figure AII.39 First ten sequences producing significant
alignments with SPD-11. 162
Figure AII.40 Alignment of Query sequence with:
gb|AY216721.1| Homo sapiens surfactant, pulmonary-associated protein D (SFTPD) gene, complete cds.
163
Figure AII.41 Sequence of PCR product amplified for SPD-160.
The PCR product length was expected to be 577 bp but sequencing reported 547 bp.
164
Figure AII.42 Parameters from BLAST search with SPD-160
sequence. 164
Figure AII.43 First ten sequences producing significant
alignments with SPD-160. 164

List of Figures xx
Figure AII.44 Alignment of Query sequence with: gb|AY216721.1| Homo sapiens surfactant, pulmonary-associated protein D (SFTPD) gene, complete cds.
165
xxi
LIST OF ABBREVIATIONS
AOM Acute Otitis Media
bp Base Pairs
DNA Deoxyribonucleic Acid
DNase Deoxyribonuclease
dNTP Deoxynucleotide Triphosphate
dsDNA Double-stranded DNA
E. coli Escherichia coli
EDTA Ethylenediaminetetraacetic Acid
g Relative Centrifugal Force
H. influenzae Haemophilus influenzae
hr Hour(s)
kb Kilobase(s)
kDa Kiladalton(s)
l Litre(s)
M Molar
mA Milliamp(s)
Mb Megabase(s)
M. catarrhalis Moraxella catarrhalis
mRNA Messenger Ribonucleic Acid
mg Milligram(s)
mi Minor allele
Mj Major allele
ml Milliliter(s)
mM Millimolar
MQ-H2O Milli-Q (Millipore) filter-purified water (at least
15 megaohms resistance)
List of Abbreviations xxii
OD Optical Density
OM Otitis Media
OME Otitis Media with Effusion
PCR Polymerase Chain Reaction
PEG Polyethylene Glycol
RAOM Recurrent Acute Otitis Media
RBC Red Blood Cell
RNA Ribonucleic Acid
rpm Revolutions per Minute
SB Sodium Borate
SNP Single Nucleotide Polymorphism(s)
SP Surfactant Protein
S. pneumoniae Streptococcus pneumoniae
TE Tris-EDTA
Tm Melting Temperature
Tris Tris (hydroxymethyl) amino-methane
U Units of enzyme
μg Microgram(s)
μl Microlitres(s)
w/v Weight per Volume

xxiii
LIST OF ABBREVIATIONS FOR
COMMERCIAL SUPPLIERS
AB Ltd Advanced Biotechnologies Ltd., Surrey,
UK
Ajax Chemicals Ajax Chemicals, Ltd., Sydney, Australia
Axygen Axygen Scientific, Inc., Union City, CA,
USA
Barnstead Barnstead International, Dubuque, Iowa,
USA
BD BD Diagnostics, Franklin Lakes, NJ, USA
Chiltern Chiltern Scientific, Auckland, New
Zealand
COHU COHU, Inc., San Diego, CA, USA
Corbett Research Corbett Research, Mortlake, NSW,
Australia
Eppendorf Eppendorf AG, Hamburg, Germany
Invitrogen Invitrogen Corporation, Carlsbad, CA,
USA
Labinco Labinco B. V., DG Breda, The
Netherlands
Life Technologies Life Technologies, Gaithersburg, MD, USA
MJ Research MJ Research, Inc., Waltham, MA, USA
Nanodrop Nanodrop Technologies Wilmington, BE,
USA
Owl Owl Separation Systems, Portsmouth,
NH, USA

List of Abbreviations for Commercial Suppliers xxiv
Roche Roche Diagnostics GmbH, Mannheim,
Germany
Sigma-Aldrich Sigma-Aldrich Corporation, Saint Louis,
MO, USA
Sony Sony Corporation, Tokyo, Japan
USB USB Corporation, Cleveland, Ohio, USA
1
CHAPTER ONE
INTRODUCTION AND LITERATURE
REVIEW
1.1 Otitis Media
Otitis Media (OM) is one of the most common childhood diseases
and is responsible for the majority of doctor’s visits, antibiotic
treatment, and related surgery for children in developed
countries (Freid et al., 1998). Acute otitis media is characterized
by rapid onset of inflammation of the middle ear and the
presence of middle ear fluid, often coupled with an inflamed
and/or bulging tympanic membrane (eardrum). Recurrent acute
otitis media (RAOM) is regarded as at least three or four
episodes of acute otitis media in the past six or twelve months,
respectively. Evidence of serous or mucoid fluid in the middle
ear, without acute symptoms, is characteristic of otitis media
with effusion (New Zealand District Health Board, 2004).
Otitis media often occurs secondary to respiratory infections and
is mostly caused by bacterial and viral infections that start in the
nasopharynx and rapidly spread through to the Eustachian tube
and the middle ear cavity (Kodama et al., 2005) as depicted in
Figure 1.1. Streptococcus pneumoniae, Haemophilus influenzae,
and Moraxella catarrhalis are the most common bacterial
pathogens responsible for otitis media, while respiratory
syncytial virus and rhinovirus are the most predominant viral

Chapter One: Introduction and Literature Review 2
contributors (Chonmaitree et al., 2000; Pitkaranta et al., 1998a,
1998b, 1998c).
Outer Ear Inner EarMiddle Ear
Eustachian TubeEardrum (Tympanic Membrane)
Outer Ear Inner EarMiddle Ear
Eustachian TubeEardrum (Tympanic Membrane)
Figure 1.1. Location of the middle ear cavity and Eustachian tube within the human auditory system. Diagram adapted from Regional Hearing Services Ltd
(2006).
During infection, the mucosa of the middle ear undergoes
extensive hyperplasia where the monolayer of mostly simple
squamous epithelium is transformed to a pseudostratified
respiratory epithelium by the addition of cells, including goblet
and ciliated cells (Ryan et al., 2005). Otitis media with effusion
(OME) occurs when the mucociliary clearance system provided
by the Eustachian tube becomes defective.
Normally, the Eustachian tube clears the pathogen-binding
mucus secretions produced by mucosal epithelial cells into the
neighbouring nasopharynx, maintaining a healthy environment in
the middle ear. However, when this system is compromised,

Chapter One: Introduction and Literature Review 3
mucus production continues and builds up within the middle ear
cavity (e.g. ‘glue-ear’) often causing conductive hearing loss
(Ryan et al., 2005). Current management of these conditions
includes repeated courses of antibiotics and often operations to
drain fluid and ventilate the middle ear.
OME has been implicated in hearing loss which often occurs
during the most critical stage of language development in
childhood (National Audiology Centre, 2003). In New Zealand,
the conductive hearing loss associated with bilateral OME has
been shown to have a significant impact on language and speech
development, reading ability, and classroom behaviour in
children up to eleven years old (Chalmers et al., 1989). Results
from the Dunedin Multidisciplinary Health and Development
Study (1996) calculated that nearly 20% of New Zealand five
year olds exhibited OME in at least one ear.
A New Zealand hearing screening programme carried out
between July 2001 – June 2002, found that the overall failure
rates of tympanometry tests for new school entrants and three
year olds were both 7.8%. However, three year old Pacific Island
and Maori children had significantly higher failure rates compared
to their European counterparts with 14.9% and 11.8%
respectively. Maori and Pacific Island new school entrants had
12.1% and 17.1% failure rates (National Audiology Centre,
2003). Additionally, a recent longitudinal study of Pacific Island
children living in New Zealand revealed that approximately 25%
of Pacific Island 2 year olds suffered from acute otitis media or
OME (Paterson et al., 2006).
A variety of factors contribute to the pathogenesis of otitis media
including: age, bacterial and viral exposure, innate and adaptive
Chapter One: Introduction and Literature Review 4
immunity status, Eustachian tube structure and function (Zheng
et al., 2006). A range of environmental factors such as day care,
season of year, older siblings, parental smoking,
housing/crowding, and breast feeding influence an individual’s
level of pathogen exposure and immunity (Homoe et al., 1999;
Rovers et al., 2004). Additionally, compelling evidence presented
by Casselbrant et al (1999) suggested that otitis media
susceptibility is genetically inherited. In their twin and triplet
study, a significantly higher concordance rate of OME in
monozygotic twins compared with dizygotic twins was observed.
1.2 Surfactant
In the lungs, a lipoprotein surfactant is synthesized to reduce the
surface tension at the alveolar air-liquid interface and
consequently prevents the lungs from collapsing. Pulmonary
surfactant is composed of phospholipids (80%), cholesterol
(~10%), and four surfactant proteins (~10%): SP-A, SP-B, SP-
C, and SP-D (McGuire, 2002). This surfactant and its associated
proteins have also been found to be present in many other
tissues, including oral epithelium; gastric and intestinal
mucosae; mesothelial tissues; synovial cells; salivary glands;
pancreas; reproductive and urinary tracts; Eustachian tube and
middle ear mucosae (Bourbon and Chailley-Heu, 2001; Dutton et
al., 1999).
Phosphatidylcholine (PC) was found by Paananen and colleagues
(2002) to be the main phospolipid in both Eustachian tube
lavage fluid (ETLF) and bronchoalveolar lavage fluid (BALF).
However, the molecular species of PC in each location was
different: palmitoyloleoyl PC was the most prevalent in ETLF, and

Chapter One: Introduction and Literature Review 5
dipalmitoyl PC in BALF. This difference corresponded with a
significantly reduced efficiency of the ETLF for lowering surface
tension, suggesting that another function predominates for
Eustachian tube surfactant.
Eustachian tube epithelium is morphologically similar to lower
airway epithelium and specialized microvillar epithelial cells have
been identified which express and secrete the surfactant
proteins, facilitated by cytoplasmic electron-dense granules,
homologous to those seen in Type II pneumocytes located in
pulmonary alveoli (Paananen et al., 2001). Evidence for the
presence of SP-A and SP-D has been provided by in situ
hybridization, reverse-transcriptase polymerase chain reaction
(RT-PCR), electron microscopy, and immunoelectron microscopy
(Dutton et al., 1999; Paananen et al., 1999, 2001; Yamanaka et
al, 1991). In addition, SP-A was found to be the most abundant
surfactant protein in the middle ear, as also seen in pulmonary
surfactant (Paananen et al., 2001).
SP-B and SP-C are hydrophobic proteins that are essential for
lowering surface tension in the lungs by enhancing adsorption
and spreading of surfactant phospholipids at the air-liquid
interface (Nogee, 1998). A SP-B deficiency that occurs frequently
in premature babies typically leads to lethal neonatal respiratory
disease (Floros et al., 1995). Detection of SP-B and SP-C mRNAs
in the middle ear has been performed with RT-PCR, however the
presence of these proteins in the middle ear has not been
confirmed and it has been proposed that they are lung-specific
(Dutton et al., 1999).

Chapter One: Introduction and Literature Review 6
1.2.1 Structure of SP-A and SP-D
In contrast, SP-A and SP-D are hydrophilic proteins and belong
to the collectin family of calcium-dependent carbohydrate
binding proteins, which also includes mannose-binding lectin
(MBL) and conglutinin (Floros et al., 1998; Crouch et al., 2001).
Members of the collectin family are characterised by N-terminal
collagen-like domains and C-terminal carbohydrate recognition
domains (CRD) which allows them to bind to various types of
macromolecules, including carbohydrates, phospholipids, and
proteins (Shepherd, 2002).
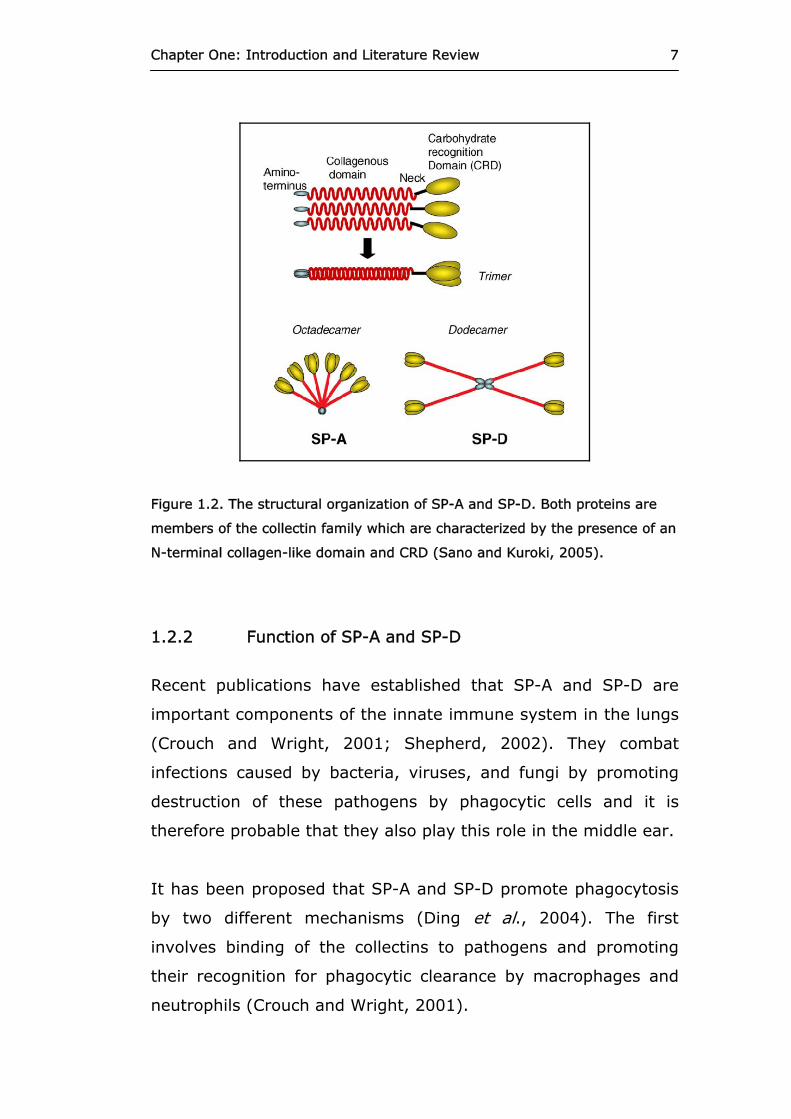
Both SP-A and SP-D are oligomers of trimeric subunits (Crouch,
2000, 2001) as illustrated in Figure 1.2. SP-A has ‘bouquet-like’
oligomers of the closely related chains SP-A1 and SP-A2,
arranged as octadecamers with closely spaced CRDs (20nm).
Both SP-A1 and SP-A2 protein molecules consist of 248 amino
acids (aa) and usually only differ within the collagen-like domain:
Met66, Asp73, Ile81, and Cys85 for SP-A1, and Thr66, Asn73, Val81,
and Arg85 for SP-A2 (Karinch and Floros, 1995).
SP-D (375 aa) exists as a dodecamer, with more widely spaced
CRDs (100nm). Spacing between the CRDs in SP-D is five times
greater than for SP-A, possibly contributing to the greater ability
of SP-D to aggregate microbial ligands (Shepherd, 2002).
Chapter One: Introduction and Literature Review 7
Figure 1.2. The structural organization of SP-A and SP-D. Both proteins are
members of the collectin family which are characterized by the presence of an
N-terminal collagen-like domain and CRD (Sano and Kuroki, 2005).
1.2.2 Function of SP-A and SP-D
Recent publications have established that SP-A and SP-D are
important components of the innate immune system in the lungs
(Crouch and Wright, 2001; Shepherd, 2002). They combat
infections caused by bacteria, viruses, and fungi by promoting
destruction of these pathogens by phagocytic cells and it is
therefore probable that they also play this role in the middle ear.
It has been proposed that SP-A and SP-D promote phagocytosis
by two different mechanisms (Ding et al., 2004). The first
involves binding of the collectins to pathogens and promoting
their recognition for phagocytic clearance by macrophages and
neutrophils (Crouch and Wright, 2001).
Chapter One: Introduction and Literature Review 8
Both SP-A and SP-D are positively-charged proteins that can
bind to lipopolysaccharide (LPS), a negatively-charged cell wall
component of all gram-negative bacteria, which consists of core
oligosaccharides, an amphipathic lipid A domain, and a variable
O-antigen polysaccharide domain. The C-terminal domains of SP-
A and SP-D interact in a Ca2+ and Na+ dependent manner with
LPS at the lipid A domain and the core oligosaccharides/O-
antigen domain, respectively, (Kalina et al., 1995; Sano et al.,
1999; Van Iwaarden et al., 1994). In addition, it was observed
that SP-D uses its CRD to bind to lipoteichoic acid (LTA) and
peptidoglycan (PepG) in a calcium-dependent manner. LTA and
PepG are major cell wall components of gram-positive bacteria
which can induce an inflammatory response and in some cases,
initiate septic shock (van der Wetering et al., 2001). In the same
study, SP-A did not bind to LTA or PepG in a specific manner, but
it was hypothesized that the protein may interact with other
glycoconjugates present on the cell wall surface.
Numerous in vitro and in vivo studies have examined the
interactions between SP-A and SP-D with microbial pathogens
including H. influenzae, S. pneumoniae, Influenza A virus, and
respiratory syncytial virus, confirming that they can be bound,
aggregated, and promoted for phagocytosis by the collectins
(Crouch et al., 1998, 2000, 2001).
SP-D was also found to aggregate and/or bind to several
bacterial strains of E. coli, Salmonella enterica and S.
pneumoniae significantly greater than the other collectin family
members MBL and conglutinin (Hartshorn et al., 2002). Jounblat
and associates (2004) used enzyme-linked immunosorbent assay
(ELISA) to examine the interaction between SP-D and S.

Chapter One: Introduction and Literature Review 9
pneumoniae and found that both recombinant truncated SP-D
and native full-length SP-D bound to all strains of bacteria.
One study using SP-A null mice found delayed pulmonary
clearance of H. influenzae and respiratory syncytial virus (LeVine
and Whitsett, 2001). However, the addition of purified SP-A
enhanced the binding and uptake of respiratory syncytial virus
by peripheral blood monocytes and alveolar macrophages (Barr
et al., 2000). Furthermore, they found SP-A also had an effect
on the macrophage production of the pro-inflammatory cytokine,
tumour necrosis-factor alpha, and the anti-inflammatory
cytokine, interleukin 10.
The second mechanism by which SP-A and SP-D may facilitate
destruction of pathogens involves a direct interaction between
SP-A or SP-D and the phagocytic cells themselves, stimulating
their activity. Schagat and co-workers (2001) determined that
SP-A and SP-D could bind to polymorphonuclear neutrophils
(PMNs), which are recruited to a specific site of infection and
undergo apoptosis, which dramatically increases their
phagocytosis by resident macrophages. Furthermore,
intrapulmonary administration of truncated human recombinant
SP-D also reduced the amount of apoptotic and necrotic alveolar
macrophages in a SP-D null mouse model (Clark et al., 2002).
Enhanced removal of apoptotic macrophages in an area of
inflammation, e.g. Otitis media, is necessary for returning the
affected tissue back to normal, as extended exposure to the
expelled components of apoptosis can prolong inflammation and
hinder the healing process (Matalon and Wright, 2004).
In addition, there has been evidence to suggest that SP-A and
SP-D may also interact and/or stimulate members of the
Chapter One: Introduction and Literature Review 10
adaptive immune system. Both native and recombinant forms of
SP-A and SP-D were shown to interact with recombinant Toll-
like receptors (TLR) 2 (Murakami et al., 2002) and TLR4 (Ohya
et al., 2006), which detect specific pathogen associated
molecular patterns (PAMPS) and modulate cytokine expression
(Bohlson et al., 2007). Nadesalingam and colleagues (2005)
employed ELISA to reveal that SP-D binds to various types of
immunoglobulins, including secretory-IgA, IgE, IgG, and IgM. It
was also determined that SP-D binds to IgG in a calcium-
dependent manner, aggregates IgG-coated beads and enhances
their phagocytosis by mouse-derived macrophages. These
results therefore suggest SP-D as a mediator of the innate and
adaptive immune systems.
Overall, the literature provides evidence that both SP-A and SP-
D facilitate the destruction of various bacteria and viruses that
are commonly known to cause otitis media in the middle ear. Not
only do these collectins contribute to innate immunity in the
middle ear but they also interact with the adaptive immune
system in order to alleviate infection and inflammation in an
attempt to restore tissue homeostasis.
1.2.3 SP-A and SP-D genes
The human SP-A locus has two functional, highly homologous
genes (SP-A1 and SP-A2) in opposite transcriptional orientation
with one pseudogene between these two genes. They are all
located at chromosome 10q22-q23 in a cluster along with the
SP-D and MBL genes (Kishore et al., 2006) as shown in Figure
1.3.

Chapter One: Introduction and Literature Review 11
Physical and radiation hybrid mapping has provided evidence
that SP-A1, SP-A2, SP-D, and the SP-A pseudogene (MBL1P1)
are in linkage disequilibrium (Floros et al., 1996; Hoover and
Floros, 1998).
Interestingly, baboons are the only other species to have two
SP-A genes, whilst all other mammals have only one SP-A gene.
Floros and colleagues (1993, 2005) speculated that gene
duplication may have occurred approximately 26 million years
ago due to greater demands imposed upon the organism as a
consequence of an increasing number of pathogens, irritants and
other environmental challenges.
In contrast to previous publications, the latest reference copy of
the human genome shows two copies of both SP-A1 and SP-A2
approximately 300kb apart, but only a single copy of SP-D
(Ensemble Human, release 40). This evidence suggests that
individuals may have different gene copy numbers of SP-A1 and
SP-A2, possibly leading to gene dosage effects. However, the
effects of SP-A1 and SP-A2 copy number variations on the
expression of these genes, and any association with disease, has
not yet been investigated.
Chapter One: Introduction and Literature Review 12
Figure
1.3
. O
rgan
izat
ion o
f th
e hum
an S
P-A1,
SP-
A2,
and S
P-D
gen
es a
t 10q22.
The
two
SP-
A g
enes
(SFT
PA1
and S
FTPA
2) a
re
adja
cent
to e
ach o
ther
(se
par
ated
by
~50kb
), w
hile
SFT
PD i
s lo
cate
d ~
315kb
dow
nst
ream
fro
m S
FTPA
1. A
pse
udog
ene,
MBL1
P1
(man
nose
-bin
din
g l
ectin p
rote
in A
1 p
seudogen
e) i
s pre
sent
bet
wee
n S
FTPA
1 an
d S
FTPD
, ap
pro
xim
atel
y 14kb
upst
ream
of
SFT
PD
(Kis
hor
e et
al.,
2006)

Chapter One: Introduction and Literature Review 13
1.2.4 Association of SP-A and SP-D with disease
Some alterations in SP-A1, SP-A2, and SP-D are known to be
associated with a range of pulmonary diseases. For example, it
was determined that a methionine at amino acid position 11 in
SP-D (Lahti et al., 2002) and a lysine at residue 223 in SP-A2
(Lofgren et al., 2002) are associated with severe infection by
respiratory syncytial virus, a common respiratory tract pathogen
of infancy.
Saxena and co-workers (2003) identified two exonic and two
intronic polymorphisms in the collagen region of SP-A1 and SP-
A2 that were significantly associated with increased risk of
allergic bronchopulmonary aspergillosis. A tryptophan at amino
acid position 219, instead of arginine in SP-A1, was found to be
significantly related to the development of idiopathic pulmonary
fibrosis (Selman et al., 2003).
Certain genetic variants of SP-A1 and SP-A2 were
overrepresented in premature infants with respiratory distress
syndrome, a major cause of newborn mortality and morbidity
(Ramet et al., 2000). Similar results were obtained by Seifart
and colleagues (2005) who found that some SP-A1/SP-A2
variants were associated with risk for pulmonary cancer,
including small cell lung carcinoma, adenocarcinoma, and
squamous cell carcinoma.
In addition, specific SP-A1, SP-A2, and SP-D alleles correlated
with increased or decreased risk for tuberculosis (Floros et al.,
2000), and decreased levels of the proteins have been detected
in the lungs of patients with cystic fibrosis (Postle et al., 1999).
Chapter One: Introduction and Literature Review 14
This observation may explain the compromised pulmonary innate
immunity commonly seen in cases of cystic fibrosis.
A recent study investigated the distribution of polymorphisms in
SP-A1, SP-A2, and SP-D among patients diagnosed with
meningococcal disease (Jack et al., 2006). They found that a
lysine instead of a glutamine at amino acid position 223 of SP-A2
was associated with increased risk of meningococcal disease.
However, variations in SP-A1 and SP-D were not associated with
increased or decreased risk of the disease.
This research project proposes that any unfavourable change in
the ability of SP-A and SP-D to deal with the pathogens
previously discussed, and others, may predispose an individual
to middle ear infections and persistent middle ear effusions.
Such a change could occur within the protein’s coding DNA,
where a single nucleotide substitution may result in an altered
protein primary sequence, thus affecting the protein’s ability to
bind and aggregate its targets.
1.3 Genetic diversity of SP-A and SP-D
Human SP-A1 and SP-A2 exhibit extensive genetic heterogeneity
across individuals (Floros et al., 2005). This has been seen in the
range of 5’ untranslated exon splice variants, sequence
variability in the 3’ untranslated region (UTR), and single
nucleotide polymorphisms in the coding regions. Karinch and
Floros (1995) investigated the alternative splicing of the four 5’
UTR exons (A-D) in SP-A1 and SP-A2, and found that all possible
variants for both genes were translated in vivo. However, the
relative levels and translation efficiency of the splice variants
differed amongst individuals, with AD’ presenting as the most

Chapter One: Introduction and Literature Review 15
frequent splice variant for SP-A1 and ABD for SP-A2. Wang and
co-workers (2005) later found that 5’ UTR splice variants of SP-
A1 and SP-A2 also modulate mRNA stability, with four specific
variants enhancing gene expression. In addition, sequence
variations in the 3’ UTR were also found to influence the
expression of SP-A1 and SP-A2 (Wang et al., 2003). However, 5’
UTR splice variants and 3’ UTR sequence variants of SP-D, and
their influence on expression and translation have not yet been
fully characterized.
SP-A1, SP-A2, and SP-D have all been found to be polymorphic
(Liu et al., 2003; Pantelidis et al., 2003). Gelehrter and
colleagues (1990) considered a particular locus to be
polymorphic if the less frequent allele has a population frequency
of no less than 1%, and a heterozygosity frequency of at least
2%. Single nucleotide polymorphisms (SNPs) occur when a
single nucleotide (purine or pyrimidine) in a DNA sequence is
substituted with a different nucleotide. A SNP may either result
in a synonymous or non-synonymous amino acid substitution,
where the amino acid coded for is the same or different,
respectively (Crawford and Nickerson, 2005).
The linkage of SP-A1, SP-A2, SP-D, and MBL1P1 allows for all the
polymorphisms to be assembled into haplotypes: combinations
of alleles of different SNPs along the same chromosome which
can be inherited as a unit (Crawford and Nickerson, 2005). As
Homo sapiens are diploid, each individual has two haplotypes for
a particular part of their genome, corresponding to the paternal
and maternal chromosomes. The SNP loci making up a particular
haplotype on a chromosome will be passed on from parent to
offspring as a unit unless separated by recombination.
Chapter One: Introduction and Literature Review 16
The probability of recombination occurring within a haplotype
partially depends on the physical distance between the SNP loci.
Closely spaced loci are therefore less likely to be separated and
are described as being in linkage disequilibrium. Consequently, if
the genotype of one SNP is known, the genotype of another SNP
may be predicted if there is a high level of linkage disequilibrium
between the two SNPs.
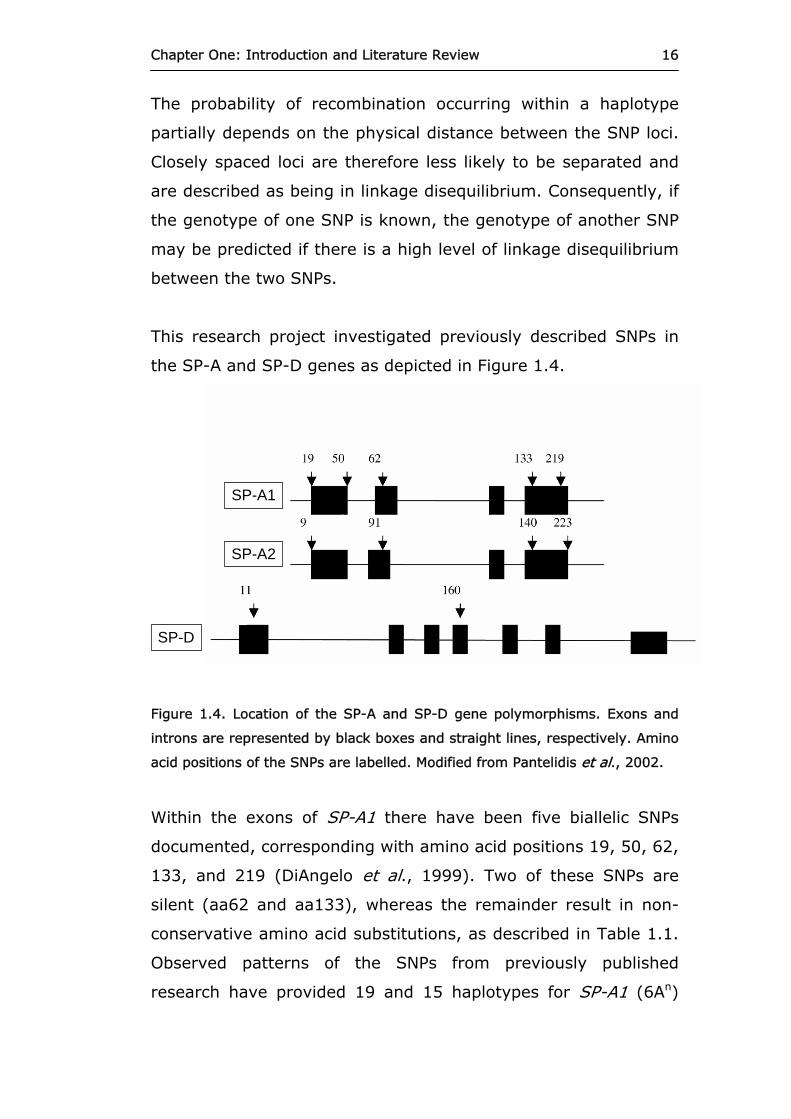
This research project investigated previously described SNPs in
the SP-A and SP-D genes as depicted in Figure 1.4.
SP-A1
SP-A2
SP-D
Figure 1.4. Location of the SP-A and SP-D gene polymorphisms. Exons and
introns are represented by black boxes and straight lines, respectively. Amino
acid positions of the SNPs are labelled. Modified from Pantelidis et al., 2002.
Within the exons of SP-A1 there have been five biallelic SNPs
documented, corresponding with amino acid positions 19, 50, 62,
133, and 219 (DiAngelo et al., 1999). Two of these SNPs are
silent (aa62 and aa133), whereas the remainder result in non-
conservative amino acid substitutions, as described in Table 1.1.
Observed patterns of the SNPs from previously published
research have provided 19 and 15 haplotypes for SP-A1 (6An)

Chapter One: Introduction and Literature Review 17
and SP-A2 (1An), respectively (DiAngelo et al., 1999). However,
only four SP-A1 haplotypes and six SP-A2 haplotypes made up
almost 99% of the haplotypes present in the Finnish population
(Hoover and Floros, 1998; Rämet et al., 2001).
Amino Acid No
Haplotype 19 50 62 133 219
6A C C G G C
6A2 T G A A C
6A3 T C A A C
6A4 T C G A T
GCG
(Ala)
GTG
(Val)
CTC
(Leu)
GTC
(Val)
CCG
(Pro)
CCA
(Pro)
ACG
(Thr)
ACA
(Thr)
CGG
(Arg)
TGG
(Trp)
Table 1.1. Single Nucleotide Polymorphisms and amino acid differences in SP-
A1. The amino acid number in SP-A1 and their corresponding nucleotide
changes are shown. Both possible codons are shown at the bottom with the
encoded amino acid. Modified from Floros et al (2005).
Within the SP-A2 there are three exonic SNPs which result in a
non-synonymous amino acid change: aa9, aa91, aa223. While at
aa140, a synonymous change can occur (Table 1.2).

Chapter One: Introduction and Literature Review 18
Amino Acid No
Haplotype 9 91 140 223
1A C C C C
1A0 A G C C
1A1 C G T A
1A2 C G C C
1A3 A G T A
1A5 C C T C
AAC
(Asn)
ACC
(Thr)
CCT
(Pro)
GCT
(Ala)
TCC
(Ser)
TCT
(Ser)
CAG
(Gln)
AAG
(Lys)
Table 1.2. Single Nucleotide Polymorphisms and amino acid differences in SP-
A2. The amino acid number in SP-A2 and their corresponding nucleotide
changes are shown. Both possible codons are shown at the bottom with the
encoded amino acid. Modified from Floros et al (2005).
In comparison, DiAngelo and colleagues documented only two
SNPs (Table 1.3) in SP-D that result in non-synonymous amino
acid changes located at aa11 (Threonine to Methionine) and
aa160 (Threonine to Alanine).
Amino Acid No
Allele 11 160
Major T G
Minor C A
Table 1.3. Single Nucleotide Polymorphisms in SP-D.
Interestingly, recent research has indicated that differential allele
expression of SP-A1, SP-A2, and SP-D occurs in a tissue-specific

Chapter One: Introduction and Literature Review 19
manner (Lin and Floros, 2002; Lin et al, 2004). All three genes
exhibited balanced biallelic expression in lung tissue, but
imbalanced biallelic expression in middle ear tissue of
heterozygous rats. These findings demonstrate further
complexity to the genes’ already existing genetic variability.
1.3.1 SP-A Haplotypes
A previous study by Rämet et al. (2001) reported a difference in
the frequencies of specific SP-A haplotypes between Finnish
children diagnosed with recurrent otitis media and a control
population. Using a PCR/restriction fragment length
polymorphism technique to detect the SNPs in SP-A1 and SP-A2,
they found an over-representation of the 6A4-1A5 haplotype
within the recurrent otitis media patients. A subset of infants
who had their first diagnosed case of acute otitis media before
the age of six months also had an under-representation of the
6A2-1A0 haplotype. In addition, the frequency of the homozygous
SP-A1 haplotype 6A2/6A2 was significantly greater in the case
population than the control population.
However, contrasting findings were presented by Pettigrew and
co-workers (2006) in an American population. Amongst a subset
of American-Caucasian infants, the 6A4-1A5 haplotype was
protective against Otitis media, corresponding with a 76%
reduced risk during the first twelve months of life. They also
determined that the SNP at codon 19 in the SP-A1 gene was
associated with prevalence of otitis media. An alanine at position
19 corresponded with a significantly greater chance of otitis
media within the first year of life.
Chapter One: Introduction and Literature Review 20
The allele and haplotype frequencies for SP-A1, SP-A2, and SP-D
within a New Zealand population are currently unknown. Given
that the prevalence of RAOM/OME is a significant problem in
European-Caucasian children, and even more so in New Zealand
Maori and Pacific Island children, it is important to characterize
whether changes in an individual’s SP-A and SP-D are associated
with their susceptibility to RAOM/OME.
1.4 Genetic Techniques and Data Analysis
The present research project investigated the association of the
eleven previously described SNPs in SP-A1, SP-A2, and SP-D, as
single markers (SNPs) and as haplotypes, in patients who
presented with recurrent acute OM (RAOM) and/or OM with
effusion (OME) at Waikato Hospital (Hamilton, New Zealand).
Volunteers donating blood at the New Zealand Blood Service
(Waikato) Donor Centre comprised the control group for the
study.
Using allele-specific primers and real-time polymerase chain
reaction (PCR) with SYBR® Green I melting curve analysis, DNA
samples from patients undergoing surgery for RAOM/OME were
screened for the minor and/or major alleles for each SNP.
Genotype and haplotype frequencies for both populations were
calculated and compared.
1.4.1 Real-time PCR
Real-time PCR is a rapid and high-throughput molecular
technique for amplification of a particular region of DNA between
Chapter One: Introduction and Literature Review 21
two predetermined positions, and is distinguished by its high
level of sensitivity. The chemistry of PCR results from the action
of the enzyme DNA Taq polymerase, originating in the
thermophile Thermus aquaticus, a bacterium that inhabits hot-
springs and therefore expresses heat-stable enzymes.
DNA amplification is facilitated by the addition of Taq polymerase
to a reaction mix containing template DNA and primers
(oligonucleotides) complementary to sequences flanking either
side of the target region. The reaction is then exposed to a
program of temperature cycles as described below:
The first cycle begins with an initial denaturation step at a high
temperature which promotes the double stranded DNA (dsDNA)
to dissociate into single strands. The temperature is reduced to a
level less than the melting temperature of the primers to allow
for annealing.
The annealing step facilitates the hybridization of the primers to
their complementary sequences on the single stranded template
DNA. The allele-specific primers used in this present study were
designed with the 3’ end nucleotide complementary to the
nucleotide variants at a particular SNP location.
In order to circumvent the appearance of spurious smaller sized
amplicons in the PCR product spectrum, Don et al. (1991)
devised a simple strategy that involved increasing the annealing
temperature of the PCR. Their proposed solution assumed that
the problem was due to mispriming by one or both of the
oligonucleotide primers with the target template or with each
other; and due to their smaller size these are preferentially
amplified, with the effects compounding during reaction cycling.
Chapter One: Introduction and Literature Review 22
This also suggests that the mispriming annealings are less stable
than the specific ones due to different degrees of mismatch.
Don et al. proposed that any difference in the melting
temperature between the incorrect and the correct annealings
would give an advantage of 2x/cycle, or 4x/°C, to the correct
product, all else being equal. By initially increasing the annealing
temperature to 10°C greater than the expected annealing
temperature, followed by a reduction (‘touchdown’) of 1°C per
cycle for 11 cycles (e.g. 65-55°C), the correct product will be
amplified before the smaller, spurious product, therefore
obtaining a competitive edge that will be maintained for the rest
of the thermal cycling.
Following the touchdown annealing step, the temperature is
raised to the optimum temperature for Taq polymerase activity,
where the enzyme uses the primers as starting points for
synthesising DNA complementary to the region specified. The
heating/cooling steps are repeated for approximately 40 cycles
and, theoretically, at the end of each cycle the number of DNA
strands containing the target sequence should have doubled,
resulting in millions of copies of the region of interest.
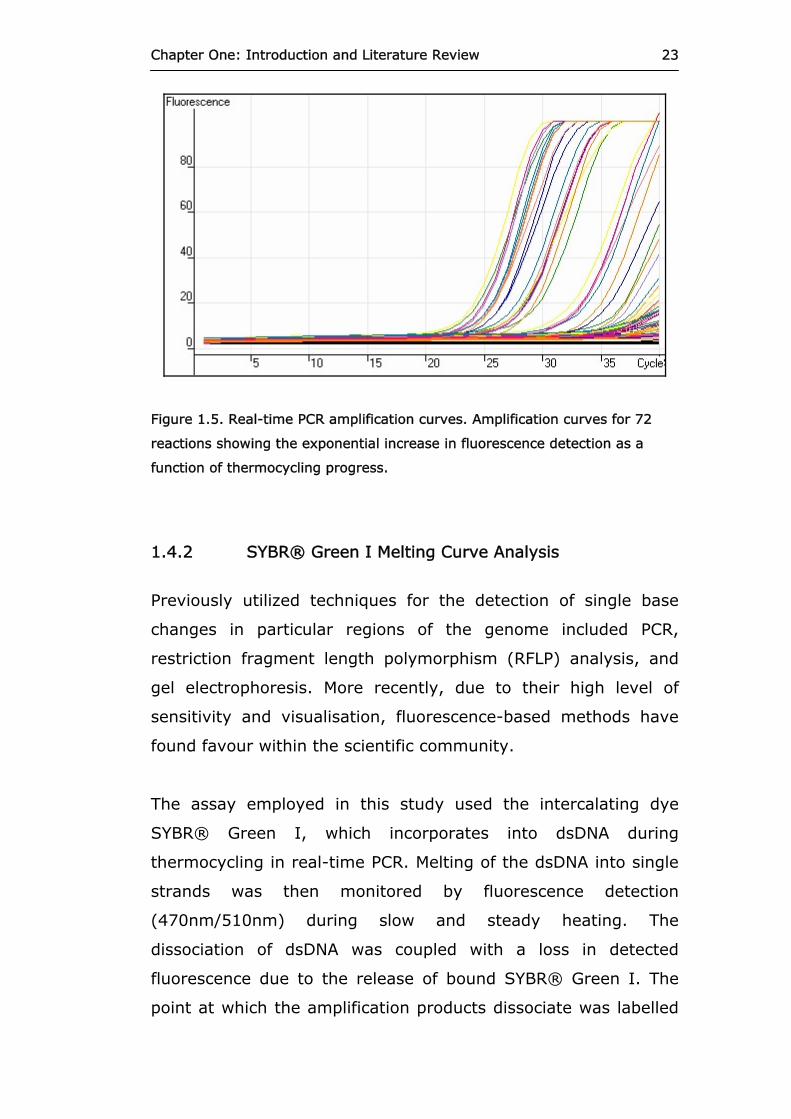
The addition of a fluorescent dye which binds to dsDNA (e.g.
SYBR® Green I) to the reaction allows the researcher to observe
the amplification of the target sequence in real-time, given that
the accumulation of fluorescence is proportional to the
accumulation of amplification products (Higuchi et al., 1993) as
shown in Figure 1.5.
Chapter One: Introduction and Literature Review 23
Figure 1.5. Real-time PCR amplification curves. Amplification curves for 72
reactions showing the exponential increase in fluorescence detection as a
function of thermocycling progress.
1.4.2 SYBR® Green I Melting Curve Analysis
Previously utilized techniques for the detection of single base
changes in particular regions of the genome included PCR,
restriction fragment length polymorphism (RFLP) analysis, and
gel electrophoresis. More recently, due to their high level of
sensitivity and visualisation, fluorescence-based methods have
found favour within the scientific community.
The assay employed in this study used the intercalating dye
SYBR® Green I, which incorporates into dsDNA during
thermocycling in real-time PCR. Melting of the dsDNA into single
strands was then monitored by fluorescence detection
(470nm/510nm) during slow and steady heating. The
dissociation of dsDNA was coupled with a loss in detected
fluorescence due to the release of bound SYBR® Green I. The
point at which the amplification products dissociate was labelled

Chapter One: Introduction and Literature Review 24
the melting temperature (Tm) and is a function of the product
sequence properties (i.e. GC%) and length.
The fluorescence data obtained was subsequently translated into
melting curves by removal of background fluorescence and any
confounding influence of temperature on fluorescence, then
plotted (Figure 1.6) as the negative derivative of fluorescence, -
dF, with reference to temperature, T, (Ririe et al., 1997).

Chapter One: Introduction and Literature Review 25
A
B
Major Allele
Minor Allele
Figure 1.6. SYBR® Green I melting curves. A) Melting curves for an individual
whose genome was screened for both the major (red) and minor (blue) alleles
for a particular SNP. The presence of a peak at the appropriate melting
temperature (~90°C) for the major allele, but not for the minor allele
indicates that the individual is homozygous for the major allele. B) Melting
curves for an individual which show detection of both the major and minor
alleles for the SNP; both reactions show a PCR product peak with a melting
temperature of 90°C, thus suggesting heterozygosity. The amplified target
regions for both alleles differ by only one nucleotide, therefore they have
similar melting temperatures and the peaks are almost perfectly
superimposed.
1.4.3 Haploview
The characterization of haplotypes in the human genome and
their association with specific diseases has become a standard

Chapter One: Introduction and Literature Review 26
tool of many medical association studies in recent years. This
has since led to the establishment of the Human Haplotype Map
project (HapMap) which allows for genotype data to be available
to all medical genetics researchers (International HapMap
Consortium, 2003).
Raw genotype data from both the case group and the control
group for SP-A1, SP-A2, and SP-D were analyzed, interpreted,
and visualized using the software package, Haploview (Barrett et
al., 2005). Haploview calculated linkage disequilibrium
information, constructed haplotypes, and estimated population
allele and haplotype frequencies. Further analysis involved
simple χ2 tests for each single marker and subsequent
haplotypes. The program is freely available as an open source
project (http://sourceforge.net/projects/haploview/).
1.4.4 PolyPhen
The potential effect of each non-synonymous SNP on SP-A1, SP-
A2, or SP-D’s protein structure and function was predicted using
the PolyPhen (Polymorphism Phenotyping) server
(http://www.bork.embl-heidelberg.de/PolyPhen/). PolyPhen
analyzes the amino acid change by investigating 3D protein
structures, multiple alignments of homologous sequences, and
amino acid contact information from a range of protein structure
databases, and then estimates position-specific independent
counts (PSIC) scores for each of the two variants (major and
minor). The difference in the PSIC scores between the two
variants is then calculated. The greater the PSIC score
difference, the greater the putative functional effect the amino
acid change will have on the protein (Ramensky et al., 2002).

Chapter One: Introduction and Literature Review 27
From this information, any association between allele/haplotype
frequencies and their functional effects was investigated.
Chapter One: Introduction and Literature Review 28
1.5 Study Objectives
1.5.1 Objective One
Investigate whether a significant difference in population allele
and haplotype frequencies, for all eleven markers in SP-A1, SP-
A2, and SP-D, exists between the case (patients with RAOM or
OME) and control populations.
1.5.2 Hypothesis One
It was hypothesized that specific alleles and haplotypes of SP-
A1, SP-A2 and SP-D would be more or less frequent in the
RAOM/OME individuals, confirming findings of previous studies
(Pettigrew et al., 2006; Rämet et al., 2001).
1.5.3 Objective Two
Compare observed SP-A1, SP-A2, and SP-D alleles and haplotype
frequencies between the New Zealand Maori and Pacific Island
case population and the control population.
1.5.4 Hypothesis Two
It was hypothesized that allele and haplotype frequencies would
be significantly different between the New Zealand Maori and
Pacific Island case population and the control population. In
addition, it was expected that this population would exhibit more
RAOM/OME associated alleles and haplotypes than the total case
population.

29
CHAPTER TWO
MATERIALS AND METHODS
2.1 Blood Samples
Ethical approval for this study was obtained from the University
of Waikato School of Science and Engineering Human Research
Ethics Committee and the Northern Y Regional Ethics Committee,
Ministry of Health (Ethics Reference Number: NTY05/05/030).
Ethical approval information is presented in Appendix I.
Four millilitre blood samples were obtained from 136 patients
undergoing surgery involving ventilation tube insertion of the
tympanic membrane at Waikato Hospital and Southern Cross
Hospital, Hamilton, New Zealand. Blood samples from a control
population were obtained from 160 participants donating blood
at the New Zealand Blood Service (Waikato) Donor Centre,
Hamilton, New Zealand. Additionally, blood samples from three
patients diagnosed with meningococcal disease were obtained.
Informed consent was obtained from each participant and basic
personal and medical details were recorded including: age; sex;
ethnicity; operation type; previous number of ventilation tubes
inserted; presence of right and left middle ear fluid; previous
adenoidectomy; and professional medical diagnosis. Blood
samples were stored in EDTA containing Vacutainer® tubes (BD)
at 4°C until used for isolating genomic DNA.

Chapter Two: Materials and Methods
30
2.1.1 Isolation of Genomic DNA
Genomic DNA from each blood sample was isolated for use in
this study using the following protocol:
Labelled 1.7 ml microcentrifuge tubes (Axygen) were filled with 1
ml of sterile MQ-H2O (Barnstead), 130 μl of 10x red blood cell
(RBC) lysis solution (1.44 M NH4Cl, 0.1 M NH4HCO3, 1 mM
Na2EDTA), and 250 μl of each blood sample. Tubes were placed
onto a rotator wheel (Labinco) for 5 - 10 minutes until lysis of
the RBCs, indicated by a reduction in turbidity, and then
centrifuged (5415R Bench Top Centrifuge, Eppendorf) at 13,000
rpm for 5 minutes. After centrifugation, the supernatant and
most of the RBC membranes were carefully pipetted off to leave
a white pellet containing the white blood cells, at the bottom of
the tube.
The pellet was resuspended in the remaining solution, followed
by the addition of 300 μl of DNA lysis buffer (0.1 M Tris pH 9,
0.05 M EDTA, 0.1 M NaCl, 1% (w/v) SDS). After thorough
mixing, the tubes were placed in a thermomixer (Eppendorf) at
95°C for 5 - 10 minutes. Once removed from heat, 300 μl of 5 M
lithium chloride (Ajax Chemicals) was introduced. The tubes
were shaken vigorously and then placed onto the rotator wheel
again for approximately 10 minutes. After mixing, 750 μl of
chloroform (Ajax Chemicals) was added and the solutions
vortexed for 20 seconds to form an emulsion before being
returned to the rotator wheel for a further 15 - 30 minutes. The
tubes were then centrifuged at 10,000 rpm for 10 minutes to
separate the phases. The top phase containing the DNA
(approximately 500 μl) was transferred using a transfer pipette
to a new labelled tube along with an equal volume of isopropanol
Chapter Two: Materials and Methods
31
(Ajax Chemicals), inverted to mix and then left overnight to
allow DNA precipitation.
On the following day, the tubes were centrifuged at 13,000 rpm
for 20 minutes, gathering the precipitated DNA at the bottom of
the tube. The alcohol was carefully poured off the pelleted DNA
and washed with 70% v/v ethanol (Ajax Chemicals). Using an
autopipette, the remaining ethanol was removed from the
bottom of the tube, avoiding the white DNA pellet, and the pellet
then air dried. Finally, 50 μl of tris (hydroxymethyl) amino-
methane (TE: 10 mM Tris, 1 mM EDTA pH 8) buffer was added to
each tube and mixed at 37°C for 30 minutes to dissolve the
DNA.
2.1.2 DNA Concentration and Integrity
DNA concentration and purity of each sample was determined by
using 2 μl for analysis using a ND-1000 spectrophotometer
(Nanodrop). The concentration of nucleic acids in each sample
was measured by absorbance at 260 and presented as ng/μl.
The ratio of sample absorbance at 260 and 280 nm was used to
assess the purity of the DNA. A 260/280 ratio of 1.8 – 2.0 was
considered ideal. The genomic DNA samples were then stored at
4°C until required.
2.2 Genotyping of SP-A1, SP-A2, and SP-D.
Based on previous publications (Pantelidis et al., 2003), allele-
specific primer pairs were synthesized (Sigma-Aldrich) with the
3’ end nucleotide complementary to the wild-type or mutant

Chapter Two: Materials and Methods
32
nucleotide variants seen at each particular polymorphism
location within SP-A1, SP-A2, and SP-D. These primer pairs are
listed in Table 2.1.
Chapter Two: Materials and Methods
33
A
SNP Forward Primer (5’- 3’) Reverse Primer (5’- 3’) Length
(bp)
SPA1-19 1- AAACGTCCTTCACTTCGCACA
2- AACGTCCTTCACTTCGCACG
AGTGAGTGAGTGACCTGACTAA 516/515
SPA1-50 1- GCCAGGGTCTCCTTTGAC
2- GCCAGGGTCTCCTTTGAG
AGTGAGTGAGTGACCTGACTAA 605
SPA1-62 1- GACATGGCATTTCTCCAGGT
2- GACATGGCATTTCTCCAGGC
AGTGAGTGAGTGACCTGACTAA 959
SPA1-133 1- TGCAGGGCTCCATAATGACA
2- TGCAGGGCTCCATAATGACG
TACCTGGCCTTCTAACCTCAT 937
SPA1-219 1- ACACACTGCTCTTTTCCCCG
2- ACACACTGCTCTTTTCCCCA
ATAGGAAAGCAAGTTCTCCACC 577
B
SNP Forward Primer (5’- 3’) Reverse Primer (5’- 3’) Length
(bp)
SPA2-9 1- GGCTGCCATCAAGATGAGGT
2- GCTGCCATCAAGATGAGGG
GTGCCAGATGATGCTTGGAATT 235/234
SPA2-91 1- TGGAGAGAAGGGGGAGG
2- TGGAGAGAAGGGGGAGC
CCTGATCACACCATCTGCCT 400
SPA2-140 1- TAGGAGAGAAGGTCTTCTCC
2- GTAGGAGAGAAGGTCTTCTCT
AAACTGAAGGCCAGACAGGAT 395/396
SPA2-223 1- TGTGTACATCTCCACACACTG
2- CTGTGTACATCTCCACACACTT
AAGAAAGCAAGTTCTCTGCCTG 588/589
C
SNP Forward Primer (5’- 3’) Reverse Primer (5’- 3’) Length
(bp)
SPD-11 1- AGACCTACTCCCACAGAACAAT
2- ACCTACTCCCACAGAACAAC
AGAGTTGCTGGGCTAGTTACA 200
SPD-160 1- GTGGAGTCCCTGGAAACG
2- CGTGGAGTCCCTGGAAACA
CACTTTCTCCCTTTGCTCCTT 577
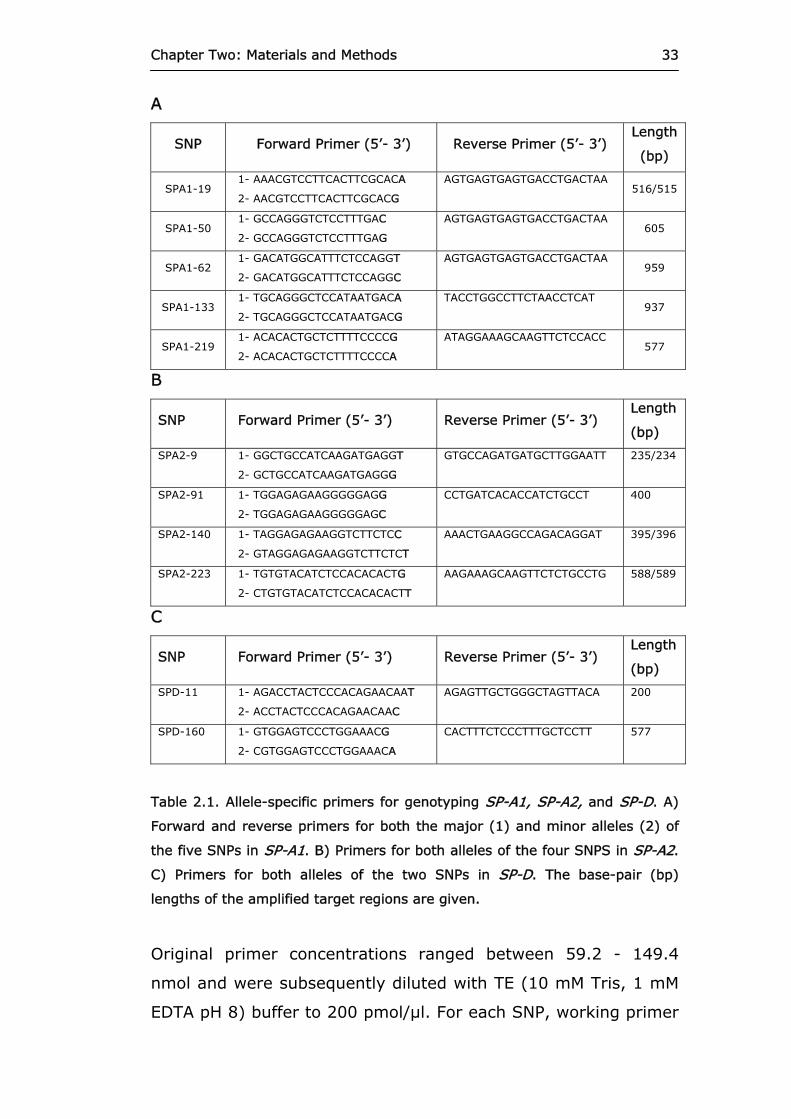
Table 2.1. Allele-specific primers for genotyping SP-A1, SP-A2, and SP-D. A)
Forward and reverse primers for both the major (1) and minor alleles (2) of
the five SNPs in SP-A1. B) Primers for both alleles of the four SNPS in SP-A2.
C) Primers for both alleles of the two SNPs in SP-D. The base-pair (bp)
lengths of the amplified target regions are given.
Original primer concentrations ranged between 59.2 - 149.4
nmol and were subsequently diluted with TE (10 mM Tris, 1 mM
EDTA pH 8) buffer to 200 pmol/μl. For each SNP, working primer

Chapter Two: Materials and Methods
34
solutions (forward and reverse primers) were made for both
alleles to a 20 pmol/μl concentration.
2.2.1 PCR Optimization
Optimal annealing temperatures and extension times for each
set of allele-specific primers were determined using gradient
PCR. Twenty-five microlitre reactions were made with PCR
mastermix (10x HotMaster® Reaction Buffer (Eppendorf), 250
μM deoxynucleotide triphosphates (Invitrogen), 2.5 mM MgCl2
pH 8.5), 0.5 U of HotMaster® Taq DNA Polymerase (Eppendorf),
10 pmol of allele-specific primers, and approximately 200 ng of
genomic DNA.
DNA Taq polymerase synthesized DNA complementary to the
template at approximately 1000 bp per minute during the
extension step of the thermocycling program, thus it was
necessary to group allele-specific reactions based on similar PCR
product base-pair lengths. Accordingly, the 22 allele-specific
reactions were divided into three groups, with estimated optimal
extension times (Table 2.2).

Chapter Two: Materials and Methods
35
A
Group One Group Two Group Three
Allele PCR product (bp) Allele PCR product
(bp) Allele PCR product (bp)
SPA1-19T 516 SPA2-9A 235 SPA1-62A 959
SPA1-19C 515 SPA2-9C 234 SPA1-62G 959
SPA1-50C 605 SPA2-91G 400 SPA1-133A 937
SPA1-50G
605 SPA2-91C
400 SPA1-133G 937
SPA1-219C 577 SPA2-
140C 395 - -
SPA1-219T 577 SPA2-
140T 396 - -
SPA2-223C
588 SPD-11T 200 - -
SPA2-223A 589 SPD-
11C 200 - -
SPD-160A 577 - - - -
SPD-160G
577 - - - -
B
Primer Group
PCR product length (bp)
Approx extension time for Taq DNA Polymerase (secs)
Group One 515 - 605 40
Group Two
200 - 400 30
Group Three
937 - 959 60
Table 2.2. Grouping of the 22 allele-specific reactions based on PCR product
length. A) Group One contains allele-specific primers which amplify a DNA
region between 515 – 605 base-pairs (bp) in length. Group Two contains
allele-specific primers which amplify a DNA region between 200 – 400 bp in
length. Group Three contains allele-specific primers which amplify a DNA
region between 937 959 bp in length. B) Approximate extension times needed
for Taq DNA polymerase for complementary DNA synthesis were calculated
(1000 bp per minute) for each Primer Group based on the length of the
amplified genomic region.

Chapter Two: Materials and Methods
36
Thermocycling was conducted using a Peltier Thermal Cycler
(PTC) 200 (MJ Research) and consisted of the following steps:
1. Initial denaturation at 95°C for 2 minutes
2. 94°C for 20 seconds
3. Annealing temperature gradient of 52 - 64°C
4. Extension: i) Group One: 68°C for 40 seconds
ii) Group Two: 68°C for 30 seconds
iii) Group Three: 68°C for 60 seconds
5. Repeat steps 2 - 4 in 39 more cycles
6. Final extension at 68°C for 5 minutes
2.2.2 Agarose Gel Electrophoresis
Gradient PCR products were then electrophoresed to determine
which annealing temperature produced the most efficient
amplification of the target genomic region.
A 2% (w/v) agarose gel (USB) was cast with 1x sodium borate
buffer (0.05 M boric acid, 0.01 M NaOH pH 8.5) and 1.5 μg/ml of
ethidium bromide using a Owl gel electrophoresis system. Ten
microlitres of the amplified product from each PCR reaction was
loaded into the wells of the gel. The products were then
electrophoresed for 30 minutes at 120 V and 30 mA. Product
bands were visualised using a GIBCO BRL ultra-violet
transilluminator (Life Technologies) at 312 nm, photographed
using a COHU High Performance CCD camera and printed with a
Sony Digital Graphic Printer UP-D890. Confirmation of product
band base-pair lengths were made by comparison with a 100 bp
DNA ladder (Invitrogen).

Chapter Two: Materials and Methods
37
The optimal annealing temperature for each set of allele-specific
primers was determined by the presence of a single high
intensity product band in the agarose gel at the appropriate
base-pair length, and the absence of extra bands of other
inappropriate lengths.
2.2.3 Real-Time PCR
Real-time PCR reactions were performed in 100 μl thin walled
tubes (Corbett Research) and monitored using a Rotor-GeneTM
6000 (Corbett Research). Each 20 μl reaction mixture contained
Real-time PCR Mastermix (10x Thermostart® Reaction Buffer (AB
Ltd), 1/20,000 dilution of SYBR® Green I (Invitrogen), 250 μM
deoxynucleotide triphosphates (Invitrogen), 5 mM MgCl2 pH
8.5), 0.5 U of ABGene Thermostart® DNA Polymerase (AB Ltd), 5
pmol of allele-specific primers, and approximately 200 ng of
genomic DNA.
Touchdown thermocycling steps were as follows:
1. Initial denaturation at 95°C for 10 mins
2. 94°C for 20 seconds
3. Annealing temperature started at 70°C for 20
seconds and then decreased at 1°C/cycle for 20
seconds for the first 15 cycles, staying at 56°C for
the remaining cycles
4. Extension at 68°C for 30 – 60 seconds (Table 4)
5. Fluorescence acquisition step at 80°C for 15 seconds
(excitation at 470 nm, detection at 510 nm)
6. Repeated steps 2 - 5 in 44 more cycles
Chapter Two: Materials and Methods
38
2.2.4 SYBR® Green I Melting Curve Analysis
Following amplification, PCR products were heated from 75°C to
99°C in 0.5°C increments every 5 seconds. The denaturing
conditions dissociated the dsDNA into single strands as the
melting temperatures (Tms) were reached for each specific PCR
product.
The consequential reduction in fluorescence from the release of
the SYBR® Green I dye was detected, and the derivative of the
raw data produced a melt curve, with the peak representing the
Tm for the product. The absence or presence of the appropriate
melt curves were used to assign whether the wild-type, mutant,
or both alleles were present in an individual’s genome.
Real-time PCR products were analyzed by 2% (w/v) agarose gel
electrophoresis as previously described in section 2.2.2, and
product band lengths noted to confirm that the correct target
genomic region had been amplified.
2.2.5 Sequencing of SP-A1, SP-A2, and SP-D PCR Products
Sequencing of the allele-specific PCR products amplified from SP-
A1, SP-A2, and SP-D was also employed to confirm that the
correct region had been targeted and that no incorrect
amplification had occurred.
Genomic DNA from sample M1 (meningococcal group) and case
sample 26 was used as a template for amplification of the 22
(two alleles for each SNP) previously described alleles in SP-A1,
SP-A2, and SP-D by PCR. Fifty microlitre reactions consisted of
PCR mastermix (10x HotMaster® Reaction Buffer (Roche), 250

Chapter Two: Materials and Methods
39
μM deoxynucleotide triphosphates (Invitrogen), 2.5 mM MgCl2
pH 8.5), 0.5 U of HotMaster® Taq DNA Polymerase (Eppendorf),
10 pmol of allele-specific primers, and approximately 200 ng of
genomic DNA.
The thermocycling protocol for amplification of the 22 alleles was
as follows:
1. Initial denaturation at 95°C for 2 minutes
2. 94°C for 20 seconds
3. 60°C for 20 seconds
4. Extension: i) Group One: 68°C for 40 seconds
ii) Group Two: 68°C for 30 seconds
iii) Group Three: 68°C for 60 seconds
5. 39 more cycles of steps 2 - 4
6. Final extension at 68°C for 5 minutes
Following thermocycling, all PCR products were purified by
selective precipitation with polyethylene glycol (PEG) 6000 as
previously published by Schmitz and Riesner (2006). The amount
of reagents added to each 50 μl reaction was different for each
group of allele-specific reactions, as seen in Table 2.3.

Chapter Two: Materials and Methods
40
Group EDTA
(0.5 M, pH 8)
50% (w/v) PEG 6000 5 M NaCl
Group One 1.6 μl 21.0 μl 8.1 μl
Group Two
1.9 μl 34.0 μl 9.6 μl
Group Three 1.4 μl 12.0 μl 7.0 μl
Table 2.3. Volume of reagents added to each 50μl allele-specific PCR reaction
for purification of PCR products for subsequent sequencing. The amounts of
purification reagents added was altered according to the base pair length of
the expected PCR product, as seen across Group One, Two, and Three.
Following addition of the purification reagents, the solutions were
mixed well and incubated at room temperature for 10 minutes.
Post-incubation, the solutions were centrifuged at 16,000 x g for
10 minutes to allow the DNA to sediment. The supernatant was
then removed and the remaining DNA pellet washed with 125 μl
of 70% (v/v) ethanol. Finally, the ethanol was also removed and
the pellet solubilized in 15 μl of deionised water. The solutions
were then sent to the University of Waikato Sequencing
Laboratory (Hamilton, New Zealand) for sequencing, using the
allele-specific forward and reverse primers as sequencing
primers.
Product sequences for each allele-specific reaction were entered
into the NCBI website in FASTA format to facilitate a BLAST
search which allowed confirmation that the correct region within
SP-A1, SP-A2, or SP-D had been amplified.

Chapter Two: Materials and Methods
41
2.3 Analysis of Genotype Data
Raw genotype data for both the case and control populations
were analyzed with Haploview software (Barrett et al., 2005). A
simple tab-delimited text file (.txt) containing sample numbers,
gender, case/control status, and SNP genotypes were input into
Haploview. A separate input file which contained the names and
chromosomal position for each SNP was also loaded.
Initially, the software performed a number of SNP genotyping
quality measures including the percentage of individuals
successfully genotyped for each particular SNP, and a test of
conformance with Hardy-Weinberg equilibrium. These
parameters were then used to filter out any SNPs which fell
below a preset threshold.
2.3.1 Haplotype Construction
Haploview constructed haplotypes using an accelerated
Expectation-Maximization algorithm similar to that described by
Qin et al (2002) and generated the following:
- pairwise measures of linkage disequilibrium
- population allele frequencies
- population haplotype frequencies
Chapter Two: Materials and Methods
42
2.3.2 χ2-Tests for RAOM/OME Association
Simple χ2-tests for single SNPs and the constructed haplotypes
were carried out to calculate any association with recurrent acute
otitis media or otitis media with effusion.
2.3.3 Protein Phenotype Predictions
The amino acid sequences of SP-A1, SP-A2, and SP-D were
entered into the PolyPhen server (Ramensky et al., 2002) in
FASTA format. Individually, the sequence position and the two
amino acid variants for each SNP were included, from which the
software could identify any deleterious alleles.
To calculate whether the substitution in question occurred at a
specific site, PolyPhen used:
- the TMHMM (Krogh et al., 2001) algorithm to predict
transmembrane regions,
- the Coils2 program (Lupas et al., 1991) to predict
coiled coil regions,
- the SignalP program (Bendtsen et al., 2004) to predict
signal peptide regions of the protein sequence.
Using a BLAST search of the non-redundant database (NRDB),
homologues of the input protein sequences were identified and
used by the PSIC software to calculate profile scores for the
allelic variants at each SNP position. The difference between the
scores of both variants was calculated. A further BLAST search of
the Protein Data Bank (Berman et al., 2000) and the Protein
Quaternary Structure database (Henrick and Thornton, 1998) for
homologues allowed PolyPhen to estimate whether the
Chapter Two: Materials and Methods
43
substitutions affected the hydrophobic core of the protein and/or
electrostatic and ligand interactions. The DSSP database (Kabsch
and Sander, 1983) provided information on the proteins’
secondary structures and solvent accessible areas.
Finally, PolyPhen analyzed the various structural properties and
profile scores obtained to compare the protein variants, and
predict whether the structural and functional consequences of
the minor allele at each particular SNP were benign or damaging.
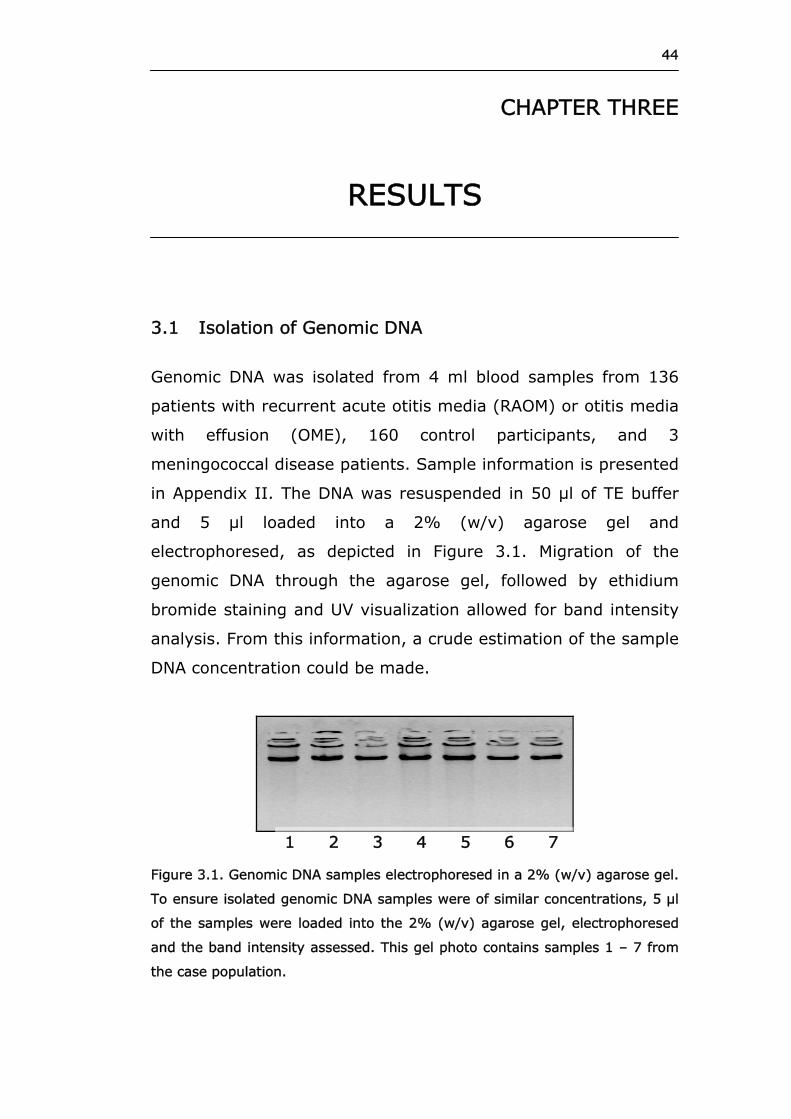
44
CHAPTER THREE
RESULTS
3.1 Isolation of Genomic DNA
Genomic DNA was isolated from 4 ml blood samples from 136
patients with recurrent acute otitis media (RAOM) or otitis media
with effusion (OME), 160 control participants, and 3
meningococcal disease patients. Sample information is presented
in Appendix II. The DNA was resuspended in 50 μl of TE buffer
and 5 μl loaded into a 2% (w/v) agarose gel and
electrophoresed, as depicted in Figure 3.1. Migration of the
genomic DNA through the agarose gel, followed by ethidium
bromide staining and UV visualization allowed for band intensity
analysis. From this information, a crude estimation of the sample
DNA concentration could be made.
1 2 3 4 5 6 7
Figure 3.1. Genomic DNA samples electrophoresed in a 2% (w/v) agarose gel.
To ensure isolated genomic DNA samples were of similar concentrations, 5 μl
of the samples were loaded into the 2% (w/v) agarose gel, electrophoresed
and the band intensity assessed. This gel photo contains samples 1 – 7 from
the case population.

Chapter Three: Results 45
In order to obtain accurate measurements of DNA concentration
and integrity, 2 μl of each sample was analyzed by a Nanodrop®
ND-1000 spectrophotometer. A small subset of
spectrophotometer results are presented in Table 3.1. The
nucleic acid concentration for each genomic DNA sample was
given in ng/μl, and sample absorbance was measured at 230
nm, 260 nm, and 280 nm. The ratio of a sample’s 260 nm and
280 nm absorbance measurements were used to determine the
purity of the DNA sample. A 260/280 ratio of greater than or
equal to 1.8 was considered “pure” DNA, and devoid of
contaminants.
Sample ID ng/μl A260 260/230 260/280
120
793.48 15.87 2.06 1.90
121 999.64 19.99 2.08 1.90
122
959.99 19.20 2.10 1.90
123 246.62 4.93 1.49 2.09
124
304.69 6.09 1.76 2.04
125 1067.10 21.34 2.11 1.89
126
1625.90 32.52 2.21 1.87
127
319.51 6.39 1.71 2.02
Table 3.1. Example of Nanodrop readings for samples 120 – 127 of the case
population. Nucleic acid concentrations are presented in ng/μl.
3.2 Gradient PCR
To determine the optimal annealing temperature for the allele-
specific primers used to amplify the major (Mj) and minor (mi)
alleles for each SNP, gradient PCR was used. During the

Chapter Three: Results 46
thermocycling, the peltier thermal cycler (PTC-200) established a
temperature gradient across the plate where the reactions are
placed. Identical reactions for all 22 allele-specific primers were
placed into the PTC-200 which provided a temperature gradient
between 52°C – 64°C at the annealing step.
Once the thermocycling was completed, 10 μl of each reaction
was loaded into a 2% (w/v) agarose gel supplemented with
ethidium bromide and electrophoresed as previously described in
section 2.2.2. Migrated PCR products were then visualized with a
UV transilluminator and compared to a 100 bp DNA ladder, from
which product band intensity, length and quality could be
determined. Figures 3.2 – 3.4 show the results of the gradient
PCR for the allele-specific primers targeting regions in SP-A1,
SP-A2, and SP-D in one sample.

Chapter Three: Results 47
SPA1-50G (Mj)SPA1-62A (Mj)
°C 55.4 53.1 52.0 N 63.8 62.2 59.2 55.4 53.1 52.0 N L
°C 63.8 62.2 59.2 55.4 53.1 52.0 N 63.8 62.2 59.2 L
SPA1-62A (Mj) SPA1-62G (mi)
Figure 3.2. Gradient PCR products amplified from case sample 24 using allele-
specific primers SPA1-50G (Mj), SPA1-62A (Mi), and SPA1-62G (mi). Identical
25 μl PCR reactions were run at different annealing temperatures (52.0 – 63.8
°C), and 10 μl of each reaction was loaded into a 2% agarose (w/v) gel and
electrophoresed. Single product bands of 605 bp, 959 bp, and 959 bp were
expected, respectively. Lane N: negative template control; Lane L: 100 bp
ladder.
Spurious smaller bands were present in most reactions at an
annealing temperature of 52.0°C. For example, the primers that
targeted the SP-A1 allele, 62G (Figure 3.2), amplified the correct
959 bp region and five smaller regions, ranging between 150 –
450 bp. However, the presence of these smaller erroneous bands
diminished as the annealing temperature was increased, with

Chapter Three: Results 48
none present in reactions with an annealing temperature
between 59.2°C – 63.8°C.
Figure 3.3 shows the agarose gel electrophoresis results for the
gradient PCR products amplified with the allele-specific primers
SPA1-140T, SPA2-223C, and SPA2-223A. Small erroneous
product bands of approximately 300 bp were seen to be
amplified at lower annealing temperatures by allele-specific
primers and SPA2-223A and SPA2-223C in addition to the
correct products of 589 and 588 bp, respectively. These extra
products disappeared at higher annealing temperatures.

Chapter Three: Results 49
SPA2-223C (Mj) SPA2-223A (mi)
°C 63.8 62.2 59.2 55.4 53.1 52.0 N 63.8 62.2 59.2 L
SPA1-140T (mi)
°C 55.4 53.1 52.0 N 63.8 62.2 59.2 55.4 53.1 52.0 N L
SPA2-223C (Mj)
Figure 3.3. Gradient PCR products amplified from case sample 24 using allele-
specific primers SPA1-140T (mi), SPA2-223C (Mj), and SPA2-223A (mi).
Identical 25 μl PCR reactions were run at different annealing temperatures
(52.0 – 63.8 °C), and 10 μl of each reaction was loaded into a 2% agarose
(w/v) gel and electrophoresed. Single product bands of 396, 588, and 589 bp
were expected, respectively. Lane N: negative template control; Lane L: 100
bp ladder.
Interestingly, the reactions that amplified the SPD-11C (200 bp)
and SPD-11T alleles (200 bp) also amplified a larger region of
approximately 300 and 450 bp respectively, at the lower
annealing temperatures (Figure 3.4). This larger product was not
present in reactions exposed to the higher annealing
temperatures.
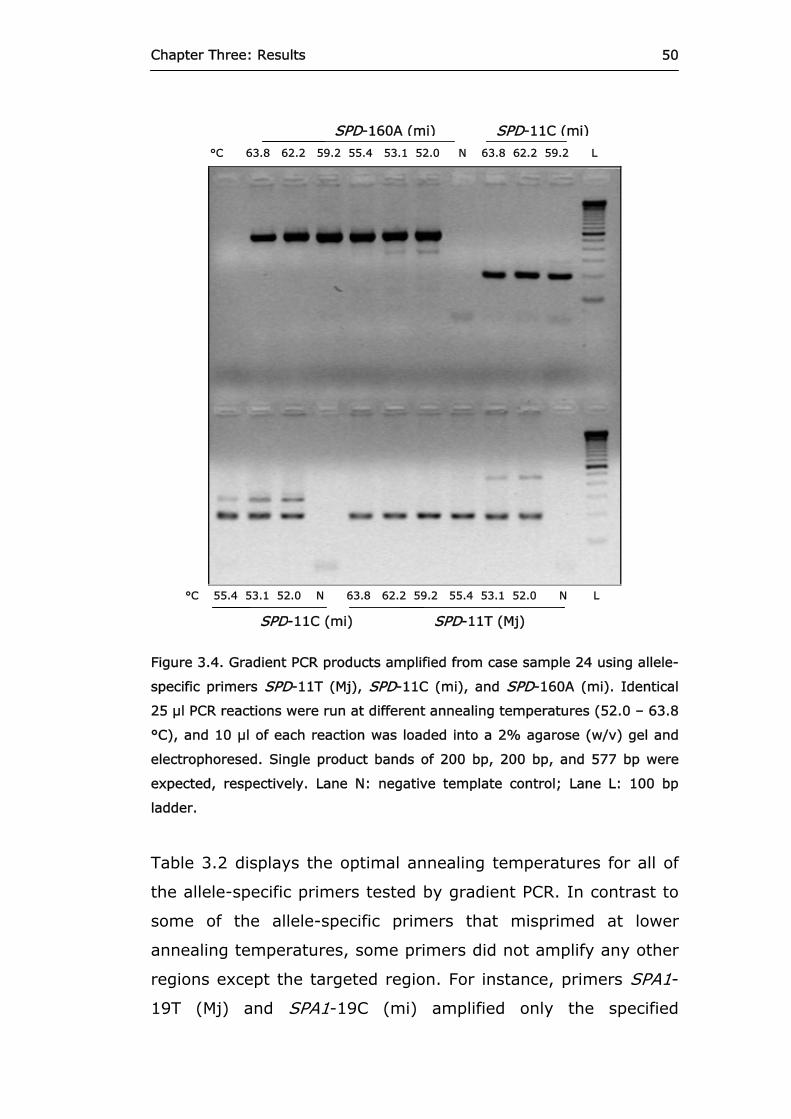
Chapter Three: Results 50
SPD-160A (mi)
°C 63.8 62.2 59.2 55.4 53.1 52.0 N 63.8 62.2 59.2 L
SPD-11C (mi)
SPD-11T (Mj)SPD-11C (mi)
°C 55.4 53.1 52.0 N 63.8 62.2 59.2 55.4 53.1 52.0 N L
Figure 3.4. Gradient PCR products amplified from case sample 24 using allele-
specific primers SPD-11T (Mj), SPD-11C (mi), and SPD-160A (mi). Identical
25 μl PCR reactions were run at different annealing temperatures (52.0 – 63.8
°C), and 10 μl of each reaction was loaded into a 2% agarose (w/v) gel and
electrophoresed. Single product bands of 200 bp, 200 bp, and 577 bp were
expected, respectively. Lane N: negative template control; Lane L: 100 bp
ladder.
Table 3.2 displays the optimal annealing temperatures for all of
the allele-specific primers tested by gradient PCR. In contrast to
some of the allele-specific primers that misprimed at lower
annealing temperatures, some primers did not amplify any other
regions except the targeted region. For instance, primers SPA1-
19T (Mj) and SPA1-19C (mi) amplified only the specified

Chapter Three: Results 51
515/516 bp region for the entire range of annealing
temperatures tested.
Major Allele Minor Allele
Primer Pair Annealing Temp (°C) Primer Pair Annealing Temp (°C)
SPA1-19T 52.0 - 63.8 SPA1-19C 52.0 - 63.8
SPA1-50G 59.2 - 63.8 SPA1-50C 62.2 - 63.8
SPA1-62A 59.2 - 63.8 SPA1-62G 59.2 - 63.8
SPA1-133A 59.2 - 63.8 SPA1-133G 59.2 - 63.8
SPA1-219C 56.9 - 62.7 SPA1-219T 60.7 - 62.7
SPA2-9A 60.7 - 62.7 SPA2-9C ~60.7
SPA2-91G ~62.7 SPA2-91C ~62.7
SPA2-140C ~62.2 SPA2-140T 56.9 - 62.7
SPA2-223C 59.2 - 63.8 SPA2-223A 59.2 - 62.2
SPD-11T 59.2 - 63.8 SPD-11C 62.2 - 63.8
SPD-160G 59.2 - 63.8 SPD-160A 59.2 - 63.8
Table 3.2. Optimal annealing temperature ranges for the allele-specific
primers that amplify the major and minor alleles for each SNP. Using gradient
PCR, the optimal annealing temperature (°C) ranges for the major and minor
allele-specific primer pairs of each SNP were determined.
3.3 Genotyping
3.3.1 Real-Time PCR and SYBR® Green I Melting Curve Analysis
Case and control DNA samples were genotyped for the major
and minor alleles for the SP-A1, SP-A2, and SP-D SNPs using
real-time PCR and SYBR® Green I melting curve analysis.
Separate real-time PCR reactions were made for detection of the
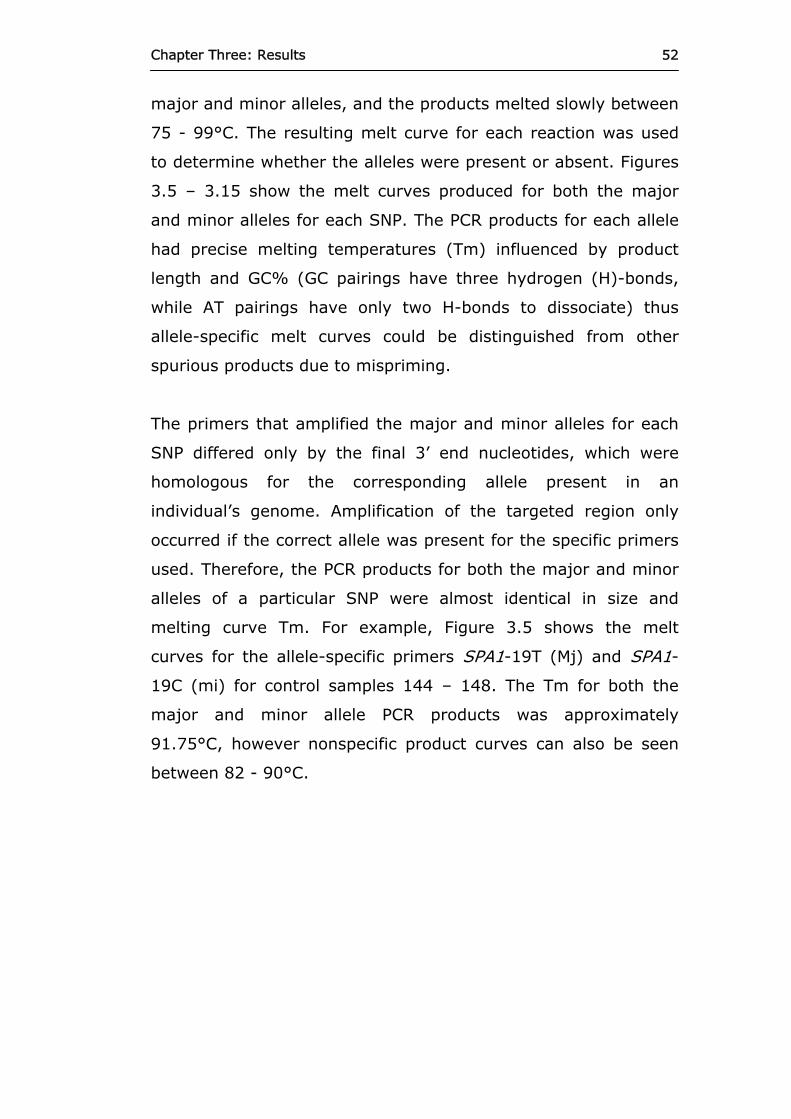
Chapter Three: Results 52
major and minor alleles, and the products melted slowly between
75 - 99°C. The resulting melt curve for each reaction was used
to determine whether the alleles were present or absent. Figures
3.5 – 3.15 show the melt curves produced for both the major
and minor alleles for each SNP. The PCR products for each allele
had precise melting temperatures (Tm) influenced by product
length and GC% (GC pairings have three hydrogen (H)-bonds,
while AT pairings have only two H-bonds to dissociate) thus
allele-specific melt curves could be distinguished from other
spurious products due to mispriming.
The primers that amplified the major and minor alleles for each
SNP differed only by the final 3’ end nucleotides, which were
homologous for the corresponding allele present in an
individual’s genome. Amplification of the targeted region only
occurred if the correct allele was present for the specific primers
used. Therefore, the PCR products for both the major and minor
alleles of a particular SNP were almost identical in size and
melting curve Tm. For example, Figure 3.5 shows the melt
curves for the allele-specific primers SPA1-19T (Mj) and SPA1-
19C (mi) for control samples 144 – 148. The Tm for both the
major and minor allele PCR products was approximately
91.75°C, however nonspecific product curves can also be seen
between 82 - 90°C.
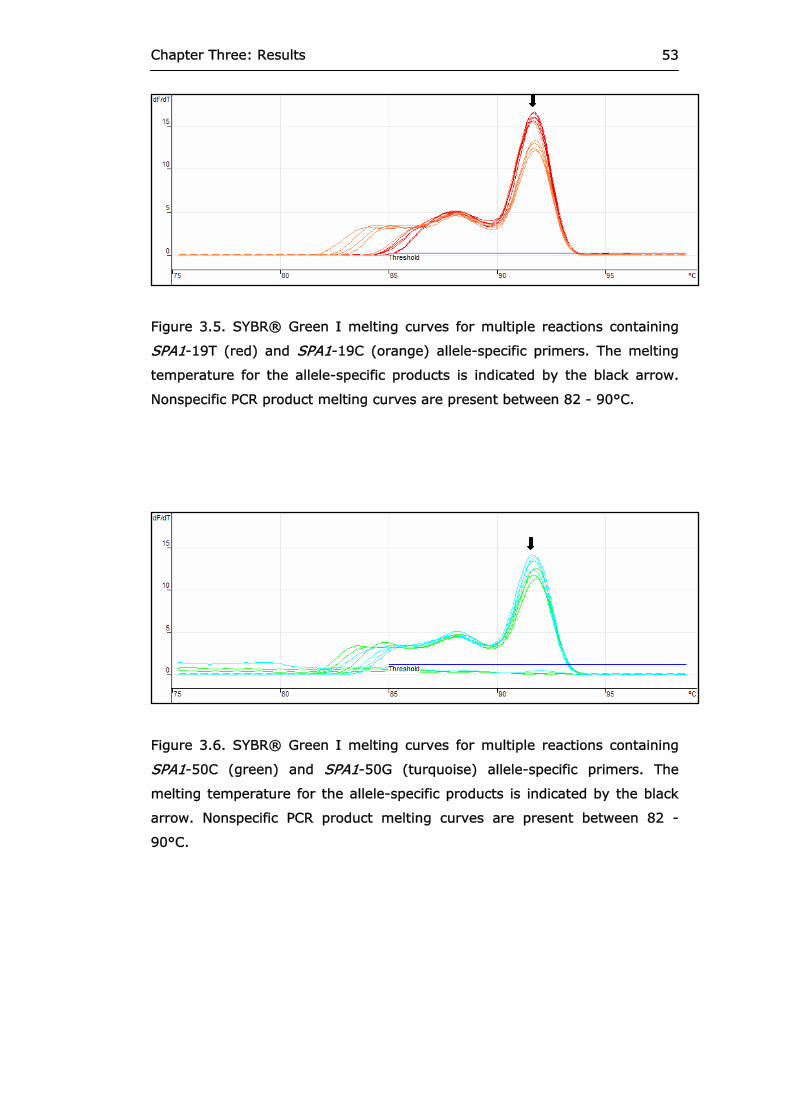
Chapter Three: Results 53
Figure 3.5. SYBR® Green I melting curves for multiple reactions containing
SPA1-19T (red) and SPA1-19C (orange) allele-specific primers. The melting
temperature for the allele-specific products is indicated by the black arrow.
Nonspecific PCR product melting curves are present between 82 - 90°C.
Figure 3.6. SYBR® Green I melting curves for multiple reactions containing
SPA1-50C (green) and SPA1-50G (turquoise) allele-specific primers. The
melting temperature for the allele-specific products is indicated by the black
arrow. Nonspecific PCR product melting curves are present between 82 -
90°C.
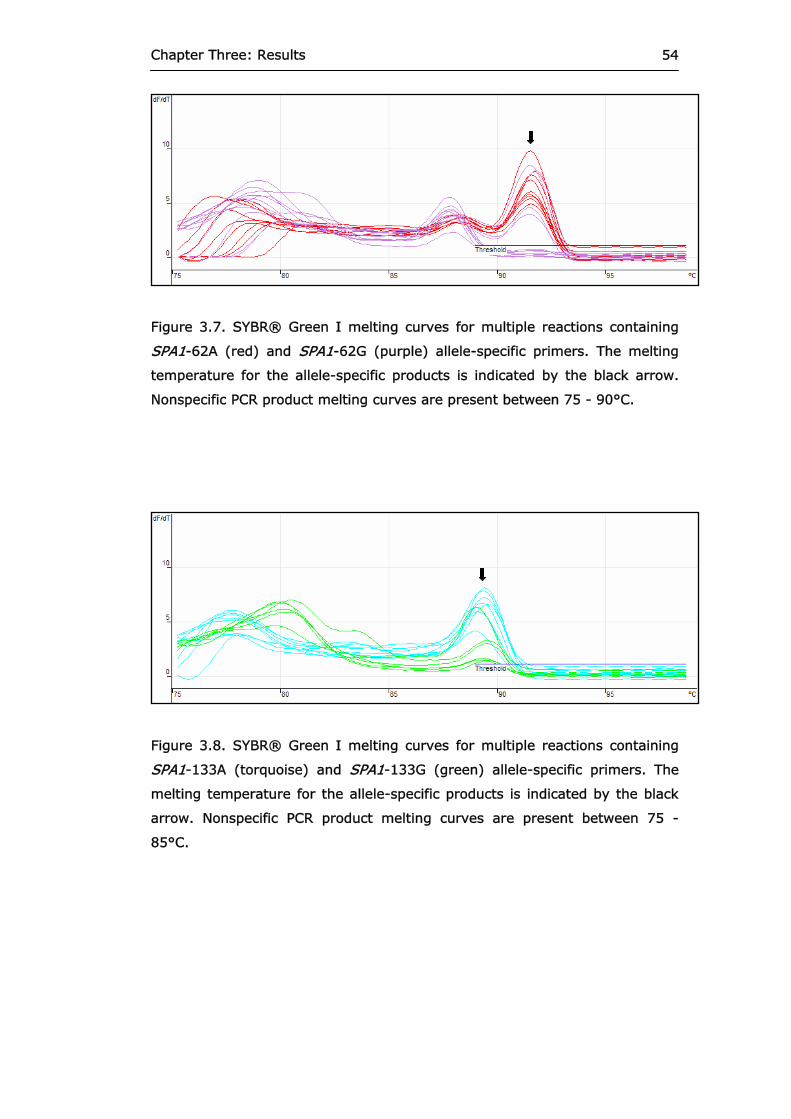
Chapter Three: Results 54
Figure 3.7. SYBR® Green I melting curves for multiple reactions containing
SPA1-62A (red) and SPA1-62G (purple) allele-specific primers. The melting
temperature for the allele-specific products is indicated by the black arrow.
Nonspecific PCR product melting curves are present between 75 - 90°C.
Figure 3.8. SYBR® Green I melting curves for multiple reactions containing
SPA1-133A (torquoise) and SPA1-133G (green) allele-specific primers. The
melting temperature for the allele-specific products is indicated by the black
arrow. Nonspecific PCR product melting curves are present between 75 -
85°C.

Chapter Three: Results 55
Figure 3.9. SYBR® Green I melting curves for multiple reactions containing
SPA1-219C (blue) and SPA1-219T (pink) allele-specific primers. The melting
temperature for the allele-specific products is indicated by the black arrow.
Nonspecific PCR product melting curves are present between 75 - 87°C.
Figure 3.10. SYBR® Green I melting curves for multiple reactions containing
SPA2-9A (red) and SPA2-9C (green) allele-specific primers. The melting
temperature for the allele-specific products is indicated by the black arrow.
Nonspecific PCR product melting curves are present between 75 - 87°C.

Chapter Three: Results 56
Figure 3.11. SYBR® Green I melting curves for multiple reactions containing
SPA2-91G (red) and SPA2-91C (blue) allele-specific primers. The melting
temperature for the allele-specific products is indicated by the black arrow.
Nonspecific PCR product melting curves are present between 75 - 87°C.
Figure 3.12. SYBR® Green I melting curves for multiple reactions containing
SPA2-140C (blue) and SPA2-140T (orange) allele-specific primers. The
melting temperature for the allele-specific products is indicated by the black
arrow. Nonspecific PCR products were absent between 75 - 85°C, as also
demonstrated by the absence of spurious bands seen in the amplification of
SPA2-140C in samples 128 and 129 (Figure 3.17).

Chapter Three: Results 57
Figure 3.13. SYBR® Green I melting curves for multiple reactions containing
SPA2-223C (pink) and SPA2-223A (purple) allele-specific primers. The
melting temperature for the allele-specific products is indicated by the black
arrow. Nonspecific PCR product melting curves are present between 75 -
85°C, and correspond with the spurious 500 bp product band amplified in
addition to SPA2-223C in samples 128 and 129 seen in Figure 3.16.
Figure 3.14. SYBR® Green I melting curves for multiple reactions containing
SPD-11T (pink) and SPD-11C (purple) allele-specific primers. The melting
temperature for the allele-specific products is indicated by the black arrow.
Nonspecific PCR product melting curves are present between 75 - 85°C.
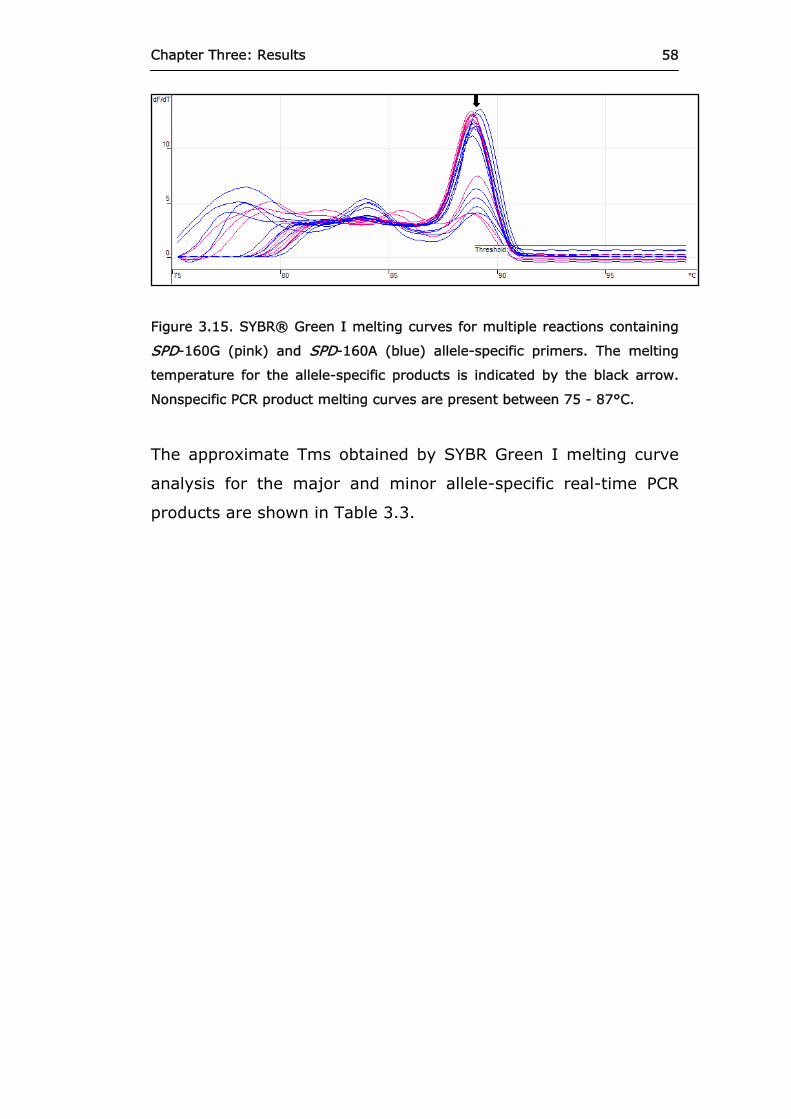
Chapter Three: Results 58
Figure 3.15. SYBR® Green I melting curves for multiple reactions containing
SPD-160G (pink) and SPD-160A (blue) allele-specific primers. The melting
temperature for the allele-specific products is indicated by the black arrow.
Nonspecific PCR product melting curves are present between 75 - 87°C.
The approximate Tms obtained by SYBR Green I melting curve
analysis for the major and minor allele-specific real-time PCR
products are shown in Table 3.3.
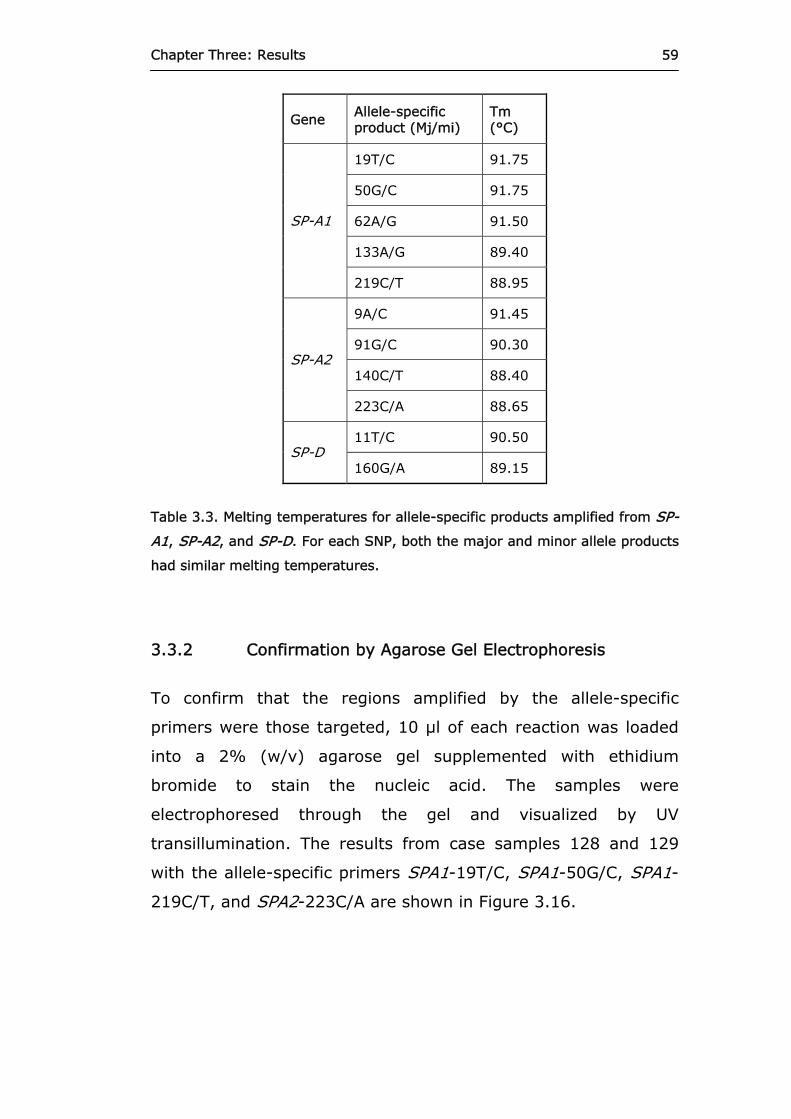
Chapter Three: Results 59
Gene Allele-specific product (Mj/mi)
Tm (°C)
19T/C 91.75
50G/C 91.75
62A/G 91.50
133A/G 89.40
SP-A1
219C/T 88.95
9A/C 91.45
91G/C 90.30
140C/T 88.40 SP-A2
223C/A 88.65
11T/C 90.50 SP-D
160G/A 89.15
Table 3.3. Melting temperatures for allele-specific products amplified from SP-
A1, SP-A2, and SP-D. For each SNP, both the major and minor allele products
had similar melting temperatures.
3.3.2 Confirmation by Agarose Gel Electrophoresis
To confirm that the regions amplified by the allele-specific
primers were those targeted, 10 μl of each reaction was loaded
into a 2% (w/v) agarose gel supplemented with ethidium
bromide to stain the nucleic acid. The samples were
electrophoresed through the gel and visualized by UV
transillumination. The results from case samples 128 and 129
with the allele-specific primers SPA1-19T/C, SPA1-50G/C, SPA1-
219C/T, and SPA2-223C/A are shown in Figure 3.16.
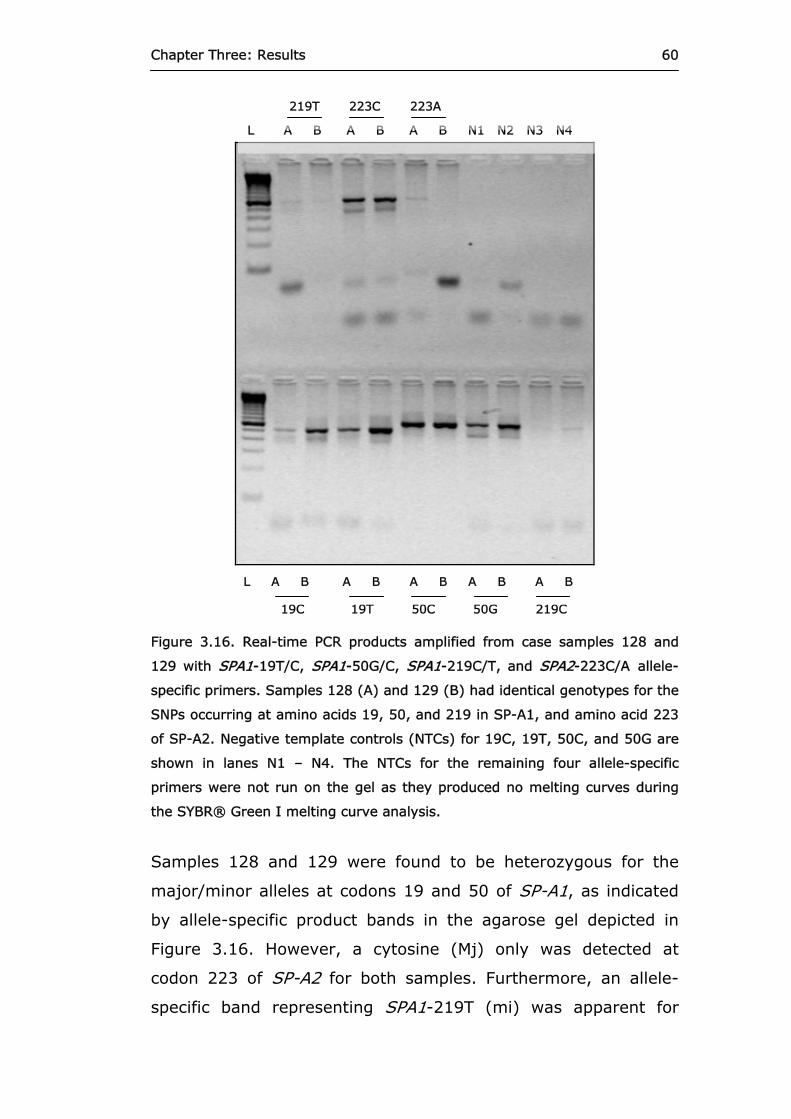
Chapter Three: Results 60
19C 19T 50C 50G 219C
L A B A B A B A B A B
L A B A B A B N1 N2 N3 N4
219T 223C 223A
Figure 3.16. Real-time PCR products amplified from case samples 128 and
129 with SPA1-19T/C, SPA1-50G/C, SPA1-219C/T, and SPA2-223C/A allele-
specific primers. Samples 128 (A) and 129 (B) had identical genotypes for the
SNPs occurring at amino acids 19, 50, and 219 in SP-A1, and amino acid 223
of SP-A2. Negative template controls (NTCs) for 19C, 19T, 50C, and 50G are
shown in lanes N1 – N4. The NTCs for the remaining four allele-specific
primers were not run on the gel as they produced no melting curves during
the SYBR® Green I melting curve analysis.
Samples 128 and 129 were found to be heterozygous for the
major/minor alleles at codons 19 and 50 of SP-A1, as indicated
by allele-specific product bands in the agarose gel depicted in
Figure 3.16. However, a cytosine (Mj) only was detected at
codon 223 of SP-A2 for both samples. Furthermore, an allele-
specific band representing SPA1-219T (mi) was apparent for
Chapter Three: Results 61
sample 128 only, while SPA1-219C (Mj) was detected in sample
129.
Multiple product bands were seen in some lanes of the agarose
gel (Figure 3.16). The smaller spurious products corresponded
with the nonspecific products seen in the lower temperatures of
the SYBR® Green I melting curve analysis, as depicted in
Figures 3.5, 3.6, 3.9, and 3.13.
Real-time PCR products for case samples 128 and 129 with the
allele-specific primers SPA2-9A/C, SPA2-91G/C, SPA2-140C/T,
and SPD-11T/C were also electrophoresed in a 2% (w/v) agarose
gel and are presented in Figure 3.17.
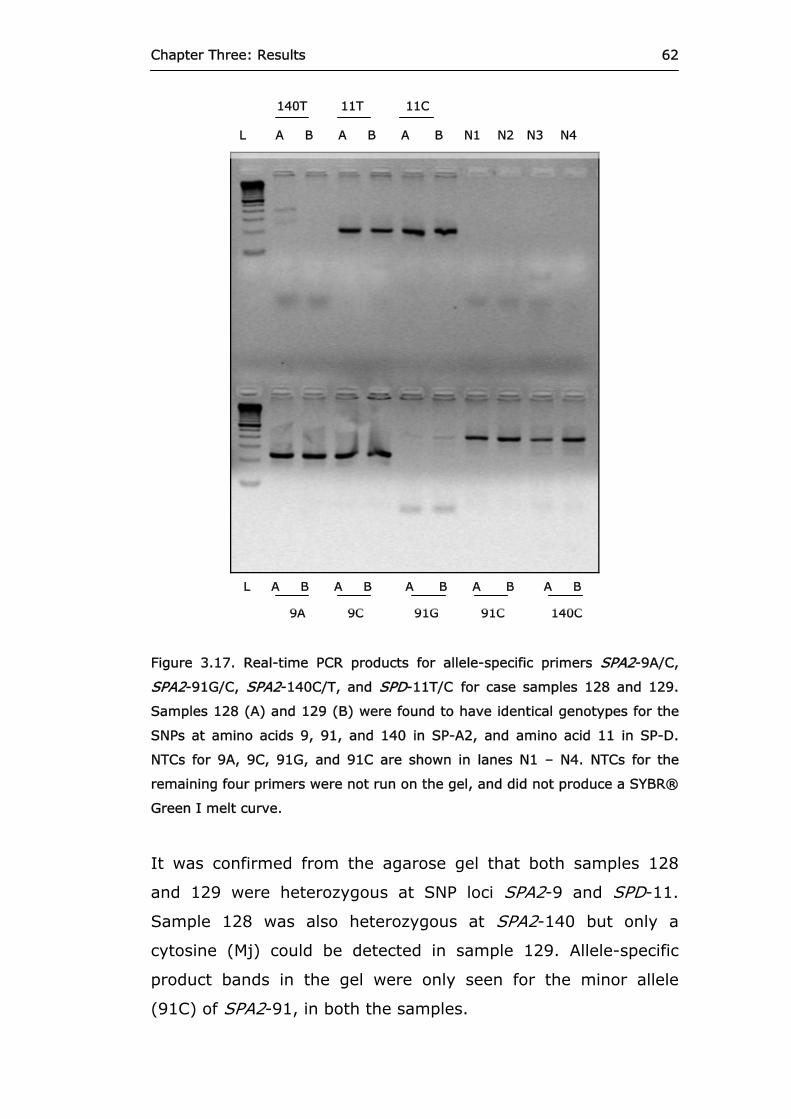
Chapter Three: Results 62
9A 9C 91G 91C 140C
L A B A B A B A B A B
L A B A B A B N1 N2 N3 N4
140T 11T 11C
Figure 3.17. Real-time PCR products for allele-specific primers SPA2-9A/C,
SPA2-91G/C, SPA2-140C/T, and SPD-11T/C for case samples 128 and 129.
Samples 128 (A) and 129 (B) were found to have identical genotypes for the
SNPs at amino acids 9, 91, and 140 in SP-A2, and amino acid 11 in SP-D.
NTCs for 9A, 9C, 91G, and 91C are shown in lanes N1 – N4. NTCs for the
remaining four primers were not run on the gel, and did not produce a SYBR®
Green I melt curve.
It was confirmed from the agarose gel that both samples 128
and 129 were heterozygous at SNP loci SPA2-9 and SPD-11.
Sample 128 was also heterozygous at SPA2-140 but only a
cytosine (Mj) could be detected in sample 129. Allele-specific
product bands in the gel were only seen for the minor allele
(91C) of SPA2-91, in both the samples.

Chapter Three: Results 63
3.3.3 Confirmation by DNA Sequencing
SP-A1, SP-A2, and SP-D allele-specific PCR products amplified
from meningococcal sample M1 and RAOM/OME sample 26 were
purified by selective precipitation with polyethylene glycol 6000
(Schmitz and Riesner, 2006). The 22 (two alleles for eleven
SNPs) purified PCR products were then sequenced, using the
allele-specific forward and reverse primers as sequencing
primers, in order to confirm that the correct genomic regions
were being amplified by the allele-specific primers. The regions
amplified by the major and minor allele-specific primers for each
SNP (e.g. SPA1-19T and SPA1-19C) were identical. The forward
primers differed only in the final 3’ end nucleotide which is
complementary to the appropriate allele, while the reverse
primers were identical. Therefore, the complementary strands
produced by DNA polymerase are the same for both the major
and minor allele-specific primers. Subsequent BLAST searches
with the obtained sequences confirmed that the regions amplified
by the allele-specific primers were from the correct locations
within SP-A1, SP-A2, and SP-D. DNA sequencing and BLAST
search results are presented in Appendix III.
3.3.4 Raw Genotype Results
Following completion of real-time PCR and SYBR® Green I
melting curve analysis, case and control population genotyping
results for each of the eleven SNPs in SP-A1, SP-A2 and SP-D
were collated in a Microsoft Excel spreadsheet. A subset of this
data is shown in Table 3.4.

Chapter Three: Results 64
Table 3.4. Raw genotype data for SP-A1, SP-A2, and SP-D alleles in case and
control individuals. Homozygous (e.g. G G) and heterozygous (e.g. A G)
genotypes are shown for each individual at each SNP loci.

Chapter Three: Results 65
The complete genotyping datasets for the case and control
populations are presented in Appendix IV.
3.4 Haploview
The raw SNP genotype data for the case and control populations
was converted into a tab-delimited text file for importation into
the Haploview software. An excerpt of the Haploview import file
is provided in Figure 3.18.
1 1 0 0 2 2 4 2 3 3 1 1
2 2 0 0 1 2 4 4 3 3 1 1
3 3 0 0 1 2 4 2 2 2 1 3
137 C1 0 0 2 1 4 2 2 3 1 3
138 C2 0 0 2 1 4 2 2 3 1 1
139 C3 0 0 1 1 4 4 3 3 0 0
Figure 3.18. Excerpt of Haploview input file containing raw genotype data.
Information on case samples 1 – 6 are shown (European-Caucasian), which
includes: A) Overall sample number, B) Sample number within case/control
population, C) Father’s ID number, D) Mother’s ID number, E) Gender (1=
male, 2= female), F) Affectation status (1= control, 2=case), G) Genotypes
for SP-A1 SNPs 19, 50, and 62 (1= A, 2= C, 3= G, 4= T). Unknown values
are represented by a zero.
G
A B C D E F 19 50 62
Information on each individual in the case and control
populations was given in the Haploview import file including:
unique inter- and intra-population sample numbers; gender; and
affectation status (case/control). In addition, Haploview is often
used to analyze pedigree data and requires information on each
individual’s Father and Mother. However, for non-pedigree data,
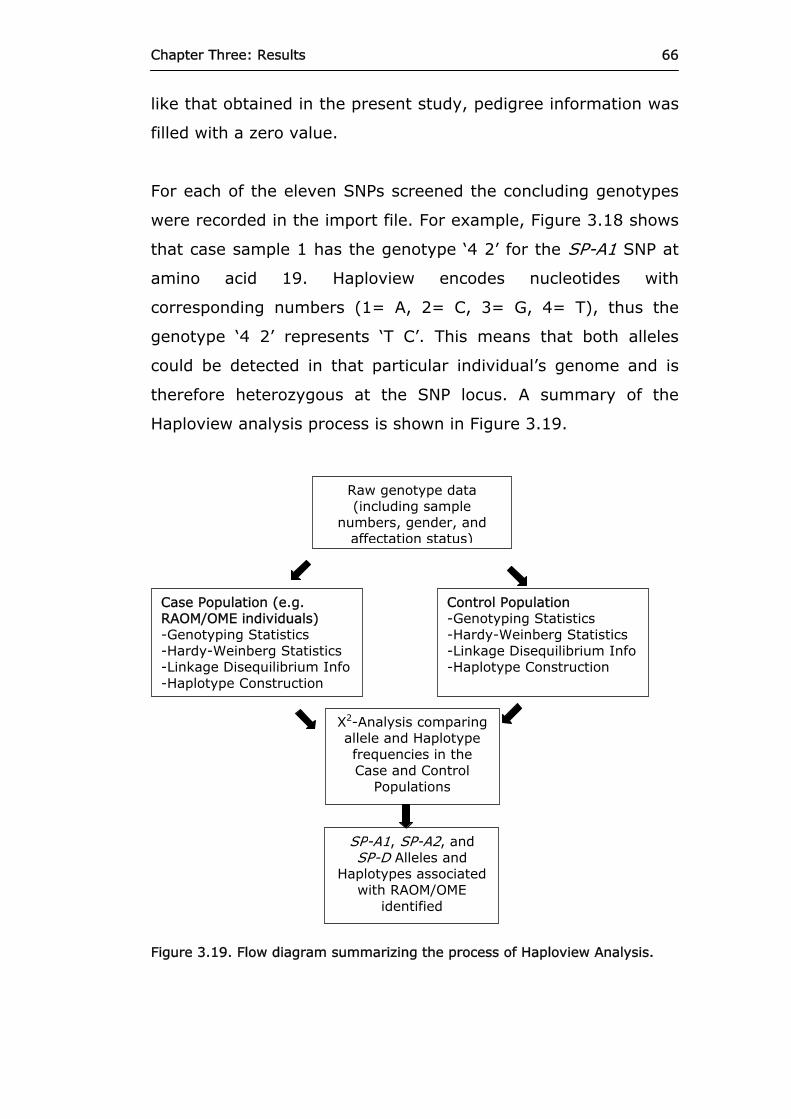
Chapter Three: Results 66
like that obtained in the present study, pedigree information was
filled with a zero value.
For each of the eleven SNPs screened the concluding genotypes
were recorded in the import file. For example, Figure 3.18 shows
that case sample 1 has the genotype ‘4 2’ for the SP-A1 SNP at
amino acid 19. Haploview encodes nucleotides with
corresponding numbers (1= A, 2= C, 3= G, 4= T), thus the
genotype ‘4 2’ represents ‘T C’. This means that both alleles
could be detected in that particular individual’s genome and is
therefore heterozygous at the SNP locus. A summary of the
Haploview analysis process is shown in Figure 3.19.
Raw genotype data (including sample
numbers, gender, and affectation status)
Χ2-Analysis comparing allele and Haplotype frequencies in the Case and Control
Populations
Control Population -Genotyping Statistics -Hardy-Weinberg Statistics -Linkage Disequilibrium Info -Haplotype Construction
Case Population (e.g. RAOM/OME individuals) -Genotyping Statistics -Hardy-Weinberg Statistics -Linkage Disequilibrium Info -Haplotype Construction
SP-A1, SP-A2, andSP-D Alleles and
Haplotypes associated with RAOM/OME
identified
Figure 3.19. Flow diagram summarizing the process of Haploview Analysis.

Chapter Three: Results 67
3.4.1 European-Caucasian Population Statistics
Table 3.5 presents the genotyping and Hardy-Weinberg
equilibrium statistics generated by Haploview for the SP-A1, SP-
A2, SP-D SNPs within the European-Caucasian case population of
RAOM/OME patients (N = 136). All of the individual SNPs were at
least 97% successfully genotyped, except for SPA1-62A/G, which
was 94.8% successfully genotyped across the case population.
The sum of the major and minor allele population frequencies
(MjAF and MAF) for a particular SNP equals one (Equation 1.0),
and if that SNP is in Hardy-Weinberg equilibrium (Equation 2.0)
in the population, then the observed genotype frequencies
should simply be a function of the relative allele frequencies.
MjAF + MAF = 1 (Equation 1.0)
MjAF2 + 2(MjAF x MAF) + MAF2 = 1 (Equation 2.0)
Equation 2.0 states that the frequency of homozygous major
allele individuals (MjAF2), heterozygous individuals (2(MjAF x
MAF)), and homozygous minor allele individuals (MAF2) also adds
up to one.
Predicted proportions of heterozygosity for the SP-A1, SP-A2,
and SP-D SNPs were then calculated using the observed minor
allele frequency (MAF) and Equation 3.0 (derived from Equation
2.0):
Predicted SNP heterozygosity = 2(MjAF x MAF) (Equation 3.0)

Chapter Three: Results 68
Observed proportions of SNP heterozygosity were then compared
to their predicted values, and any significant deviations (P <
0.0001) indicated that the alleles of that particular SNP were not
in Hardy-Weinberg equilibrium.
Within the European-Caucasian case population, minor allele
frequencies for a particular SNP locus ranged between 0.160
(SPA1-219C/T) and 0.485 (SPA1-50G/C). The mean minor allele
frequency was 0.319 ± 0.086 standard deviation (SD). In
addition, ten of the eleven SNPs were in Hardy-Weinberg
equilibrium. However, the SP-A1 50G/C polymorphism had an
observed heterozygosity frequency of 0.328, which was
significantly lower than the expected value of 0.500 (P < 0.0001)
and was thus not in Hardy-Weinberg equilibrium.

Chapter Three: Results 69
SNP ObsHET PredHET HWpval %Geno MAF M.A.
SPA1-19 0.474 0.439 0.4997 100.0 0.326 C
SPA1-50 0.328 0.500 1.00 x10⁻⁴ 97.0 0.485 C
SPA1-62 0.461 0.401 0.1451 94.8 0.277 G
SPA1-133 0.427 0.436 0.9470 97.0 0.321 G
SPA1-219 0.201 0.269 0.0133 99.3 0.160 T
SPA2-9 0.407 0.478 0.1116 100.0 0.396 C
SPA2-91 0.296 0.369 0.0386 100.0 0.244 C
SPA2-140 0.385 0.439 0.2003 100.0 0.326 T
SPA2-223 0.400 0.384 0.8436 100.0 0.259 A
SPD-11 0.393 0.447 0.2067 100.0 0.337 C
SPD-160 0.425 0.470 0.3402 99.3 0.377 A
Table 3.5. Quality statistics for the SP-A1, SP-A2, and SP-D, SNP loci
genotyped in the European-Caucasian case population. Observed (ObsHET)
and predicted (PredHET) heterozygosity values were calculated for each SNP
loci. Significant deviations from the predicted heterozygosity estimates were
determined by the Hardy-Weinberg equilibrium p value (HWpval < 0.0001)
and highlighted in bold font. The percentage of non-missing genotypes for
each SNP loci was calculated (%Geno). The minor allele (M.A.) for each SNP
loci and their corresponding population frequencies (MAF) were also
presented.
Haploview analyzed the raw genotype data and determined the
levels of linkage disequilibrium (LD) between each of the eleven
SNP loci, as illustrated in Figure 3.20. Levels of LD were
presented as: D’ (measure of LD between two SNP loci)/ LOD
(logarithm of the odds for LD between the two SNP loci).
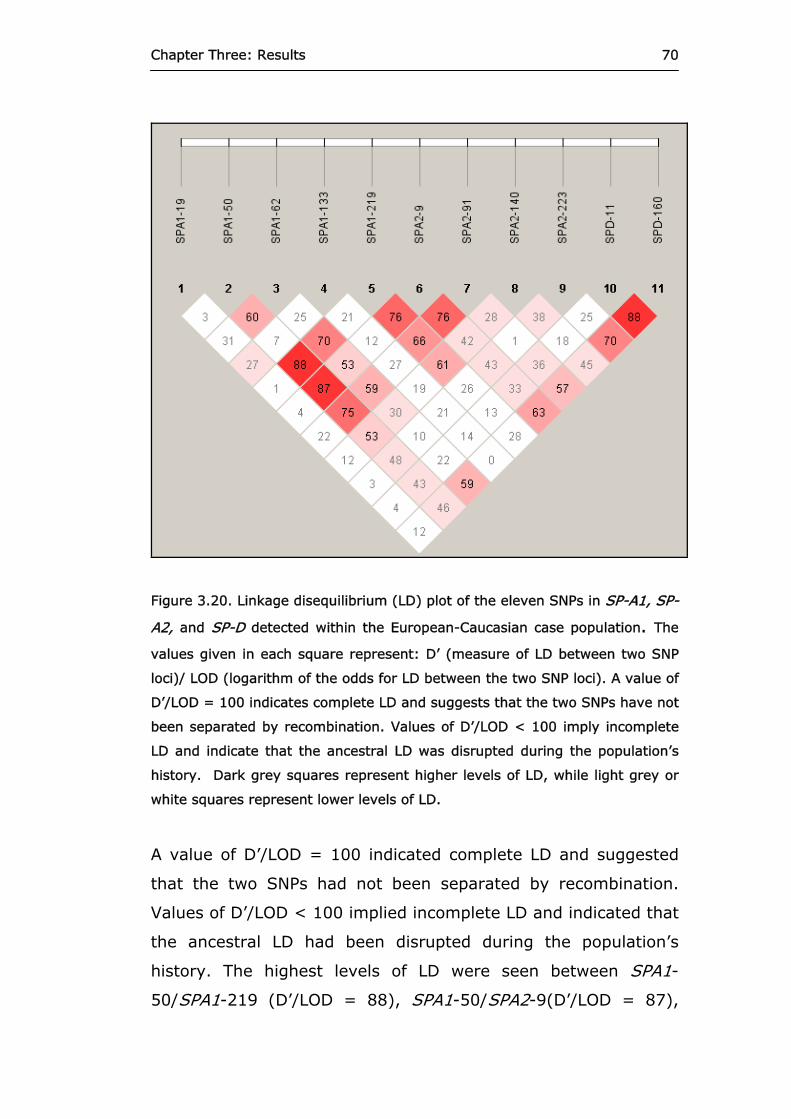
Chapter Three: Results 70
Figure 3.20. Linkage disequilibrium (LD) plot of the eleven SNPs in SP-A1, SP-
A2, and SP-D detected within the European-Caucasian case population. The
values given in each square represent: D’ (measure of LD between two SNP
loci)/ LOD (logarithm of the odds for LD between the two SNP loci). A value of
D’/LOD = 100 indicates complete LD and suggests that the two SNPs have not
been separated by recombination. Values of D’/LOD < 100 imply incomplete
LD and indicate that the ancestral LD was disrupted during the population’s
history. Dark grey squares represent higher levels of LD, while light grey or
white squares represent lower levels of LD.
A value of D’/LOD = 100 indicated complete LD and suggested
that the two SNPs had not been separated by recombination.
Values of D’/LOD < 100 implied incomplete LD and indicated that
the ancestral LD had been disrupted during the population’s
history. The highest levels of LD were seen between SPA1-
50/SPA1-219 (D’/LOD = 88), SPA1-50/SPA2-9(D’/LOD = 87),

Chapter Three: Results 71
and SPD-11/SPD-160 (D’/LOD = 88). However, very low levels
of LD were observed for both SPA1-19 and SPA1-133 when
compared with each other and the remaining SNP loci.
Following LD analysis, haplotype blocks were constructed for
each of the genes SP-A1, SP-A2, and SP-D based on the
genotyping data from individuals in the European-Caucasian case
population (Figure 3.21).
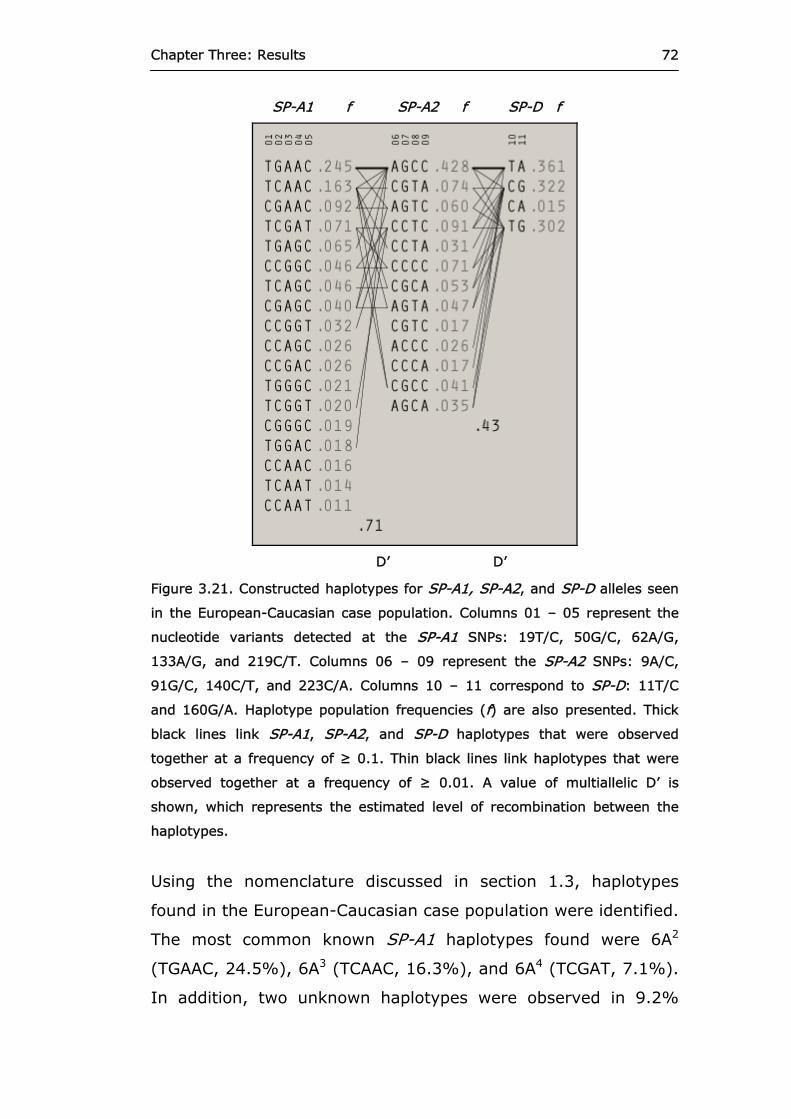
Chapter Three: Results 72
SP-A1 f SP-A2 f SP-D f
D’ D’
Figure 3.21. Constructed haplotypes for SP-A1, SP-A2, and SP-D alleles seen
in the European-Caucasian case population. Columns 01 – 05 represent the
nucleotide variants detected at the SP-A1 SNPs: 19T/C, 50G/C, 62A/G,
133A/G, and 219C/T. Columns 06 – 09 represent the SP-A2 SNPs: 9A/C,
91G/C, 140C/T, and 223C/A. Columns 10 – 11 correspond to SP-D: 11T/C
and 160G/A. Haplotype population frequencies (f) are also presented. Thick
black lines link SP-A1, SP-A2, and SP-D haplotypes that were observed
together at a frequency of ≥ 0.1. Thin black lines link haplotypes that were
observed together at a frequency of ≥ 0.01. A value of multiallelic D’ is
shown, which represents the estimated level of recombination between the
haplotypes.
Using the nomenclature discussed in section 1.3, haplotypes
found in the European-Caucasian case population were identified.
The most common known SP-A1 haplotypes found were 6A2
(TGAAC, 24.5%), 6A3 (TCAAC, 16.3%), and 6A4 (TCGAT, 7.1%).
In addition, two unknown haplotypes were observed in 9.2%

Chapter Three: Results 73
(CGAAC) and 6.5% (TGAGC) of the European-Caucasian case
population. All other SP-A1 haplotypes were found in 36.4% of
the population.
The most predominant SP-A2 haplotype, 1A0 (AGCC) was found
in 42.8% of the European-Caucasian case population. The other
commonly seen haplotypes included 1A5 (CCTC, 9.1%), 1A1
(CGTA, 7.4%), 1A (CCCC, 7.1%), and 1A9 (AGTC, 6.0%). All
remaining haplotypes combined to make up 27.6% of the SP-A2
haplotypes.
Of the four possible SP-D haplotypes, three were present in
similar proportions: TA (36.1%), CG (32.2%), and TG (30.2%).
In contrast, the remaining haplotype, CA, was found in only
1.5% of the European-Caucasian case population.
The SP-A1-SP-A2-SP-D haplotype 6A2-1A0-TA was observed in
over 10% of the European-Caucasian case population, as
illustrated by the thick black lines in Figure 3.21. Furthermore,
many other SP-A1-SP-A2-SP-D haplotypes were found at
population frequencies between 1 – 10%, shown by the thin
black lines linking the haplotypes in Figure 3.21.
3.4.2 Control Population Statistics
Table 3.6 contains the SNP genotyping and Hardy-Weinberg
equilibrium statistics for the control population (N = 160). The
SNP SPA1-62A/G was 76.9% successfully genotyped across the
whole control population. In comparison, at least 98.8% total
genotyping was achieved with the remaining ten SNPs.

Chapter Three: Results 74
SNP ObsHET PredHET HWpval %Geno MAF M.A.
SPA1-19 0.356 0.345 0.9132 100.0 0.222 C
SPA1-50 0.396 0.480 0.0384 99.4 0.399 C
SPA1-62 0.366 0.365 1.0000 76.9 0.240 G
SPA1-133 0.278 0.308 0.3265 98.8 0.190 G
SPA1-219 0.169 0.205 0.0780 100.0 0.116 T
SPA2-9 0.381 0.484 0.0106 100.0 0.409 C
SPA2-91 0.176 0.298 5.64 x10⁻⁶ 99.4 0.182 C
SPA2-140 0.377 0.383 0.9789 99.4 0.258 T
SPA2-223 0.275 0.272 1.0000 100 0.162 A
SPD-11 0.419 0.422 1.0000 100 0.303 C
SPD-160 0.394 0.488 0.0203 100 0.422 A
Table 3.6. Quality statistics for the SP-A1, SP-A2, and SP-D, SNP loci
genotyped in the control population. Observed (ObsHET) and predicted
(PredHET) heterozygosity values were calculated for each SNP loci. Significant
deviations from the predicted heterozygosity estimates were determined by
the Hardy-Weinberg equilibrium p value (HWpval < 0.0001) and highlighted
in bold font. The percentage of non-missing genotypes for each SNP loci was
calculated (%Geno). The minor allele (M.A.) for each SNP loci and their
corresponding population frequencies (MAF) were also presented.
SNP minor allele frequencies ranged between 0.116 (SPA1-
219C/T) and 0.422 (SPD-160G/A). The mean minor allele
frequency was 0.265 ± 0.107 SD.
Similar to the European-Caucasian case population, ten of the
SP-A1, SP-A2, and SP-D SNPs were in Hardy-Weinberg
equilibrium. However, in this instance it was the SPA2-91G/C
polymorphism which had an observed heterozygosity frequency
of 0.176. This value was significantly lower than the expected
heterozygosity frequency of 0.298 (P < 0.0001).
Chapter Three: Results 75
As with the European-Caucasian case population, LD analysis
was performed by Haploview to determine the levels of LD
between the eleven SNP loci in the control population (Figure
3.22).
Similar patterns of LD were observed in the control population in
comparison to the European-Caucasian case population. The
highest levels of LD were found between SPA1-50/SPA1-219
(D’/LOD = 83), SPA1-62/SPA1-219 (D’/LOD = 84), SPA1-
219/SPD-160 (D’/LOD = 80), and SPD-11/SPD-160 (D’/LOD =
88). Complete LD was observed in the analysis of SPA1-62 and
SPA2-223 (D’/LOD = 100).
In addition, the lowest levels of LD were again seen in the
assessments of SPA1-19 and SPA1-133, with the remaining SNP
loci in the control population.

Chapter Three: Results 76
Figure 3.22. Linkage disequilibrium plot of the eleven SNPs in SP-A1, SP-A2,
and SP-D detected within the control population. The values given in each
square represent: D’ (measure of LD between two SNP loci)/ LOD (logarithm
of the odds for LD between the two SNP loci). A value of D’/LOD = 1 indicates
complete LD and suggests that the two SNPs have not been separated by
recombination. Values of D’/LOD < 1 imply incomplete LD and indicate that
the ancestral LD was disrupted during the population’s history. Dark grey
squares represent higher levels of LD, while light grey or white squares
represent lower levels of LD. D’/LOD values of 100 are not shown and are
represented by a blank square.
As shown in Figure 3.23, the most frequent SP-A1 haplotypes
found in the control population included 6A2 (TGAAC, 39.9%),
6A3 (TCAAC, 16.5%), CGAAC (7.9%), and 6A4 (TCGAT, 4.6%).
However, the haplotype 6A (CCGGC) was also found in 3.9% of
the population. All other SP-A1 haplotypes were found in 27.2%
of the population.

Chapter Three: Results 77
SP-A1 f SP-A2 f SP-D f
D’ D’
Figure 3.23. Constructed haplotypes for SP-A1, SP-A2, and SP-D alleles seen
in the control population. Columns 01 – 05 represent the nucleotide variants
detected at the SP-A1 SNPs: 19T/C, 50G/C, 62A/G, 133A/G, and 219C/T.
Columns 06 – 09 represent the SP-A2 SNPs: 9A/C, 91G/C, 140C/T, and
223C/A. Columns 10 – 11 correspond to SP-D: 11T/C and 160G/A. Haplotype
population frequencies (f) are also presented. Thick black lines link SP-A1, SP-
A2, and SP-D haplotypes that were observed together at a frequency of ≥
0.1. Thin black lines link haplotypes that were observed together at a
frequency of ≥ 0.01. A value of multiallelic D’ is shown, which represents the
estimated level of recombination between the haplotypes.
Approximately half of all the individuals in the control population
exhibited the SP-A2 haplotype, 1A0 (AGCC, 49.9%). Other
common haplotypes presented were 1A2 (CGCC, 10.7%), 1A1
(CGTA, 8.8%), 1A5 (CCTC, 7.9%), and 1A (CCCC, 5.7%). All
remaining haplotypes combined to make up 17% of the SP-A2
haplotypes.
Chapter Three: Results 78
Similar to the European-Caucasian case population, the SP-D
haplotype CA was found in only 1.6% of the control population.
Haplotypes TA, CG, and TG were found to contribute 40.6%,
30.0%, and 27.8%, respectively.
The SP-A1-SP-A2-SP-D haplotype 6A2-1A0-TA was again
observed in over 10% of the control population, as illustrated by
the thick black lines in Figure 3.23. However, 6A2-1A0-TG and
6A2-1A0-CG were also found in over 10% of the control
individuals.
3.5 Allele and Haplotype Associations with RAOM/OME
3.5.1 Association of Single SNP Alleles with RAOM/OME
Following determination of SP-A1, SP-A2, and SP-D
genotype/haplotype frequencies in both the individuals with
RAOM/OME and the control population, Haploview was further
employed to investigate if there was any significant difference of
these values between the two populations. If a significant
difference in genotype/haplotype frequencies was seen between
the two populations, it would indicate an association between
that particular allele/haplotype with RAOM/OME.
Initially, Haploview compared the major and minor allele
frequencies for each SNP in the case and control populations.
Using Chi square (χ2) analysis, significant differences were
identified (P < 0.05) therefore suggesting an association
between a particular allele and RAOM/OME (Table 3.7).

Chapter Three: Results 79
SNP Assoc Allele
Case,Control Frequencies
Chi square P value
SPA1-19 C 0.326, 0.222 8.053 0.0045
SPA1-50 C 0.485, 0.399 2.380 0.1229
SPA1-62 A 0.280, 0.261 0.003 0.9542
SPA1-133 G 0.319, 0.190 12.886 3.00 x10⁻⁴
SPA1-219 T 0.160, 0.116 2.493 0.1144
SPA2-9 A 0.604, 0.591 0.104 0.747
SPA2-91 C 0.244, 0.182 3.218 0.0728
SPA2-140 T 0.326, 0.258 3.291 0.0696
SPA2-223 A 0.259, 0.162 8.359 0.0038
SPD-11 T 0.337, 0.316 0.007 0.9343
SPD-160 G 0.623, 0.578 1.230 0.2675
Table 3.7. Single SNP allele associations with RAOM/OME. For each SNP locus,
the associated allele’s case/control population frequencies, χ2 test result, and
P value are presented. Statistically significant differences in the case and
control populations are highlighted in bold font.
Minor alleles of the SNPs SPA1-19, SPA1-133, and SPA2-223
were found to be associated with RAOM/OME. The presence of a
cytosine at codon 19 of SP-A1 was found in 32.6% of the
European-Caucasian case population, but only 22.2% of the
control population. The calculated χ2 value for this allele was
8.053 (P = 0.0045).
Also in SP-A1, a guanine at codon 133 was detected in 31.9%
and 19.0% of the European-Caucasian case and control
population, respectively. This difference was found to be
significantly different by χ2 analysis
(χ2 = 12.886, P = 3.00 x10⁻⁴).
Chapter Three: Results 80
Finally, an adenine at codon 223 of SP-A2 was also found to be
over-represented in the population containing individuals with
RAOM/OME (χ2 = 8.359, P = 0.0038), present in 25.9% of
European-Caucasian case individuals and only 16.2% of control
individuals.
3.5.2 Association of Haplotypes with RAOM/OME
The χ2 analysis for statistical significance between European-
Caucasian case and control population frequencies was repeated
for the SP-A1, SP-A2, and SP-D haplotypes previously
constructed by the Haploview software. The associations of the
SP-A1 haplotypes with RAOM/OME are presented in Table 3.8.
SP-A1 haplotypes 6A2 and CGAGC were found to be associated
with RAOM/OME. Haplotype 6A2 was found to be under-
represented in the European-Caucasian case population (24.9%)
in comparison to the control population (38.9%). This population
frequency difference was determined statistically significant (χ2
= 12.813, P = 3.00 x10⁻⁴).
The population frequency of the haplotype CGAGC was also
significantly different, with 5% in the European-Caucasian case
population and 3.6% in the control population (χ2 = 6.932, P =
0.0085). All other haplotype population differences were not
statistically significant i.e. P > 0.05).
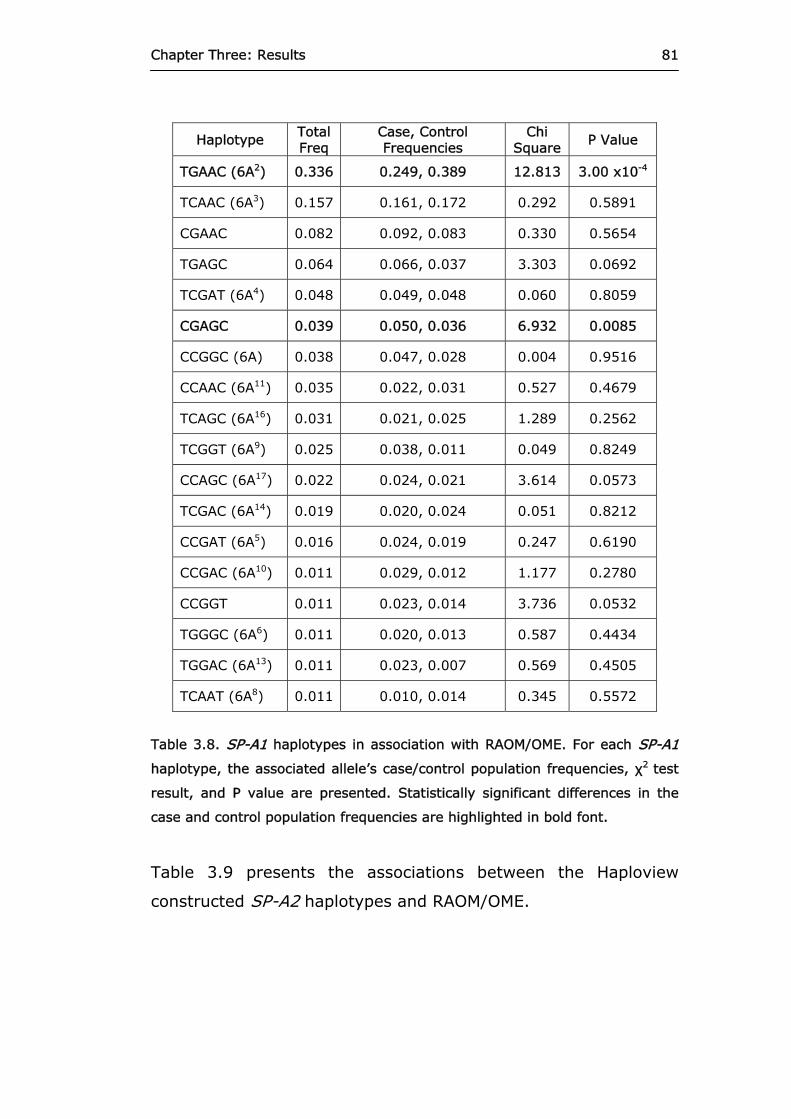
Chapter Three: Results 81
Haplotype Total Freq
Case, Control Frequencies
Chi Square
P Value
TGAAC (6A2) 0.336 0.249, 0.389 12.813 3.00 x10⁻⁴
TCAAC (6A3) 0.157 0.161, 0.172 0.292 0.5891
CGAAC 0.082 0.092, 0.083 0.330 0.5654
TGAGC 0.064 0.066, 0.037 3.303 0.0692
TCGAT (6A4) 0.048 0.049, 0.048 0.060 0.8059
CGAGC 0.039 0.050, 0.036 6.932 0.0085
CCGGC (6A) 0.038 0.047, 0.028 0.004 0.9516
CCAAC (6A11) 0.035 0.022, 0.031 0.527 0.4679
TCAGC (6A16) 0.031 0.021, 0.025 1.289 0.2562
TCGGT (6A9) 0.025 0.038, 0.011 0.049 0.8249
CCAGC (6A17) 0.022 0.024, 0.021 3.614 0.0573
TCGAC (6A14) 0.019 0.020, 0.024 0.051 0.8212
CCGAT (6A5) 0.016 0.024, 0.019 0.247 0.6190
CCGAC (6A10) 0.011 0.029, 0.012 1.177 0.2780
CCGGT 0.011 0.023, 0.014 3.736 0.0532
TGGGC (6A6) 0.011 0.020, 0.013 0.587 0.4434
TGGAC (6A13) 0.011 0.023, 0.007 0.569 0.4505
TCAAT (6A8) 0.011 0.010, 0.014 0.345 0.5572
Table 3.8. SP-A1 haplotypes in association with RAOM/OME. For each SP-A1
haplotype, the associated allele’s case/control population frequencies, χ2 test
result, and P value are presented. Statistically significant differences in the
case and control population frequencies are highlighted in bold font.
Table 3.9 presents the associations between the Haploview
constructed SP-A2 haplotypes and RAOM/OME.

Chapter Three: Results 82
Haplotype Total Freq
Case, Control Frequencies
Chi Square
P Value
AGCC (1A0) 0.443 0.425, 0.490 3.763 0.0524
CCTC (1A5) 0.084 0.089, 0.079 0.092 0.7620
CGTA (1A1) 0.084 0.080, 0.083 0.012 0.9113
CGCC (1A2) 0.072 0.046, 0.111 6.135 0.0133
CCCC (1A) 0.07 0.070, 0.056 0.043 0.8352
ACCC (1A12) 0.046 0.046, 0.033 0.907 0.3408
CGCA (1A8) 0.04 0.055, 0.024 0.692 0.4056
AGTC (1A9) 0.037 0.040, 0.024 4.058 0.0440
AGCA 0.031 0.018, 0.037 1.434 0.2310
CGTC (1A6) 0.029 0.046, 0.013 1.868 0.1717
AGTA (1A3) 0.025 0.030, 0.025 5.578 0.0182
CCTA (1A10) 0.016 0.030, 0.007 4.258 0.0391
ACTC (1A7) 0.013 0.009, 0.015 0.250 0.6171
Table 3.9. SP-A2 haplotypes in association with RAOM/OME. For each SP-A2
haplotype, the associated allele’s case/control population frequencies, χ2 test
result, and P value are presented. Statistically significant differences in the
case and control populations are highlighted in bold font.
Of the thirteen SP-A2 haplotypes identified, 1A9, 1A3, and 1A10,
were found to be over-represented in the European-Caucasian
case population containing individuals with RAOM/OME (P <
0.05). In contrast, haplotype 1A2 was found in 4.6% of
European-Caucasian individuals with RAOM/OME, and 11.1% of
control individuals (χ2 = 6.135, P = 0.0133).
Lastly, associations between SP-D haplotypes and RAOM/OME
were investigated and the results are shown in Table 3.10.
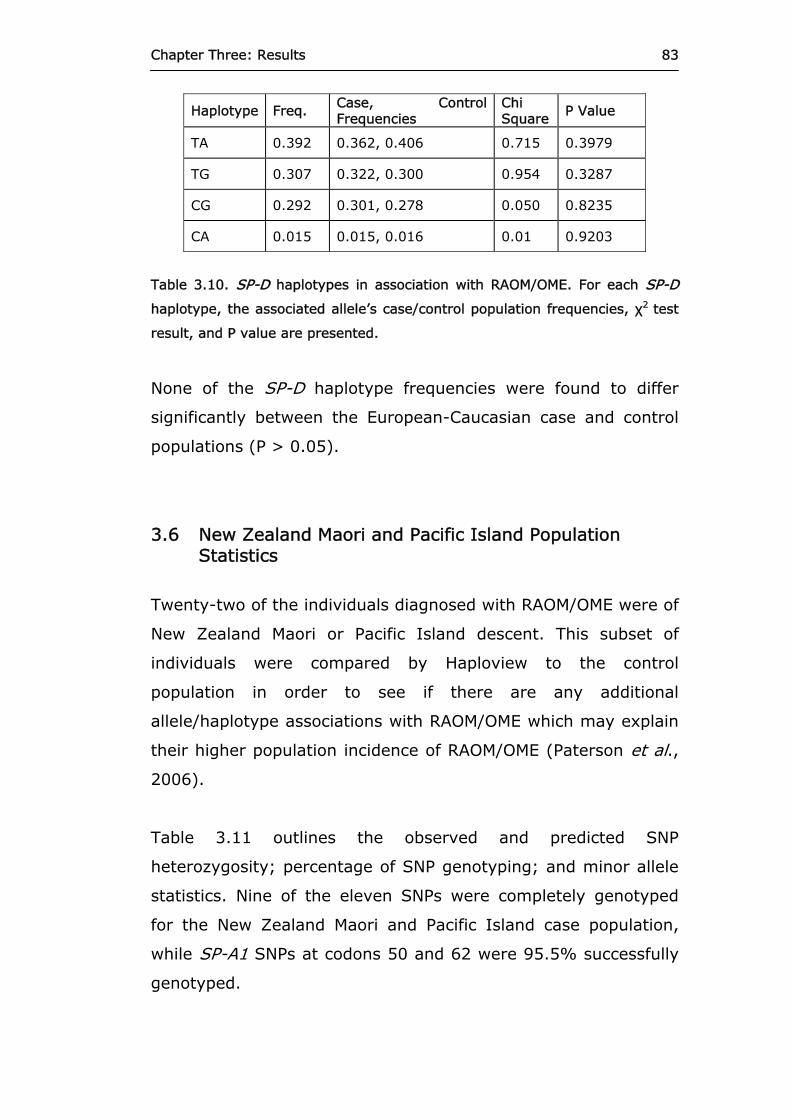
Chapter Three: Results 83
Haplotype Freq. Case, Control Frequencies
Chi Square P Value
TA 0.392 0.362, 0.406 0.715 0.3979
TG 0.307 0.322, 0.300 0.954 0.3287
CG 0.292 0.301, 0.278 0.050 0.8235
CA 0.015 0.015, 0.016 0.01 0.9203
Table 3.10. SP-D haplotypes in association with RAOM/OME. For each SP-D
haplotype, the associated allele’s case/control population frequencies, χ2 test
result, and P value are presented.
None of the SP-D haplotype frequencies were found to differ
significantly between the European-Caucasian case and control
populations (P > 0.05).
3.6 New Zealand Maori and Pacific Island Population Statistics
Twenty-two of the individuals diagnosed with RAOM/OME were of
New Zealand Maori or Pacific Island descent. This subset of
individuals were compared by Haploview to the control
population in order to see if there are any additional
allele/haplotype associations with RAOM/OME which may explain
their higher population incidence of RAOM/OME (Paterson et al.,
2006).
Table 3.11 outlines the observed and predicted SNP
heterozygosity; percentage of SNP genotyping; and minor allele
statistics. Nine of the eleven SNPs were completely genotyped
for the New Zealand Maori and Pacific Island case population,
while SP-A1 SNPs at codons 50 and 62 were 95.5% successfully
genotyped.

Chapter Three: Results 84
The minor allele frequency for a particular SNP ranged between
0.25 (SPA1-133 and SPD-160) and 0.477 (SPA2-9 and SPA2-
140). The mean minor allele frequency was 0.352 ± 0.084 SD.
SNP ObsHET PredHET HWpval %Geno MAF M.A.
SPA1-19 0.455 0.434 1.000 100.0 0.318 C
SPA1-50 0.333 0.387 0.8187 95.5 0.262 G
SPA1-62 0.714 0.459 0.0360 95.5 0.357 G
SPA1-133 0.500 0.375 0.3768 100.0 0.250 G
SPA1-219 0.273 0.434 0.1693 100.0 0.318 T
SPA2-9 0.409 0.499 0.5954 100.0 0.477 A
SPA2-91 0.409 0.474 0.7539 100.0 0.386 C
SPA2-140 0.409 0.499 0.5954 100.0 0.477 C
SPA2-223 0.500 0.449 1.0000 100.0 0.341 A
SPD-11 0.409 0.491 0.6450 100.0 0.432 C
SPD-160 0.500 0.375 0.3768 100.0 0.250 A
Table 3.11. Quality statistics for the SP-A1, SP-A2, and SP-D, SNP loci
genotyped in the New Zealand Maori and Pacific Island population with
RAOM/OME. Observed (ObsHET) and predicted (PredHET) heterozygosity
values were calculated for each SNP loci. Significant deviations from the
predicted heterozygosity estimates were determined by the Hardy-Weinberg
equilibrium p value (HWpval < 0.0001). The percentage of non-missing
genotypes for each SNP loci was calculated (%Geno). The minor allele (M.A.)
for each SNP loci and their corresponding population frequencies (MAF) were
also presented.
The differences between the predicted and observed values of
heterozygosity for each SNP were determined to be not
statistically significant, therefore suggesting that all the SNPs
were in Hardy-Weinberg equilibrium (P > 0.001).

Chapter Three: Results 85
Following evaluation of SNP genotyping and Hardy-Weinberg
statistics, the levels of LD between each pair of SNPs were
calculated. The results from the LD analysis are shown in Figure
3.24.
Complete LD (D’/LOD = 100) was observed between five pairs of
SNPs: SPA1-50/SPA2-9, SPA1-62/SPA1-133, SPA1-50/SPA2-
223, SPA1-133/SPA2-223, and SPA2-223/SPD-160. As
previously seen in both the European-Caucasian case and control
populations, SPA1-19 exhibited very low levels of LD with the
rest of the SNP loci.
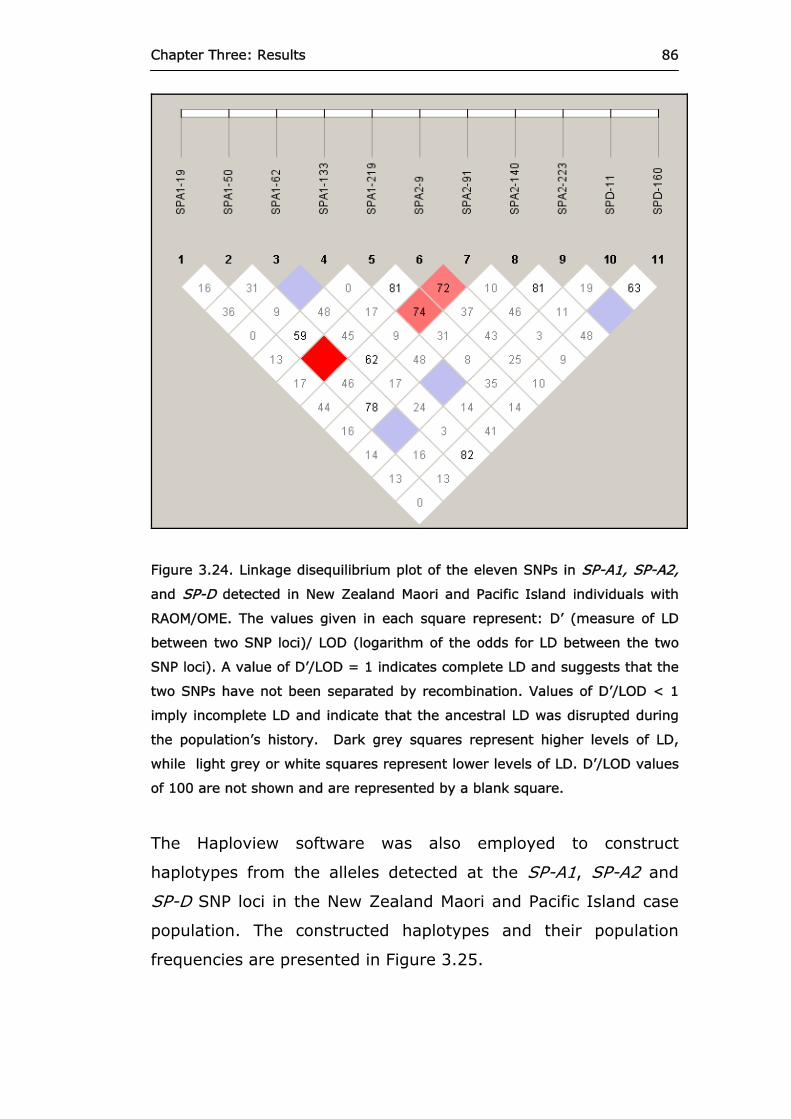
Chapter Three: Results 86
Figure 3.24. Linkage disequilibrium plot of the eleven SNPs in SP-A1, SP-A2,
and SP-D detected in New Zealand Maori and Pacific Island individuals with
RAOM/OME. The values given in each square represent: D’ (measure of LD
between two SNP loci)/ LOD (logarithm of the odds for LD between the two
SNP loci). A value of D’/LOD = 1 indicates complete LD and suggests that the
two SNPs have not been separated by recombination. Values of D’/LOD < 1
imply incomplete LD and indicate that the ancestral LD was disrupted during
the population’s history. Dark grey squares represent higher levels of LD,
while light grey or white squares represent lower levels of LD. D’/LOD values
of 100 are not shown and are represented by a blank square.
The Haploview software was also employed to construct
haplotypes from the alleles detected at the SP-A1, SP-A2 and
SP-D SNP loci in the New Zealand Maori and Pacific Island case
population. The constructed haplotypes and their population
frequencies are presented in Figure 3.25.

Chapter Three: Results 87
SP-A1 f SP-A2 f SP-D f
D’ D’
Figure 3.25. Constructed haplotypes for SP-A1, SP-A2, and SP-D alleles seen
in the New Zealand Maori and Pacific Island case population. Columns 01 – 05
represent the nucleotide variants detected at the SP-A1 SNPs: 19T/C, 50G/C,
62A/G, 133A/G, and 219C/T. Columns 06 – 09 represent the SP-A2 SNPs:
9A/C, 91G/C, 140C/T, and 223C/A. Columns 10 – 11 correspond to SP-D:
11T/C and 160G/A. Haplotype population frequencies (f) are also presented.
Thick black lines link SP-A1, SP-A2, and SP-D haplotypes that were observed
together at a frequency of ≥0.1. Thin black lines link haplotypes that were
observed together at a frequency of ≥0.01. A value of multiallelic D’ is shown,
which represents the estimated level of recombination between the
haplotypes.
In common with both the European-Caucasian case and control
populations, the most frequent SP-A1 haplotype (37.6%) found
in the New Zealand Maori/Pacific Island case population was 6A2
(TGAAC). This was followed by haplotypes 6A3 (TCAAC, 15.6%),
CGAAC (6.6%), 6A11 (CCAAC, 6.4%), and 6A4 (TCGAT, 5.2%).

Chapter Three: Results 88
The remaining haplotypes identified contributed to 28.6% of the
population.
Again, the predominant SP-A2 haplotype previously seen in both
the European-Caucasian case and control populations, 1A0
(AGCC), was also the major haplotype in the New Zealand Maori
and Pacific Island case population (45.6%). Haplotype 1A1
(CGTA) was detected in 9.7% of the population. The next most
common haplotypes 1A5 (CCTC), 1A2 (CGCC), and 1A (CCCC)
were found in 8.7%, 8.5%, and 7.4% of the population,
respectively. The remaining SP-A2 haplotypes identified made-up
20.1% of the total number of haplotypes found.
The three SP-D haplotypes TA, TG, and CG were found in 38.6%,
30.6%, and 29.3% of the New Zealand Maori and Pacific Island
case population. The remaining 1.5% of individuals displayed the
haplotype CA.
In addition, SP-A1-SP-A2-SP-D haplotypes 6A2-1A0-TA and 6A2-
1A0-TG were both shown to be present in over 10% of the
individuals from the New Zealand Maori and Pacific Island case
population.
3.6.1 Association of Single SNP Alleles with RAOM/OME in the New Zealand Maori and Pacific Island Population
Following analysis of genotype and haplotype frequencies in the
New Zealand Maori and Pacific Island case population, Haploview
compared these values with those determined from the control
population and identified any statistically significant differences
(P < 0.05). The results from the comparative analysis of allele
frequencies are presented in Table 3.12.

Chapter Three: Results 89
SNP Assoc Allele
Case, Control Frequencies Chi square
P value
SPA1-19 C 0.318, 0.222 2.004 0.1568
SPA1-50 C 0.738, 0.399 17.285 3.22 x10⁻⁵
SPA1-62 G 0.372, 0.261 2.270 0.1319
SPA1-133 G 0.250, 0.190 0.882 0.3477
SPA1-219 T 0.318, 0.116 13.173 3.00 x10⁻⁴
SPA2-9 C 0.523, 0.409 2.036 0.1536
SPA2-91 C 0.386, 0.182 9.790 0.0018
SPA2-140 T 0.523, 0.258 13.168 3.00 x10⁻⁴
SPA2-223 A 0.341, 0.162 8.198 0.0042
SPD-11 C 0.432, 0.316 2.363 0.1242
SPD-160 G 0.750, 0.578 4.757 0.0292
Table 3.12. Allele associations with RAOM/OME seen in New Zealand Maori
and Pacific Island individuals. For each SNP, the associated allele’s
case/control population frequencies, χ2 test result, and P value are presented.
Statistically significant differences between the New Zealand Maori and Pacific
Island case population and the control population are highlighted in bold font.
In common with the European-Caucasian case population, an
adenine at codon 223 of SP-A2 was also associated with
increased risk of RAOM/OME in New Zealand Maori and Pacific
Island individuals in comparison to the control population (χ2 =
8.198, P = 0.0042). However, the association of a cytosine and a
guanine at codons 19 and 133 of SP-A1, respectively, previously
seen in the European-Caucasian case population was not found
in the New Zealand Maori and Pacific Island case population.
In addition to the allele 223A, two other SP-A2 alleles were more
frequent in the New Zealand Maori and Pacific Island case
population: 91C and 140T. A cytosine at codon 91 of SP-A2 was

Chapter Three: Results 90
present in 38.6% of the New Zealand Maori and Pacific Island
individuals but only 18.2% of the control individuals (χ2 = 9.790,
P = 0.0018). At SP-A2 codon 140, a thymidine was found in
52.3% and 25.8% of the New Zealand Maori/Pacific Island and
control individuals, respectively (χ2 = 13.168, P = 3.00 x10⁻⁴).
SP-A1 alleles 50C and 219T were found to be over-represented
in the New Zealand Maori/Pacific Island case population,
compared to the control population. A cytosine at codon 50 was
detected in 73.8% of the New Zealand Maori/Pacific Island
individuals, but was much less frequent in the control population
(39.9%: χ2 = 17.285, P = 3.22 x10⁻⁵). Within the New Zealand
Maori/Pacific Island individuals, 31.8% were found to carry a
thymidine at codon 219 of SP-A1, while only 11.6% of the
control individuals had the same allele (χ2 = 13.173, P = 3.00
x10-4).
In the European-Caucasian case population, none of the SP-D
alleles were found to be over- or under- represented and were
therefore not associated with RAOM/OME. However, in the New
Zealand Maori/Pacific Island case population a guanine at codon
160 of SP-D was detected in 75% of the individuals. This minor
allele was significantly less frequent in the control population,
with 57.8% exhibiting a guanine at codon 160 (χ2 = 4.757, P =
0.0292), indicating that this allele is associated with an increased
risk of RAOM/OME in New Zealand Maori and Pacific Island
individuals.
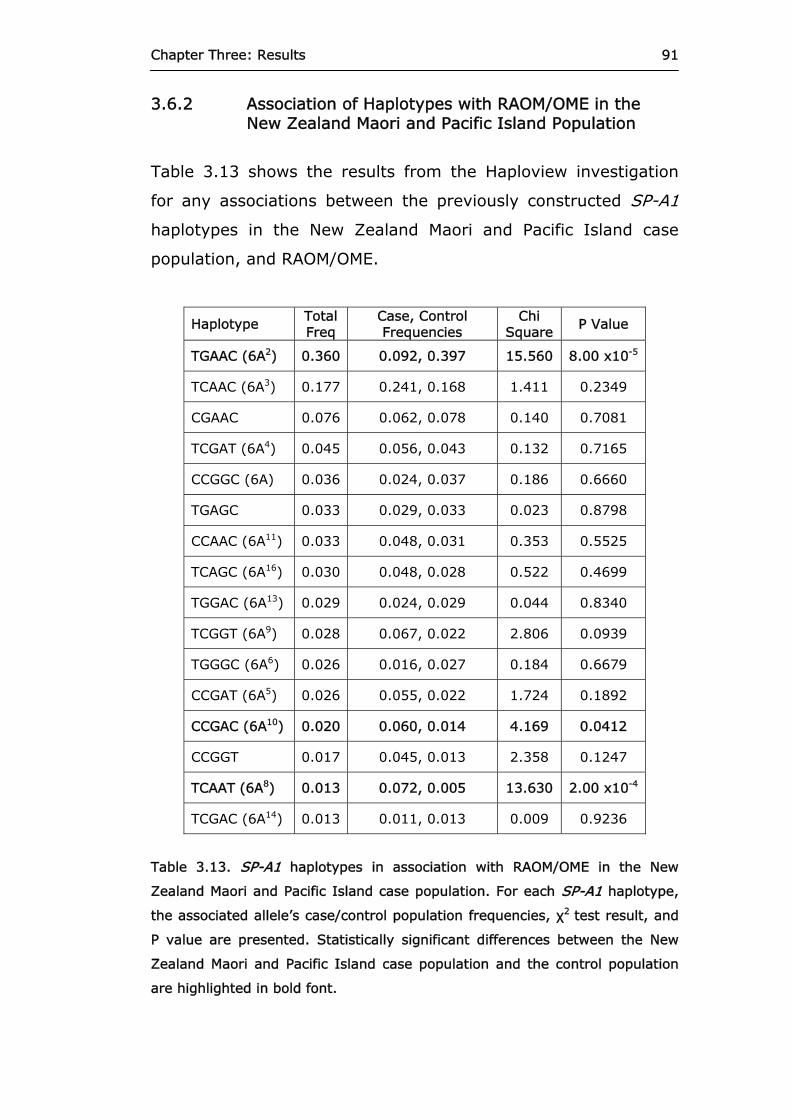
Chapter Three: Results 91
3.6.2 Association of Haplotypes with RAOM/OME in the New Zealand Maori and Pacific Island Population
Table 3.13 shows the results from the Haploview investigation
for any associations between the previously constructed SP-A1
haplotypes in the New Zealand Maori and Pacific Island case
population, and RAOM/OME.
Haplotype Total Freq
Case, Control Frequencies
Chi Square
P Value
TGAAC (6A2) 0.360 0.092, 0.397 15.560 8.00 x10⁻⁵
TCAAC (6A3) 0.177 0.241, 0.168 1.411 0.2349
CGAAC 0.076 0.062, 0.078 0.140 0.7081
TCGAT (6A4) 0.045 0.056, 0.043 0.132 0.7165
CCGGC (6A) 0.036 0.024, 0.037 0.186 0.6660
TGAGC 0.033 0.029, 0.033 0.023 0.8798
CCAAC (6A11) 0.033 0.048, 0.031 0.353 0.5525
TCAGC (6A16) 0.030 0.048, 0.028 0.522 0.4699
TGGAC (6A13) 0.029 0.024, 0.029 0.044 0.8340
TCGGT (6A9) 0.028 0.067, 0.022 2.806 0.0939
TGGGC (6A6) 0.026 0.016, 0.027 0.184 0.6679
CCGAT (6A5) 0.026 0.055, 0.022 1.724 0.1892
CCGAC (6A10) 0.020 0.060, 0.014 4.169 0.0412
CCGGT 0.017 0.045, 0.013 2.358 0.1247
TCAAT (6A8) 0.013 0.072, 0.005 13.630 2.00 x10⁻⁴
TCGAC (6A14) 0.013 0.011, 0.013 0.009 0.9236
Table 3.13. SP-A1 haplotypes in association with RAOM/OME in the New
Zealand Maori and Pacific Island case population. For each SP-A1 haplotype,
the associated allele’s case/control population frequencies, χ2 test result, and
P value are presented. Statistically significant differences between the New
Zealand Maori and Pacific Island case population and the control population
are highlighted in bold font.

Chapter Three: Results 92
In common with the earlier haplotype analysis of the European-
Caucasian case population, under-representation of the SP-A1
haplotype 6A2 was also seen in the New Zealand Maori/Pacific
Island case population (9.2%), compared to the control
population (39.7%). Thus suggesting that the particular
haplotype is protective against RAOM/OME (χ2 = 15.560, P =
8.00 x10⁻⁵). Two SP-A1 haplotypes, 6A8 and 6A10, were found to
be significantly more frequent in the New Zealand Maori/Pacific
Island case individuals in comparison to the control population (P
< 0.05).
Associations between SP-A2 haplotypes and RAOM/OME in the
New Zealand Maori and Pacific Island case population are shown
in Table 3.14.

Chapter Three: Results 93
Haplotype Total Freq
Case, Control Frequencies
Chi Square
P Value
AGCC (1A0) 0.468 0.264, 0.496 8.361 0.0038
CGCC (1A2) 0.098 0.010, 0.110 4.321 0.0377
CGTA (1A1) 0.095 0.152, 0.087 1.883 0.1700
CCTC (1A5) 0.085 0.135, 0.079 1.557 0.2121
CCCC (1A) 0.063 0.113, 0.057 2.050 0.1523
CGTC (1A6) 0.033 0.008, 0.037 1.026 0.3111
CGCA (1A8) 0.032 0.028, 0.033 0.022 0.8811
AGTC (1A9) 0.027 0.068, 0.021 3.253 0.0713
ACCC (1A12) 0.026 0.048, 0.023 1.029 0.3104
AGCA 0.022 0.013, 0.024 0.191 0.6622
CCTA (1A10) 0.016 0.077, 0.008 11.510 7.00 x10⁻⁴
AGTA (1A3) 0.016 0.070, 0.009 8.896 0.0029
ACTC (1A7) 0.015 0.013, 0.016 0.022 0.883
Table 3.14. SP-A2 haplotypes in association with RAOM/OME in the New
Zealand Maori and Pacific Island case population. For each SP-A2 haplotype,
the associated allele’s case/control population frequencies, χ2 test result, and
P value are presented. Statistically significant differences between the New
Zealand Maori and Pacific Island case population and the control population
are highlighted in bold font.
In the European-Caucasian case population, the SP-A2 haplotype
1A2 was the only haplotype found to be under-represented (P <
0.05). However, both 1A2 and 1A0 were found to be significantly
less common in the New Zealand Maori/Pacific Island case
population than the control population. Haplotype 1A2 was found
in only 1% of the New Zealand Maori/Pacific Island case
individuals, but in 11% of the control individuals (χ2 = 4.321, P
= 0.0377). Furthermore, haplotype 1A0 was present in 26.4%
and 49.6% of the New Zealand Maori and Pacific Island case

Chapter Three: Results 94
population and control population, respectively (χ2 = 8.361, P =
0.0038).
On the other hand, SP-A2 haplotypes 1A3 and 1A10 were over-
represented in the European-Caucasian case population, and this
finding was repeated in the New Zealand Maori and Pacific Island
case population. Haplotype 1A3 was found in 7% of the New
Zealand Maori/Pacific Island case individuals, but only 0.9% of
the control individuals (χ2 = 8.896, P = 0.0038). Similarly,
haplotype 1A10 was present in 7.7% of the New Zealand
Maori/Pacific Island case individuals and 0.8% of the control
individuals (χ2 = 11.51, P = 7.00 x10⁻⁴).
None of the SP-D haplotypes were found to be significantly
associated with RAOM/OME in the previous analysis of the
European-Caucasian case population. However, in the New
Zealand Maori and Pacific Island case population the haplotype
TA was under-represented, indicating that it has a protective
function against RAOM/OME (Table 3.15). Approximately 20% of
New Zealand Maori/Pacific Island individuals diagnosed with
RAOM/OME had a thymidine and an adenine at codons 11 and
160, correspondingly. However, this quantity was significantly
higher in the control population, with 40.6% of the individuals
displaying the haplotype TA (χ2 = 5.480, P = 0.0192).

Chapter Three: Results 95
Haplotype Total Freq
Case, Control Frequencies
Chi Square
P Value
TA 0.384 0.223, 0.406 5.480 0.0192
CG 0.312 0.405, 0.299 1.988 0.1586
TG 0.287 0.345, 0.279 0.845 0.3580
CA 0.017 0.027, 0.016 0.28 0.5967
Table 3.15. SP-D haplotypes in association with RAOM/OME in the New
Zealand Maori and Pacific Island case population. For each SP-D haplotype,
the associated allele’s case/control population frequencies, χ2 test result, and
P value are presented. Statistically significant differences between the New
Zealand Maori and Pacific Island case population and the control population
are highlighted in bold font.
3.7 Association with Meningococcal Disease
Three individuals diagnosed with meningococcal diseases were
also genotyped for the eleven SP-A1, SP-A2, and SP-D
polymorphisms, and the findings are presented in Table 3.16.
Sample M1 was found to be heterozygous for both the major and
minor alleles at three SP-A1 loci (codons 19, 50, and 62), two
SP-A2 loci (codons 9 and 223), and the two SP-D loci (codons 11
and 160). Only the major allele was detected at codon 219 of
SP-A1, and codon 140 of SP-A2. However, sample M1 was
homozygous for the minor allele at SPA1-133 and SPA2-91.
At eight of the eleven SNP loci, sample M2 was determined to be
homozygous for the major allele. In contrast, this individual was
heterozygous for both alleles at SNPs SPA1-50, SPA1-133, and
SPA2-9.

Chapter Three: Results 96
The last of the three meningococcal samples, M3, was
homozygous for the major alleles at ten of the eleven SNP loci.
The exception was seen at codon 19 of SP-A1, where both the
major and minor alleles were detected.
Genotypes Detected SNP Alleles
M1 M2 M3
SPA1-19T/C TC TT TC
SPA1-50G/C GC GC GG
SPA1-62A/G AG AA AA
SPA1-133A/G GG AG AA
SPA1-219C/T CC CC CC
SPA2-9A/C AC AC AA
SPA2-91G/C CC GG GG
SPA2-140C/T CC CC CC
SPA2-223C/A CA CC CC
SPD-11T/C TC TT TT
SPD-160G/A GA GG GG
Table 3.16. Genotypes of three individuals with meningococcal disease at the
eleven SNP loci within SP-A1, SP-A2, and SP-D. The major/minor alleles for
each SNP loci are provided e.g. SPA2-140C/T. The three possible genotypes
for each SNP are: Homozygous for the major allele; homozygous for the
minor allele; and heterozygous for both alleles.
3.7.1 Association of Single SNP Alleles with Meningococcal Disease
The allele and haplotype frequencies determined in the
meningococcal individuals were compared to those of the control
population using the Haploview software. Resulting associations

Chapter Three: Results 97
of single alleles with meningococcal disease are presented in
Table 3.17.
SNP Assoc Allele
Case, Control Frequencies Chi Square P value
SPA1-19 C 0.333, 0.222 0.421 0.5164
SPA1-50 G 0.667, 0.601 0.107 0.7434
SPA1-62 A 0.833, 0.739 0.271 0.6025
SPA1-133 G 0.500, 0.190 3.599 0.0578
SPA1-219 C 1.000, 0.884 0.783 0.3764
SPA2-9 A 0.667, 0.591 0.141 0.7073
SPA2-91 C 0.333, 0.182 0.889 0.3457
SPA2-140 C 1.000, 0.742 2.071 0.1501
SPA2-223 A 0.167, 0.162 0.001 0.9781
SPD-11 T 0.833, 0.684 0.608 0.4356
SPD-160 A 0.833, 0.422 4.069 0.0437
Table 3.17. Association of specific SP-A1, SP-A2, and SP-D alleles with
meningococcal disease. For each allele analyzed, their frequencies within the
meningococcal and control individuals are given. χ2 analysis was performed
and any significant results are highlighted in bold font (P < 0.05).
Out of the eleven alleles analyzed by Haploview, only one was
determined to differ significantly in frequency between the
meningococcal and control individuals. An adenine at codon 160
of SP-D was detected in 83.3% of the meningococcal individuals
but was present in only 42.2% of the control population (χ2 =
4.069, P = 0.0437). Such an over-representation may suggest
increased host susceptibility to meningococcal infection.

Chapter Three: Results 98
3.7.2 Association of Haplotypes with Meningococcal Disease
Following investigation of single allele associations, Haploview-
constructed haplotypes were also examined for association with
meningococcal disease. The results of this analysis with SP-A1
haplotypes are shown in Table 3.18.
Haplotype Total Freq
Case, Control Frequencies
Chi Square
P Value
TGAAC (6A2) 0.397 0.289, 0.399 0.297 0.5858
TCAAC (6A3) 0.161 0.044, 0.164 0.622 0.4304
CGAAC 0.081 0.167, 0.080 0.597 0.4397
TCGAT (6A4) 0.046 0.000, 0.047 0.297 0.5860
CCGGC (6A) 0.041 0.122, 0.039 1.034 0.3092
TCAGC (6A16) 0.037 0.167, 0.035 2.859 0.0909
TGAGC 0.033 0.166, 0.031 3.385 0.0658
CCAAC (6A11) 0.032 0.000, 0.033 0.203 0.6521
TGGAC (6A13) 0.028 0.000, 0.029 0.179 0.6726
TGGGC (6A6) 0.026 0.000, 0.027 0.165 0.6850
CCGAT (6A5) 0.021 0.000, 0.022 0.133 0.7157
TCGGT (6A9) 0.018 0.000, 0.018 0.112 0.7374
TCGAC (6A14) 0.015 0.000, 0.015 0.091 0.7635
CCGGT 0.014 0.000, 0.015 0.089 0.7654
CGGGC (6A19) 0.013 0.045, 0.013 0.465 0.4953
CGAGC 0.011 0.000, 0.012 0.07 0.7916
Table 3.18. SP-A1 haplotypes in association with meningococcal disease. For
each SP-A1 haplotype, the associated allele’s case/control population
frequencies, χ2 test result, and P value are presented.
No significant association between any of the SP-A1 haplotypes
and meningococcal disease was found (P > 0.05).

Chapter Three: Results 99
Table 3.19 presents the results from association testing the SP-
A2 haplotypes with meningococcal disease. Similar to the SP-A1
haplotypes, no association between SP-A2 haplotypes and
meningococcal disease was identified.
Haplotype Total Freq
Case, Control Frequencies
Chi Square P Value
AGCC (1A0) 0.498 0.500, 0.498 0 0.9939
CGCC (1A2) 0.109 0.167, 0.107 0.214 0.6440
CGTA (1A1) 0.089 0.000, 0.091 0.598 0.4392
CCTC (1A5) 0.077 0.000, 0.078 0.509 0.4758
CCCC (1A) 0.059 0.167, 0.057 1.26 0.2617
CGTC (1A6) 0.038 0.000, 0.038 0.239 0.6251
CGCA (1A8) 0.032 0.000, 0.032 0.201 0.6540
AGCA 0.022 0.000, 0.022 0.135 0.7136
ACCC (1A12) 0.021 0.000, 0.021 0.129 0.7196
AGTC (1A9) 0.019 0.000, 0.020 0.121 0.7276
ACTC (1A7) 0.017 0.000, 0.017 0.103 0.7483
Table 3.19. SP-A2 haplotypes in association with meningococcal disease. For
each SP-A2 haplotype, the associated allele’s case/control population
frequencies, χ2 test result, and P value are presented.
Finally, SP-D haplotypes were investigated for any significant
association with meningococcal disease (Table 3.20). Haplotype
TA in the Pacific Island sub-sample previously analyzed (section
3.5.3) was found to be under-represented compared to the
control population. However, in regards to meningococcal
disease it is indicated that this haplotype was over-represented
in comparison to the control population. Haplotype TA was
detected in 82.8% of meningococcal individuals and 40.6% of
control individuals, thus suggesting an association with increased
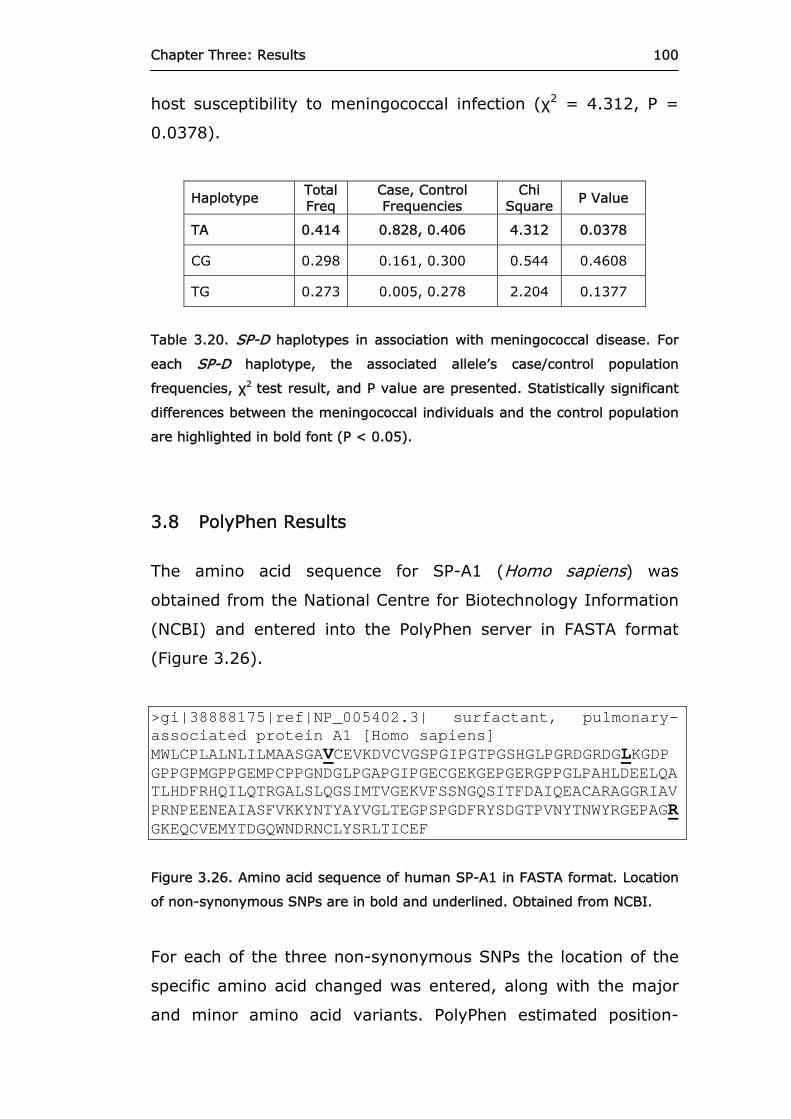
Chapter Three: Results 100
host susceptibility to meningococcal infection (χ2 = 4.312, P =
0.0378).
Haplotype Total Freq
Case, Control Frequencies
Chi Square
P Value
TA 0.414 0.828, 0.406 4.312 0.0378
CG 0.298 0.161, 0.300 0.544 0.4608
TG 0.273 0.005, 0.278 2.204 0.1377
Table 3.20. SP-D haplotypes in association with meningococcal disease. For
each SP-D haplotype, the associated allele’s case/control population
frequencies, χ2 test result, and P value are presented. Statistically significant
differences between the meningococcal individuals and the control population
are highlighted in bold font (P < 0.05).
3.8 PolyPhen Results
The amino acid sequence for SP-A1 (Homo sapiens) was
obtained from the National Centre for Biotechnology Information
(NCBI) and entered into the PolyPhen server in FASTA format
(Figure 3.26).
>gi|38888175|ref|NP_005402.3| surfactant, pulmonary-associated protein A1 [Homo sapiens] MWLCPLALNLILMAASGAVCEVKDVCVGSPGIPGTPGSHGLPGRDGRDGLKGDPGPPGPMGPPGEMPCPPGNDGLPGAPGIPGECGEKGEPGERGPPGLPAHLDEELQATLHDFRHQILQTRGALSLQGSIMTVGEKVFSSNGQSITFDAIQEACARAGGRIAVPRNPEENEAIASFVKKYNTYAYVGLTEGPSPGDFRYSDGTPVNYTNWYRGEPAGRGKEQCVEMYTDGQWNDRNCLYSRLTICEF
Figure 3.26. Amino acid sequence of human SP-A1 in FASTA format. Location
of non-synonymous SNPs are in bold and underlined. Obtained from NCBI.
For each of the three non-synonymous SNPs the location of the
specific amino acid changed was entered, along with the major
and minor amino acid variants. PolyPhen estimated position-

Chapter Three: Results 101
specific independent counts (PSIC) scores (measure of structural
and functional attributes) for both variants, calculated the
difference between them, and predicted whether a significant
change would occur. A prediction on the structural and functional
implications each non-synonymous SNP could potentially have on
the translated SP-A1 was then made, as documented in Table
3.21.
Amino Acid
AA1 AA2 PSIC
Score 1 PSIC
Score 2 (Score 1-Score 2)
Prediction
19
Val Ala -0.496 -0.487 0.009 Benign
50 Leu Val 0.136 1.153 1.017 Benign
219 Arg Trp 1.391 -0.879 2.270 Probably Damaging
Table 3.21. Polymorphism phenotyping results for SP-A1 as predicted by
PolyPhen.
PolyPhen predicted that the polymorphisms that would result at
non-synonymous changes at amino acids 19 and 50 would have
a benign effect. In other words, such changes would not have a
significant deleterious effect on the translated SP-A1’s structure
and function.
In contrast, it was predicted that a tryptophan substituted for an
arginine at amino acid position 219 would probably have a
damaging effect on SP-A1’s structural and functional attributes.
The FASTA amino acid sequence for SP-A2 (Homo sapiens) seen
in Figure 3.27 was also subjected to Polyphen analysis.
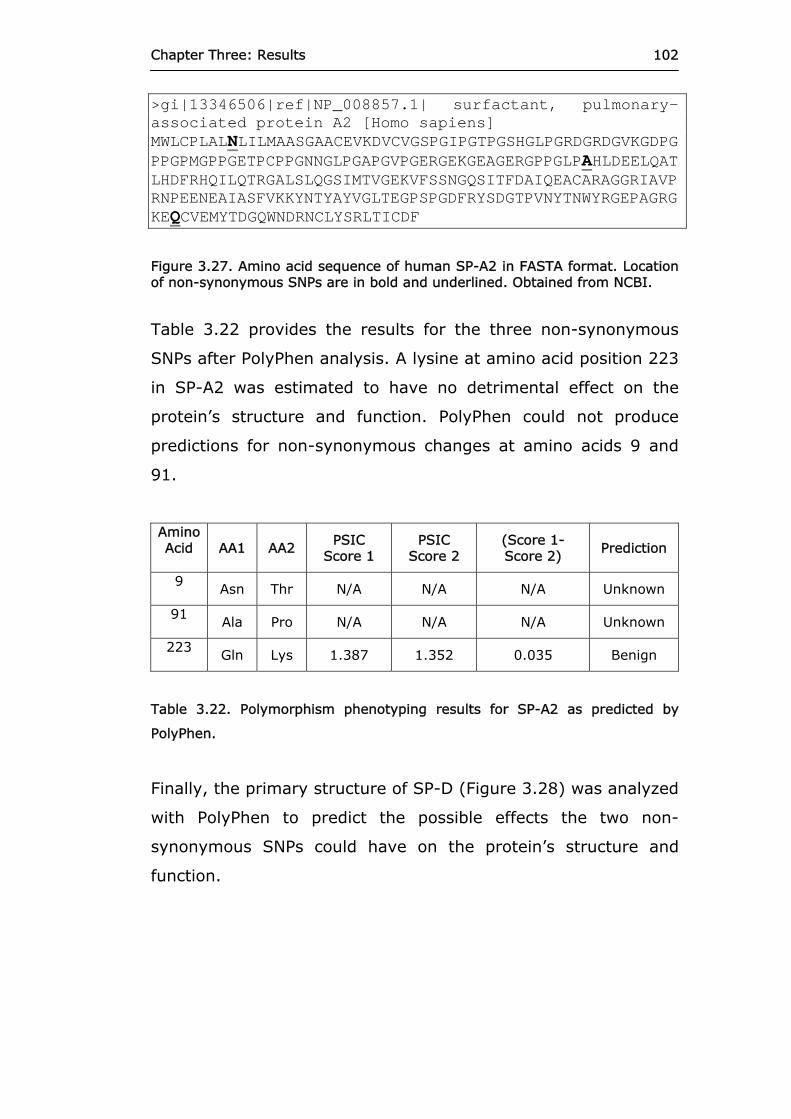
Chapter Three: Results 102
>gi|13346506|ref|NP_008857.1| surfactant, pulmonary-associated protein A2 [Homo sapiens] MWLCPLALNLILMAASGAACEVKDVCVGSPGIPGTPGSHGLPGRDGRDGVKGDPGPPGPMGPPGETPCPPGNNGLPGAPGVPGERGEKGEAGERGPPGLPAHLDEELQATLHDFRHQILQTRGALSLQGSIMTVGEKVFSSNGQSITFDAIQEACARAGGRIAVPRNPEENEAIASFVKKYNTYAYVGLTEGPSPGDFRYSDGTPVNYTNWYRGEPAGRGKEQCVEMYTDGQWNDRNCLYSRLTICDF
Figure 3.27. Amino acid sequence of human SP-A2 in FASTA format. Location of non-synonymous SNPs are in bold and underlined. Obtained from NCBI.
Table 3.22 provides the results for the three non-synonymous
SNPs after PolyPhen analysis. A lysine at amino acid position 223
in SP-A2 was estimated to have no detrimental effect on the
protein’s structure and function. PolyPhen could not produce
predictions for non-synonymous changes at amino acids 9 and
91.
Amino Acid
AA1 AA2 PSIC
Score 1 PSIC
Score 2 (Score 1-Score 2) Prediction
9 Asn Thr N/A N/A N/A Unknown
91
Ala Pro N/A N/A N/A Unknown
223 Gln Lys 1.387 1.352 0.035 Benign
Table 3.22. Polymorphism phenotyping results for SP-A2 as predicted by
PolyPhen.
Finally, the primary structure of SP-D (Figure 3.28) was analyzed
with PolyPhen to predict the possible effects the two non-
synonymous SNPs could have on the protein’s structure and
function.

Chapter Three: Results 103
>gi|61699226|ref|NP_003010.4| pulmonary surfactant- associated protein D precursor [Homo sapiens] LFLLSALVLLTQPLGYLEAEMKTYSHRTMPSACTLVMCSSVESGLPGRDGRDGREGPRGEKGDPGLPGAAGQAGMPGQAGPVGPKGDNGSVGEPGPKGDTGPSGPPGPPGVPGPAGREGPLGKQGNIGPQGKPGPKGEAGPKGEVGAPGMQGSAGARGLAGPKGERGVPGERGVPGNTGAAGSAGAMGPQGSPGARGPPGLKGDKGIPGDKGAKGESGLPDVASLRQQVEALQGQVQHLQAAFSQYKKVELFPNGQSVGEKIFKTAGFVKPFTEAQLLCTQAGGQLASPRSAAENAALQQLVVAKNEAAFLSMTDSKTEGKFTYPTGESLVYSNWAPGEPNDDGGSEDCVEIFTNGKWNDRACGEKRLVVCEF
Figure 3.28. Amino acid sequence of human SP-D in FASTA format. Location of non-synonymous SNPs are in bold and underlined. Obtained from NCBI.
The resulting predictions, recorded in Table 3.23, determined
that such changes in SP-D would have a benign effect on the
protein’s structure and function.
Amino Acid
AA1 AA2 PSIC Score
1 PSIC Score
2 (Score 1-Score 2)
Prediction
11
Thr Met 1.125 -0.225 1.350 Benign
160 Ala Thr 0.214 0.203 0.011 Benign
Table 3.23. Polymorphism phenotyping results for SP-D as predicted by
PolyPhen.

104
CHAPTER FOUR
DISCUSSION
4.1 Background
The prevalence of recurrent acute otitis media (RAOM) and otitis
media with effusion (OME) in the general population is assumed
to exhibit an underlying normal distribution (Kvestad et al.,
2003a). Some individuals are more susceptible to such infections
and are placed at the far right tail of the bell-shaped curve, while
others are more resistant and are placed at the far left tail of the
bell-shaped curve. Despite the extreme phenotypes at either
end, the majority of the population sits in the middle of the bell-
shaped curve near the population mean number of episodes of
AOM/OME per person per year. Though a variety of
environmental and socio-economic factors contribute to the
pathogenesis of otitis media (age, bacterial and viral exposure,
innate and adaptive immunity status, Eustachian tube structure
and function), substantial evidence indicates that susceptibility to
otitis media can also be inherited (Casselbrandt et al., 1999;
Kvestad et al., 2003b). Casselbrandt and co-workers conducted
a twin and triplet cohort study to determine the genetic
component of time with and episodes of middle ear effusion and
AOM during the first two years of life. They estimated of
heritability of time with middle ear effusion was 0.73 (P < 0.001)
during this time period.
Previous studies have implicated polymorphisms in the two
genes for the surfactant-related protein SP-A with susceptibility

Chapter Four: Discussion 105
or resistance to otitis media (Pettigrew et al., 2006; Rämet et
al., 2001). SP-A and it’s closely related collectin-family member
SP-D are host defense proteins which are expressed in the lungs,
middle ear, and a range of other mucosae (Bourbon and
Chailley-Heu, 2001; Dutton et al., 1999). They contribute to host
immunity by binding and aggregating Gram-negative and Gram-
positive bacteria or viruses, and enhancing their destruction by
phagocytes (Crouch et al., 1998, 2000, 2001; Crouch and
Wright, 2001; Ding et al., 2004; Shepherd, 2002). SP-A and SP-
D also interact with and/or stimulate members of the adaptive
immune system to further combat pathogen infection e.g.
RAOM/OME in the middle ear (Bohlson et al., 2007; Murakami et
al., 2002; Nadesalingam et al., 2005; Ohya et al., 2006).
Biallelic single nucleotide polymorphisms in SP-A1, SP-A2, and
SP-D have been identified which result in either synonymous or
non-synonymous amino acid substitutions in the translated
protein. Additionally, all three genes are in linkage disequilibrium
and thus haplotypes can be constructed from the alleles found at
each of the SNP loci (Floros et al., 1996; Hoover and Floros,
1998). As recombination occurs less often than expected in
regions in linkage disequilibrium, haplotypes can be inherited as
units. Certain SP-A1 and SP-A2 alleles and haplotypes have been
correlated with increased or decreased host susceptibility to otitis
media (Pettigrew et al., 2006; Rämet et al., 2001). No previous
research has linked SP-D alleles or haplotypes with otitis media.
In a Finnish population, Rämet and colleagues (2001) analyzed
DNA from forty-seven children diagnosed with acute otitis media
(AOM) and 147 children with RAOM for SP-A haplotypes. Using a
previously described PCR-restriction fragment length
polymorphism-based method they compared the SP-A1 and SP-

Chapter Four: Discussion 106
A2 haplotype frequencies from the case groups with 228
individuals from the general population. The haplotypes found
were composites of alleles from single nucleotide polymorphisms
at codons 19, 50, 62, 133, and 219 of SP-A1 and at codons 9,
91, 140, and 223 of SP-A2. SP-A1 haplotypes are denoted with
6Am and SP-A2 haplotypes with 1An. As SP-A1, SP-A2, and SP-D
are in linkage disequilibrium, such haplotypes can be combined
e.g. 6Am-1An.
Rämet et al. identified statistically significant differences in
haplotype frequencies between the case and control populations
with χ2 analysis. The haplotype 6A4-1A5 (TCGAT-CCTC) was
found to be over-represented in both the AOM (P = 0.02) and
RAOM (P = 0.003) groups. Additionally, the AOM group exhibited
an under-representation of the 6A2-1A0 (TGAAC-AGCC)
haplotype (P = 0.03).
In an American study, 355 infants at risk for developing asthma
were genotyped to evaluate the association between the same
SP-A1 and SP-A2 loci as described above, and risk of otitis media
during the first year of life (Pettigrew et al., 2006). They
demonstrated that the major allele, an alanine at codon 19 of
SP-A1 corresponded with a significantly greater chance of otitis
media within the first year of life (χ2, P = 0.01). They further
determined that Caucasian infants with an alanine at SP-A1
codon 19 were >3.8 times more likely to have otitis media in the
first year of life, in comparison to those with a valine at that
position. Alleles at codons 19, 62, and 133 in SP-A1, and 223 in
SP-A2 were found to be differentially distributed across
Caucasian, Hispanic, and African-American infants.

Chapter Four: Discussion 107
In decreasing order of frequency, the most common SP-A1
haplotypes found by Pettigrew et al. in the Caucasian infants
were 6A2, 6A3, 6A4, and 6A. Again in decreasing order,
haplotypes 1A0, 1A1, 1A2, 1A, 1A5, 1A6, and 1A3 were the most
frequent SP-A2 haplotypes detected. In complete contrast to the
findings of Rämet et al. Caucasian infants with haplotype 6A4-1A5
were associated with a 76% decreased risk of otitis media during
their first year of life (OR = 0.23, 95% CI = 0.07 – 0.73).
In this study, eleven single nucleotide polymorphisms in the
coding regions of SP-A1, SP-A2, and SP-D were genotyped in
160 unaffected individuals (control population) and in 136
individuals diagnosed with recurrent acute otitis media (RAOM)
or otitis media with effusion (OME), in order to identify any
associated alleles/haplotypes. The SNP loci investigated were
situated at codons 19, 50, 62, 133, and 219 of SP-A1, and
codons 9, 91, 140, and 223 of SP-A2. Lastly, SNPs at SP-D
codons 11 and 160 were examined. Out of the eleven loci
investigated, single nucleotide changes at all but three resulted
in non-synonymous amino acid changes. Substitutions at SPA1-
62, SPA1-133, and SPA2-140 resulted in synonymous amino acid
changes. It was hypothesized that specific alleles and haplotypes
of SP-A1, SP-A2 and SP-D would be more or less frequent in the
RAOM/OME individuals, confirming the findings of previous
studies (Pettigrew et al., 2006; Rämet et al., 2001).
The most common SP-A1 haplotypes found in descending order
in this study’s European-Caucasian RAOM/OME population were
6A2 (TGAAC), 6A3 (TCAAC), CGAAC, 6A4 (TCGAT), and TGAGC.
Appropriate nomenclature for haplotypes CGAAC and TGAGC was
unknown. Most frequent SP-A2 haplotypes in this population
were 1A0 (AGCC), 1A5 (CCTC), 1A1 (CGTA), 1A (CCCC), and 1A9

Chapter Four: Discussion 108
(AGTC) in descending order of frequency. In the control
population the most common SP-A1 haplotypes, in decreasing
order, were 6A2 (TGAAC), 6A3 (TCAAC), CGAAC, 6A4 (TCGAT),
and 6A (CCGGC). The most common SP-A2 haplotypes in the
same population were 1A0 (AGCC), 1A2 (CGCC), 1A1 (CGTA), 1A5
(CCTC), and 1A (CCCC). In both the case and control
populations, SP-D haplotypes TA, CG, and TG were most
frequently seen while haplotype CA was present in less than 2%
of each population.
Specific SP-A1, SP-A2, and SP-D alleles and haplotypes found to
be associated with host susceptibility or resistance to RAOM/OME
are presented in the following sections.
4.2 SP-A1, SP-A2, and SP-D Alleles and Haplotypes associated with increased host susceptibility to RAOM/OME
4.2.1 SP-A1, SP-A2, and SP-D Alleles
Three specific alleles were found to be over-represented in the
European-Caucasian population of individuals diagnosed with
RAOM/OME: SPA1-19C, SPA1-133G, and SPA2-223A.
In SP-A1, an alanine (major allele) at codon 19 was associated
with increased risk of RAOM/OME (P = 0.0045). Codon 19 is
located in the N-terminal of SP-A1, the region responsible for
interacting with other SP-A1 and SP-A2 molecules to form
trimeric subunits and higher order multimers. An amino acid
substitution at codon 19 from an alanine (major allele) to a
valine (minor allele) may affect how successfully SP-A1 forms
trimeric subunits and octadecamers; however, no evidence has

Chapter Four: Discussion 109
been published to support this hypothesis. Leth-Larsen and
colleagues (2005) separated purified human SP-D by gel
filtration chromatograghy and identified the components using
atomic force microscopy. They found that multimers,
dodecamers, and monomers of subunits displayed a higher level
of binding to intact influenza A virus, Gram-positive bacteria, and
Gram-negative bacteria than did SP-D monomers. However,
monomers of SP-D preferentially bound isolated LPS. The
researchers postulated that differences in the proportions of
trimeric subunits and higher order multimers of SP-D in
individuals were associated with differential activation of anti-
and pro-inflammatory signalling pathways and consequently
affected the efficiency of inflammatory response and subsequent
clearance of microbes. However, they conducted no further
research to test this hypothesis.
Such SP-D findings could also potentially apply to SP-A1 in the
context of the middle ear. For example, the non-synonymous
amino acid change in the N-terminal of SP-A1 may have a
deleterious effect on the protein’s ability to form trimers and
multimers, which could subsequently reduce their ability to clear
the bacteria/viruses involved in RAOM/OME pathogenesis.
Unfortunately, these ideas are purely speculative as no research
has investigated the effects of an alanine at SP-A1 codon 19 on
the protein’s structural and functional characteristics. Polyphen
analysis (http://www.bork.embl-heidelberg.de/PolyPhen)
employed in this study predicted that such a change would have
a benign effect on SP-A1’s structure and function. Using 3D
protein structures, multiple alignments of homologous
sequences, and amino acid contact information from a variety of
protein structure databases, the differences between the two

Chapter Four: Discussion 110
protein variants were investigated by PolyPhen and deemed non-
significant (Ramensky et al., 2002).
The major allele of SPA1-133, situated in the collagenous region
of SP-A1, was also determined to be associated with increased
risk of RAOM/OME (P = 3.00 x10⁻⁴). However, this result was
unexpected considering that a synonymous amino acid
substitution occurs and has no functional effect on the gene
product; the nucleotides guanine and adenine at this locus both
encode a threonine. The substitution was predicted by PolyPhen
to not have a significant effect on SP-A1’s structure and function.
Perhaps the presence of the nucleotide guanine (major allele)
rather than an adenine (minor allele) at the SNP locus allows for
additional CpG methylation, a trait of heterochromatin and
repressed gene expression. A reduction in gene expression would
therefore result in reduced SP-A1 in the middle ear and
Eustachian tube which may subsequently lead to increased host
susceptibility to infection by the common respiratory bacteria
and viruses known to cause RAOM/OME. Research investigating
the levels of CpG methylation in the SP-A1 region and
subsequent gene expression is currently nonexistent, therefore
further investigation is needed to assess whether changes to
SPA1-133 have any influence on SP-A1 expression.
Finally, the presence of a lysine (minor allele) at amino acid
position 223 of SP-A2 was found in significantly more RAOM/OME
individuals compared to the control population (P = 0.0038).
This over-representation in the case population indicated an
association with an increased risk for RAOM/OME. Similar results
were seen in the research conducted by Lofgren and co-workers
(2002) that compared the frequencies of SP-A1 and SP-A2 alleles
in a population of children with severe respiratory syncytial virus

Chapter Four: Discussion 111
(RSV) bronchiolitis and a control population. Among patients with
severe RSV infection, a lysine at codon 223 of SP-A2 was also
significantly over-represented (0.28 vs. 0.18; OR = 1.78; 95%
CI = 1.1 - 2.9; P = 0.023).
Lofgren et al. (2002) postulated that because amino acid 223 is
in the carbohydrate recognition domain (CRD) of SP-A2, perhaps
the substitution of the neutral amino acid glutamine (with an
amidic side chain), for a cationic lysine (with a basic side chain),
may alter the protein’s affinity for microbial carbohydrate
moieties. This explanation could also apply to the association of
a lysine at SP-A2 codon 223 with increased risk of RAOM/OME. It
is possible that having a lysine at this particular position in the
CRD may reduce the protein’s ability to bind to or interact with
the cell wall components (e.g. LPS, LTA, and PepG) of gram-
negative and gram-positive bacteria known to contribute to
RAOM/OME pathogenesis, and facilitate their clearance from the
middle ear and Eustachian tube. On the other hand, changes to
the CRD may affect how SP-A can interact with
polymorphonuclear neutrophils, macrophages, monocytes, and
immunoglobulins. Despite these possible explanations, no
conclusive evidence is available that implicates a lysine at SP-A2
codon 223 with reduced pathogen binding and/or immune-
signalling. Again, PolyPhen predicted no significant structural or
functional effect on SP-A2.
4.2.2 SP-A1, SP-A2, and SP-D Haplotypes
The previously uncategorized SP-A1 haplotype CGAGC was over-
represented in the RAOM/OME case population (P = 0.0085).
This haplotype contains an alanine (major allele) at SP-A1 codon

Chapter Four: Discussion 112
19, and a guanine (major allele) at codon 133, both of which
were earlier shown to be associated with increased risk for
RAOM/OME. It is possible that the presence of these two alleles
and their hypothetical effect on SP-A1’s pathogen binding and
clearance capabilities leads to increased host susceptibility to
RAOM/OME; however, no experimental work is available to
confirm this theory.
SP-A2 haplotypes 1A3 (AGTA), 1A9 (AGTC), and 1A10 (CCTA)
were all over-represented in the RAOM/OME population in
comparison with the control population (1A3, P = 0.0182; 1A9, P
= 0.044; 1A10, P = 0.0391).
Haplotype 1A3 contains an asparagine (major allele), alanine
(minor allele), serine (minor allele), and lysine (minor allele) at
codons 9, 91, 140, and 223 of SP-A2. Interestingly, Lofgren and
associates (2002) observed that haplotype 1A3 was significantly
over-represented amongst infants with severe RSV infection in
comparison with a control group (0.05 vs. 0.005; OR = 10.44;
95% CI = 1.3 – 83.2; P = 0.006). This haplotype was also
implicated as being associated with increased susceptibility to
infection with the intracellular pathogen Mycobacterium
tuberculosis, by Floros and colleagues (2000). However, the
functional and structural influences of haplotype 1A3 on SP-A2
are currently unknown.
The rare haplotype 1A9 encodes an asparagine (major allele) at
codon 9, alanine (minor allele) at codon 91, serine (minor allele)
at codon 140, and a glutamine (major allele) at codon 223. The
reason why this particular haplotype is associated with an
increased risk of RAOM/OME is unclear since no association with
the individual alleles was previously seen. Despite the fact that
none of the individual alleles were associated with RAOM/OME,
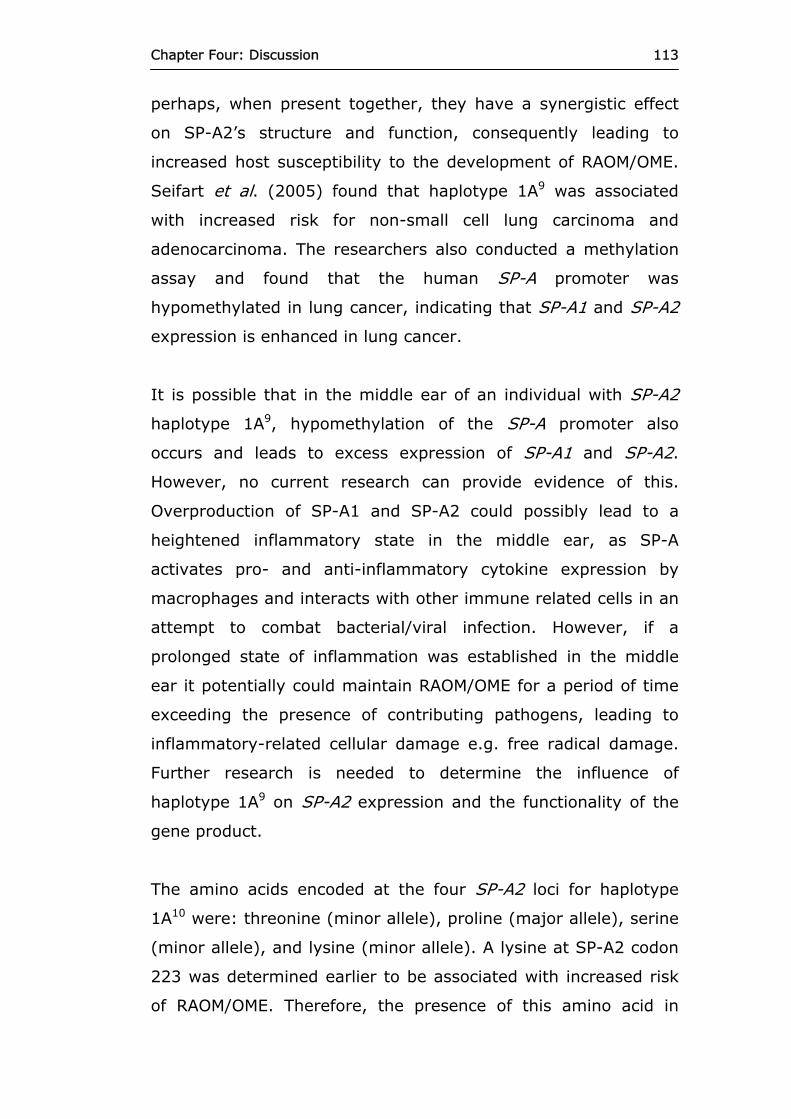
Chapter Four: Discussion 113
perhaps, when present together, they have a synergistic effect
on SP-A2’s structure and function, consequently leading to
increased host susceptibility to the development of RAOM/OME.
Seifart et al. (2005) found that haplotype 1A9 was associated
with increased risk for non-small cell lung carcinoma and
adenocarcinoma. The researchers also conducted a methylation
assay and found that the human SP-A promoter was
hypomethylated in lung cancer, indicating that SP-A1 and SP-A2
expression is enhanced in lung cancer.
It is possible that in the middle ear of an individual with SP-A2
haplotype 1A9, hypomethylation of the SP-A promoter also
occurs and leads to excess expression of SP-A1 and SP-A2.
However, no current research can provide evidence of this.
Overproduction of SP-A1 and SP-A2 could possibly lead to a
heightened inflammatory state in the middle ear, as SP-A
activates pro- and anti-inflammatory cytokine expression by
macrophages and interacts with other immune related cells in an
attempt to combat bacterial/viral infection. However, if a
prolonged state of inflammation was established in the middle
ear it potentially could maintain RAOM/OME for a period of time
exceeding the presence of contributing pathogens, leading to
inflammatory-related cellular damage e.g. free radical damage.
Further research is needed to determine the influence of
haplotype 1A9 on SP-A2 expression and the functionality of the
gene product.
The amino acids encoded at the four SP-A2 loci for haplotype
1A10 were: threonine (minor allele), proline (major allele), serine
(minor allele), and lysine (minor allele). A lysine at SP-A2 codon
223 was determined earlier to be associated with increased risk
of RAOM/OME. Therefore, the presence of this amino acid in

Chapter Four: Discussion 114
haplotype 1A10 may be responsible for the association between
the haplotype and RAOM/OME. On the other hand, a proline
often facilitates the conformation of random coils and β-turns in
a polypeptide chain. The carbon ring in proline’s R group is
bound to the amino group in the polypeptide backbone and
therefore cannot participate in hydrogen bonding, which is vital
for formation of some secondary structures.
Perhaps in SP-A2 the presence of a proline at codon 91 prevents
maintenance of a different secondary structure, which might
have a detrimental effect on the protein’s ability to bind and
clear pathogens or interact with other immune-related
cells/molecules. However, PolyPhen analysis undertaken for this
study did not predict any significant detrimental affect of a
proline at SP-A2 codon 91. Further protein structure
experimentation needs to be conducted to demonstrate what
functional changes occur as a result of SP-A2 haplotype 1A10.
Finally, in addition to the four SP-A2 haplotypes found to be
associated with increased risk of RAOM/OME, the power of the
significance of haplotype 1A0 (AGCC, P = 0.0524) was on the
threshold borderline of 0.05. If deemed to be significant,
haplotype 1A0 would have been under-represented in the
RAOM/OME population. However, in the RAOM/OME case
population, SP-A1 haplotype 6A2 was detected in combination
with SP-A2 haplotype 1A0 in over 10% of the population. Since
haplotype 6A2 was determined to be protective against
RAOM/OME, it is possible that haplotype 1A0 would also have a
protective effect. Rämet and colleagues (2000, 2001) found that
the 6A2/1A0 haplotypes were under-represented in infants with
their first episode of AOM before six months of age (χ2, P =
0.03) but over-represented in infants with respiratory distress
syndrome (OR = 1.66; 95% CI = 1.09 – 2.54; P = 0.018). It is
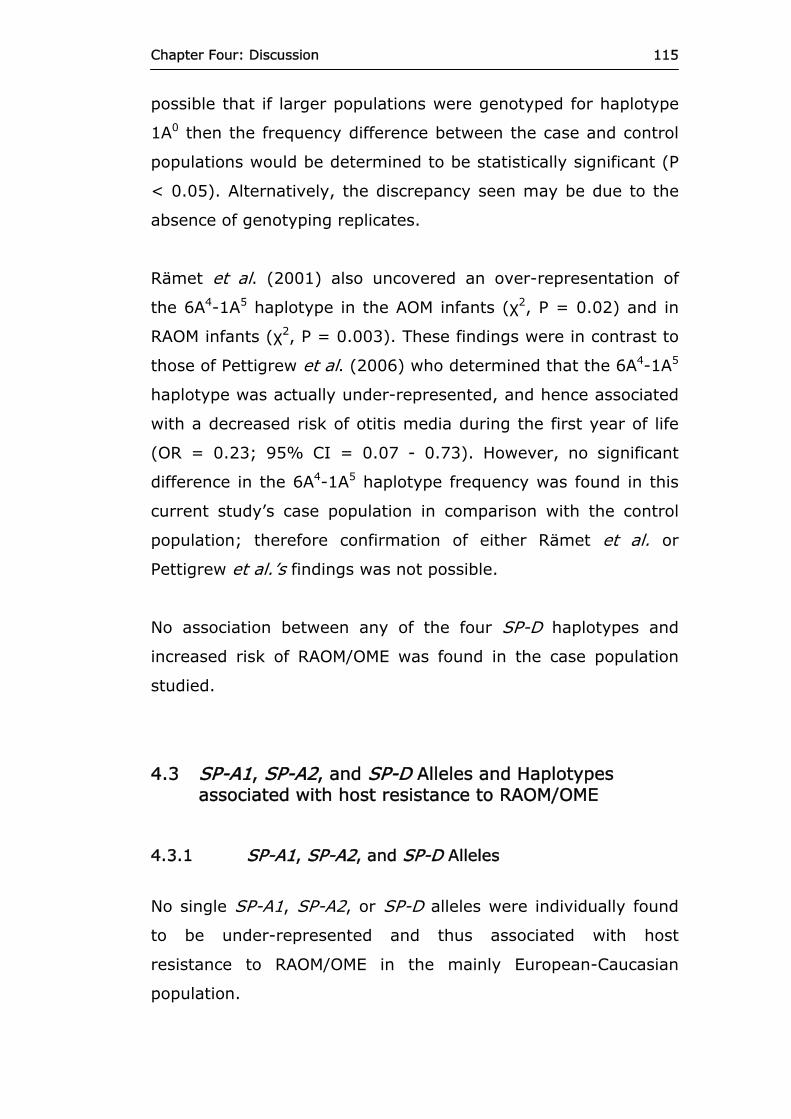
Chapter Four: Discussion 115
possible that if larger populations were genotyped for haplotype
1A0 then the frequency difference between the case and control
populations would be determined to be statistically significant (P
< 0.05). Alternatively, the discrepancy seen may be due to the
absence of genotyping replicates.
Rämet et al. (2001) also uncovered an over-representation of
the 6A4-1A5 haplotype in the AOM infants (χ2, P = 0.02) and in
RAOM infants (χ2, P = 0.003). These findings were in contrast to
those of Pettigrew et al. (2006) who determined that the 6A4-1A5
haplotype was actually under-represented, and hence associated
with a decreased risk of otitis media during the first year of life
(OR = 0.23; 95% CI = 0.07 - 0.73). However, no significant
difference in the 6A4-1A5 haplotype frequency was found in this
current study’s case population in comparison with the control
population; therefore confirmation of either Rämet et al. or
Pettigrew et al.’s findings was not possible.
No association between any of the four SP-D haplotypes and
increased risk of RAOM/OME was found in the case population
studied.
4.3 SP-A1, SP-A2, and SP-D Alleles and Haplotypes associated with host resistance to RAOM/OME
4.3.1 SP-A1, SP-A2, and SP-D Alleles
No single SP-A1, SP-A2, or SP-D alleles were individually found
to be under-represented and thus associated with host
resistance to RAOM/OME in the mainly European-Caucasian
population.

Chapter Four: Discussion 116
4.3.2 SP-A1, SP-A2, and SP-D Haplotypes
The SP-A1 haplotype 6A2 (TGAAC) was under-represented in the
population consisting of patients with RAOM/OME in comparison
to the control population (P = 3.00 x10⁻⁴), thus suggesting a
protective effect against RAOM/OME. Haplotype 6A2 encodes a
valine (minor allele), valine (minor allele), proline (minor allele),
threonine (minor allele) and an arginine (major allele) at codons
19, 50, 62, 133, and 219 of SP-A1. Identical results were
obtained by Rämet et al. (2001) who found that infants with
their first episode of AOM diagnosed before six months of age
showed an under-representation of the 6A2 haplotype alone (χ2,
P < 0.05), and in conjunction with the SP-A2 haplotype 1A0 (χ2,
P = 0.03). On the other hand, Lofgren et al. (2002) found that
the haplotype 6A2 was associated with increased risk of severe
RSV infection when linked with the SP-A2 haplotype 1A3 (5.2 vs.
0.5, OR = 10.4; 95% CI = 1.3 - 83.2; P = 0.006), but not when
analyzed alone.
The apparent protective effect of haplotype 6A2 may potentially
originate from the absence of an alanine at amino acid position
19 of SP-A1. This allele was previously found to be associated
with an increased risk of RAOM/OME, possibly due to changes in
the ability of SP-A1’s N-terminal to form trimeric subunits and
multimers with other SP-A1 and SP-A2 molecules. The presence
of a valine instead of an alanine at this SNP locus may allow for
effective binding of the N-terminal of SP-A1 to other SP-A1 and
SP-A2 N-terminals in order to form the subunits and multimers
necessary for efficient binding and clearance of bacteria/viruses
in the middle ear and Eustachian tube. More efficient destruction
and clearance of such pathogens would therefore decrease the
host’s susceptibility for developing RAOM/OME. In addition, the
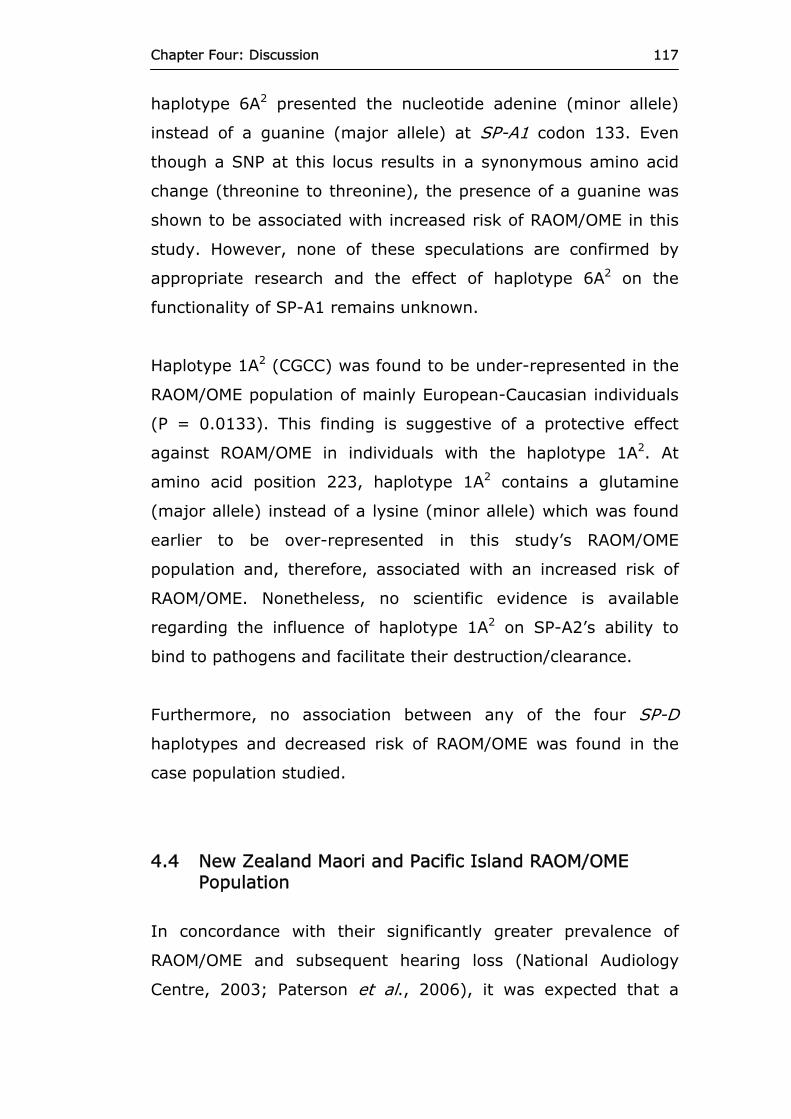
Chapter Four: Discussion 117
haplotype 6A2 presented the nucleotide adenine (minor allele)
instead of a guanine (major allele) at SP-A1 codon 133. Even
though a SNP at this locus results in a synonymous amino acid
change (threonine to threonine), the presence of a guanine was
shown to be associated with increased risk of RAOM/OME in this
study. However, none of these speculations are confirmed by
appropriate research and the effect of haplotype 6A2 on the
functionality of SP-A1 remains unknown.
Haplotype 1A2 (CGCC) was found to be under-represented in the
RAOM/OME population of mainly European-Caucasian individuals
(P = 0.0133). This finding is suggestive of a protective effect
against ROAM/OME in individuals with the haplotype 1A2. At
amino acid position 223, haplotype 1A2 contains a glutamine
(major allele) instead of a lysine (minor allele) which was found
earlier to be over-represented in this study’s RAOM/OME
population and, therefore, associated with an increased risk of
RAOM/OME. Nonetheless, no scientific evidence is available
regarding the influence of haplotype 1A2 on SP-A2’s ability to
bind to pathogens and facilitate their destruction/clearance.
Furthermore, no association between any of the four SP-D
haplotypes and decreased risk of RAOM/OME was found in the
case population studied.
4.4 New Zealand Maori and Pacific Island RAOM/OME Population
In concordance with their significantly greater prevalence of
RAOM/OME and subsequent hearing loss (National Audiology
Centre, 2003; Paterson et al., 2006), it was expected that a
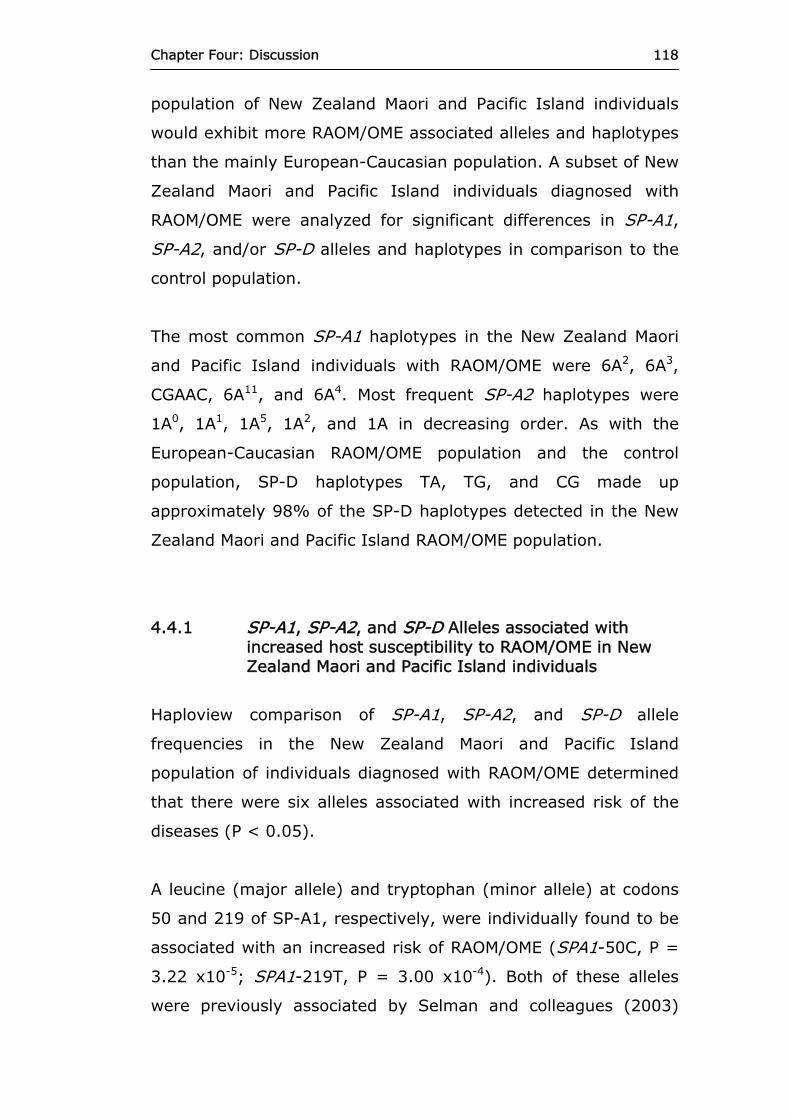
Chapter Four: Discussion 118
population of New Zealand Maori and Pacific Island individuals
would exhibit more RAOM/OME associated alleles and haplotypes
than the mainly European-Caucasian population. A subset of New
Zealand Maori and Pacific Island individuals diagnosed with
RAOM/OME were analyzed for significant differences in SP-A1,
SP-A2, and/or SP-D alleles and haplotypes in comparison to the
control population.
The most common SP-A1 haplotypes in the New Zealand Maori
and Pacific Island individuals with RAOM/OME were 6A2, 6A3,
CGAAC, 6A11, and 6A4. Most frequent SP-A2 haplotypes were
1A0, 1A1, 1A5, 1A2, and 1A in decreasing order. As with the
European-Caucasian RAOM/OME population and the control
population, SP-D haplotypes TA, TG, and CG made up
approximately 98% of the SP-D haplotypes detected in the New
Zealand Maori and Pacific Island RAOM/OME population.
4.4.1 SP-A1, SP-A2, and SP-D Alleles associated with increased host susceptibility to RAOM/OME in New Zealand Maori and Pacific Island individuals
Haploview comparison of SP-A1, SP-A2, and SP-D allele
frequencies in the New Zealand Maori and Pacific Island
population of individuals diagnosed with RAOM/OME determined
that there were six alleles associated with increased risk of the
diseases (P < 0.05).
A leucine (major allele) and tryptophan (minor allele) at codons
50 and 219 of SP-A1, respectively, were individually found to be
associated with an increased risk of RAOM/OME (SPA1-50C, P =
3.22 x10⁻⁵; SPA1-219T, P = 3.00 x10⁻⁴). Both of these alleles
were previously associated by Selman and colleagues (2003)

Chapter Four: Discussion 119
with increased predisposition to idiopathic pulmonary fibrosis, a
progressive lung disorder, characterized by sequential acute lung
epithelial injuries and fibrosis (SPA1-50C: 94.4 vs 74.8, OR =
6.68, 95% CI = 1.87 – 23.86, P = <0.01; SPA1-219T: 7.8 vs.
22.2, OR = 3.13, 95% CI = 1.18 – 8.32, P = 0.02).
The presence of a tryptophan at SP-A1 codon 219 was predicted
by PolyPhen to be ‘damaging’ to SP-A1’s structure and function.
No other allele in SP-A1, SP-A2, or SP-D was predicted to have a
deleterious effect on the corresponding protein’s structural and
functional attributes. Selman et al. (2003) demonstrated that
SP-A1 with a tryptophan at codon 219 was more susceptible to
oxidation than its arginine-containing counterparts, and self-
aggregated to a higher level as a consequence. In the context of
RAOM/OME, it is possible that the increased levels of reactive
oxygen species (i.e. nitric oxide) produced by phagocytes in
response to pathogen infection may lead to increased oxidation
of SP-A and SP-D in the middle ear, ultimately resulting in a
reduction in their ability to bind to and clear bacteria and/or
viruses. Furthermore, particular amino acid substitutions may
render the proteins either more or less susceptible to free radical
damage. On the other hand, despite these hypothetical
explanations, no substantiating experimental evidence is
available that addresses the functional effect of the presence of a
tryptophan at SP-A1 codon 219.
The presence of a proline (major allele), serine (minor allele),
and lysine (minor allele) at SP-A2 codons 91, 140, and 223,
respectively, were also individually associated with an increased
risk of RAOM/OME (SPA2-91C, P = 0.0018; SPA2-140T, P = 3.00
x10-4; SPA2-223A, P = 0.0042). Currently, there have been no

Chapter Four: Discussion 120
other association studies that have identified a proline and a
serine at SP-A2 codons 91 and 140 as disease markers.
As previously discussed, a proline at SP-A2 codon 91 may
prevent formation of some secondary structures essential for SP-
A2 to form oligomers, bind to pathogens, and interact with other
immune-related cells/molecules. However, no research has been
conducted to assess the structural and functional consequences
of this substitution.
The SNP at SP-A2 codon 140 results in a synonymous amino acid
change which does not affect the gene product, therefore it was
not predicted that this locus would be associated with
RAOM/OME. Having a thymidine (minor allele) at this SNP locus
instead of a cytosine (major allele), may result in reduced CpG
methylation and ensuing enhanced gene expression. If this was
the case, it would be expected that increased transcription and
translation of SP-A2 would, in fact, improve host susceptibility to
RAOM/OME as enhanced bacterial/viral clearance would be
possible. However, it is possible that over-production of SP-A2
occurs as a result of hypomethylation, leading to prolonged
inflammation and related damage in the middle ear and
Eustachian tube. Further work in this area is needed to assess
the consequences (if any), a thymidine at SP-A2 codon 140 will
cause the protein.
Pettigrew et al. (2006) could not obtain reproducible results for
the C/T polymorphism at SPA2-140, using the allele-specific
primers previously published (Pantelidis et al., 2003). The
identical allele-specific primers for SPA2-140 were employed in
the present study but no such difficulty was encountered.
Perhaps the additional genotyping success achieved was due to

Chapter Four: Discussion 121
the touchdown thermocycling protocol utilized. There was no
evidence given to suggest that Pettigrew et al. (2006)
investigated the appropriate annealing temperature needed for
the SPA2-140 primers, however in the present study, the optimal
annealing temperatures for the real-time PCR were determined
by gradient PCR in order to increase specificity for amplification
and subsequently reduce mispriming.
Lastly, in the New Zealand Maori and Pacific Island population,
an increased risk of RAOM/OME was associated with the
presence of an alanine (minor allele) at amino acid position 160
of SP-D (P = 0.0292). Amino acid position 160 is located within
the collagenous domain of SP-D, a region essential for binding to
collectin receptors and for complement activation via the lectin
pathway (Eda et al., 1996; Erdei and Reid, 1989; Ikeda et al.,
1987). Perhaps the presence of an alanine at this position in the
collagenous domain results in impaired binding to collectin
receptors, reduced complement activation, and decreased
clearance of pathogens causing RAOM/OME. Changes in the
collagenous domain of mannose binding lectin have been shown
to contribute to immunodeficiencies in affected individuals
(Summerfield et al., 1995), but similar research has not been
conducted with SP-D.
4.4.2 SP-A1, SP-A2, and SP-D Alleles associated with increased host susceptibility to RAOM/OME in New Zealand Maori and Pacific Island individuals
Haplotypes 6A8 (TCAAT) and 6A10 (CCGAC) were found to be
associated with increased risk of RAOM/OME (6A8, P = 2.00 x10-
4; 6A10, P = 0.0412). Haplotype 6A8 encodes a valine (minor

Chapter Four: Discussion 122
allele), leucine (major allele), proline (minor allele), threonine
(minor allele) and a tryptophan (minor allele) at SP-A1 codons
19, 50, 62, 133, and 219. Haplotype 6A10 encodes an alanine
(major allele), leucine (major allele), proline (major allele),
threonine (minor allele), and an arginine at the five SP-A1
codons. Both haplotypes 6A8 and 6A10 encode a leucine at SP-A1
codon 50, which was already determined to be associated with
increased risk of RAOM/OME in the New Zealand Maori and
Pacific Island population. In addition, haplotype 6A8 also encodes
a tryptophan at SP-A1 codon 219, another allele linked with
increased RAOM/OME susceptibility in this study’s New Zealand
Maori and Pacific Island population.
In the European-Caucasian RAOM/OME population, haplotypes
1A3 (AGTA) and 1A10 (CCTA) were linked to increased risk of
RAOM/OME. Haplotype 1A3 contains an asparagine (major
allele), alanine (minor allele), serine (minor allele), and a lysine
(minor allele) at SP-A2 codons 9, 91, 140, and 223. Haplotype
1A10 encodes a threonine (minor allele), proline (major allele),
serine (minor allele), and a lysine (minor allele), at the four SP-
A2 loci. Haplotypes 1A3 and 1A10 were also found to have the
same associations in the New Zealand Maori and Pacific Island
population, indicating that they also are protective against
RAOM/OME regardless of an individual’s ethnicity (1A3, P =
0.0029; 1A10, P = 7.00 x10⁻⁴). Haplotype 1A3 encodes a serine
and a lysine at codons 140 and 223, two alleles which were
individually shown to be associated with increased risk of
RAOM/OME in the New Zealand Maori and Pacific Island
individuals. Haplotype 1A10 also contains a serine and lysine at
codons 140 and 223, as well as a proline at codon 91. A proline
at this amino acid position was also found earlier to be
Chapter Four: Discussion 123
associated with increased susceptibility to RAOM/OME in New
Zealand Maori and Pacific Island individuals.
4.4.3 SP-A1, SP-A2, and SP-D Alleles associated with increased host resistance to RAOM/OME in New Zealand Maori and Pacific Island individuals
No individual SP-A1, SP-A2, or SP-D alleles were found to be
associated with host resistance to RAOM/OME.
4.4.4 SP-A1, SP-A2, and SP-D Haplotypes associated with
increased host resistance to RAOM/OME in New Zealand Maori and Pacific Island individuals
Haplotype 6A2 was identified as a protective haplotype against
RAOM/OME (P = 8.00 x10⁻⁵), similar to the European-Caucasian
case population, the findings of Rämet et al. (2001), and
Pettigrew et al. (2006). SP-A2 haplotypes 1A0 and 1A2 were both
found to be protective against susceptibility to RAOM/OME in
New Zealand Maori and Pacific Island individuals (1A0, P =
0.0038; 1A2, P = 0.0377). Similar results were found in the
European-Caucasian case population, except the population
frequency difference of haplotype 1A0 in the total case population
compared to the control population exhibited borderline
significance. Without further experimentation in order to
replicate the results, it cannot be determined whether 1A0 is, in
fact, a protective haplotype in European-Caucasian individuals as
well as in New Zealand Maori and Pacific Island individuals. In
light of previous research, which documented that haplotype 1A0
was protective in other Caucasian populations (Pettigrew et al.,
2006; Rämet et al., 2001), it is likely that the same applies for
the total case population in the present study. Additional studies

Chapter Four: Discussion 124
with larger population sizes need to be undertaken in order to
confirm or challenge these results.
SP-D haplotype TA was observed to be protective against host
susceptibility to RAOM/OME in the New Zealand Maori and Pacific
Island individuals (P = 0.0192). It is possible that the association
of this haplotype is due to the presence of an alanine at SP-D
codon 160, which was previously shown to be over-represented
in the New Zealand Maori and Pacific Island population in
comparison to the control population.
The population containing New Zealand Maori and Pacific Island
individuals diagnosed with RAOM/OME exhibited an under-
representation of the SPA1/SPA2/SPD haplotype 6A2-1A0-TA.
These three haplotypes were found to be protective against
susceptibility to RAOM/OME individually and were concurrent
with each other in over 10% of the individuals. The finding that a
New Zealand Maori and Pacific Island population displays a
significant reduction in the RAOM/OME protecting haplotype 6A2-
1A0-TA suggests that such individuals are genetically more
susceptible to RAOM/OME than their European-Caucasian
counterparts.
4.5 Association of SP-A1, SP-A2, and SP-D Alleles and Haplotypes with Meningococcal Disease
Previous research by Jack and colleagues (2006) linked
meningococcal disease with the presence of an adenine at codon
223 of SP-A2, leading to an amino acid substitution from a
glutamine (major allele) to a lysine (minor allele). In an attempt
to replicate their findings, three patients diagnosed with

Chapter Four: Discussion 125
meningococcal disease were genotyped for the eleven SNP loci in
SP-A1, SP-A2, and SP-D and allele/haplotype frequencies were
compared to the control population to identify any significant
differences.
Haploview analysis uncovered an association between an alanine
at codon 160 of SP-D and meningococcal disease. The presence
of an adenine instead of a guanine at SPD-160 was found to be
over-represented in the meningococcal population (P = 0.0437).
No association between a lysine at SP-A2 codon 223 and
meningococcal disease was found.
As previously discussed, the non-synonymous substitution of a
threonine for an alanine at codon 160 of SP-D may alter SP-D
collagenous domain’s ability to participate in immune-related
pathways, which in turn could result in increased host
susceptibility to infection by Neisseria meningitidis. However, to
date no research has investigated this suggestion. Only three
individuals diagnosed with meningococcal disease were
genotyped for the eleven SNPs in SP-A1, SP-A2, and SP-D in this
study; thus, it is possible that findings from such a small
population may not be valid. Further research with a larger
sample size would either validate or challenge the results from
this study and that of Jack et al. (2006).
4.6 Copy Number Variants of SP-A1 and SP-A2
In addition to the genomic variation seen between individuals
due to SNPs, it has recently been ascertained that the human
genome is adundant in copy number variations (CNVs) of DNA
segments often ranging from kilobases to megabases in length

Chapter Four: Discussion 126
(Redon et al., 2006). Redon and colleagues (2006) defined a
CNV as a genomic region equal or greater than 1 kb in length
and present in variable copy numbers, compared to a reference
genome. They conducted a global genome-wide scan for CNVs in
270 individuals representing four populations with different
ancestry. Nearly 1,500 CNVs were identified across the 270
samples covering approximately 12% of the human genome,
with the mean total CNV length per genome estimated at more
than 20 Mbp. These figures suggested that the average amount
of genomic variation between any two randomly selected
individuals was 5 – 10 times greater than previously estimated
by SNP studies (Shianna and Willard, 2006).
If these CNVs occur within a gene or its regulatory region,
duplications or deletions could alter the levels of mRNA produced
for that gene, which would consequently result in increased or
reduced levels of protein translated. In the context of SP-A1, SP-
A2, and SP-D any CNVs within these genes could influence gene
expression, phenotypic variation, and/or gene dosage and could
increase/decrease host susceptibility to related diseases e.g.
RAOM and/or OME.
Gonzalez and co-workers (2005) investigated inter-individual
and inter-population variations in the copy number of a
segmental duplication containing the gene CCL3L1, which
encodes for a human immunodeficiency virus-1 (HIV-1)-
suppressive chemokine and ligand for the HIV co-receptor CCR5.
They found that individuals with a CCL3L1 copy number lower
than the population average exhibited a significantly higher
susceptibility to HIV and/or acquired immunodeficiency
syndrome (AIDS). The researchers concluded that variations in
the quantity of immune-related genes like that seen in CCL3L1,
Chapter Four: Discussion 127
may contribute to a genetic susceptibility or resistance to
particular infectious diseases.
In the latest human genome reference sequence (Ensemble
human, release 40), two identical copies of both SP-A1 and SP-
A2 were evident, approximately 300 kb apart, while only one
copy of SP-D was apparent. Duplication of SP-A1 and SP-A2
indicates that CNV is present in the genes’ region. If this was the
case it would suggest that differences in the copy numbers of
SP-A1 and SP-A2 would result in gene dosage variations. Lower
(or higher) amounts of the proteins in the middle ear may result
in reduced (or enhanced) bacterial/viral clearance; thus any
individual could have a genetically determined level of
susceptibility to RAOM and/or OME. However, there is no
evidence to support this hypothesis.
Joanna Floros, Professor of Cellular and Molecular Physiology at
the Pennsylvania State University, USA, examined the duplicated
sequences of SP-A1 and SP-A2 and also found them to be
identical (personal communication, 2006). For example, there
was only one nucleotide difference between the two SP-A1
sequences of approximately 3.2 kb. However, Floros considered
that it was unlikely that each SP-A1 and SP-A2 was duplicated,
and given that the sequence of the two SP-A genes is so similar,
any computer matching analysis could potentially produce flawed
results.

Chapter Four: Discussion 128
4.7 Study Limitations
4.7.1 Confounding Factors
It has been frequently noted that very few published findings of
significant associations between alleles and disease can be
replicated indisputably (Colhoun et al., 2003). Statistical
evidence that indicates an association between an allele and a
particular disease phenotype could arise from three situations
(Cordon and Palmer, 2003):
1. Stochastic variation in allele frequencies present in the
populations.
2. Associated allele may be in linkage disequilibrium with a
causative allele located nearby.
3. Associated allele may have a functional and direct effect on
the corresponding gene product.
Linkage disequilibrium in an individual’s genome depends heavily
on the population’s history and the genetic characteristics of the
population’s founding individuals (Hirschorn et al., 2002). For
example, in a population with a relatively recent common
ancestor such as New Zealand Maori and Pacific Islanders, fewer
recombination events would have occurred to separate the SP-
A1, SP-A2, and SP-D alleles. Therefore, certain haplotypes will
often be inherited together throughout the population. On the
other hand, a European-Caucasian population with a relatively
older common ancestor would have been subjected to more
recombination events, possibly resulting in disrupted linkage
disequilibrium and reduced haplotype inheritance. Thus, if a
specific allele is in linkage disequilibrium with a nearby

Chapter Four: Discussion 129
RAOM/OME-associated allele in one population (e.g. Maori and
Pacific Island) but not another (e.g. European-Caucasian), then a
false positive association between that allele and RAOM/OME
could possibly have occurred. It is possible that higher linkage
disequilibrium in the New Zealand Maori and Pacific Island
population may have resulted in the incidence of more SP-A1,
SP-A2, and SP-D alleles and haplotypes appearing to be
implicated with RAOM/OME in this study.
Another confounding factor that has been noted to affect the
validity of genetic association studies is population stratification.
Population stratification occurs when the case and control groups
of a genetic association study are drawn from two or more ethnic
groups, and one of these groups has higher disease prevalence
than the others (Hirschorn et al., 2002). Stratification occurs due
to the fact that the high-prevalence group will be over-
represented in the case group, and under-represented in the
control group. Therefore, an allele that is found by chance to be
more frequent in the high-prevalence group will falsely appear to
be associated with the disease in question.
In this study, allele and haplotype frequencies in a population
containing twenty-two New Zealand Maori or Pacific Island
individuals diagnosed with RAOM/OME was compared to a control
population consisting of mainly European-Caucasian individuals.
It is possible that due to the higher prevalence of RAOM/OME in
New Zealand Maori and Pacific Island children, their subsequent
over-representation in the case group and under-representation
in the control group, that population stratification was present. If
this is true then it is also possible that some of the
alleles/haplotypes found in the New Zealand Maori and Pacific
Island population to be implicated with RAOM/OME are in fact
indicative of stochastic variation in the population.

Chapter Four: Discussion 130
4.7.2 Hardy-Weinberg Equilibrium
If a particular SNP is in Hardy-Weinberg equilibrium in a
population then the observed genotype frequencies should
simply be a function of the relative allele frequencies, assuming
that migration, mutation, natural selection, and assortative
mating are absent (Wigginton et al., 2005). All eleven SP-A1,
SP-A2, and SP-D SNPs were found to be in Hardy-Weinberg
equilibrium in the case, control, and Pacific Island populations,
except for the following two exceptions:
The SNP at SP-A1 codon 50 exhibited a level of heterozygosity
significantly lower in the total case population than expected by
the Haploview program based on the raw major and minor allele
frequencies (P = 1.00 x10⁻⁴). Such a discrepancy indicated that
the SNP was not in Hardy-Weinberg equilibrium. In contrast,
SPA1-50 was in Hardy-Weinberg equilibrium in the control
population and the New Zealand Maori and Pacific Island
population.
A similar scenario was seen at SP-A2 codon 91 in the control
population. The predicted proportion of heterozygotes was
significantly higher than that observed (P = 5.64 x10⁻⁶), thus the
SNP was also not in Hardy-Weinberg equilibrium within that
population. However, no significant deviations from Hardy-
Weinberg equilibrium were seen at SPA2-91 in the case
population or the New Zealand Maori and Pacific Island
population.
Wigginton and associates (2005) suggested that any departures
from Hardy-Weinberg equilibrium at a particular SNP locus could
be due to problems with population structure or genotyping.

Chapter Four: Discussion 131
Furthermore, if the SNP in question is in the context of a
population consisting of affected individuals (i.e. diagnosed with
RAOM/OME) then it may suggest an association between the SNP
locus and that particular disease. However, no association
between SPA1-50 and RAOM/OME was apparent (P > 0.05) in
the total case population, even though the locus was not in
Hardy-Weinberg equilibrium.
4.8 Conclusions
In a population of primarily European-Caucasians, two SP-A1
alleles and one SP-A2 allele were found to be associated with
increased susceptibility to RAOM/OME. SP-A1 haplotype 6A2 and
SP-A2 haplotype 1A2 were both found to be protective against
RAOM/OME. However, a previously unclassified SP-A1 haplotype
CGAGC, and three SP-A2 haplotypes (1A3, 1A9, and 1A10) were
shown to be associated with increased risk of RAOM/OME.
Significantly different results were observed in a population of
New Zealand Maori and Pacific Island individuals diagnosed with
RAOM/OME. Twice as many alleles (two SP-A1 alleles, three SP-
A2 alleles, and one SP-D allele) were found to be over-
represented in the affected individuals and therefore associated
with increased risk of RAOM/OME. One SP-A1 haplotype (6A2),
two SP-A2 haplotypes (1A0 and 1A2), and one SP-D haplotype
(TA) were all found to have a protective effect against
RAOM/OME. On the other hand, two SP-A1 haplotypes (6A8 and
6A10) and two SP-A2 haplotypes (1A3 and 1A10) were associated
with increased susceptibility to RAOM/OME. The SPA1/SPA2/SPD
haplotype 6A2-1A0-TA was under-represented in the New
Zealand Maori and Pacific Island individuals with RAOM/OME.

Chapter Four: Discussion 132
The observation of additional alleles and haplotypes that were
associated with increased risk of RAOM/OME, and the reduced
frequency of the protective haplotypes suggests that New
Zealand Maori and Pacific Island individuals maybe more
susceptible to RAOM/OME than European-Caucasian individuals.
However, very little is known about the functional consequences
of the various SP-A1, SP-A2, and SP-D alleles and haplotypes
and whether they really do affect the corresponding protein’s
host defense abilities, thus, it would be naïve to conclude that
the findings of this study accurately describe valid explanations
for host susceptibility or resistance to RAOM/OME.
A single SP-D allele and haplotype (TA) were found to be
associated with increased susceptibility to meningococcal
disease. However, this finding does not confirm the results of a
much larger association study (Jack et al., 2006) and the small
sample size employed in the present study may mean that the
data are not significant.
Despite the apparent significant results of this study there are a
number of potential confounding variables that could challenge
their validity. It is vital that more research is done to further
confirm or deny the relationship of SP-A and SP-D variants with
susceptibility/resistance to RAOM/OME.
4.9 Future Research
The findings of this present study are the first to suggest a
possible genetic predisposition of New Zealand Maori and Pacific
Island individuals to RAOM/OME. In order to confirm or challenge
these findings, it would be valuable to replicate the current

Chapter Four: Discussion 133
methodology using two larger separate populations of New
Zealand Maori and Pacific Island individuals. This would allow
researchers to see if there is any significant difference in the SP-
A1, SP-A2, and SP-D alleles and haplotypes between the two
populations.
A large amount of time and effort is needed to research the
structural and functional consequences of the SP-A1, SP-A2, and
SP-D allele and haplotypes on the actual proteins themselves,
and whether these affect the proteins’ ability to combat bacterial
and/or viral infection in the middle ear and Eustachian tube. For
example, purified SP-A and SP-D could be isolated from
individuals with specific genetic variants, and assayed for
bacterial and viral binding efficiency.
Novel research investigating the possibility of SP-A1 and SP-A2
copy number variations would also be beneficial to researchers
studying SP-A and SP-D influences on a variety of pulmonary
pathologies as well as RAOM/OME in the middle ear. It would be
interesting to determine whether individuals particularly resistant
to RAOM/OME displayed higher copy numbers of SP-A1 and SP-
A2, compared to susceptible individuals. Furthermore, copy
number variations across a range of ethnicities (i.e. European-
Caucasian, New Zealand Maori, Pacific Island, and others) would
identify any ethnicity-related variations.

134
APPENDIX I
ETHICS INFORMATION
Information sheets and consent forms were given to and signed
by parents of individuals (under 18 years old) undergoing
RAOM/OME-related surgery, and blood donors comprising the
control population. These documents were approved by the
Northern Y Regional Ethics Committee, administered by the New
Zealand Ministry of Health, and are presented in the following
pages.
Appendix I: Ethics Information
135
Department of Biological Sciences School of Science & Engineering Te Pūtaiao me te Mātauranga Pūkaha The University of Waikato Private Bag 3105 Hamilton New Zealand Phone +64 7 838 4148 www.bio.waikato.ac.nz
Information Sheet for Parents
Project Title Influence of genetic factors on individual susceptibility for middle ear diseases. Principle Investigator Catherine Barnett (Master of Science student) Molecular Genetics Laboratory (C.2.03) Department of Biological Sciences The University of Waikato Day Ph: (07) 838 4466 ext 8482 Evening Ph: (021) 1022687 Supervisor: Dr Ray T. M. Cursons, Senior Lecturer, the University of Waikato. Introduction You are invited to participate in a study that will investigate the influence of genetic factors on susceptibility of middle ear diseases. Participation and Confidentiality
• Your child’s participation is entirely voluntary. • If you agree to your child’s participation, you are free to withdraw him/her
from the study at any time, without having to give a reason and this will in no way affect your child’s future health care.
• There will be neither cost nor payment towards the participation. • No material which could personally identify your child will be used in any
reports on this study. • Results will be kept confidential throughout the duration of the study and
stored in a secure location after the completion of the study. • If you would like to know the results of the study, the research student or
the supervisor will give you a copy of the final report once the report is finished or published, or discuss the results with you in person.
Project Purpose Middle ear diseases are among the most common diseases found in infants and children. The genetic influence on an individual’s susceptibility of these diseases is currently unknown. Particular proteins found in the lungs, associated with preventing and combating infection, have also been found in the middle ear. These proteins are called Surfactant Proteins. These proteins have been found to bind to many different pathogens often found in middle ear diseases and promote

Appendix I: Ethics Information
136
their destruction. A mutation in these proteins may cause them to be less active or not at all. This study wants to find out if individuals with these mutations are more prone to middle ear diseases. Project Method A small blood sample will be taken by the surgeon during your child’s scheduled surgery at Waikato Hospital. This will not result in an increased time in theatre. The sample will be transported to the Molecular Genetics Lab at the University of Waikato, and stored at 4°C until required. Then the DNA from the blood cells will be isolated and analyzed using specialized techniques that will identify the mutations in question. Approximately 100 participants will be involved in this project. All participants will be patients admitted to Waikato Hospital for surgery due to middle ear disease. After analysis, all blood samples and DNA will be kept until safely disposed of in July 2007. Benefits and Risks The results of this proposed study will potentially improve understanding of the causal factors of middle ear diseases in an attempt to contribute to the improved management of these diseases in the future. No side effects or risks are anticipated in this study. Definition of Scientific Terms Mutation – a change in the DNA sequence Pathogen – disease causing micro organism DNA – genetic ‘blueprint’ of an organism e.g. human Declaration In the unlikely event of a physical injury as a result of your child’s participation in this study, they may be covered by ACC under the Injury Prevention, Rehabilitation and Compensation Act 2001. ACC cover is not automatic and your case will need to be assessed by ACC according to the provisions of the 2002 Injury Prevention compensation. ACC usually provides only partial reimbursement of costs and expenses and there may be no lump sum compensation payable. There is no cover for mental injury unless it is a result of physical injury. If you have ACC cover, generally this will affect your right to sue the investigators. If you have any questions about ACC, contact your nearest ACC office or the investigator. Statement of Ethical Approval This project has received ethical approval from the Northern Y Regional Ethics Committee and the University of Waikato’s School of Science and Engineering Ethics Committee. If you have any questions or concerns regarding your child’s rights as a participant in this study you may wish to contact a Health and Disability Advocate of Mid and Lower North Island on 0800 42 36 38.

Appendix I: Ethics Information
137
Consent Form Project: Influence of genetic factors on individual susceptibility for middle
ear diseases.
Research Student: Catherine Barnett Supervisor: Dr Ray T. M. Cursons Location: Molecular Genetics Lab (C.2.03), the University of Waikato. Ph: (07) 838 4466 ext 8482 Request for Interpreter English I wish to have an interpreter Yes No
Maori Ehiahia ana ahau ki tetahi kaiwhakamaori/kaiwhaka pakeha korero
Ae Kao
Samoan Out e mana’o ia I ai se fa’amatala upu Ioe Leai
Tongan Oku ou fiema’u ha fakatonulea Io Ikai
Cook Island
Ka inangaro au I tetai tangata uri reo Ae Kare
Niuean Fia manako au ke fakaaonga e taha tagata fakahokohoko kupu
E Nakai
Fijian Au gadreva me dua e vakadewa vei au Io Sega
Tokelaun Ko au e fofou ki he tino ke fakaliliu te gagana Peletania kin a gagana o na motu o te Pahefika
Ioe Leai
• I have read and I understand the information sheet for my child taking part
in the study designed to identify mutations in the genes coding for some proteins involved in host defence in the middle ear. I have had the opportunity to discuss this study. I am satisfied with the answers I have been given.
Yes/No
• I understand that my child’s participation in this study is completely voluntary and that I may withdraw him/her from the study at any time and this will in no way affect my child’s future health care.
Yes/No
• I understand that my child’s participation in the study is confidential and that no material which could identify them will be used in any reports on this study.
Yes/No
• I have had time to consider whether to allow my child to take part. I know whom to contact if my child has any side effects to the study.
Yes/No
• I understand the ACC compensation provisions for this study. Yes/No
Appendix I: Ethics Information
138
• I wish to receive a copy of the results or to discuss the outcomes of the
study with the researcher. Yes/No
• I agree to my GP or other current provider being informed of my
participation in this study and/or the results of my participation in this study.
Yes/No
I………………………………………………………………………..hereby consent to taking part in this study. Date:……………………………………………………………………………………….. Signature:…………………………………………………………………………………... Project explained by:……………………………………………………………………….. Project role:………………………………………………………………………………… Signature:…………………………………………………………………………………... Date:………………………………………………………………………………………... Contact details (please feel free to contact the researchers if you have any questions about this study): Catherine Barnett Location: Molecular Genetics Lab (C.2.03), the University of Waikato. Day Ph: (07) 838 4466 ext 8482 Evening Ph: (021) 1022687 Email: [email protected] Dr Ray T. M. Cursons, the University of Waikato, Ph: (07) 858 5120 Email: [email protected] Mr Tony Cecire, Anglesea Clinic, Cnr Anglesea and Thackeray Sts, Hamilton, Ph: (07) 839 2152 Email: [email protected]

Appendix I: Ethics Information
139
Department of Biological Sciences School of Science & Engineering Te Pūtaiao me te Mātauranga Pūkaha The University of Waikato Private Bag 3105 Hamilton New Zealand Phone +64 7 838 4148 www.bio.waikato.ac.nz
Information Sheet for Control Participants
Project Title Influence of genetic factors on individual susceptibility for middle ear diseases. Principle Investigator Catherine Barnett (Master of Science student) Molecular Genetics Laboratory (C.2.03) Department of Biological Sciences The University of Waikato Day Ph: (07) 838 4466 ext 8482 Evening Ph: (021) 1022687 Supervisor: Dr Ray T. M. Cursons, Senior Lecturer, the University of Waikato. Introduction You are invited to participate in a study that will investigate the influence of genetic factors on susceptibility of middle ear diseases. Participation and Confidentiality
• Your participation is entirely voluntary. • If you do agree to take part you are free to withdraw from the study at any
time, without having to give a reason and this will in no way affect your future health care.
• There will be neither cost nor payment towards the participation. • No material which could personally identify you will be used in any reports
on this study. • Results will be kept confidential throughout the duration of the study and
stored in a secure location after the completion of the study. • If you would like to know the results of the study, the research student or
the supervisor will give you a copy of the final report once the report is finished or published, or discuss the results with you in person.
Project Purpose Middle ear diseases are among the most common diseases found in infants and children. The genetic influence on an individual’s susceptibility of these diseases is currently unknown. Particular proteins found in the lungs, associated with preventing and combating infection, have also been found in the middle ear. These proteins are called Surfactant Proteins. These proteins have been found to bind to many different pathogens often found in middle ear diseases and promote
Appendix I: Ethics Information
140
their destruction. A mutation in these proteins may cause them to be less active or not at all. This study wants to find out if individuals with these mutations are more prone to middle ear diseases. Project Method A small blood sample will be taken by the nurse during your scheduled blood donation at the New Zealand Blood Service (Hamilton Branch). The sample will be transported to the Molecular Genetics Lab at the University of Waikato, and stored at 4°C until required. Then the DNA from the blood cells will be isolated and analyzed using specialized techniques that will identify the mutations in question. The blood sample given will be part of a group which will be used as a control for the study. A group of patients with middle ear disease will then be compared to the control group to assess any differences from the normal population. Approximately 100 control participants will be involved in this project. Participants with middle ear disease will consist of patients admitted to Waikato Hospital for surgery due to middle ear disease. After analysis, all blood samples and DNA will be kept until safely disposed of in July 2007. Benefits and Risks The results of this proposed study will potentially improve understanding of the causal factors of middle ear diseases in an attempt to contribute to the improved management of these diseases in the future. No side effects or risks are anticipated in this study. Definition of Scientific Terms Mutation – a change in the DNA sequence Pathogen – disease causing micro organism DNA – genetic ‘blueprint’ of an organism e.g. human Declaration In the unlikely event of a physical injury as a result of your participation in this study, you may be covered by ACC under the Injury Prevention, Rehabilitation and Compensation Act 2001. ACC cover is not automatic and your case will need to be assessed by ACC according to the provisions of the 2002 Injury Prevention compensation. This depends on a number of factors such as whether you are an earner or non-earner. ACC usually provides only partial reimbursement of costs and expenses and there may be no lump sum compensation payable. There is no cover for mental injury unless it is a result of physical injury. If you have ACC cover, generally this will affect your right to sue the investigators. If you have any questions about ACC, contact your nearest ACC office or the investigator. Statement of Ethical Approval This project has received ethical approval from the Northern Y Regional Ethics Committee and the University of Waikato’s School of Science and Engineering Ethics Committee. If you have any questions or concerns regarding your rights as

Appendix I: Ethics Information
141
a participant in this study you may wish to contact a Health and Disability Advocate of Mid and Lower North Island on 0800 42 36 38.
Consent Form
Project: Influence of genetic factors on individual susceptibility for middle
ear diseases.
Research Student: Catherine Barnett Supervisor: Dr Ray T. M. Cursons Location: Molecular Genetics Lab (C.2.03), the University of Waikato. Ph: (07) 838 4466 ext 8482 Request for Interpreter English I wish to have an interpreter Yes No
Maori Ehiahia ana ahau ki tetahi kaiwhakamaori/kaiwhaka pakeha korero
Ae Kao
Samoan Out e mana’o ia I ai se fa’amatala upu Ioe Leai
Tongan Oku ou fiema’u ha fakatonulea Io Ikai
Cook Island
Ka inangaro au I tetai tangata uri reo Ae Kare
Niuean Fia manako au ke fakaaonga e taha tagata fakahokohoko kupu
E Nakai
Fijian Au gadreva me dua e vakadewa vei au Io Sega
Tokelaun Ko au e fofou ki he tino ke fakaliliu te gagana Peletania kin a gagana o na motu o te Pahefika
Ioe Leai
• I have read and I understand the information sheet for volunteers taking
part in the study designed to identify mutations in the genes coding for some proteins involved in host defence in the middle ear. I have had the opportunity to discuss this study. I am satisfied with the answers I have been given.
Yes/No
• I understand that taking part in this study is completely voluntary and that I may withdraw from the study at any time and this will in no way affect my future health care.
Yes/No
• I understand that my participation in the study is confidential and that no material which could identify me will be used in any reports on this study.
Yes/No
• I have had time to consider whether to take part. I know whom to contact if I have any side effects to the study.
Yes/No

Appendix I: Ethics Information
142
• I understand the ACC compensation provisions for this study. Yes/No
• I wish to receive a copy of the results or to discuss the outcomes of the
study with the researcher. Yes/No
• I agree to my GP or other current provider being informed of my
participation in this study and/or the results of my participation in this study.
Yes/No
I………………………………………………………………………..hereby consent to taking part in this study. Date:……………………………………………………………………………………….. Signature:…………………………………………………………………………………... Project explained by:……………………………………………………………………….. Project role:………………………………………………………………………………… Signature:…………………………………………………………………………………... Date:………………………………………………………………………………………... Contact details (please feel free to contact the researchers if you have any questions about this study): Catherine Barnett Location: Molecular Genetics Lab (C.2.03), the University of Waikato. Day Ph: (07) 838 4466 ext 8482 Evening Ph: (021) 1022687 Email: [email protected] Dr Ray T. M. Cursons, the University of Waikato, Ph: (07) 858 5120 Email: [email protected] Mr Tony Cecire, Anglesea Clinic, Cnr Anglesea and Thackeray Sts, Hamilton, Ph: (07) 839 2152 Email: [email protected]
143
APPENDIX II
SEQUENCING RESULTS
For each of the eleven SP-A1, SP-A2, and SP-D SNPs
investigated in this study, the major and minor allele-specific
primers amplified the same genomic region during real-time
PCR. The following sections describe the sequence of the single
amplified region, for each of these SNPs, and their subsequent
National Centre of Biotechnology Information (NCBI) BLAST
searches.

Appendix II: Sequencing Results 144
AII.1 SPA1-19 CATCTGNNGNTATGGACAGGCCAGGCTTTCTGCAGAGCACGGAATGATTC ATGCTGAACGCTCAGAGACGGTGAACGCCATGTTTCCCAGGTTAACATAG TGAGCGCACTGAAAGAAAGTGAGACTGCACTGGAGCCCAGGTCCCCGGGC TCCTCCTAGAGCTCCTTACTCTTCCTCCGTACCTCAGGCAGCCTTGAGAC CCCACAACCTCCAGGCCGGAGGCNCTAGAAGCATGACGTGCCATGCCACG GTGCCATGGTGATGCTGGGAATTTTCCCGGGAGCTTCGGGTCTTCCCAGT CACTCTGGTCTCGCCCGCCCTGCCTCTCGGGCTCTGCCCAGCTTCCTGAG TCCTGACAGAGCACAGTGGGGGAGATAGTTGGCAGAGGTGGCAGATGGGC TCACGGTCATCCCTCCTGCAGGATCAGTCGACTGGACCCAGAGCCATGTG GCTGTGCCCTCTGGCCCTCATCCTCATCTTGATCGCTGCCTCTGGTGCTG CGTGCGNACAGTGNAGGNCCGTTAGTCGGTC Figure AII.1. Sequence of PCR product amplified for SPA1-19. The PCR product length was expected to be 515 bp but sequencing reported 531 bp. BLASTN 2.2.15 [Oct-15-2006] Reference: Altschul, Stephen F., Thomas L. Madden, Alejandro A. Schäffer, Jinghui Zhang, Zheng Zhang, Webb Miller, and David J. Lipman (1997), "Gapped BLAST and PSI-BLAST: a new generation of protein database search programs", Nucleic Acids Res. 25:3389-3402. RID: 1168983901-20321-158253073062.BLASTQ1 Database: All GenBank+EMBL+DDBJ+PDB sequences (but no EST, STS, GSS,environmental samples or phase 0, 1 or 2 HTGS sequences) 4,758,117 sequences; 18,951,497,157 total letters Query= Length=531
Figure AII.2. Parameters from BLAST search with SPA1-19 sequence. Score E (Bits) Value gb|AC068139.6| Homo sapiens chromosome 10 clone RP11-506M13, com 525 1e-146 emb|BX248123.5| Human DNA sequence from clone RP11-589B3 on c... 525 1e-146 gb|AY198391.1| Homo sapiens surfactant, pulmonary-associated ... 525 1e-146 ref|XM_934590.2| PREDICTED: Homo sapiens similar to surfactan... 515 1e-143 ref|XM_001133039.1| PREDICTED: Homo sapiens similar to Pulmon... 494 4e-137 gb|AY206682.1| Homo sapiens surfactant, pulmonary-associated ... 494 4e-137 gb|M30838.1|HUMPSAP Human pulmonary surfactant apoprotein (PSAP) 488 3e-135 gb|S69679.1| SP-A2=surfactant protein {5' region} [human, Genomi 442 1e-121 gb|M68519.1|HUMSFTP1A Human pulmonary surfactant-associated p... 442 1e-121 ref|XM_001133054.1| PREDICTED: Homo sapiens similar to Pulmon... 131 7e-28 Figure AII.3. First ten sequences producing significant alignments with SPA1-19.

Appendix II: Sequencing Results 145
Length=24037 Score = 525 bits (265), Expect = 1e-146 Identities = 455/493 (92%), Gaps = 24/493 (4%) Strand=Plus/Plus Query 14 GGACAGGCCAGGCTTTCTGCAGAGCACGGAATGATTCATGCTGAACGCTCAGAGACGGTG 73 ||||||| |||| |||||||||||||||||| |||||| |||||| ||||||| |||| Sbjct 10795 GGACAGGGCAGGTTTTCTGCAGAGCACGGAA-GATTCA-GCTGAAG--TCAGAGA-GGTG 10849 Query 74 AACGCCATGTTTCCCAGGTTAACATAGTGAGCGCACTGAAAGAAAGTGAGACTGCACTGG 133 || |||| |||||||||| |||||||||||| |||||||||||||| ||||||||||||| Sbjct 10850 AA-GCCA-GTTTCCCAGGGTAACATAGTGAG-GCACTGAAAGAAAG-GAGACTGCACTGG 10905 Query 134 AGCCCAGGTCCCCGGGCTCCTCCTAGAGCTCCTTACTCTTCCTCCGTACCTCAGGCAGCC 193 |||||||||||||||||||| | ||||||||||||||||||||| |||||| ||||| Sbjct 10906 AGCCCAGGTCCCCGGGCTCCCC--AGAGCTCCTTACTCTTCCTCCT--CCTCAG-CAGCC 10960 Query 194 TTGAGACCCCACAACCTCCAGGCCGGAGGCNCTAGAAGCATGACGTGCCATGCCACGGTG 253 | ||||||||||||||||||| |||||||| || ||||||||| | |||||||| |||| Sbjct 10961 TGGAGACCCCACAACCTCCAG-CCGGAGGC-CT-GAAGCATGAGG--CCATGCCA-GGTG 11014 Query 254 CCATGGTGATGCTGGGAATTTTCCCGGGAGCTTCGGGTCTTCCCAGTCACTCTGGTCTCG 313 ||| |||||||||||||||||||||||||||||||||||||||||| ||||||||||||| Sbjct 11015 CCA-GGTGATGCTGGGAATTTTCCCGGGAGCTTCGGGTCTTCCCAG-CACTCTGGTCTCG 11072 Query 314 CCCGCCCTGCCTCTCGGGCTCTGCCCAGCTTCCTGAGTCCTGACAGAGCACAGTGGGGGA 373 |||||||||||||||||||||||||||||||||||||||||||||||||||||||||||| Sbjct 11073 CCCGCCCTGCCTCTCGGGCTCTGCCCAGCTTCCTGAGTCCTGACAGAGCACAGTGGGGGA 11132 Query 374 GATAGTTGGCAGAGGTGGCAGATGGGCTCACGGTCATCCCTCCTGCAGGATCAGTCGACT 433 ||| ||||||||||||||||||||||||||||| |||||||||||||||| ||| ||||| Sbjct 11133 GAT-GTTGGCAGAGGTGGCAGATGGGCTCACGGCCATCCCTCCTGCAGGAGCAG-CGACT 11190 Query 434 GGACCCAGAGCCATGTGGCTGTGCCCTCTGGCCCTCATCCTCATCTTGATCGCTGCCTCT 493 ||||||||||||||||||||||||||||||||||||| |||||||||||| || |||||| Sbjct 11191 GGACCCAGAGCCATGTGGCTGTGCCCTCTGGCCCTCAACCTCATCTTGATGGCAGCCTCT 11250 Query 494 GGTGCTGCGTGCG 506 ||||||| ||||| Sbjct 11251 GGTGCTGTGTGCG 11263 Figure AII.4. Alignment of Query sequence with: gb|AY198391.1| Homo sapiens surfactant, pulmonary-associated protein A1 (SFTPA1) gene, complete cds.

Appendix II: Sequencing Results 146
AII.2 SPA1-50 ANCTGGGAGGGANAGGCAGGTTTTCTTGCAGAGCACGGAAGATTCAGCTG AAGTCAGAGAGGTGAAGCCAGTTTCCCAGGGTAACATAGTGAGGCACTGA AAGAAAGGGAGACTGCACTGGAGCCCAGGTCCCCGGGCTCCCCAGAGCTC CTTACTCTTCCTCCTCCTCAGCAGCCTGGAGACCCCACAACCTCCAGCCG GAGGCCTGAAGCATGAGGCCATGCCAGGTGCCAGGTGATGCTGGGAATTT TCCCGGGAGCTTCGGGTCTTCCCAGCACTCTGGTCTCGCCCGCCCTGCCT CTCGGGCTCTGCCCAGCTTCCTGAGTCCTGACAGAGCACAGTGGGGGAGA TGTTGGCAGAGGTGGCAGATGGGCTCACGGCCATCCCTCCTGCAGGAGCA GCGACTGGACCCAGAGCCATGTGGCTGTGCCCTCTGGCCCTCAACCTCAT CTTGATGGCAGCCTCTGGTGCTGTGTGCGAAGTGAAGGACGTTTGTGTTG GAAGCCCTGGTATCCCCGGCACTCCTGGATCCCACGGCCTGCCAGGCAGG GACGGGAGAGATGGTGTCAAAGGAGACTTNNGGGAAGGGGG Figure AII.5. Sequence of PCR product amplified for SPA1-50. The PCR product length was expected to be 605 bp but sequencing reported 591 bp. BLASTN 2.2.15 [Oct-15-2006] Reference: Altschul, Stephen F., Thomas L. Madden, Alejandro A. Schäffer, Jinghui Zhang, Zheng Zhang, Webb Miller, and David J. Lipman (1997), "Gapped BLAST and PSI-BLAST: a new generation of protein database search programs", Nucleic Acids Res. 25:3389-3402. RID: 1168984875-28908-125734700402.BLASTQ4 Database: All GenBank+EMBL+DDBJ+PDB sequences (but no EST, STS, GSS,environmental samples or phase 0, 1 or 2 HTGS sequences) 4,758,117 sequences; 18,951,497,157 total letters Query= Length=591 Figure AII.6. Parameters from BLAST search with SPA1-50 sequence. Score E (Bits) Value gb|AY198391.1| Homo sapiens surfactant, pulmonary-associated ... 1088 0.0 gb|AC068139.6| Homo sapiens chromosome 10 clone RP11-506M13, com 1080 0.0 emb|BX248123.5| Human DNA sequence from clone RP11-589B3 on c... 1080 0.0 gb|M30838.1|HUMPSAP Human pulmonary surfactant apoprotein (PSAP) 1031 0.0 gb|AY206682.1| Homo sapiens surfactant, pulmonary-associated ... 1017 0.0 ref|XM_001133039.1| PREDICTED: Homo sapiens similar to Pulmon... 1009 0.0 ref|XM_934590.2| PREDICTED: Homo sapiens similar to surfactan... 989 0.0 gb|M68519.1|HUMSFTP1A Human pulmonary surfactant-associated p... 965 0.0 gb|S69679.1| SP-A2=surfactant protein {5' region} [human, Genomi 779 0.0 ref|XM_934600.2| PREDICTED: Homo sapiens similar to surfactan... 359 2e-96 Figure AII.7. First ten sequences producing significant alignments with SPA1-50.
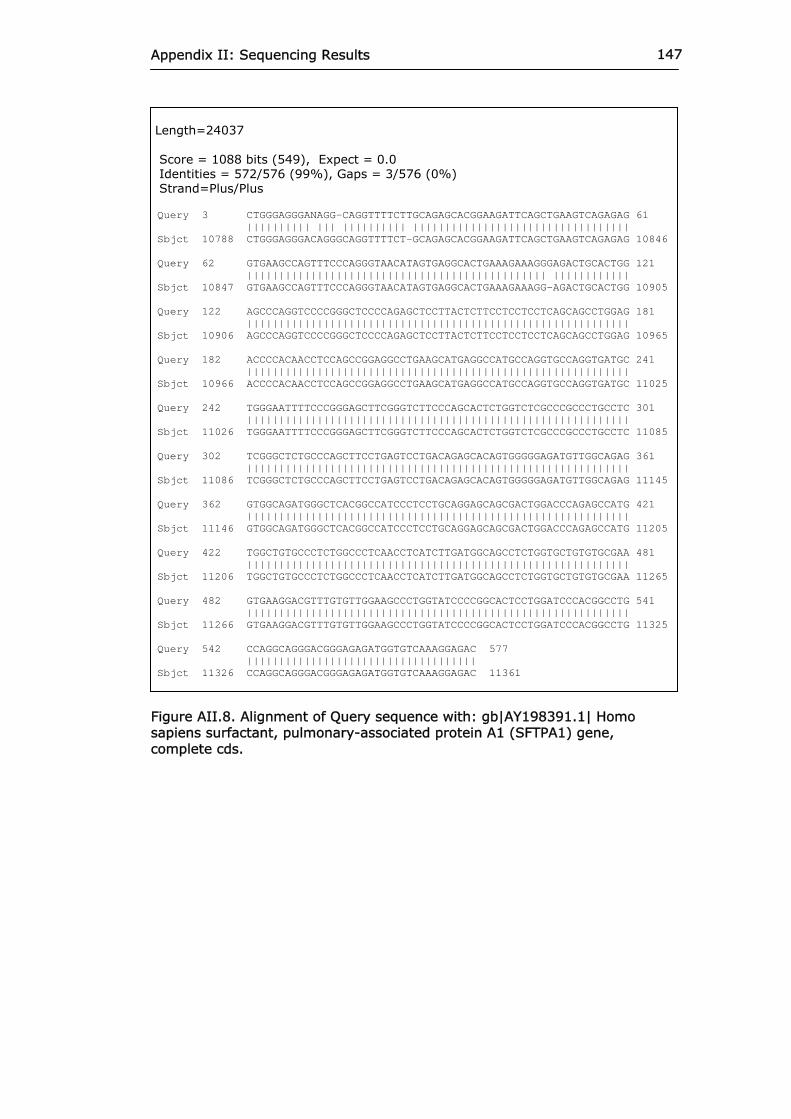
Appendix II: Sequencing Results 147
Length=24037 Score = 1088 bits (549), Expect = 0.0 Identities = 572/576 (99%), Gaps = 3/576 (0%) Strand=Plus/Plus Query 3 CTGGGAGGGANAGG-CAGGTTTTCTTGCAGAGCACGGAAGATTCAGCTGAAGTCAGAGAG 61 |||||||||| ||| |||||||||| |||||||||||||||||||||||||||||||||| Sbjct 10788 CTGGGAGGGACAGGGCAGGTTTTCT-GCAGAGCACGGAAGATTCAGCTGAAGTCAGAGAG 10846 Query 62 GTGAAGCCAGTTTCCCAGGGTAACATAGTGAGGCACTGAAAGAAAGGGAGACTGCACTGG 121 ||||||||||||||||||||||||||||||||||||||||||||||| |||||||||||| Sbjct 10847 GTGAAGCCAGTTTCCCAGGGTAACATAGTGAGGCACTGAAAGAAAGG-AGACTGCACTGG 10905 Query 122 AGCCCAGGTCCCCGGGCTCCCCAGAGCTCCTTACTCTTCCTCCTCCTCAGCAGCCTGGAG 181 |||||||||||||||||||||||||||||||||||||||||||||||||||||||||||| Sbjct 10906 AGCCCAGGTCCCCGGGCTCCCCAGAGCTCCTTACTCTTCCTCCTCCTCAGCAGCCTGGAG 10965 Query 182 ACCCCACAACCTCCAGCCGGAGGCCTGAAGCATGAGGCCATGCCAGGTGCCAGGTGATGC 241 |||||||||||||||||||||||||||||||||||||||||||||||||||||||||||| Sbjct 10966 ACCCCACAACCTCCAGCCGGAGGCCTGAAGCATGAGGCCATGCCAGGTGCCAGGTGATGC 11025 Query 242 TGGGAATTTTCCCGGGAGCTTCGGGTCTTCCCAGCACTCTGGTCTCGCCCGCCCTGCCTC 301 |||||||||||||||||||||||||||||||||||||||||||||||||||||||||||| Sbjct 11026 TGGGAATTTTCCCGGGAGCTTCGGGTCTTCCCAGCACTCTGGTCTCGCCCGCCCTGCCTC 11085 Query 302 TCGGGCTCTGCCCAGCTTCCTGAGTCCTGACAGAGCACAGTGGGGGAGATGTTGGCAGAG 361 |||||||||||||||||||||||||||||||||||||||||||||||||||||||||||| Sbjct 11086 TCGGGCTCTGCCCAGCTTCCTGAGTCCTGACAGAGCACAGTGGGGGAGATGTTGGCAGAG 11145 Query 362 GTGGCAGATGGGCTCACGGCCATCCCTCCTGCAGGAGCAGCGACTGGACCCAGAGCCATG 421 |||||||||||||||||||||||||||||||||||||||||||||||||||||||||||| Sbjct 11146 GTGGCAGATGGGCTCACGGCCATCCCTCCTGCAGGAGCAGCGACTGGACCCAGAGCCATG 11205 Query 422 TGGCTGTGCCCTCTGGCCCTCAACCTCATCTTGATGGCAGCCTCTGGTGCTGTGTGCGAA 481 |||||||||||||||||||||||||||||||||||||||||||||||||||||||||||| Sbjct 11206 TGGCTGTGCCCTCTGGCCCTCAACCTCATCTTGATGGCAGCCTCTGGTGCTGTGTGCGAA 11265 Query 482 GTGAAGGACGTTTGTGTTGGAAGCCCTGGTATCCCCGGCACTCCTGGATCCCACGGCCTG 541 |||||||||||||||||||||||||||||||||||||||||||||||||||||||||||| Sbjct 11266 GTGAAGGACGTTTGTGTTGGAAGCCCTGGTATCCCCGGCACTCCTGGATCCCACGGCCTG 11325 Query 542 CCAGGCAGGGACGGGAGAGATGGTGTCAAAGGAGAC 577 |||||||||||||||||||||||||||||||||||| Sbjct 11326 CCAGGCAGGGACGGGAGAGATGGTGTCAAAGGAGAC 11361 Figure AII.8. Alignment of Query sequence with: gb|AY198391.1| Homo sapiens surfactant, pulmonary-associated protein A1 (SFTPA1) gene, complete cds.

Appendix II: Sequencing Results 148
AII.3 SPA1-62 CTGGGAGGGACAGGCAGGTTTCTGCAGAGCACGGAAGATTCAGCTGAAGT CAGAGAGGTGAAGCCAGTTTCCCAGTGTAACATAGTGAGGCACTGAAAGA AAGGGAGACTGCACTGGAGCCCAGGTCCCCGGGCTCCCCAGAGCTCCTTA CTCTTCCTCCTCCTCAGCAGCCTGGAGACCCCACAACCTCCAGCCGGAGG CCTGAAGCATGAGGCCATGCCAGGTGCCAGGTGATGCTGGGAATTTTCCC GGGAGCTTCGGGTCTTCCCAGCACTCTGGTCTCGCCCGCCCTGCCTCTCG GGCTCTGCCCAGCTTCCTGAGTCCTGACAGAGCACAGTGGGGGAGATGTT GGCAGAGGTGGCAGATGGGCTCACGGCCATCCCTCCTGCAGGAGCAGCGA CTGGACCCAGAGCCATGTGGCTGTGCCCTCTGGCCCTCAACCTCATCTTG ATGGCAGCCTCTGGTGCTGTGTGCGAAGTGAAGGACGTTTGTGTTGGAAG CCCTGGTATCCCCGGCACTCCTGGATCCCACGGCCTGCCAGGCAGGGACG GGAGAGATGGTGTCAAAGGAGACCCTGGCCCTCCAGGTACTGTGCTGCAG ACCCCACCCTCAGCTGAGGGACACAGACCCCTTTTCAGGAGGCCCATCTG TCCAGGCCCCTAGGCTGTGGGCCATAGTGAGCTGGGGGCTATAGTAAGCT GGGTGGGACTTCAGTCTGCAGGGCTGGTGGGTTCCTGGGGCCCCTTATGA TGGGCGCATTCCTGGGAGAGTCTTGTCCTCATAGTGCCCCACGGACGTGA TACGAGTGATTAGCTGAGCCAGCCTGGTGATTACTGGGCATCGGAAGTCT CACTAGGCTCCAACCAGTTNTGGGTGACAGATCTTACCATCCCTGTTCTC TTTCTCCTGCAGGCCCNTGGGTCCCTGAGANGCCA Figure AII.9. Sequence of PCR product amplified for SPA1-62. The PCR product length was expected to be 959 bp but sequencing reported 936 bp. BLASTN 2.2.15 [Oct-15-2006] Reference: Altschul, Stephen F., Thomas L. Madden, Alejandro A. Schäffer, Jinghui Zhang, Zheng Zhang, Webb Miller, and David J. Lipman (1997), "Gapped BLAST and PSI-BLAST: a new generation of protein database search programs", Nucleic Acids Res. 25:3389-3402. RID: 1168985320-28281-93807524397.BLASTQ4 Database: All GenBank+EMBL+DDBJ+PDB sequences (but no EST, STS, GSS,environmental samples or phase 0, 1 or 2 HTGS sequences) 4,758,117 sequences; 18,951,497,157 total letters Query= Length=936 Figure AII.10. Parameters from BLAST search with SPA1-62 sequence. Score E (Bits) Value gb|AY198391.1| Homo sapiens surfactant, pulmonary-associated ... 1481 0.0 gb|AC068139.6| Homo sapiens chromosome 10 clone RP11-506M13, com 1473 0.0 emb|BX248123.5| Human DNA sequence from clone RP11-589B3 on c... 1473 0.0 gb|M30838.1|HUMPSAP Human pulmonary surfactant apoprotein (PSAP) 1392 0.0 gb|AY206682.1| Homo sapiens surfactant, pulmonary-associated ... 1362 0.0 gb|M68519.1|HUMSFTP1A Human pulmonary surfactant-associated p... 1310 0.0 ref|XM_001133039.1| PREDICTED: Homo sapiens similar to Pulmon... 1033 0.0 ref|XM_934590.2| PREDICTED: Homo sapiens similar to surfactan... 1009 0.0 gb|S69679.1| SP-A2=surfactant protein {5' region} [human, Genomi 775 0.0 ref|XM_934600.2| PREDICTED: Homo sapiens similar to surfactan... 387 1e-104 Figure AII.11. First ten sequences producing significant alignments with SPA1-62.

Appendix II: Sequencing Results 149
Length=24037, Score = 1481 bits (747), Expect = 0.0 Identities = 896/921 (97%), Gaps = 20/921 (2%), Strand=Plus/Plus Query 1 CTGGGAGGGACAGG-CAGGTTT-CTGCAGAGCACGGAAGATTCAGCTGAAGTCAGAGAGG 58 |||||||||||||| ||||||| ||||||||||||||||||||||||||||||||||||| Sbjct 10788 CTGGGAGGGACAGGGCAGGTTTTCTGCAGAGCACGGAAGATTCAGCTGAAGTCAGAGAGG 10847 Query 59 TGAAGCCAGTTTCCCAGTGTAACATAGTGAGGCACTGAAAGAAAGGGAGACTGCACTGGA 118 ||||||||||||||||| |||||||||||||||||||||||||||| ||||||||||||| Sbjct 10848 TGAAGCCAGTTTCCCAGGGTAACATAGTGAGGCACTGAAAGAAAGG-AGACTGCACTGGA 10906 Query 119 GCCCAGGTCCCCGGGCTCCCCAGAGCTCCTTACTCTTCCTCCTCCTCAGCAGCCTGGAGA 178 |||||||||||||||||||||||||||||||||||||||||||||||||||||||||||| Sbjct 10907 GCCCAGGTCCCCGGGCTCCCCAGAGCTCCTTACTCTTCCTCCTCCTCAGCAGCCTGGAGA 10966 Query 179 CCCCACAACCTCCAGCCGGAGGCCTGAAGCATGAGGCCATGCCAGGTGCCAGGTGATGCT 238 |||||||||||||||||||||||||||||||||||||||||||||||||||||||||||| Sbjct 10967 CCCCACAACCTCCAGCCGGAGGCCTGAAGCATGAGGCCATGCCAGGTGCCAGGTGATGCT 11026 Query 239 GGGAATTTTCCCGGGAGCTTCGGGTCTTCCCAGCACTCTGGTCTCGCCCGCCCTGCCTCT 298 |||||||||||||||||||||||||||||||||||||||||||||||||||||||||||| Sbjct 11027 GGGAATTTTCCCGGGAGCTTCGGGTCTTCCCAGCACTCTGGTCTCGCCCGCCCTGCCTCT 11086 Query 299 CGGGCTCTGCCCAGCTTCCTGAGTCCTGACAGAGCACAGTGGGGGAGATGTTGGCAGAGG 358 |||||||||||||||||||||||||||||||||||||||||||||||||||||||||||| Sbjct 11087 CGGGCTCTGCCCAGCTTCCTGAGTCCTGACAGAGCACAGTGGGGGAGATGTTGGCAGAGG 11146 Query 359 TGGCAGATGGGCTCACGGCCATCCCTCCTGCAGGAGCAGCGACTGGACCCAGAGCCATGT 418 |||||||||||||||||||||||||||||||||||||||||||||||||||||||||||| Sbjct 11147 TGGCAGATGGGCTCACGGCCATCCCTCCTGCAGGAGCAGCGACTGGACCCAGAGCCATGT 11206 Query 419 GGCTGTGCCCTCTGGCCCTCAACCTCATCTTGATGGCAGCCTCTGGTGCTGTGTGCGAAG 478 |||||||||||||||||||||||||||||||||||||||||||||||||||||||||||| Sbjct 11207 GGCTGTGCCCTCTGGCCCTCAACCTCATCTTGATGGCAGCCTCTGGTGCTGTGTGCGAAG 11266 Query 479 TGAAGGACGTTTGTGTTGGAAGCCCTGGTATCCCCGGCACTCCTGGATCCCACGGCCTGC 538 |||||||||||||||||||||||||||||||||||||||||||||||||||||||||||| Sbjct 11267 TGAAGGACGTTTGTGTTGGAAGCCCTGGTATCCCCGGCACTCCTGGATCCCACGGCCTGC 11326 Query 539 CAGGCAGGGACGGGAGAGATGGTGTCAAAGGAGACCCTGGCCCTCCAGGTACTGTGCTGC 598 |||||||||||||||||||||||||||||||||||||||||||||||||||||||||||| Sbjct 11327 CAGGCAGGGACGGGAGAGATGGTGTCAAAGGAGACCCTGGCCCTCCAGGTACTGTGCTGC 11386 Query 599 AGACCCCACCCTCAGCTGAGGGACACAGACCCCTTTTCAGGAGGCCCATCTGTCCAGGCC 658 |||||||||||||||||||||||||||||||||||||||||||||||||||||||||||| Sbjct 11387 AGACCCCACCCTCAGCTGAGGGACACAGACCCCTTTTCAGGAGGCCCATCTGTCCAGGCC 11446 Query 659 CCTAGGCTGTGGGCCATAGTGAGCTGGGGGCTATAGTAAGCTGGGTGGGACTTCAGTCTG 718 |||||||||||||||||||||||||||||||||||||||||||||||||||||||||||| Sbjct 11447 CCTAGGCTGTGGGCCATAGTGAGCTGGGGGCTATAGTAAGCTGGGTGGGACTTCAGTCTG 11506 Query 719 CAGGGCTGGTGGGTTCCTGGGGCCCCTTATGATGGGCGCATTCCTGGGAGAGTCTTGTCC 778 |||||||||||||||||||||| |||||||||| |||||| |||| |||||||| ||||| Sbjct 11507 CAGGGCTGGTGGGTTCCTGGGG-CCCTTATGAT-GGCGCA-TCCT-GGAGAGTC-TGTCC 11561 Query 779 TCATAGTGCCCCACGGACGTGATACGAGTGATTAGCTGAGCCAG-CCTGGTGATTACTGG 837 |||||||| |||||||| |||||| |||||| |||||||||||| |||||||| || ||| Sbjct 11562 TCATAGTG-CCCACGGA-GTGATA-GAGTGA-TAGCTGAGCCAGCCCTGGTGA-TAATGG 11616 Query 838 GCATCGGAAGTCTCACTAGGCTCCAACCAGTTNTGGGTGACAGATCTTAC-CATCCCTGT 896 |||||| |||||||||| ||||||||||||| ||||||||||||| ||| ||||| || Sbjct 11617 GCATCG--AGTCTCACTA-GCTCCAACCAGTTGTGGGTGACAGATCCTACACATCCATG- 11672 Query 897 TCTCTTTTCTCCTGCAGGCCC 917 |||||||||| |||||||||| Sbjct 11673 TCTCTTTTCT-CTGCAGGCCC 11692 Figure AII.12. Alignment of Query sequence with: gb|AY198391.1| Homo sapiens surfactant, pulmonary-associated protein A1 (SFTPA1) gene, complete cds.

Appendix II: Sequencing Results 150
AII.4 SPA1-133 GGNAGAGAAAGGNNTTCTCCAGCAATGGGCAGTCCATCACTTTTGATGCC ATTCAGGAGGCATGTGCCAGAGCAGGCGGCCGCATTGCTGTCCCAAGGAA TCCAGAGGGAAAATGAGGCCATTGCAAGCTTCGTGAAGAAGTACAACACA TATGCCTATGTAGGCCTGACTGAGGGTCCCAGCCCTGGAGACTTCCGCTA CTCAGACGGGACCCCTGTAAACTACACCAACTGGTACCGAGGGGAGCCCG CAGGTCGGGGAAAAGAGCAGTGTGTGGAGATGTACACAGATGGGCAGTGG AATGACAGGAACTGCCTGTACTCCCGACTGACCATCTGTGAGTTCTGAGA GGCATTTAGGCCATGGGACAGGGAGGACGCTCTCTGGCCTTCGGCCTCCA TCCTGAGGCTCCACTTGGTCTGTGAGATGCTAGAACTCCCTTTCAACAGA ATTCACTTGTGGCTATTGGGACTGGAGGCACCCTTAGCCACTTCATTCCT CTGATGGGCCCTGACTCTTCCCCATAATCACTGACCAGCCTTGACACTCC CCTTGCAAACTCTCCCAGCACTGCACCCCAGGCAGCCACTCTTAGCCTTG GCCTTCGACATGAGATGGAGCCCTCCTTATTCCCCATCTGGTCCAGTTCC TTCACTTACAGATGGCAGCAGTGAGGTCTTGGGGTAGAAGGACCCTCCAA AGTCACACAAAGTGCCTGCTCCTGGTCCCTCAGCTCTGCCTCTGCAGCCC AACTGCCTTGNCCCAGTGCCATCAGGATTGAGGCAGGTCCCGGGGCCCAA GGCATAATTGGACCGAAGAAGAAGGCAGACCTTCGGGGGAAAGGCCCAGA CTGTGCAGAGCTAAAGGACACCAGTGGANAATTCTCTGGGCACTCTGAGG TCNCTCTGTGGCAGGCCTGGTC Figure AII.13. Sequence of PCR product amplified for SPA1-133. The PCR product length was expected to be 937 bp but sequencing reported 922 bp. BLASTN 2.2.15 [Oct-15-2006] Reference: Altschul, Stephen F., Thomas L. Madden, Alejandro A. Schäffer, Jinghui Zhang, Zheng Zhang, Webb Miller, and David J. Lipman (1997), "Gapped BLAST and PSI-BLAST: a new generation of protein database search programs", Nucleic Acids Res. 25:3389-3402. RID: 1168986954-30312-83801407081.BLASTQ1 Database: All GenBank+EMBL+DDBJ+PDB sequences (but no EST, STS, GSS,environmental samples or phase 0, 1 or 2 HTGS sequences) 4,758,117 sequences; 18,951,497,157 total letters Query= Length=922 Figure AII.14. Parameters from BLAST search with SPA1-133 sequence. Score E (Bits) Value gb|AY198391.1| Homo sapiens surfactant, pulmonary-associated ... 1427 0.0 ref|XM_001133073.1| PREDICTED: Homo sapiens similar to surfac... 1394 0.0 ref|XM_934596.2| PREDICTED: Homo sapiens similar to surfactan... 1394 0.0 ref|XM_934598.2| PREDICTED: Homo sapiens similar to surfactan... 1394 0.0 ref|XM_934590.2| PREDICTED: Homo sapiens similar to surfactan... 1394 0.0 ref|XM_934600.2| PREDICTED: Homo sapiens similar to surfactan... 1394 0.0 gb|AC068139.6| Homo sapiens chromosome 10 clone RP11-506M13, com 1394 0.0 emb|BX248123.5| Human DNA sequence from clone RP11-589B3 on c... 1394 0.0 gb|M30838.1|HUMPSAP Human pulmonary surfactant apoprotein (PSAP) 1308 0.0 ref|XM_001133054.1| PREDICTED: Homo sapiens similar to Pulmon... 1237 0.0 Figure AII.15. First ten sequences producing significant alignments with SPA1-133.

Appendix II: Sequencing Results 151
Length=24037, Score = 1427 bits (720), Expect = 0.0 Identities = 759/766 (99%), Gaps = 6/766 (0%), Strand=Plus/Plus Query 15 TTCTCCAGCAATGGGCAGTCCATCACTTTTGATGCCATTCAGGAGGCATGTGCCAGAGCA 74 |||||||||||||||||||||||||||||||||||||||||||||||||||||||||||| Sbjct 13158 TTCTCCAGCAATGGGCAGTCCATCACTTTTGATGCCATTCAGGAGGCATGTGCCAGAGCA 13217 Query 75 GGCGGCCGCATTGCTGTCCCAAGGAATCCAGAGGGAAAATGAGGCCATTGCAAGCTTCGT 134 |||||||||||||||||||||||||||||||||| ||||||||||||||||||||||||| Sbjct 13218 GGCGGCCGCATTGCTGTCCCAAGGAATCCAGAGG-AAAATGAGGCCATTGCAAGCTTCGT 13276 Query 135 GAAGAAGTACAACACATATGCCTATGTAGGCCTGACTGAGGGTCCCAGCCCTGGAGACTT 194 |||||||||||||||||||||||||||||||||||||||||||||||||||||||||||| Sbjct 13277 GAAGAAGTACAACACATATGCCTATGTAGGCCTGACTGAGGGTCCCAGCCCTGGAGACTT 13336 Query 195 CCGCTACTCAGACGGGACCCCTGTAAACTACACCAACTGGTACCGAGGGGAGCCCGCAGG 254 |||||||||||||||||||||||||||||||||||||||||||||||||||||||||||| Sbjct 13337 CCGCTACTCAGACGGGACCCCTGTAAACTACACCAACTGGTACCGAGGGGAGCCCGCAGG 13396 Query 255 TCGGGGAAAAGAGCAGTGTGTGGAGATGTACACAGATGGGCAGTGGAATGACAGGAACTG 314 |||||||||||||||||||||||||||||||||||||||||||||||||||||||||||| Sbjct 13397 TCGGGGAAAAGAGCAGTGTGTGGAGATGTACACAGATGGGCAGTGGAATGACAGGAACTG 13456 Query 315 CCTGTACTCCCGACTGACCATCTGTGAGTTCTGAGAGGCATTTAGGCCATGGGACAGGGA 374 |||||||||||||||||||||||||||||||||||||||||||||||||||||||||||| Sbjct 13457 CCTGTACTCCCGACTGACCATCTGTGAGTTCTGAGAGGCATTTAGGCCATGGGACAGGGA 13516 Query 375 GGACGCTCTCTGGCCTTCGGCCTCCATCCTGAGGCTCCACTTGGTCTGTGAGATGCTAGA 434 |||||||||||||||||||||||||||||||||||||||||||||||||||||||||||| Sbjct 13517 GGACGCTCTCTGGCCTTCGGCCTCCATCCTGAGGCTCCACTTGGTCTGTGAGATGCTAGA 13576 Query 435 ACTCCCTTTCAACAGAATTCACTTGTGGCTATTGGGACTGGAGGCACCCTTAGCCACTTC 494 |||||||||||||||||||||||||||||||||||||||||||||||||||||||||||| Sbjct 13577 ACTCCCTTTCAACAGAATTCACTTGTGGCTATTGGGACTGGAGGCACCCTTAGCCACTTC 13636 Query 495 ATTCCTCTGATGGGCCCTGACTCTTCCCCATAATCACTGACCAGCCTTGACACTCCCCTT 554 |||||||||||||||||||||||||||||||||||||||||||||||||||||||||||| Sbjct 13637 ATTCCTCTGATGGGCCCTGACTCTTCCCCATAATCACTGACCAGCCTTGACACTCCCCTT 13696 Query 555 GCAAACTCTCCCAGCACTGCACCCCAGGCAGCCACTCTTAGCCTTGGCCTTCGACATGAG 614 |||||||||||||||||||||||||||||||||||||||||||||||||||||||||||| Sbjct 13697 GCAAACTCTCCCAGCACTGCACCCCAGGCAGCCACTCTTAGCCTTGGCCTTCGACATGAG 13756 Query 615 ATGGAGCCCTCCTTATTCCCCATCTGGTCCAGTTCCTTCACTTACAGATGGCAGCAGTGA 674 |||||||||||||||||||||||||||||||||||||||||||||||||||||||||||| Sbjct 13757 ATGGAGCCCTCCTTATTCCCCATCTGGTCCAGTTCCTTCACTTACAGATGGCAGCAGTGA 13816 Query 675 GGTCTTGGGGTAGAAGGACCCTCCAAAGTCACACAAAGTGCCTG-CTCCTGGT-CCCTCA 732 |||||||||||||||||||||||||||||||||||||||||||| |||||||| |||||| Sbjct 13817 GGTCTTGGGGTAGAAGGACCCTCCAAAGTCACACAAAGTGCCTGCCTCCTGGTCCCCTCA 13876 Query 733 GCTCTGCCTCTGCAGCCCAACTGCCTTGNCCCAGTGCCATCAGGAT 778 |||||||||||||||||| ||||||| ||||||||||||||||| Sbjct 13877 GCTCTGCCTCTGCAGCCC-ACTGCCT--GCCCAGTGCCATCAGGAT 13919 Score = 58.0 bits (29), Expect = 1e-05, Identities = 71/79 (89%), Gaps = 6/79 (7%), Strand=Plus/Plus Query 844 GCCCAGACTGTGCAGAGCTAAAGGACACCAGTGGANAATTCTCTGGGCACTCTGAGGTCN 903 |||| |||||||||||||||| |||||| |||||| | |||||||| |||||||||||| Sbjct 13969 GCCCTGACTGTGCAGAGCTAA-GGACAC-AGTGGAGA-TTCTCTGG-CACTCTGAGGTC- 14023 Query 904 CTCTGTGGCAGGCCTGGTC 922 |||||||||||||||||| Sbjct 14024 -TCTGTGGCAGGCCTGGTC 14041 Figure AII.16. Alignment of Query sequence with: gb|AY198391.1| Homo sapiens surfactant, pulmonary-associated protein A1 (SFTPA1) gene, complete cds.

Appendix II: Sequencing Results 152
AII.5 SPA1-219 TGCTTGCTTTCACTGAATCAGGCAATTGCATCATTTCTGGCAATAGTAAT TGTTACTTAGGTGAATGAATAAATGGAGGAGAGTCTAAAAGTGAATTTAG AAAACTGCAATTGGAAGAGGAAGAGAAGACACAGAGAGAGGCAGAGATGG AGAGACTGGGGAGAATCTGGTAGCAGAGACCCCAGGTGAGGGAGGTGGCT TAGAGACAAAGTGGTCAGTGGCCTGACCCGGACTCCTCTGCTCTCAGCCC TCAGTCTGCAGGGCTCCATAATGACAGTAGGAGAGAAGGTCTTCTCCAGC AATGGGCAGTCCATCACTTTTGATGCCATTCAGGAGGCATGTGCCAGAGC AGGCGGCCGCATTGCTGTCCCAAGGAATCCAGAGGAAAATGAGGCCATTG CAAGCTTCGTGAAGAAGTACAACACATATGCCTATGTAGGCCTGACTGAG GGTCCCAGCCCTGGAGACTTCCGCTACTCAGACGGGACCCCTGTAAACTA CACCAACTGGTACCGAGGGGAGCCCGCAGGTTG Figure AII.17. Sequence of PCR product amplified for SPA1-219. The PCR product length was expected to be 577 bp but sequencing reported 533 bp. BLASTN 2.2.15 [Oct-15-2006] Reference: Altschul, Stephen F., Thomas L. Madden, Alejandro A. Schäffer, Jinghui Zhang, Zheng Zhang, Webb Miller, and David J. Lipman (1997), "Gapped BLAST and PSI-BLAST: a new generation of protein database search programs", Nucleic Acids Res. 25:3389-3402. RID: 1168987122-9890-159767403929.BLASTQ1 Database: All GenBank+EMBL+DDBJ+PDB sequences (but no EST, STS, GSS,environmental samples or phase 0, 1 or 2 HTGS sequences) 4,758,117 sequences; 18,951,497,157 total letters Query= Length=533 Figure AII.18. Parameters from BLAST search with SPA1-219 sequence. Score E (Bits) Value gb|AC068139.6| Homo sapiens chromosome 10 clone RP11-506M13, com 987 0.0 emb|BX248123.5| Human DNA sequence from clone RP11-589B3 on c... 987 0.0 gb|AY198391.1| Homo sapiens surfactant, pulmonary-associated ... 987 0.0 gb|M30838.1|HUMPSAP Human pulmonary surfactant apoprotein (PSAP) 979 0.0 gb|AY206682.1| Homo sapiens surfactant, pulmonary-associated ... 948 0.0 gb|M68519.1|HUMSFTP1A Human pulmonary surfactant-associated p... 940 0.0 ref|XM_934592.2| PREDICTED: Homo sapiens similar to surfactan... 567 3e-159 ref|XM_001133073.1| PREDICTED: Homo sapiens similar to surfac... 567 3e-159 ref|XM_934596.2| PREDICTED: Homo sapiens similar to surfactan... 567 3e-159 ref|XM_934598.2| PREDICTED: Homo sapiens similar to surfactan... 567 3e-159 Figure AII.19. First ten sequences producing significant alignments with SPA1-219.

Appendix II: Sequencing Results 153
Length=24037 Score = 987 bits (498), Expect = 0.0 Identities = 511/514 (99%), Gaps = 1/514 (0%) Strand=Plus/Plus Query 19 CAGGCAATTGCATCATTTCTGGCAATA-GTAATTGTTACTTAGGTGAATGAATAAATGGA 77 |||| ||||||| |||||||||||||| |||||||||||||||||||||||||||||||| Sbjct 12884 CAGGAAATTGCACCATTTCTGGCAATAAGTAATTGTTACTTAGGTGAATGAATAAATGGA 12943 Query 78 GGAGAGTCTAAAAGTGAATTTAGAAAACTGCAATTGGAAGAGGAAGAGAAGACACAGAGA 137 |||||||||||||||||||||||||||||||||||||||||||||||||||||||||||| Sbjct 12944 GGAGAGTCTAAAAGTGAATTTAGAAAACTGCAATTGGAAGAGGAAGAGAAGACACAGAGA 13003 Query 138 GAGGCAGAGATGGAGAGACTGGGGAGAATCTGGTAGCAGAGACCCCAGGTGAGGGAGGTG 197 |||||||||||||||||||||||||||||||||||||||||||||||||||||||||||| Sbjct 13004 GAGGCAGAGATGGAGAGACTGGGGAGAATCTGGTAGCAGAGACCCCAGGTGAGGGAGGTG 13063 Query 198 GCTTAGAGACAAAGTGGTCAGTGGCCTGACCCGGACTCCTCTGCTCTCAGCCCTCAGTCT 257 |||||||||||||||||||||||||||||||||||||||||||||||||||||||||||| Sbjct 13064 GCTTAGAGACAAAGTGGTCAGTGGCCTGACCCGGACTCCTCTGCTCTCAGCCCTCAGTCT 13123 Query 258 GCAGGGCTCCATAATGACAGTAGGAGAGAAGGTCTTCTCCAGCAATGGGCAGTCCATCAC 317 |||||||||||||||||||||||||||||||||||||||||||||||||||||||||||| Sbjct 13124 GCAGGGCTCCATAATGACAGTAGGAGAGAAGGTCTTCTCCAGCAATGGGCAGTCCATCAC 13183 Query 318 TTTTGATGCCATTCAGGAGGCATGTGCCAGAGCAGGCGGCCGCATTGCTGTCCCAAGGAA 377 |||||||||||||||||||||||||||||||||||||||||||||||||||||||||||| Sbjct 13184 TTTTGATGCCATTCAGGAGGCATGTGCCAGAGCAGGCGGCCGCATTGCTGTCCCAAGGAA 13243 Query 378 TCCAGAGGAAAATGAGGCCATTGCAAGCTTCGTGAAGAAGTACAACACATATGCCTATGT 437 |||||||||||||||||||||||||||||||||||||||||||||||||||||||||||| Sbjct 13244 TCCAGAGGAAAATGAGGCCATTGCAAGCTTCGTGAAGAAGTACAACACATATGCCTATGT 13303 Query 438 AGGCCTGACTGAGGGTCCCAGCCCTGGAGACTTCCGCTACTCAGACGGGACCCCTGTAAA 497 |||||||||||||||||||||||||||||||||||||||||||||||||||||||||||| Sbjct 13304 AGGCCTGACTGAGGGTCCCAGCCCTGGAGACTTCCGCTACTCAGACGGGACCCCTGTAAA 13363 Query 498 CTACACCAACTGGTACCGAGGGGAGCCCGCAGGT 531 |||||||||||||||||||||||||||||||||| Sbjct 13364 CTACACCAACTGGTACCGAGGGGAGCCCGCAGGT 13397 Figure AII.20. Alignment of Query sequence with: gb|AY198391.1| Homo sapiens surfactant, pulmonary-associated protein A1 (SFTPA1) gene, complete cds.
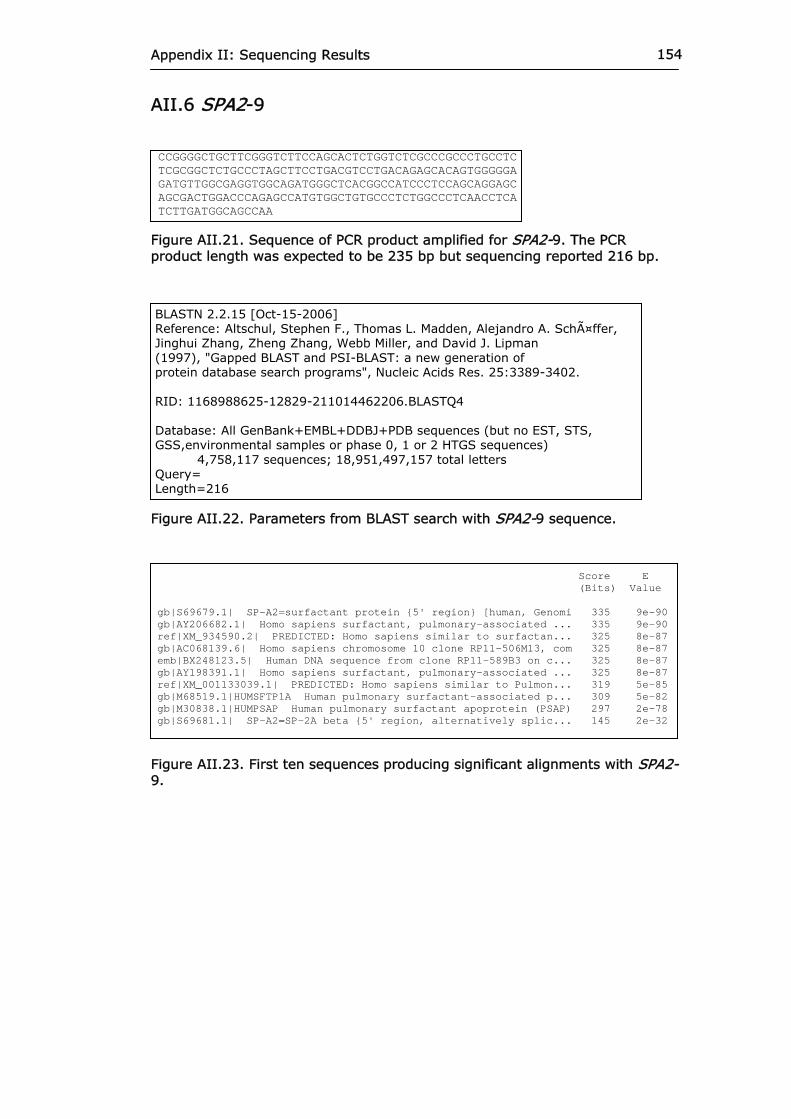
Appendix II: Sequencing Results 154
AII.6 SPA2-9 CCGGGGCTGCTTCGGGTCTTCCAGCACTCTGGTCTCGCCCGCCCTGCCTC TCGCGGCTCTGCCCTAGCTTCCTGACGTCCTGACAGAGCACAGTGGGGGA GATGTTGGCGAGGTGGCAGATGGGCTCACGGCCATCCCTCCAGCAGGAGC AGCGACTGGACCCAGAGCCATGTGGCTGTGCCCTCTGGCCCTCAACCTCA TCTTGATGGCAGCCAA Figure AII.21. Sequence of PCR product amplified for SPA2-9. The PCR product length was expected to be 235 bp but sequencing reported 216 bp. BLASTN 2.2.15 [Oct-15-2006] Reference: Altschul, Stephen F., Thomas L. Madden, Alejandro A. Schäffer, Jinghui Zhang, Zheng Zhang, Webb Miller, and David J. Lipman (1997), "Gapped BLAST and PSI-BLAST: a new generation of protein database search programs", Nucleic Acids Res. 25:3389-3402. RID: 1168988625-12829-211014462206.BLASTQ4 Database: All GenBank+EMBL+DDBJ+PDB sequences (but no EST, STS, GSS,environmental samples or phase 0, 1 or 2 HTGS sequences) 4,758,117 sequences; 18,951,497,157 total letters Query= Length=216 Figure AII.22. Parameters from BLAST search with SPA2-9 sequence. Score E (Bits) Value gb|S69679.1| SP-A2=surfactant protein {5' region} [human, Genomi 335 9e-90 gb|AY206682.1| Homo sapiens surfactant, pulmonary-associated ... 335 9e-90 ref|XM_934590.2| PREDICTED: Homo sapiens similar to surfactan... 325 8e-87 gb|AC068139.6| Homo sapiens chromosome 10 clone RP11-506M13, com 325 8e-87 emb|BX248123.5| Human DNA sequence from clone RP11-589B3 on c... 325 8e-87 gb|AY198391.1| Homo sapiens surfactant, pulmonary-associated ... 325 8e-87 ref|XM_001133039.1| PREDICTED: Homo sapiens similar to Pulmon... 319 5e-85 gb|M68519.1|HUMSFTP1A Human pulmonary surfactant-associated p... 309 5e-82 gb|M30838.1|HUMPSAP Human pulmonary surfactant apoprotein (PSAP) 297 2e-78 gb|S69681.1| SP-A2=SP-2A beta {5' region, alternatively splic... 145 2e-32 Figure AII.23. First ten sequences producing significant alignments with SPA2-9.

Appendix II: Sequencing Results 155
Length=18039 Score = 335 bits (169), Expect = 9e-90 Identities = 204/209 (97%), Gaps = 5/209 (2%) Strand=Plus/Plus Query 8 TGCTTCGGGTCTTCC-AGCACTCTGGTCTCGCCCGCCCTGCCTCTCGCGGCTCTGCCCTA 66 ||||||||||||||| ||||||||||||||||||||||||||||||| |||||||||| | Sbjct 12856 TGCTTCGGGTCTTCCCAGCACTCTGGTCTCGCCCGCCCTGCCTCTCG-GGCTCTGCCC-A 12913 Query 67 GCTTCCTGACGTCCTGACAGAGCACAGTGGGGGAGATGTTGGC-GAGGTGGCAGATGGGC 125 ||||||||| ||||||||||||||||||||||||||||||||| |||||||||||||||| Sbjct 12914 GCTTCCTGA-GTCCTGACAGAGCACAGTGGGGGAGATGTTGGCAGAGGTGGCAGATGGGC 12972 Query 126 TCACGGCCATCCCTCCAGCAGGAGCAGCGACTGGACCCAGAGCCATGTGGCTGTGCCCTC 185 |||||||||||||||||||||||||||||||||||||||||||||||||||||||||||| Sbjct 12973 TCACGGCCATCCCTCCAGCAGGAGCAGCGACTGGACCCAGAGCCATGTGGCTGTGCCCTC 13032 Query 186 TGGCCCTCAACCTCATCTTGATGGCAGCC 214 ||||||||||||||||||||||||||||| Sbjct 13033 TGGCCCTCAACCTCATCTTGATGGCAGCC 13061 Figure AII.24. Alignment of Query sequence with: gb|AY206682.1| Homo sapiens surfactant, pulmonary-associated protein A2 (SFTPA2) gene, complete cds.

Appendix II: Sequencing Results 156
AII.7 SPA2-91 GGGCTCGTCTGCTCACCTTCAGACTGCCCCCNGGGGCCTCCATCCCAGGA CATGCCTCCCCTGCCTCCCAGTGCTGTCCCTCGTCCCACACCTGACTCAG TGTGTTCCCCATCAGCGGTCATGAGGCACGGAGGACTTCCCACACCTGCC CTTCTCTGAATTGTGACCACACTCCCCAGACACCTCGGCTTTCTCCCTCA AATTCATATTCTCTTACTTAGGTTGAGCCAAATGCCCTTGGGGTACCTGC AGGGTTTGTCTGATCCCCATCACCCCTGTGTAACTGACTTCAGGTCGCTG TGCCCATGTTTCCACTGCCTACCTGCCCCGCCCTGCTCACCTGGAGGGCC TCTCTCGCCAGGCTCCCCCTTCTCTTCCAA Figure AII.25. Sequence of PCR product amplified for SPA2-91. The PCR product length was expected to be 400 bp but sequencing reported 380 bp. BLASTN 2.2.15 [Oct-15-2006] Reference: Altschul, Stephen F., Thomas L. Madden, Alejandro A. Schäffer, Jinghui Zhang, Zheng Zhang, Webb Miller, and David J. Lipman (1997), "Gapped BLAST and PSI-BLAST: a new generation of protein database search programs", Nucleic Acids Res. 25:3389-3402. RID: 1168988950-1227-49382262643.BLASTQ1 Database: All GenBank+EMBL+DDBJ+PDB sequences (but no EST, STS, GSS,environmental samples or phase 0, 1 or 2 HTGS sequences) 4,758,117 sequences; 18,951,497,157 total letters Query= Length=380 Figure AII.26. Parameters from BLAST search with SPA2-91 sequence. Score E (Bits) Value gb|AC068139.6| Homo sapiens chromosome 10 clone RP11-506M13, com 644 0.0 emb|BX248123.5| Human DNA sequence from clone RP11-589B3 on c... 644 0.0 gb|AY206682.1| Homo sapiens surfactant, pulmonary-associated ... 638 0.0 gb|M68519.1|HUMSFTP1A Human pulmonary surfactant-associated p... 622 5e-176 gb|AY198391.1| Homo sapiens surfactant, pulmonary-associated ... 511 1e-142 gb|M30838.1|HUMPSAP Human pulmonary surfactant apoprotein (PSAP) 498 2e-138 dbj|AK225599.1| Homo sapiens mRNA for Pulmonary surfactant-as... 71.9 4e-10 gb|K03475.1|HUMPSPB Human pulmonary surfactant-associated pro... 71.9 4e-10 ref|XM_934592.2| PREDICTED: Homo sapiens similar to surfactan... 63.9 9e-08 ref|XM_001133073.1| PREDICTED: Homo sapiens similar to surfac... 63.9 9e-08 Figure AII.27. First ten sequences producing significant alignments with SPA2-91.
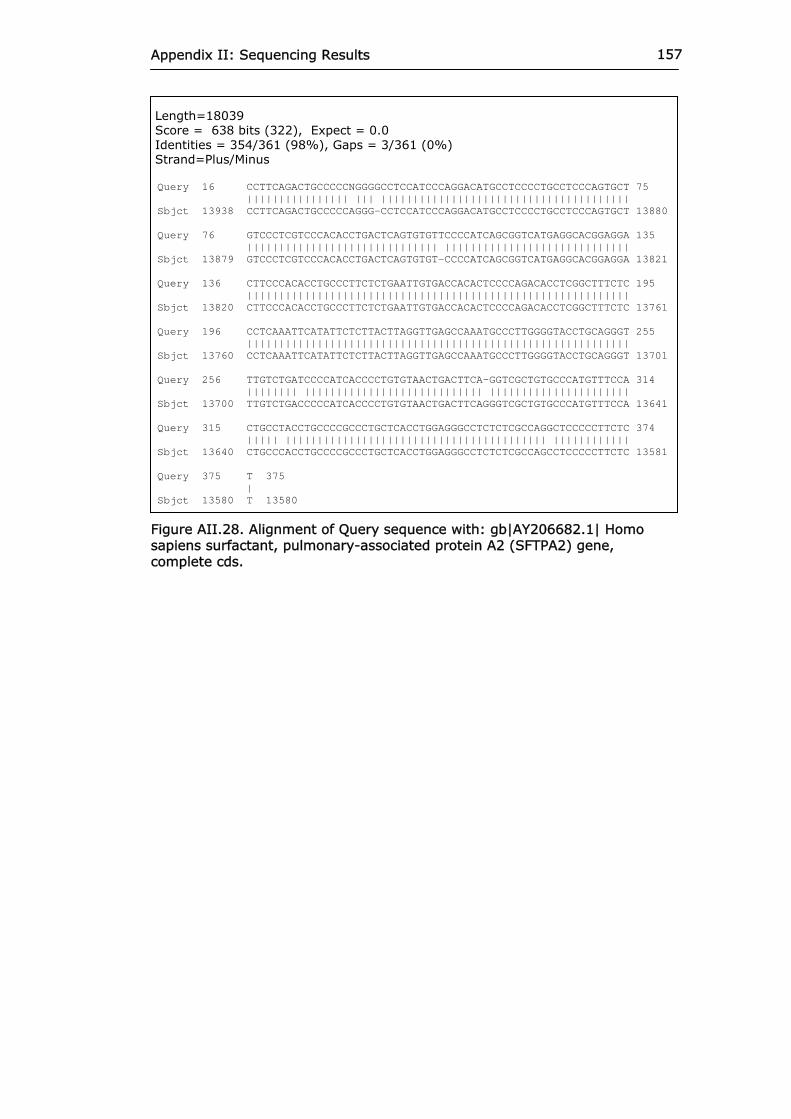
Appendix II: Sequencing Results 157
Length=18039 Score = 638 bits (322), Expect = 0.0 Identities = 354/361 (98%), Gaps = 3/361 (0%) Strand=Plus/Minus Query 16 CCTTCAGACTGCCCCCNGGGGCCTCCATCCCAGGACATGCCTCCCCTGCCTCCCAGTGCT 75 |||||||||||||||| ||| ||||||||||||||||||||||||||||||||||||||| Sbjct 13938 CCTTCAGACTGCCCCCAGGG-CCTCCATCCCAGGACATGCCTCCCCTGCCTCCCAGTGCT 13880 Query 76 GTCCCTCGTCCCACACCTGACTCAGTGTGTTCCCCATCAGCGGTCATGAGGCACGGAGGA 135 |||||||||||||||||||||||||||||| ||||||||||||||||||||||||||||| Sbjct 13879 GTCCCTCGTCCCACACCTGACTCAGTGTGT-CCCCATCAGCGGTCATGAGGCACGGAGGA 13821 Query 136 CTTCCCACACCTGCCCTTCTCTGAATTGTGACCACACTCCCCAGACACCTCGGCTTTCTC 195 |||||||||||||||||||||||||||||||||||||||||||||||||||||||||||| Sbjct 13820 CTTCCCACACCTGCCCTTCTCTGAATTGTGACCACACTCCCCAGACACCTCGGCTTTCTC 13761 Query 196 CCTCAAATTCATATTCTCTTACTTAGGTTGAGCCAAATGCCCTTGGGGTACCTGCAGGGT 255 |||||||||||||||||||||||||||||||||||||||||||||||||||||||||||| Sbjct 13760 CCTCAAATTCATATTCTCTTACTTAGGTTGAGCCAAATGCCCTTGGGGTACCTGCAGGGT 13701 Query 256 TTGTCTGATCCCCATCACCCCTGTGTAACTGACTTCA-GGTCGCTGTGCCCATGTTTCCA 314 |||||||| |||||||||||||||||||||||||||| |||||||||||||||||||||| Sbjct 13700 TTGTCTGACCCCCATCACCCCTGTGTAACTGACTTCAGGGTCGCTGTGCCCATGTTTCCA 13641 Query 315 CTGCCTACCTGCCCCGCCCTGCTCACCTGGAGGGCCTCTCTCGCCAGGCTCCCCCTTCTC 374 ||||| ||||||||||||||||||||||||||||||||||||||||| |||||||||||| Sbjct 13640 CTGCCCACCTGCCCCGCCCTGCTCACCTGGAGGGCCTCTCTCGCCAGCCTCCCCCTTCTC 13581 Query 375 T 375 | Sbjct 13580 T 13580 Figure AII.28. Alignment of Query sequence with: gb|AY206682.1| Homo sapiens surfactant, pulmonary-associated protein A2 (SFTPA2) gene, complete cds.
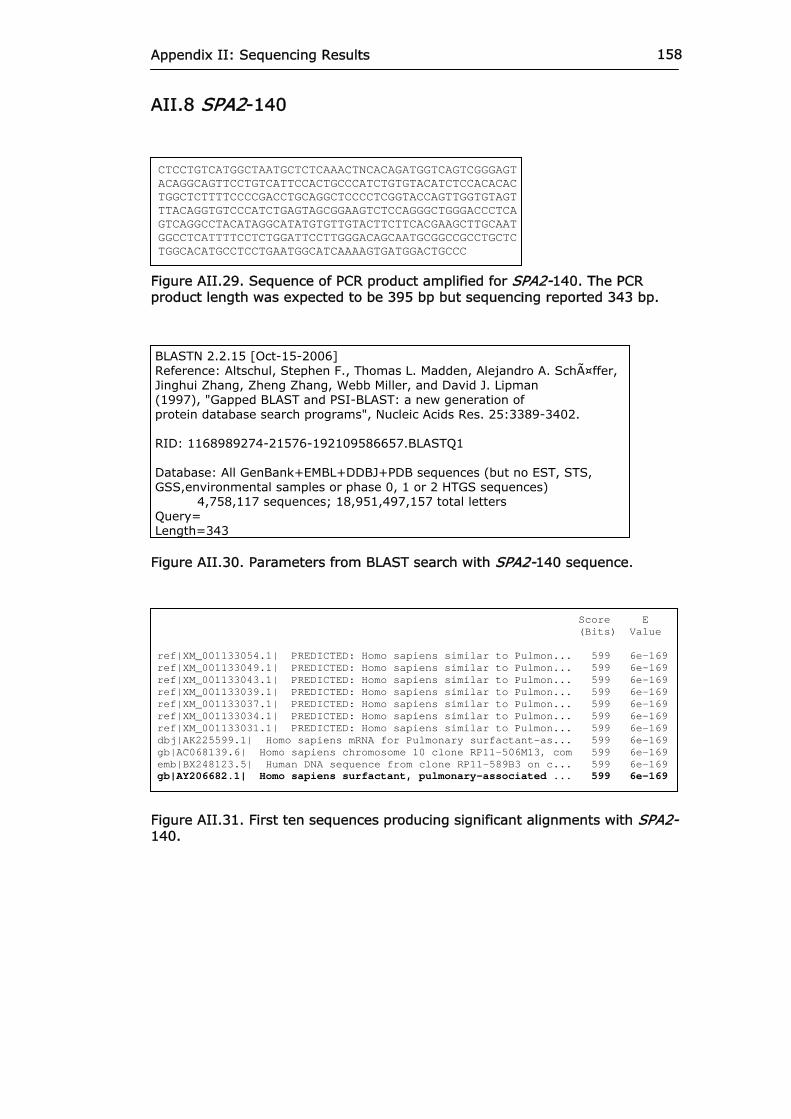
Appendix II: Sequencing Results 158
AII.8 SPA2-140 CTCCTGTCATGGCTAATGCTCTCAAACTNCACAGATGGTCAGTCGGGAGT ACAGGCAGTTCCTGTCATTCCACTGCCCATCTGTGTACATCTCCACACAC TGGCTCTTTTCCCCGACCTGCAGGCTCCCCTCGGTACCAGTTGGTGTAGT TTACAGGTGTCCCATCTGAGTAGCGGAAGTCTCCAGGGCTGGGACCCTCA GTCAGGCCTACATAGGCATATGTGTTGTACTTCTTCACGAAGCTTGCAAT GGCCTCATTTTCCTCTGGATTCCTTGGGACAGCAATGCGGCCGCCTGCTC TGGCACATGCCTCCTGAATGGCATCAAAAGTGATGGACTGCCC Figure AII.29. Sequence of PCR product amplified for SPA2-140. The PCR product length was expected to be 395 bp but sequencing reported 343 bp. BLASTN 2.2.15 [Oct-15-2006] Reference: Altschul, Stephen F., Thomas L. Madden, Alejandro A. Schäffer, Jinghui Zhang, Zheng Zhang, Webb Miller, and David J. Lipman (1997), "Gapped BLAST and PSI-BLAST: a new generation of protein database search programs", Nucleic Acids Res. 25:3389-3402. RID: 1168989274-21576-192109586657.BLASTQ1 Database: All GenBank+EMBL+DDBJ+PDB sequences (but no EST, STS, GSS,environmental samples or phase 0, 1 or 2 HTGS sequences) 4,758,117 sequences; 18,951,497,157 total letters Query= Length=343 Figure AII.30. Parameters from BLAST search with SPA2-140 sequence. Score E (Bits) Value ref|XM_001133054.1| PREDICTED: Homo sapiens similar to Pulmon... 599 6e-169 ref|XM_001133049.1| PREDICTED: Homo sapiens similar to Pulmon... 599 6e-169 ref|XM_001133043.1| PREDICTED: Homo sapiens similar to Pulmon... 599 6e-169 ref|XM_001133039.1| PREDICTED: Homo sapiens similar to Pulmon... 599 6e-169 ref|XM_001133037.1| PREDICTED: Homo sapiens similar to Pulmon... 599 6e-169 ref|XM_001133034.1| PREDICTED: Homo sapiens similar to Pulmon... 599 6e-169 ref|XM_001133031.1| PREDICTED: Homo sapiens similar to Pulmon... 599 6e-169 dbj|AK225599.1| Homo sapiens mRNA for Pulmonary surfactant-as... 599 6e-169 gb|AC068139.6| Homo sapiens chromosome 10 clone RP11-506M13, com 599 6e-169 emb|BX248123.5| Human DNA sequence from clone RP11-589B3 on c... 599 6e-169 gb|AY206682.1| Homo sapiens surfactant, pulmonary-associated ... 599 6e-169 Figure AII.31. First ten sequences producing significant alignments with SPA2-140.

Appendix II: Sequencing Results 159
Length=18039 Score = 599 bits (302), Expect = 6e-169 Identities = 312/314 (99%), Gaps = 1/314 (0%) Strand=Plus/Minus Query 30 CACAGATGGTCAGTCGGGAGTACAGGCAGTTCCTGTCATTCCACTGCCCATCTGTGTACA 89 |||||||||||||||||||||||||||||||||||||||||||||||||||||||||||| Sbjct 15284 CACAGATGGTCAGTCGGGAGTACAGGCAGTTCCTGTCATTCCACTGCCCATCTGTGTACA 15225 Query 90 TCTCCACACACTGGCTCTTTTCCCCGACCTGCAGGCTCCCCTCGGTACCAGTTGGTGTAG 149 ||||||||||||| |||||||||||||||||||||||||||||||||||||||||||||| Sbjct 15224 TCTCCACACACTG-CTCTTTTCCCCGACCTGCAGGCTCCCCTCGGTACCAGTTGGTGTAG 15166 Query 150 TTTACAGGTGTCCCATCTGAGTAGCGGAAGTCTCCAGGGCTGGGACCCTCAGTCAGGCCT 209 |||||||| ||||||||||||||||||||||||||||||||||||||||||||||||||| Sbjct 15165 TTTACAGGGGTCCCATCTGAGTAGCGGAAGTCTCCAGGGCTGGGACCCTCAGTCAGGCCT 15106 Query 210 ACATAGGCATATGTGTTGTACTTCTTCACGAAGCTTGCAATGGCCTCATTTTCCTCTGGA 269 |||||||||||||||||||||||||||||||||||||||||||||||||||||||||||| Sbjct 15105 ACATAGGCATATGTGTTGTACTTCTTCACGAAGCTTGCAATGGCCTCATTTTCCTCTGGA 15046 Query 270 TTCCTTGGGACAGCAATGCGGCCGCCTGCTCTGGCACATGCCTCCTGAATGGCATCAAAA 329 |||||||||||||||||||||||||||||||||||||||||||||||||||||||||||| Sbjct 15045 TTCCTTGGGACAGCAATGCGGCCGCCTGCTCTGGCACATGCCTCCTGAATGGCATCAAAA 14986 Query 330 GTGATGGACTGCCC 343 |||||||||||||| Sbjct 14985 GTGATGGACTGCCC 14972 Figure AII.32. Alignment of Query sequence with: gb|AY206682.1| Homo sapiens surfactant, pulmonary-associated protein A2 (SFTPA2) gene, complete cds.

Appendix II: Sequencing Results 160
AII.9 SPA2-223 CTCTTGCTTTCACTGAATCCTAGTGGACCTTGCACCNTTTCTGGCAACTA AGTAATTAGTTCACTTAGCATAATGAATAAATGGAGGATGAGTCTAAACA GTGAAGTNTAGAACAATCTGCNACTTGGCACACGAGGAATGAGAATGACA CATGCAGAAGAGGCACGAGAATGGTTGTAGCACTGGTGAGAAGAATCTGG TAGCAGAGTACCCTAGGCTGAGGGAGGTGGCTTAGAGACAACAGTGGTCA GTGGCCTGACCTGGACTCCTCTGCTCTCAGCCCTCAGTCTGCAGGGCTCC ATAATGACAGTAGGAGAGAAGGTCTTCTCCAGCAATGGGCAGTCCATCAC TTTTGATGCCATTCAGGAGGCATGTGCCAGAGCAGGCGGCCGCATTGCTG TCCCAATGGAATCCAGAGGAAAATGAGGCCATTGCAAGCTTCGTGAAGAA GTACAACACATATGCCTATGTAGGCCTGACTGAGGGTCCCAGCCCTGGAG ACTTCCGCTACTCAGATGGGACCCCTGTAAACTACACCAACTGGTACCGA GGGGAGCCTGCAGGTCGGGGAAAAGAGCAGTGTGTGGAGATGTTAAGGGG Figure AII.33. Sequence of PCR product amplified for SPA2-223. The PCR product length was expected to be 588 bp but sequencing reported 600 bp. BLASTN 2.2.15 [Oct-15-2006] Reference: Altschul, Stephen F., Thomas L. Madden, Alejandro A. Schäffer, Jinghui Zhang, Zheng Zhang, Webb Miller, and David J. Lipman (1997), "Gapped BLAST and PSI-BLAST: a new generation of protein database search programs", Nucleic Acids Res. 25:3389-3402. RID: 1168989483-26420-86004695366.BLASTQ4 Database: All GenBank+EMBL+DDBJ+PDB sequences (but no EST, STS, GSS,environmental samples or phase 0, 1 or 2 HTGS sequences) 4,758,117 sequences; 18,951,497,157 total letters Query= Length=600 Figure AII.34. Parameters from BLAST search with SPA2-223 sequence. Score E (Bits) Value gb|AC068139.6| Homo sapiens chromosome 10 clone RP11-506M13, com 733 0.0 emb|BX248123.5| Human DNA sequence from clone RP11-589B3 on c... 733 0.0 gb|AY206682.1| Homo sapiens surfactant, pulmonary-associated ... 733 0.0 gb|M68519.1|HUMSFTP1A Human pulmonary surfactant-associated p... 728 0.0 gb|AY198391.1| Homo sapiens surfactant, pulmonary-associated ... 702 0.0 gb|M30838.1|HUMPSAP Human pulmonary surfactant apoprotein (PSAP) 694 0.0 ref|XM_001133054.1| PREDICTED: Homo sapiens similar to Pulmon... 609 1e-171 ref|XM_001133049.1| PREDICTED: Homo sapiens similar to Pulmon... 609 1e-171 ref|XM_001133043.1| PREDICTED: Homo sapiens similar to Pulmon... 609 1e-171 ref|XM_001133039.1| PREDICTED: Homo sapiens similar to Pulmon... 609 1e-171 Figure AII.35. First ten sequences producing significant alignments with SPA2-223.

Appendix II: Sequencing Results 161
Length=18039 Score = 733 bits (370), Expect = 0.0 Identities = 398/402 (99%), Gaps = 4/402 (0%) Strand=Plus/Plus Query 192 AGAATCTGGTAGCAGAGTACCCTAGGCTGAGGGAGGTGGCTTAGAGACAACAGTGGTCAG 251 ||||||||||||||||| |||||||| ||||||||||||||||||||||| ||||||||| Sbjct 14830 AGAATCTGGTAGCAGAG-ACCCTAGG-TGAGGGAGGTGGCTTAGAGACAA-AGTGGTCAG 14886 Query 252 TGGCCTGACCTGGACTCCTCTGCTCTCAGCCCTCAGTCTGCAGGGCTCCATAATGACAGT 311 |||||||||||||||||||||||||||||||||||||||||||||||||||||||||||| Sbjct 14887 TGGCCTGACCTGGACTCCTCTGCTCTCAGCCCTCAGTCTGCAGGGCTCCATAATGACAGT 14946 Query 312 AGGAGAGAAGGTCTTCTCCAGCAATGGGCAGTCCATCACTTTTGATGCCATTCAGGAGGC 371 |||||||||||||||||||||||||||||||||||||||||||||||||||||||||||| Sbjct 14947 AGGAGAGAAGGTCTTCTCCAGCAATGGGCAGTCCATCACTTTTGATGCCATTCAGGAGGC 15006 Query 372 ATGTGCCAGAGCAGGCGGCCGCATTGCTGTCCCAATGGAATCCAGAGGAAAATGAGGCCA 431 ||||||||||||||||||||||||||||||||||| |||||||||||||||||||||||| Sbjct 15007 ATGTGCCAGAGCAGGCGGCCGCATTGCTGTCCCAA-GGAATCCAGAGGAAAATGAGGCCA 15065 Query 432 TTGCAAGCTTCGTGAAGAAGTACAACACATATGCCTATGTAGGCCTGACTGAGGGTCCCA 491 |||||||||||||||||||||||||||||||||||||||||||||||||||||||||||| Sbjct 15066 TTGCAAGCTTCGTGAAGAAGTACAACACATATGCCTATGTAGGCCTGACTGAGGGTCCCA 15125 Query 492 GCCCTGGAGACTTCCGCTACTCAGATGGGACCCCTGTAAACTACACCAACTGGTACCGAG 551 |||||||||||||||||||||||||||||||||||||||||||||||||||||||||||| Sbjct 15126 GCCCTGGAGACTTCCGCTACTCAGATGGGACCCCTGTAAACTACACCAACTGGTACCGAG 15185 Query 552 GGGAGCCTGCAGGTCGGGGAAAAGAGCAGTGTGTGGAGATGT 593 |||||||||||||||||||||||||||||||||||||||||| Sbjct 15186 GGGAGCCTGCAGGTCGGGGAAAAGAGCAGTGTGTGGAGATGT 15227 Score = 48.1 bits (24), Expect = 0.009 Identities = 85/98 (86%), Gaps = 7/98 (7%) Strand=Plus/Plus Query 2 TCTTGCTTTC-ACTGAATCCTAGTGGACCTTGCACCNTTTCTGGCAACTAAGTAATTAGT 60 |||||||||| |||||||||||| || ||||||| |||||||||| ||||||||| || Sbjct 14666 TCTTGCTTTCCACTGAATCCTAG--GAAATTGCACCATTTCTGGCAA-TAAGTAATT-GT 14721 Query 61 TCACTTAGCATAATGAATAAATGGAGGATGAGTCTAAA 98 | |||||| ||||||||||||||||| ||||||||| Sbjct 14722 T-ACTTAGATGAATGAATAAATGGAGGA-GAGTCTAAA 14757 Figure AII.36. Alignment of Query sequence with: gb|AY206682.1| Homo sapiens surfactant, pulmonary-associated protein A2 (SFTPA2) gene, complete cds.
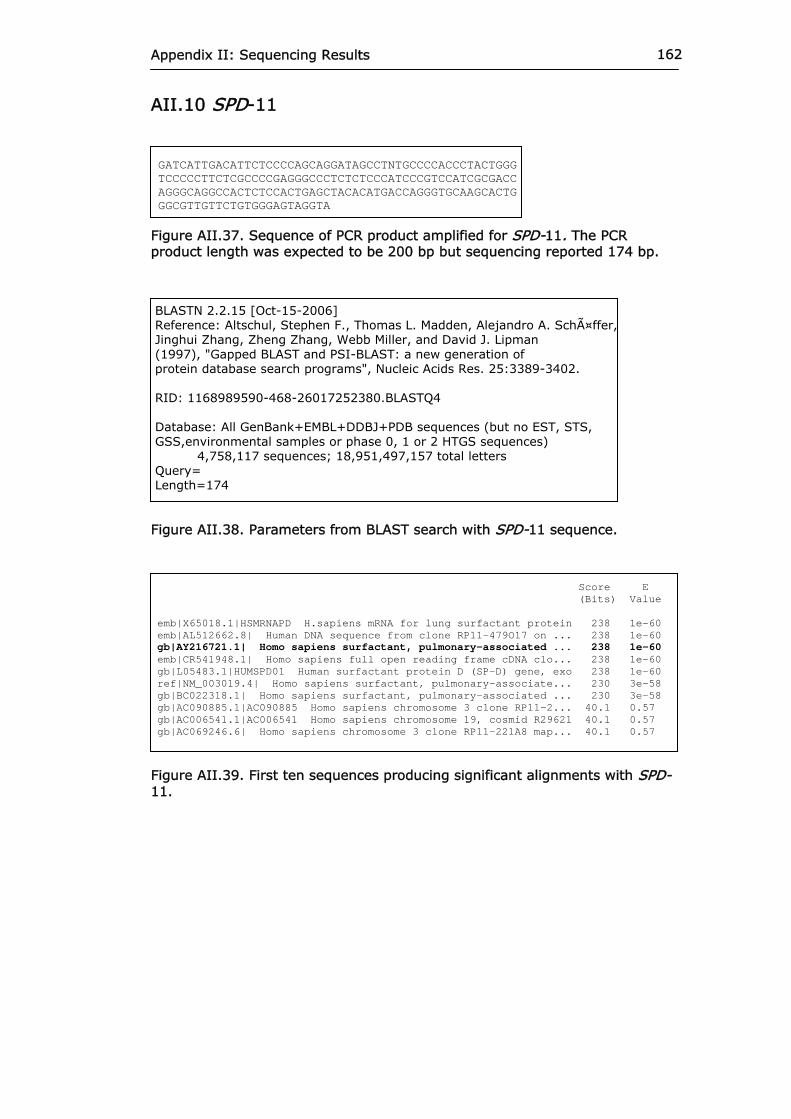
Appendix II: Sequencing Results 162
AII.10 SPD-11 GATCATTGACATTCTCCCCAGCAGGATAGCCTNTGCCCCACCCTACTGGG TCCCCCTTCTCGCCCCGAGGGCCCTCTCTCCCATCCCGTCCATCGCGACC AGGGCAGGCCACTCTCCACTGAGCTACACATGACCAGGGTGCAAGCACTG GGCGTTGTTCTGTGGGAGTAGGTA Figure AII.37. Sequence of PCR product amplified for SPD-11. The PCR product length was expected to be 200 bp but sequencing reported 174 bp. BLASTN 2.2.15 [Oct-15-2006] Reference: Altschul, Stephen F., Thomas L. Madden, Alejandro A. Schäffer, Jinghui Zhang, Zheng Zhang, Webb Miller, and David J. Lipman (1997), "Gapped BLAST and PSI-BLAST: a new generation of protein database search programs", Nucleic Acids Res. 25:3389-3402. RID: 1168989590-468-26017252380.BLASTQ4 Database: All GenBank+EMBL+DDBJ+PDB sequences (but no EST, STS, GSS,environmental samples or phase 0, 1 or 2 HTGS sequences) 4,758,117 sequences; 18,951,497,157 total letters Query= Length=174 Figure AII.38. Parameters from BLAST search with SPD-11 sequence. Score E (Bits) Value emb|X65018.1|HSMRNAPD H.sapiens mRNA for lung surfactant protein 238 1e-60 emb|AL512662.8| Human DNA sequence from clone RP11-479O17 on ... 238 1e-60 gb|AY216721.1| Homo sapiens surfactant, pulmonary-associated ... 238 1e-60 emb|CR541948.1| Homo sapiens full open reading frame cDNA clo... 238 1e-60 gb|L05483.1|HUMSPD01 Human surfactant protein D (SP-D) gene, exo 238 1e-60 ref|NM_003019.4| Homo sapiens surfactant, pulmonary-associate... 230 3e-58 gb|BC022318.1| Homo sapiens surfactant, pulmonary-associated ... 230 3e-58 gb|AC090885.1|AC090885 Homo sapiens chromosome 3 clone RP11-2... 40.1 0.57 gb|AC006541.1|AC006541 Homo sapiens chromosome 19, cosmid R29621 40.1 0.57 gb|AC069246.6| Homo sapiens chromosome 3 clone RP11-221A8 map... 40.1 0.57 Figure AII.39. First ten sequences producing significant alignments with SPD-11.

Appendix II: Sequencing Results 163
Length=23538 Score = 238 bits (120), Expect = 1e-60 Identities = 137/140 (97%), Gaps = 2/140 (1%) Strand=Plus/Minus Query 35 GCCCCACCCTAC-TGGGTCCCCCTTCTCGCCCCGAGGGCCCTCTCTCCCATCCCGTCCAT 93 |||||||||||| ||||||||||||||||||||||||||||||||||||||||||||||| Sbjct 5094 GCCCCACCCTACCTGGGTCCCCCTTCTCGCCCCGAGGGCCCTCTCTCCCATCCCGTCCAT 5035 Query 94 CGCGACCAGGGCAGGCCACTCTCCACTGAGCTACACATGACCAGGGTGCAAGCACTGGGC 153 |||||||||| ||||||||||||||||||||||||||||||||||||||||||||||||| Sbjct 5034 CGCGACCAGG-CAGGCCACTCTCCACTGAGCTACACATGACCAGGGTGCAAGCACTGGGC 4976 Query 154 GTTGTTCTGTGGGAGTAGGT 173 ||||||||||||||||||| Sbjct 4975 ATTGTTCTGTGGGAGTAGGT 4956 Figure AII.40. Alignment of Query sequence with: gb|AY216721.1| Homo sapiens surfactant, pulmonary-associated protein D (SFTPD) gene, complete cds.

Appendix II: Sequencing Results 164
AII.11 SPD-160 CGTATCGTTTGTCCCTTCATCCCGGGGGTCCCCTGGCACCTGGACTTCCC TGGGGACCCATGGCTCCAGCAGACCCTGGGGTAAAAGAAGAACTGGGTGA GCTATGTACTCATTTTATTTTTTTTGTTTTTAGCATTTTTACCTTCCCAT ACATGGACTAACTATCCTTATTGCCCAGAAATAGACAGATGGTCCCCAGT ACCCAGCCATGCAGCTCCCTGTACACTGACTGTCCCTGTCACCCAGCAAT CAACCCCGCTGTGGAAAACTGCCCCGCCACCCAACAACTAACCTTCCCTG TATACAGACTTCTCCATTGCTTGCGCCTCACTCTCCCTAGATAGGAACAG TCCCCAGAGCCCCCTCATGCACCCTTCTTGGATACAGATTCTCTCCATGT TCCAGCGATACCACCTCTGCCTTTGTGGGTGGTGGAGGGGGTGTAGGCAT TGACAGCTCCAAGCAGGCACAGGAGAACTGGACCCAGCCCAGCCCAGCTC TTTCCACTGCTCACCTGCTGCCCCTGTGTTTCCAGGGAACTCCACGA Figure AII.41. Sequence of PCR product amplified for SPD-160. The PCR product length was expected to be 577 bp but sequencing reported 547 bp. BLASTN 2.2.15 [Oct-15-2006] Reference: Altschul, Stephen F., Thomas L. Madden, Alejandro A. Schäffer, Jinghui Zhang, Zheng Zhang, Webb Miller, and David J. Lipman (1997), "Gapped BLAST and PSI-BLAST: a new generation of protein database search programs", Nucleic Acids Res. 25:3389-3402. RID: 1169867613-22139-94224196694.BLASTQ1 Database: All GenBank+EMBL+DDBJ+PDB sequences (but no EST, STS, GSS,environmental samples or phase 0, 1 or 2 HTGS sequences) 4,911,723 sequences; 19,641,233,228 total letters Query= Length=547 Figure AII.42. Parameters from BLAST search with SPD-160 sequence. Score E (Bits) Value emb|AL512662.8| Human DNA sequence from clone RP11-479O17 on ... 1031 0.0 gb|AY216721.1| Homo sapiens surfactant, pulmonary-associated ... 1023 0.0 gb|L05484.1|HUMSPD02 Human surfactant protein D (SP-D) gene, exo 735 0.0 gb|AY270843.1| Homo sapiens clone SKT05-E10 putative promoter se 176 1e-41 gb|AY271192.1| Homo sapiens clone SKG02-F03 putative promoter se 139 3e-30 ref|NM_003019.4| Homo sapiens surfactant, pulmonary-associate... 119 3e-24 gb|BC022318.1| Homo sapiens surfactant, pulmonary-associated ... 119 3e-24 emb|X65018.1|HSMRNAPD H.sapiens mRNA for lung surfactant protein 119 3e-24 emb|CR541948.1| Homo sapiens full open reading frame cDNA clo... 119 3e-24 gb|AC009974.10| Homo sapiens BAC clone RP11-459I19 from 2, compl 46.1 0.032
Figure AII.43. First ten sequences producing significant alignments with SPD-160.

Appendix II: Sequencing Results 165
Length=23538, Score = 1023 bits (516), Expect = 0.0 Identities = 519/520 (99%), Gaps = 0/520 (0%) Strand=Plus/Minus Query 19 ATCCCGGGGGTCCCCTGGCACCTGGACTTCCCTGGGGACCCATGGCTCCAGCAGACCCTG 78 |||||||||||||||||||||||||||||||||||||||||||||||||||||||||||| Sbjct 10086 ATCCCGGGGGTCCCCTGGCACCTGGACTTCCCTGGGGACCCATGGCTCCAGCAGACCCTG 10027 Query 79 GGGTAAAAGAAGAACTGGGTGAGCTATGTACTCATTTTATTTTTTTTGTTTTTAGCATTT 138 |||||||||||||||||||||||||||||||||||||||||||||||||||||||||||| Sbjct 10026 GGGTAAAAGAAGAACTGGGTGAGCTATGTACTCATTTTATTTTTTTTGTTTTTAGCATTT 9967 Query 139 TTACCTTCCCATACATGGACTAACTATCCTTATTGCCCAGAAATAGACAGATGGTCCCCA 198 |||||||||||||||||||||||||||||||||||||||||||||||||||||||||||| Sbjct 9966 TTACCTTCCCATACATGGACTAACTATCCTTATTGCCCAGAAATAGACAGATGGTCCCCA 9907 Query 199 GTACCCAGCCATGCAGCTCCCTGTACACTGACTGTCCCTGTCACCCAGCAATCAACCCCG 258 |||||||||||||||||||||||||||||||||||||||||||||||||||||||||||| Sbjct 9906 GTACCCAGCCATGCAGCTCCCTGTACACTGACTGTCCCTGTCACCCAGCAATCAACCCCG 9847 Query 259 CTGTGGAAAACTGCCCCGCCACCCAACAACTAACCTTCCCTGTATACAGACTTCTCCATT 318 |||||||||||||||||||||||||||||||||||||||||||||||||||||||||||| Sbjct 9846 CTGTGGAAAACTGCCCCGCCACCCAACAACTAACCTTCCCTGTATACAGACTTCTCCATT 9787 Query 319 GCTTGCGCCTCACTCTCCCTAGATAGGAACAGTCCCCAGAGCCCCCTCATGCACCCTTCT 378 |||||||||||||||||||||||||||||||||||||||||||||||||||||||||||| Sbjct 9786 GCTTGCGCCTCACTCTCCCTAGATAGGAACAGTCCCCAGAGCCCCCTCATGCACCCTTCT 9727 Query 379 TGGATACAGATTCTCTCCATGTTCCAGCGATACCACCTCTGCCTTTGTGGGTGGTGGAGG 438 |||||||||||||||||||||||||||||||||||||||||||||||||||||||||||| Sbjct 9726 TGGATACAGATTCTCTCCATGTTCCAGCGATACCACCTCTGCCTTTGTGGGTGGTGGAGG 9667 Query 439 GGGTGTAGGCATTGACAGCTCCAAGCAGGCACAGGAGAACTGGACCCAGCCCAGCCCAGC 498 |||||||||||||||||||||||||||||||||||||||||||||||||||||||||||| Sbjct 9666 GGGTGTAGGCATTGACAGCTCCAAGCAGGCACAGGAGAACTGGACCCAGCCCAGCCCAGC 9607 Query 499 TCTTTCCACTGCTCACCTGCTGCCCCTGTGTTTCCAGGGA 538 |||||||||||||||||||||||||||| ||||||||||| Sbjct 9606 TCTTTCCACTGCTCACCTGCTGCCCCTGCGTTTCCAGGGA 9567
Figure AII.44. Alignment of Query sequence with: gb|AY216721.1| Homo sapiens surfactant, pulmonary-associated protein D (SFTPD) gene, complete cds.

166
APPENDIX III
SAMPLE INFORMATION

Appendix III: Sample Information 167
AIII.1 RAOM/OME Population
Table AIII.1. Sample information from the RAOM/OME diagnosed population (Part One).

Appendix III: Sample Information 168
Table AIII.2. Sample information from the RAOM/OME diagnosed population (Part Two).

Appendix III: Sample Information 169
Table AIII.3. Sample information from the RAOM/OME diagnosed population (Part Three).
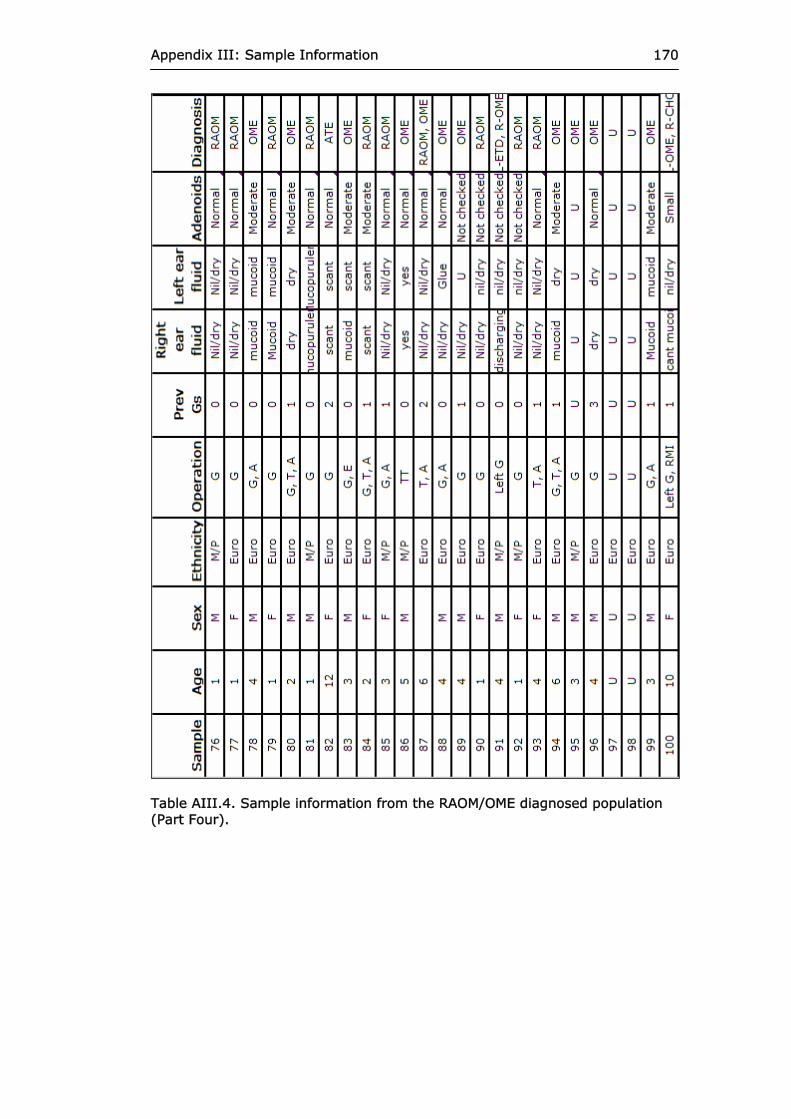
Appendix III: Sample Information 170
Table AIII.4. Sample information from the RAOM/OME diagnosed population (Part Four).

Appendix III: Sample Information 171
Table AIII.5. Sample information from the RAOM/OME diagnosed population (Part Five).

Appendix III: Sample Information 172
Key: ATE = Atelectasis M/P = Maori/Pacific Island A = Adenoidectomy OME = Otitis media with effusion CHO = Cholesteatoma RAOM = Reccurent acute otitis media E = Endoscopy RLG = Removal of left grommet ETD = Eustachian tube dysfunction RLT = Removal of left T-tube Euro = European-Caucasian RM = Right myringoplasty F = Female RMI = Right microinspection G = Grommets ROME = Recurrent OME L = Laryngoscopy RRG = Removal of right grommet LCM = Left cortical mastoidectomy T = Tonsillectomy LM = Left myringoscopy TT = T-tubes M = Male U = Unknown
Table AIII.6. Sample information from the RAOM/OME diagnosed population (Part Six).

Appendix III: Sample Information 173
AIII.2 Control Population Sample Number Age Sex Ethnicity
Sample Number Age Sex Ethnicity
C1 28 F European C31 47 F European
C2 43 F European C32 22 F Other
C3 63 M European C33 30 M European
C4 24 F European C34 50 F European
C5 46 M European C35 39 F European
C6 19 F Maori/Polynesian C36 37 M European
C7 53 F European C37 53 M European
C8 55 F European C38 48 M European
C9 33 F European C39 38 M European
C10 61 M European C40 36 M European
C11 18 M European C41 56 M European
C12 23 F European C42 22 F European
C13 42 F European C43 51 M Maori/Polynesian
C14 53 M European C44 38 F European
C15 48 M European C45 58 F European
C16 59 M European C46 37 M European
C17 27 F Maori/Polynesian C47 48 F European
C18 20 F European C48 46 M European
C19 52 F European C49 25 F European
C20 40 M European C50 58 F European
C21 40 F European C51 59 F European
C22 21 F European C52 57 F European
C23 27 F European C53 44 F European
C24 43 F European C54 47 M European
C25 48 M European C55 34 F European
C26 41 M European C56 53 M European
C27 55 M European C57 38 M Maori/Polynesian
C28 42 F Other C58 24 F Euro/other
C29 17 M European C59 34 F European
C30 Unknown C60 45 M Maori/Polynesian
Continued next page…

Appendix III: Sample Information 174
Sample Number Age Sex Ethnicity
Sample Number Age Sex Ethnicity
C61 53 F European C99 26 M European
C62 25 M European C100 48 M European
C63 59 F European C101 25 M European
C64 37 M European C102 25 F Other
C65 46 F European C103 45 F Other
C66 44 F European C104 36 M European
C67 60 M European C105 25 F Maori/Polynesian
C68 46 F Other C106 37 M Euro/Other
C69 41 F European C107 24 F European
C70 49 M European C108 48 F Maori/Polynesian
C71 40 F European C109 46 F European
C72 37 F European C110 43 M Maori/Polynesian
C73 48 M European C111 31 F European
C74 33 F European C112 24 F European
C75 31 F European C113 50 F Other
C76 27 M European C114 47 M European
C77 34 M Other C115 26 M European
C78 34 M European C116 36 M European
C79 37 M European C117 21 M Maori/Polynesian
C80 25 F European C118 38 F Unknown
C81 38 F European C119 27 M European
C82 44 M European C120 60 M European
C83 41 M European C121 51 M European
C84 52 F Maori/Polynesian C122 36 F European
C85 54 M European C123 41 M European
C86 44 M European C124 57 F Maori/Polynesian
C87 57 F European C125 24 M European
C88 22 F European C126 53 M European
C89 41 M European C127 45 M European
C90 46 F European C128 21 F European
C91 19 F Other C129 Unknown
C92 57 F European C130 49 F Maori/Polynesian
C93 33 F European C131 67 M European
C94 24 F European C132 67 F European
C95 57 M European C133 48 F Other
C96 29 F European C134 52 M European
C97 51 F European C135 25 F European
C98 23 F European C136 18 M Maori/Polynesian
Continued next page…

Appendix III: Sample Information 175
Sample Number Age Sex Ethnicity
C137 61 F European
C138 47 F Other
C139 19 M Maori/Polynesian
C140 38 M Other
C141 41 M European
C142 40 M European
C143 22 F Other
C144 61 F Other
C145 48 F European
C146 57 F European
C147 45 F European
C148 19 F European
C149 23 M European
C150 32 F Maori/Polynesian
C151 40 F European
C152 33 F European
C153 38 F European
C154 52 M Other
C155 38 F European
C156 29 F European
C157 44 M European
C158 43 M European
C159 21 M European
C160 39 F European Table AIII.7. Control population sample information. The control population consisted of volunteer blood donors from the New Zealand Blood Service, Hamilton. M = Male, F = Female.

176
APPENDIX IV
GENOTYPING RESULTS

Appendix IV: Genotyping Results 177
Table AIV. 1. Raw genotype data for RAOM/OME individuals in the case population (Part One).

Appendix IV: Genotyping Results 178
Table AIV.2. Raw genotype data for RAOM/OME individuals in the case population (Part Two).

Appendix IV: Genotyping Results 179
Table AIV.3. Raw genotype data for RAOM/OME individuals in the case population (Part Three).

Appendix IV: Genotyping Results 180
Table AIV.4. Raw genotype data for RAOM/OME individuals in the case population (Part Four).

Appendix IV: Genotyping Results 181
Table AIV.5. Raw genotype data for RAOM/OME individuals in the case population (Part Five).

Appendix IV: Genotyping Results 182
Table AIV.6. Raw genotype data for the control population (Part One).

Appendix IV: Genotyping Results 183
Table AIV.7. Raw genotype data for the control population (Part Two).

Appendix IV: Genotyping Results 184
Table AIV.8. Raw genotype data for the control population (Part Three).

Appendix IV: Genotyping Results 185
Table AIV.9. Raw genotype data for the control population (Part Four).

Appendix IV: Genotyping Results 186
Table AIV.10. Raw genotype data for the control population (Part Five).

Appendix IV: Genotyping Results 187
Table AIV.11. Raw genotype data for the control population (Part Six).

Appendix IV: Genotyping Results 188
A B Table AIV.12. Raw genotype data for the (A) New Zealand Maori/Pacific Island population and the (B) meningococcal disease individuals.

189
REFERENCES
Barr, F. E., Pedigo, H., Johnson, T. R., & Shepherd, V. L. (2000). Surfactant protein-A enhances uptake of respiratory syncytial virus by monocytes and U937 macrophages. American Journal of Respiratory Cell and Molecular Biology, 23(5), 586-592.
Barrett, J. C., Fry, B., Maller, J., & Daly, M. (2005). Haploview: analysis and visualization of LD and haplotype maps. Bioinformatics, 21(2), 263-265.
Bohlson, S. S., Fraser, D. A., Jasinskiene, N., Rawal, N., Palmarini, G., Ruiz, S., et al. (2006). C1q and MBL, components of the innate immune system, influence monocyte cytokine expression. Journal of Leukocyte Biology, 80(1), 107-116.
Bourbon, J. R., & Chailley-Heu, B. (2001). Surfactant proteins in
the digestive tract, mesentery, and other organs: evolutionary significance. Comparative Biochemistry and Physiology - Part A: Molecular & Integrative Physiology, 129(1), 151-161.
Cardon, L. R., & Palmers, L. J. (2003). Population stratification and spurious allelic association. The Lancet, 361(9357), 598-604.
Casselbrant, M. L., Mandel, E. M., Fall, P. A., Rockette, H. E.,
Kurs-Lasky, M., Bluestone, C. D., et al. (1999). The heritability of otitis media - A twin and triplet study. Jama-Journal of the American Medical Association, 282(22), 2125-2130.
Chalmers, D., Stewart, I., Silva, P., & Mulvena, A. (1989). Otitis Media with effusion in children - the Dunedin study. London: Mac Keith Press.
References 190
Chonmaitree, T. (2000). Viral and bacterial interaction in acute otitis media. Pediatric Infectious Disease Journal, 19(5), S24-S30.
Chonmaitree, T., & Heikkinen, T. (2000). Viruses and acute otitis media. Pediatric Infectious Disease Journal, 19(10), 1005-1007.
Chonmaitree, T., & Henrickson, K. J. (2000). Detection of respiratory viruses in the middle ear fluids of children with acute otitis media by multiplex reverse transcription: Polymerase chain reaction assay. Pediatric Infectious Disease Journal, 19(3), 258-260.
Clark, H., Palaniyar, N., Strong, P., Edmondson, J., Hawgood, S., & Reid, K. B. M. (2002). Surfactant Protein D Reduces Alveolar Macrophage Apoptosis In Vivo. Journal of Immunology, 169(6), 2892-2899.
Colhoun, H. M., McKeigue, P. M., & Smith, G. D. (2003). Problems of reporting genetic associations with complex outcomes. The Lancet, 361(9360), 865.
Crawford, D. C., & Nickerson, D. A. (2005). Definition and clinical
importance of haplotypes. Annual Review of Medicine, 56, 303-+.
Crouch, E. (2000). Surfactant protein-D and pulmonary host defense. Respiratory Research, 1(2), 93 - 108.
Crouch, E., & Wright, J. R. (2001). Surfactant proteins A and D and pulmonary host defense. Annual Review of Physiology, 63(1), 521-554.
Crouch, E. C. (1998). Collectins and Pulmonary Host Defense. American Journal of. Respiratory Cell Molecular Biology, 19(2), 177-201.
DiAngelo, S., Lin, Z., Wang, G., Phillips, S., Ramet, M., Luo, J., et al. (1999). Novel, Non-Radioactive, Simple and Multiplex PCR-cRFLP Methods for Genotyping Human SP-A and SP-D Marker Alleles. Disease Markers, 15, 269-281.
Ding, J., Umstead, T. M., Floros, J., & Phelps, D. S. (2004). Factors affecting SP-A-mediated phagocytosis in human monocytic cell lines. Respiratory Medicine, 98(7), 637-650.
References 191
Don, R. H., Cox, P. T., Wainwright, B. J., Baker, K., & Mattick, J. S. (1991). 'Touchdown' PCR to circumvent spurious priming during gene amplification. Nucleic Acids Research, 19(14), 4008.
Dunedin Multidisciplinary Health and Development Study. Available at: http://dunedinstudy.otago.ac.nz/. Accessed 3 November 2005.
Dutton, J. M., Goss, K., Khubchandani, K. R., Shah, C. D., Smith, R. J. H., & Snyder, J. M. (1999). Surfactant protein a in rabbit sinus and middle ear mucosa. Annals of Otology Rhinology and Laryngology, 108(10), 915-924.
Ensembl Human. Ensembl release 40, August 2006. Available at: http://www.ensembl.org/Homo_sapiens/index.html. Accessed 10 January 2007.
Floros, J., DiAngelo, S., Koptides, M., Karinch, A. M. (1996).
Human SP-A locus: Allele frequencies and linkage disequilibrium between the two surfactant protein A genes. American Journal of Respiratory Cell and Molecular Biology, 15(4), 489.
Floros, J., & Hoover, R. R. (1998). Genetics of the hydrophilic surfactant proteins A and D. Biochimica et Biophysica Acta (BBA) - Molecular Basis of Disease, 1408(2-3), 312-322.
Floros, J., Lin, H.-M., Garcia, A., Salazar, M. A., Guo, X., DiAngelo, S., et al. (2000). Surfactant Protein Genetic Marker Alleles Identify a Subgroup of Tuberculosis in a Mexican Population. The Journal of Infectious Diseases, 182, 1473-1478.
Floros, J., Rishi, A., Veletza, S. V., & Rogan, P. K. (1993). Concerted and Independent Genetic Events in the 3'untranslated Region of the Human Surfactant Protein-a Genes. American Journal of Human Genetics, 53(3), 683-683.
Floros, J., Veletza, S., Kotikalapudi, P., Krizkova, L., Karinch, A., Friedman, C. (1995). Dinucleotide repeats in the human surfactant protein-B gene and respiratory-distress syndrome. Biochemical Journal, 305, 583-590.
References 192
Floros, J., Wang, G. R., & Lin, Z. W. (2005). Genetic diversity of human SP-A, a molecule with innate host defense and surfactant-related function; characteristics, primary function, and significance. Current Pharmacogenomics, 3, 87-95.
Freid, V. M., Mukuc, D. M., Rooks, R. N. (1998). Ambulatory health care visits by children: principal diagnosis and place of visit. Vital Health Statistics, 13, 1-23.
Gelehrter, T. D., Collins, F., & Ginsburg, D. (1990). Principles of medical genetics. London: Lippincott Williams and Wilkins.
Gonzalez E, Kulkarni H, Bolivar H. (2005). The influence of CCL3L1 gene-containing segmental duplications on HIV-1/AIDS susceptibility. Science, 307, 1434–1440.
Hartshorn, K. L., White, M. R., & Crouch, E. C. (2002).
Contributions of the N- and C-terminal domains of surfactant protein D to the binding, aggregation, and phagocytic uptake of bacteria. Infection and Immunity, 70(11), 6129-6139.
Higuchi, R., Fockler, C., Dollinger, G., & Watson, R. (1993). Kinetic PCR Analysis - Real-Time Monitoring of DNA Amplification Reactions. Bio-Technology, 11(9), 1026-1030.
Hirschhorn, J. N., Lohmueller, K., Byrne, E., & Hirschhorn, K. (2002). A comprehensive review of genetic association studies. Genetics in Medicine, 4(2), 42-61.
Homoe, P., Christensen, R. B., & Bretlau, P. (1999). Acute otitis
media and sociomedical risk factors among unselected children in Greenland. International Journal of Pediatric Otorhinolaryngology, 49(1), 37-52.
Jack, D. L., Cole, J., Naylor, S. C., Borrow, R., Kaczmarski, E. B.,
Klein, N. J., et al. (2006). Genetic polymorphism of the binding domain of surfactant protein-A2 increases susceptibility to meningococcal disease. Clinical Infectious Diseases, 43, 1426-1433.
Jounblat, R., Kadioglu, A., Iannelli, F., Pozzi, G., Eggleton, P., & Andrew, P. W. (2004). Binding and agglutination of Streptococcus pneumoniae by human surfactant protein D (SP-D) vary between strains but, SP-D fails to enhance killing by neutrophils. Infection and Immunity, 72(2), 709-716.
References 193
Kalina, M., Blau, H., Riklis, S., & Kravtsov, V. (1995). Interaction of surfactant protein A with bacterial lipopolysaccharide may affect some biological functions. American Journal of Physiology-Lung Cellular and Molecular Physiology, 268, L144-L151.
Karinch, A. M., & Floros, J. (1995a). 5' Splicing and Allelic
Variants of the Human Pulmonary Surfactant Protein-a Genes. American Journal of Respiratory Cell and Molecular Biology, 12(1), 77-88.
Karinch, A. M., & Floros, J. (1995b). Translation in-Vivo of 5' Untranslated-Region Splice Variants of Human Surfactant Protein-A. Biochemical Journal, 307, 327-330.
Kishore, U., Greenhough, T. J., Waters, P., Shrive, A. K., Ghai, R., Kamran, M. F., et al. (2006). Surfactant proteins SP-A and SP-D: Structure, function and receptors. Molecular Immunology, 43(9), 1293-1315.
Kodama, S., Hirano, T., Suenaga, S., Abe, N., & Suzuki, M. (2005). Eustachian tube possesses immunological characteristics as a mucosal effector site and responds to P6 outer membrane protein of nontypeable Haemophilus influenzae. Vaccine, 24(7), 1016-1027.
Kvestad, E., Kvaerner, K. J., Roysamb, E., Tambs, K., Harris, J., Magnus, P. Otitis media: genetic factors and gender differences. In: Lim, D. J., Bluestone, C. D., Casselbrandt, M. L., Eds. Abstracts of the Eighth Internatioanl Symposium on Recent Advances in Otitis Media, Ft Lauderdale, Fla, 2003a: 86.
Kvestad, E., Kvaerner, K. J., Roysamb, E., Tambs, K., Harris, J., Magnus, P. Heritability of otitis media: reliability and validity of retrospective twin data. In: Lim, D. J., Bluestone, C. D., Casselbrandt, M. L., Eds. Abstracts of the Eighth Internatioanl Symposium on Recent Advances in Otitis Media, Ft Lauderdale, Fla, 2003b: 87.
Lahti, M., Lofgren, J., Marttila, R., Renko, M., Klaavuniemi, T., Haataja, R., et al. (2002). Surfactant protein D Gene Polymorphism Associated with Severe Respiratory Syncytial Virus Infection. Pediatric Research, 51(6), 696-699.
References 194
Leth-Larsen, R., Garred, P., Jensenius, H., Meschi, J., Hartshorn, K., Madsen, J., et al. (2005). A common polymorphism in the SFTPD gene influences assembly, function, and concentration of surfactant protein D. The Journal of Immunology, 174(3), 1532-1538.
LeVine, A. M., Whitsett, J. A., Hartshorn, K. L., Crouch, E. C., & Korfhagen, T. R. (2001). Surfactant protein D enhances clearance of Influenza A Virus from the lung in vivo. Journal of Immunology, 167(10), 5868-5873.
Lin, Z., & Floros, J. (2002). Heterogeneous allele expression of pulmonary surfactant protein (SP)-D gene in rat large intestine and other tissues. American Journal of Human Genetics, 71(4), 336-336.
Lin, Z. W., Wang, Y., Zhu, K., & Floros, J. (2004). Heterogeneous allele expression of pulmonary surfactant protein (SP)-A and Osteopontin (OPN) in rat. The Federation of American Societies for Experimental Biology Journal, 18(4), A240-A240.
Liu, W., Bentley, C. M., & Floros, J. (2003). Study of human SP-A, SP-B and SP-D loci: allele frequencies, linkage disequilibrium and heterozygosity in different races and ethnic groups. BMC Genetics, 4, 13-22.
Lofgren, J., Ramet, M., Renko, M., Marttila, R., & Hallman, M. (2002). Association between surfactant protein A gene locus and severe respiratory syncytial virus infection in infants. Journal of Infectious Diseases, 185(3), 283-289.
Matalon, S., & Wright, J. R. (2004). Surfactant proteins and inflammation - The Yin and Yang. American Journal of Respiratory Cell and Molecular Biology, 31(6), 585-586.
McGuire, J. F. (2002). Surfactant in the middle ear and Eustachian tube: a review. International Journal of Pediatric Otorhinolaryngology, 66(1), 1-15.
Murakami, S., Iwaki, D., Mitsuzawa, H., Sano, H., Takahashi, H., Voelker, D. R., et al. (2002). Surfactant protein A inhibits peptidoglycan-induced Tumor Necrosis Factor-Alpha secretion in U937 cells and alveolar macrophages by direct interaction with Toll-like receptor 2. Journal of Biological Chemistry, 277(9), 6830-6837.
References 195
Nadesalingam, J., Reid, K. B. M., & Palaniyar, N. (2005). Collectin surfactant protein D binds antibodies and interlinks innate and adaptive immune systems. FEDERATION OF EUROPEAN BIOCHEMICAL SOCIETIES Letters, 579(20), 4449.
National Audiology Centre, New Zealand Hearing Screening Statistics July 2001 - June 2002, Auckland. Report to the Health Funding Authority, National Audiology Centre, Auckland, 2003.
New Zealand District Health Board (2004). Otitis media in children: referral guidelines for primary care management. Available at: http://www.electiveservices.govt.nz/guidelines/om-pcm.html. Accessed 22 September 2006.
Nogee, L. M. (1998). Genetics of the hydrophobic surfactant
proteins. Biochimica et Biophysica Acta - Molecular Basis of Disease, 1408(2-3), 323-333.
Ohya, M., Nishitani, C., Sano, H., Yamada, C., Mitsuzawa, H., Shimizu, T., et al. (2006). Human pulmonary surfactant protein D binds the extracellular domains of toll-like receptors 2 and 4 through the carbohydrate recognition domain by a mechanism different from its binding to phosphatidylinositol and lipopolysaccharide. Biochemistry, 45(28), 8657-8664.
Paananen, R., Glumoff, V., & Hallman, M. (1999). Surfactant protein A and D expression in the porcine Eustachian tube1. FEDERATION OF EUROPEAN BIOCHEMICAL SOCIETIES Letters, 452(3), 141-144.
Paananen, R., Postle, A. D., Clark, G., Glumoff, V., & Hallman, M. (2002). Eustachian tube surfactant is different from alveolar surfactant: determination of phospholipid composition of porcine eustachian tube lavage fluid. Journal of Lipid Research., 43(1), 99-106.
Paananen, R., Sormunen, R., Glumoff, V., Van Eijk, M., & Hallman, M. (2001). Surfactant proteins A and D in Eustachian tube epithelium. American Journal of Physiology-Lung Cellular and Molecular Physiology, 281(3), L660-L667.

References 196
Pantelidis, P., Lagan, A. L., Davies, J. C., Welsh, K. I., & du Bois, R. M. (2003). A single round PCR method for genotyping human surfactant protein (SP)-A1, SP-A2 and SP-D gene alleles. Tissue Antigens, 61(4), 317-321.
Pantelidis, P., Veeraraghavan, S., & du Bois, R. M. (2002). Surfactant gene polymorphisms and interstitial lung diseases. Respiratory Research, 3, 14-21.
Paterson, J. E., Carter, S., Wallace, J., Ahmad, Z., Garrett, N., & Silva, P. A. (2006). Pacific Islands families study: The prevalence of chronic middle ear disease in 2-year-old Pacific children living in New Zealand. International Journal of Pediatric Otorhinolaryngology, 70(10), 1771-1778.
Pettigrew, M. M., Gent, J. F., Zhu, Y., Triche, E. W., Belanger, K. D., Holford, T. R., et al. (2006). Association of surfactant protein A polymorphisms with otitis media in infants at risk for asthma. BMC Medical Genetics, 7.
Pitkaranta, A., & Hayden, F. G. (1998). Rhinoviruses: important respiratory pathogens. Annals of Medicine, 30(6), 529-537.
Pitkaranta, A., Jero, J., Arruda, E., Virolainen, A., & Hayden, F. G. (1998). Polymerase chain reaction-based detection of rhinovirus, respiratory syncytial virus, and coronavirus in otitis media with effusion. Journal of Pediatrics, 133(3), 390-394.
Pitkaranta, A., Virolainen, A., Jero, J., Arruda, E., & Hayden, F. G. (1998). Detection of rhinovirus, respiratory syncytial virus, and coronavirus infections in acute otitis media by reverse transcriptase polymerase chain reaction. Pediatrics, 102(2), 291-295.
Postle, A., Mander, A., Reid, K., Wang, J., Wright, S., Moustaki, M., et al. (1999). Deficient hydrophilic lung surfactant proteins A and D with normal surfactant phospholipid molecular species in cystic fibrosis. American Journal of Respiratory Cell & Molecular Biology, 20(1), 90.
Ramensky, V., Bork, P., & Sunyaev, S. (2002). Human non-synonymous SNPs: server and survey. Nucleic Acids Research, 30(17), 3894-3900.

References 197
Ramet, M., Haataja, R., Marttila, R., Floros, J., & Hallman, M. (2000). Association between the Surfactant Protein A (SP-A) Gene Locus and Respiratory-Distress Syndrome in the Finnish Population. American Journal of Human Genetics, 66, 1569-1579.
Ramet, M., Lofgren, J., Alho, O.-P., & Hallman, M. (2001). Surfactant protein-A gene locus associated with recurrent otitis media. The Journal of Pediatrics, 138, 266-268.
Redon, R., Ishikawa, S., Fitch, K. R., Feuk, L., Perry, G. H., Andrews, T. D., et al. (2006). Global variation in copy number in the human genome. Nature, 444(7118), 444-454.
Regional Hearing Services (2006). Available at:
http://www.regionalhearingservices.co.uk/hearing.html. Accessed 17 February 2005.
Ririe, K. M., Rasmussen, R. P., & Wittwer, C. T. (1997). Product
differentiation by analysis of DNA melting curves during the polymerase chain reaction. Analytical Biochemistry, 245(2), 154-160.
Rovers, M. M., Schilder, A. G. M., Zielhuis, G. A., Rosenfeld, R. M. (2004). Otitis media. The Lancet, 363, 465-473.
Ryan, A. F., Jung, T. T., Juhn, S. K., Li, J. D., Andalibi, A., Lin, J., et al. (2005). Recent advances in otitis media. 4A. Molecular biology. Annals of Otology Rhinology and Laryngology, 194, 42-49.
Sano, H., & Kuroki, Y. (2005). The lung collectins, SP-A and SP-D, modulate pulmonary innate immunity. Molecular Immunology, 42(3), 279-287.
Sano, H., Sohma, H., Muta, T., Nomura, S.-i., Voelker, D. R., & Kuroki, Y. (1999). Pulmonary Surfactant Protein A Modulates the Cellular Response to Smooth and Rough Lipopolysaccharides by Interaction with CD14. Journal of Immunology, 163(1), 387-395.
Saxena, S., Madan, T., Shah, A., Muralidhar, K., & Sarma, P. U. (2003). Association of polymorphisms in the collagen region of SP-A2 with increased levels of total IgE antibodies and eosinophilia in patients with allergic bronchopulmonary aspergillosis. Journal of Allergy and Clinical Immunology, 111(5, Supplement 1), 1001.

References 198
Schagat, T. L., Wofford, J. A., & Wright, J. R. (2001). Surfactant Protein A Enhances Alveolar Macrophage Phagocytosis of Apoptotic Neutrophils. Journal of Immunology, 166(4), 2727-2733.
Seifart, C., Lin, H. M., Seifart, U., Plagens, A., DiAngelo, S., von Wichert, P., et al. (2005). Rare SP-A alleles and the SP-A1-6A4 allele associate with risk for lung carcinoma. Clinical Genetics, 68(2), 128-136.
Selman, M., Lin, H. M., Montano, M., Jenkins, A. L., Estrada, A., Lin, Z. W., et al. (2003). Surfactant protein A and B genetic variants predispose to idiopathic pulmonary fibrosis. Human Genetics, 113(6), 542-550.
Shepherd, V. L. (2002). Pulmonary surfactant protein D: a novel link between innate and adaptive immunity. American Journal of Physiology-Lung Cellular and Molecular Physiology, 282(3), L516-517.
Shianna, K. V., & Willard, H. F. (2006). Human genomics - In search of normality. Nature, 444(7118), 428-429.
van de Wetering, J. K., van Eijk, M., van Golde, L. M. G.,
Hartung, T., van Strijp, J. A. G., & Batenburg, J. J. (2001). Characteristics of surfactant protein a and D binding to lipoteichoic acid and peptidoglycan, 2 major cell wall components of Gram-positive bacteria. Journal of Infectious Diseases, 184(9), 1143-1151.
Van Iwaarden, J. F., Pikaar, J. C., Storm, J., Brouwer, E.,
Verhoef, J., Oosting, R. S., et al. (1994). Binding of surfactant protein A to the lipid A moiety of bacterial lipopolysaccharides. Biochemical Journal, 303(Pt 2), 407-411.
Wang, G. R., Guo, X. X., & Floros, J. (2003). Human SP-A 3 '-
UTR variants mediate differential gene expression in basal levels and in response to dexamethasone. American Journal of Physiology-Lung Cellular and Molecular Physiology, 284(5), L738-L748.
Wang, G. R., Guo, X. X., & Floros, J. (2005). Differences in the translation efficiency and mRNA stability mediated by 5'-UTR splice variants of human SP-A1 and SP-A2 genes. American Journal of Physiology-Lung Cellular and Molecular Physiology, 289(3), L497-L508.

References 199
Wigginton, J. E., Cutler, D. J., & Abecasis, G. R. (2005). A note on exact tests of Hardy-Weinberg equilibrium. American Journal of Human Genetics, 76(5), 887-893.
Yamanaka, N., Kobayashi, K., Kataura, A., Kuroki, Y., & Akino, T.
(1991). Implication of surfactant apoprotein in otitis media with effusion. Annals of Otology Rhinology and Laryngology, 100(10), 835-840.
Zheng, Q. Y., Hardisty-Hughes, R., & Brown, S. D. M. (2006).
Mouse models as a tool to unravel the genetic basis for human otitis media. Brain Research, 1091, 9-15.