Embed Size (px)
Citation preview
UNIT 1 - INTRODUCTIONSurvey of computer graphics, Overview of graphics systems – Video display devices, Raster scan systems, Random scan systems, Graphics monitors and Workstations, Input devices, Hard copy Devices, Graphics Software; Output primitives – points and lines, line drawing algorithms, loading the frame buffer, line function; circle and ellipse generating algorithms; Pixel addressing and object geometry, filled area primitives.
Computer Graphics is Creation, Manipulation and Storage of geometric objects (modelling) & their
images (rendering). Display those images on screens or hardcopy devices.
SURVEY OF COMPUTER GRAPHICS
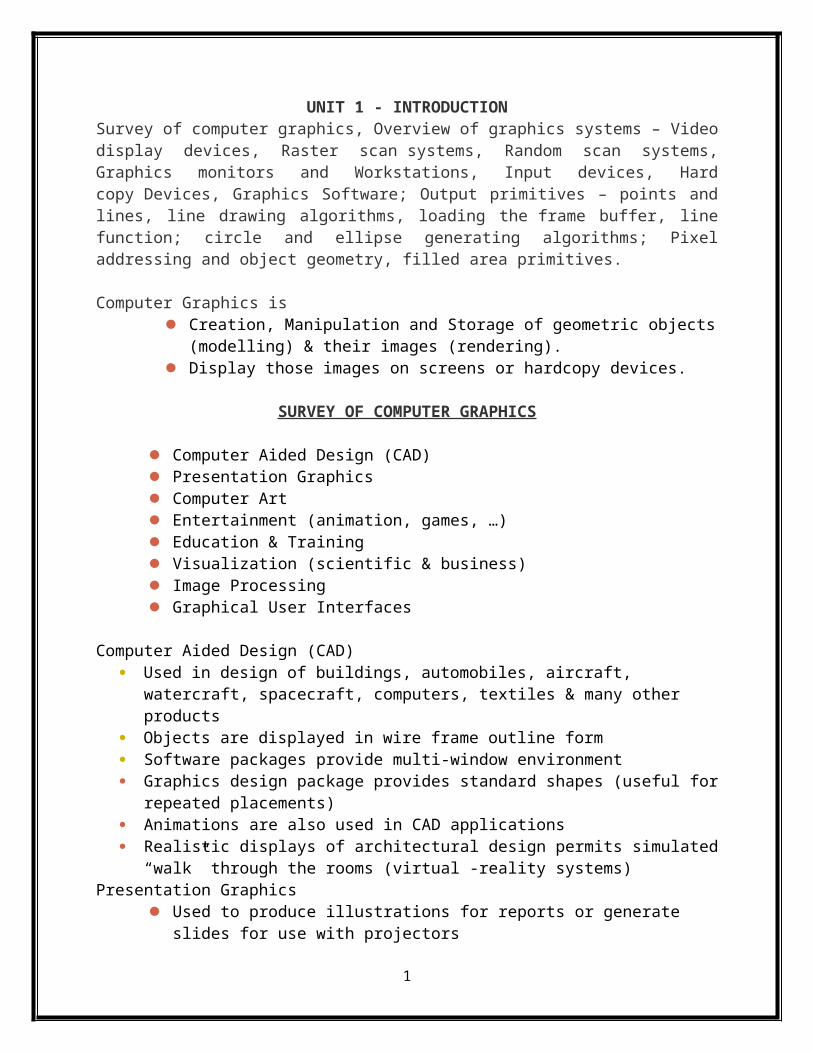
Computer Aided Design (CAD) Presentation Graphics Computer Art Entertainment (animation, games, …) Education & Training Visualization (scientific & business) Image Processing Graphical User Interfaces
Computer Aided Design (CAD) Used in design of buildings, automobiles, aircraft, watercraft, spacecraft, computers,
textiles & many other products Objects are displayed in wire frame outline form Software packages provide multi-window environment Graphics design package provides standard shapes (useful for repeated placements) Animations are also used in CAD applications Realistic displays of architectural design permits simulated “walk” through the rooms
(virtual -reality systems)Presentation Graphics
Used to produce illustrations for reports or generate slides for use with projectors Commonly used to summarize financial, statistical, mathematical, scientific,
economic data for research reports, managerial reports & customer information bulletins
Examples : Bar charts, line graphs, pie charts, surface graphs, time chartComputer Art
Used in fine art & commercial art Includes artist’s paintbrush programs, paint packages, CAD packages
and animation packages These packages provides facilities for designing object shapes &
specifying object motions. Examples : Cartoon drawing, paintings, product advertisements, logo
design Electronic painting
1

Picture painted electronically on a graphics tablet (digitizer) using a stylus Cordless, pressure sensitive stylus
Morphing A graphics method in which one object is transformed into another
Entertainment
Movie IndustryUsed in motion pictures, music videos, and television shows.
Used in making of cartoon animation films Game Industry
Focus on interactivity Cost effective solutions
Avoiding computations and other tricks
Education & Training Computer generated models of physical, financial and economic systems are used as
educational aids. Models of physical systems, physiological systems, population trends, or equipment
such as color-coded diagram help trainees understand the operation of the system Specialized systems used for training applications
simulators for practice sessions or training of ship captains aircraft pilots heavy equipment operators air traffic-control personnel
Visualization (scientific & business)
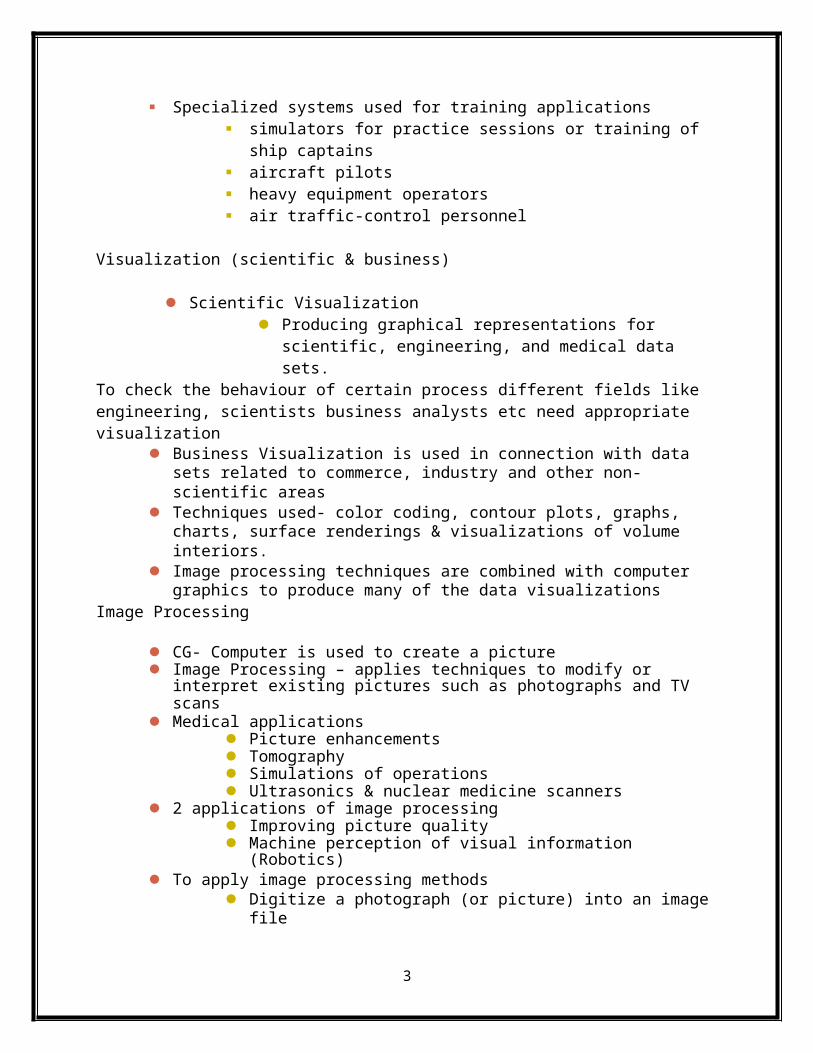
Scientific Visualization Producing graphical representations for scientific, engineering, and
medical data sets.To check the behaviour of certain process different fields like engineering, scientists business analysts etc need appropriate visualization
Business Visualization is used in connection with data sets related to commerce, industry and other non-scientific areas
Techniques used- color coding, contour plots, graphs, charts, surface renderings & visualizations of volume interiors.
Image processing techniques are combined with computer graphics to produce many of the data visualizations
Image Processing
CG- Computer is used to create a picture Image Processing – applies techniques to modify or interpret existing pictures such
as photographs and TV scans Medical applications
Picture enhancements Tomography Simulations of operations Ultrasonics & nuclear medicine scanners
2
2 applications of image processing Improving picture quality Machine perception of visual information (Robotics)
To apply image processing methods Digitize a photograph (or picture) into an image file Apply digital methods to rearrange picture parts to
enhance color separations Improve quality of shading
Tomography – technique of X-ray photography that allows cross-sectional views of physiological systems to be displayed
Computed X-ray tomography (CT) and position emission tomography ( PET) use projection methods to reconstruct cross sections from digital data
Computer-Aided Surgery is a medical application technique to model and study physical functions to design artificial limbs and to plan & practice surgery
Graphical User Interface
Major component – Window manager (multiple-window areas) To make a particular window active, click in that window (using an interactive
pointing device) Interfaces display – menus & icons Icons – graphical symbol designed to look like the processing option it represents Advantages of icons – less screen space, easily understood Menus contain lists of textual descriptions & icons
Graphics Packages
A set of libraries that provide programmatically access to some kind of graphics 2D functions.
Types GKS-Graphics Kernel System – first graphics package – accepted by
ISO & ANSI PHIGS (Programmer’s Hierarchical Interactive Graphics Standard)-
accepted by ISO & ANSI PHIGS + (Expanded package) Silicon Graphics GL (Graphics Library) Open GL Pixar Render Man interface Postscript interpreters
OVERVIEW OF GRAPHICS SYSTEM
Due to the widespread recognition of the power and utility of computer graphics in virtually all fields, a broad range of graphics hardware and software systems is now available. Graphics capabilities for both two-dimensional and three-dimensional applications are now common on general-purpose computers, including many hand-held calculators. With personal computers, we can use a wide variety of interactive input devices and graphics software packages. For higher-
3

quality applications, we can choose from a number of sophisticated special-purpose graphics hardware systems and technologies.
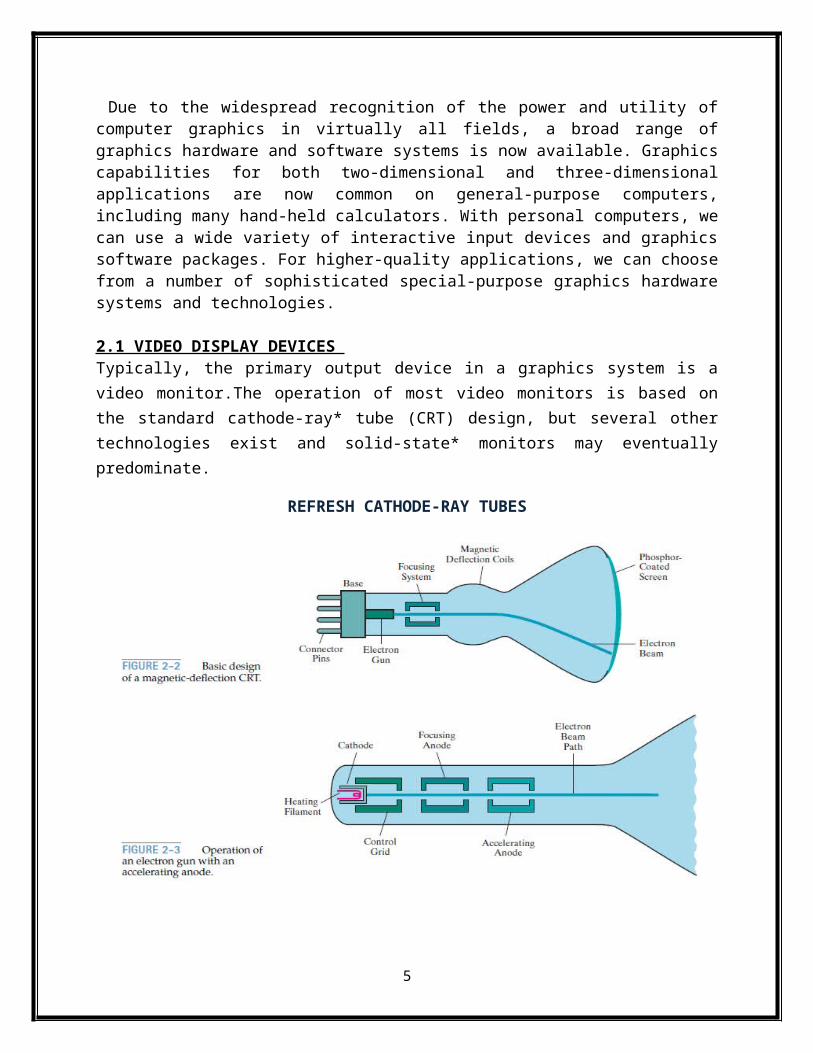
2.1 VIDEO DISPLAY DEVICES Typically, the primary output device in a graphics system is a video monitor.The operation of most video monitors is based on the standard cathode-ray* tube (CRT) design, but several other technologies exist and solid-state* monitors may eventually predominate.
REFRESH CATHODE-RAY TUBES
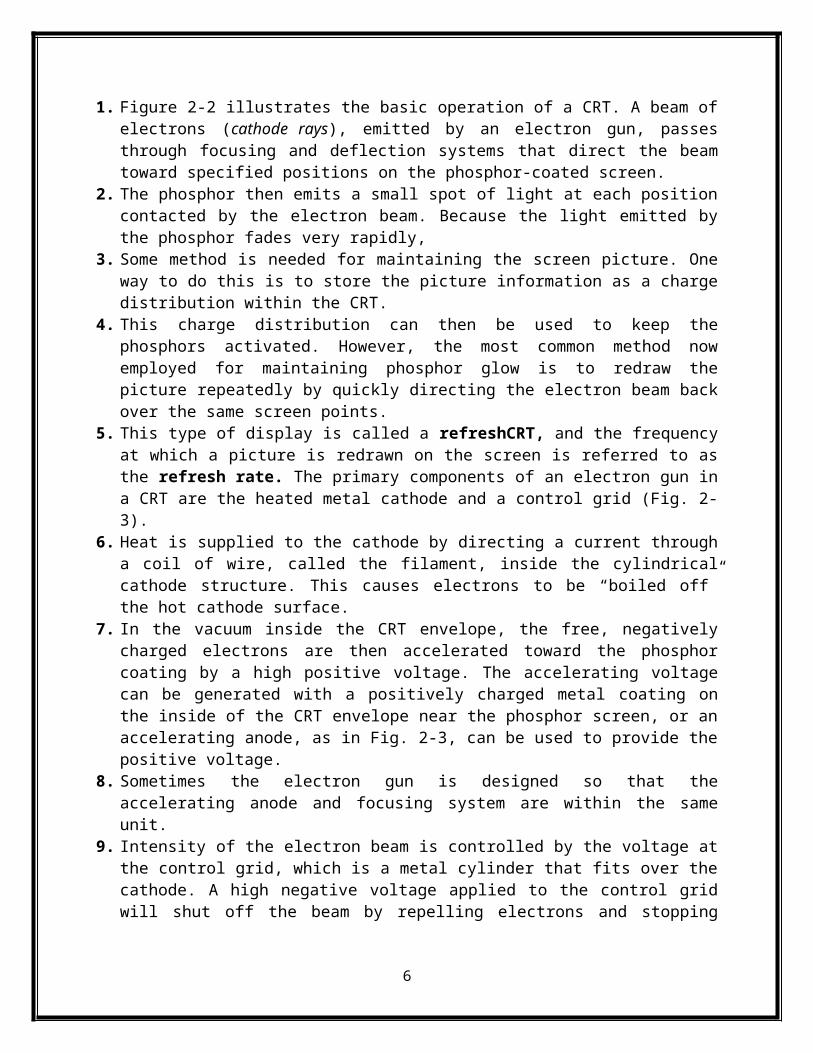
1. Figure 2-2 illustrates the basic operation of a CRT. A beam of electrons (cathode rays), emitted by an electron gun, passes through focusing and deflection systems that direct the beam toward specified positions on the phosphor-coated screen.
2. The phosphor then emits a small spot of light at each position contacted by the electron beam. Because the light emitted by the phosphor fades very rapidly,
3. Some method is needed for maintaining the screen picture. One way to do this is to store the picture information as a charge distribution within the CRT.
4. This charge distribution can then be used to keep the phosphors activated. However, the most common method now employed for maintaining phosphor glow is to redraw the picture repeatedly by quickly directing the electron beam back over the same screen points.
5. This type of display is called a refreshCRT, and the frequency at which a picture is redrawn on the screen is referred to as the refresh rate. The primary components of an electron gun in a CRT are the heated metal cathode and a control grid (Fig. 2-3).
4
6. Heat is supplied to the cathode by directing a current through a coil of wire, called the filament, inside the cylindrical cathode structure. This causes electrons to be “boiled off” the hot cathode surface.
7. In the vacuum inside the CRT envelope, the free, negatively charged electrons are then accelerated toward the phosphor coating by a high positive voltage. The accelerating voltage can be generated with a positively charged metal coating on the inside of the CRT envelope near the phosphor screen, or an accelerating anode, as in Fig. 2-3, can be used to provide the positive voltage.
8. Sometimes the electron gun is designed so that the accelerating anode and focusing system are within the same unit.
9. Intensity of the electron beam is controlled by the voltage at the control grid, which is a metal cylinder that fits over the cathode. A high negative voltage applied to the control grid will shut off the beam by repelling electrons and stopping them from passing through the small hole at the end of the control-grid structure.
10. A smaller negative voltage on the control grid simply decreases the number of electrons passing through. Since the amount of light emitted by the phosphor coating depends on the number of electrons striking the screen, the brightness of a display point is controlled by varying the voltage on the control grid.
11. The focusing system in a CRT forces the electron beam to converge to a small cross section as it strikes the phosphor. Otherwise, the electrons would repel eachother, and the beam would spread out as it approaches the screen. Focusing is accomplished with either electric or magnetic fields.
12. With electrostatic focusing, the electron beam is passed through a positively charged metal cylinder so that electrons along the centerline of the cylinder are in an equilibrium position.
13. This arrangement forms an electrostatic lens, as shown in Fig. 2-3, and the electron beam is focused at the center of the screen in the same way that an optical lens focuses a beam of light at a particular focal distance. Similar lens focusing effects can be accomplished with a magnetic field set up by a coil mounted around the outside of the CRT envelope, and magnetic lens focusing usually produces thesmallest spot size on the screen.
14. Additional focusing hardware is used in high-precision systems to keep the beam in focus at all screen positions. The distance that the electron beam must travel to different points on the screen varies because the radius of curvature for most CRTs is greater than the distance from the focusing system to the screen center.
15. Therefore, the electron beam will be focused properly only at the center of the screen. As the beam moves to the outer edges of the screen, displayed images become blurred. To compensate for this, the system can adjust the focusing according to the screen position of the beam.
16. As with focusing, deflection of the electron beam can be controlled with either electric or magnetic fields. Cathode-ray tubes are now commonly constructed with magnetic-deflection coils mounted on the outside of the CRT envelope, as illustrated in Fig. 2-2.
17. Two pairs of coils are used for this purpose. One pair is mounted on the top and bottom of the CRT neck, and the other pair is mounted on opposite sides of the neck. The magnetic field produced by each pair of coils results in a transverse deflection force that is perpendicular to both the direction of the magnetic field and the direction of travel of the electron beam.
5
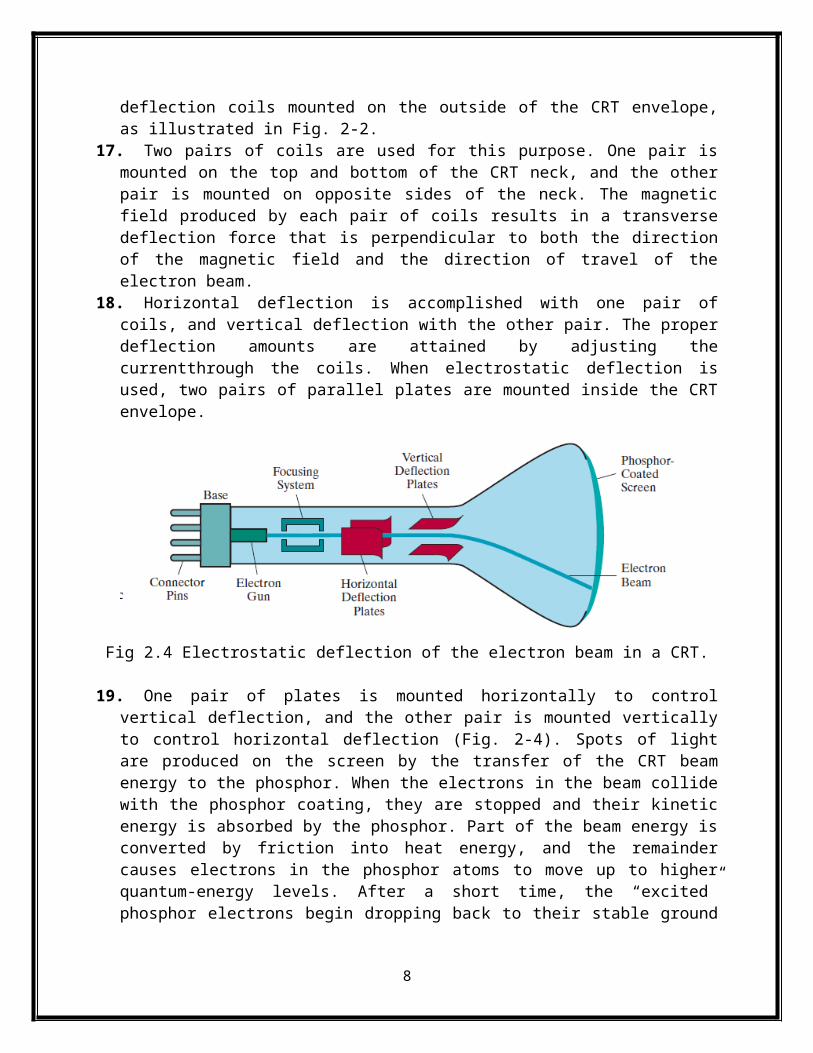
18. Horizontal deflection is accomplished with one pair of coils, and vertical deflection with the other pair. The proper deflection amounts are attained by adjusting the currentthrough the coils. When electrostatic deflection is used, two pairs of parallel plates are mounted inside the CRT envelope.
Fig 2.4 Electrostatic deflection of the electron beam in a CRT.
19. One pair of plates is mounted horizontally to control vertical deflection, and the other pair is mounted vertically to control horizontal deflection (Fig. 2-4). Spots of light are produced on the screen by the transfer of the CRT beam energy to the phosphor. When the electrons in the beam collide with the phosphor coating, they are stopped and their kinetic energy is absorbed by the phosphor. Part of the beam energy is converted by friction into heat energy, and the remainder causes electrons in the phosphor atoms to move up to higher quantum-energy levels. After a short time, the “excited” phosphor electrons begin dropping back to their stable ground state, giving up their extra energy as small quantum’s of light energy called photons.
20. Different kinds of phosphors are available for use in CRTs. Besides color, a major difference between phosphors is their persistence: how long they continue to emit light (that is, how long before all excited electrons have returned to the ground state) after the CRT beam is removed. Persistence is defined as the time that it takes the emitted light from the screen to decay to one-tenth of its original intensity.
21. Lower-persistence phosphors require higher refresh rates to maintain a picture on the screen without flicker. A phosphor with low persistence can be useful for animation, while high-persistence phosphors are better suited for displaying highly complex, static pictures. Although some phosphors have persistence values greater than 1 second, general-purpose graphics monitors are usually constructed with persistence in the range from 10 to 60 microseconds.
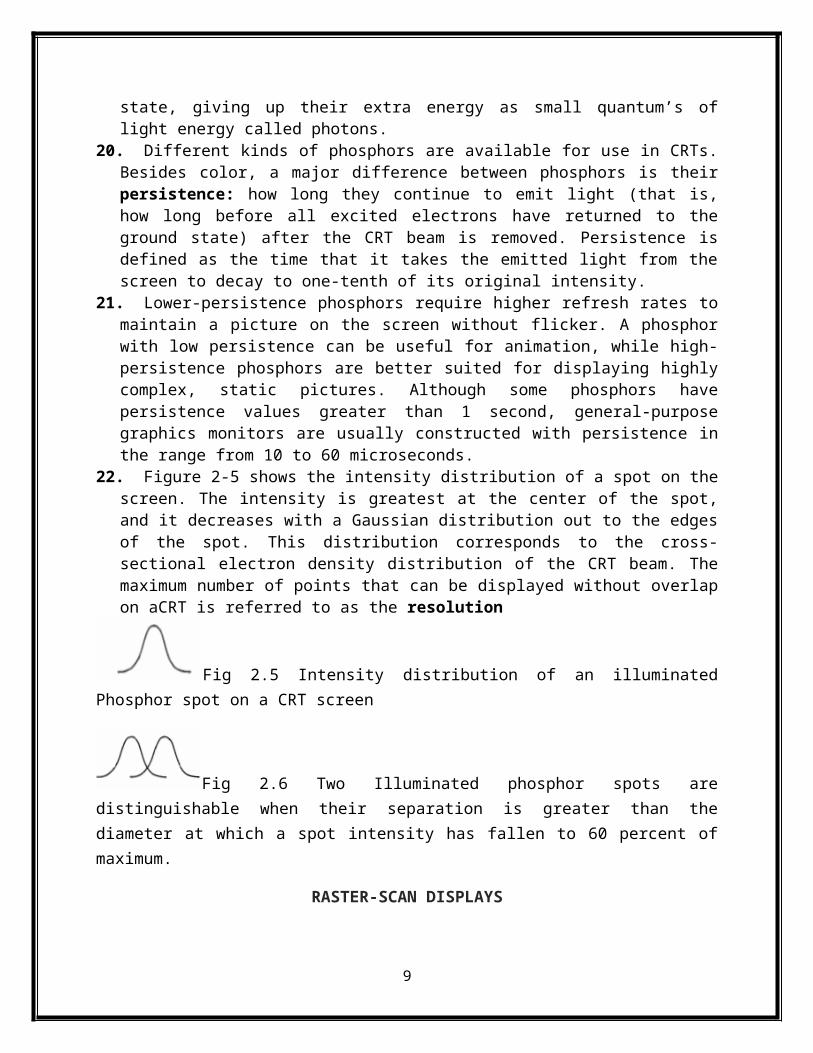
22. Figure 2-5 shows the intensity distribution of a spot on the screen. The intensity is greatest at the center of the spot, and it decreases with a Gaussian distribution out to the edges of the spot. This distribution corresponds to the cross-sectional electron density distribution of the CRT beam. The maximum number of points that can be displayed without overlap on aCRT is referred to as the resolution
Fig 2.5 Intensity distribution of an illuminated Phosphor spot on a CRT screen
6
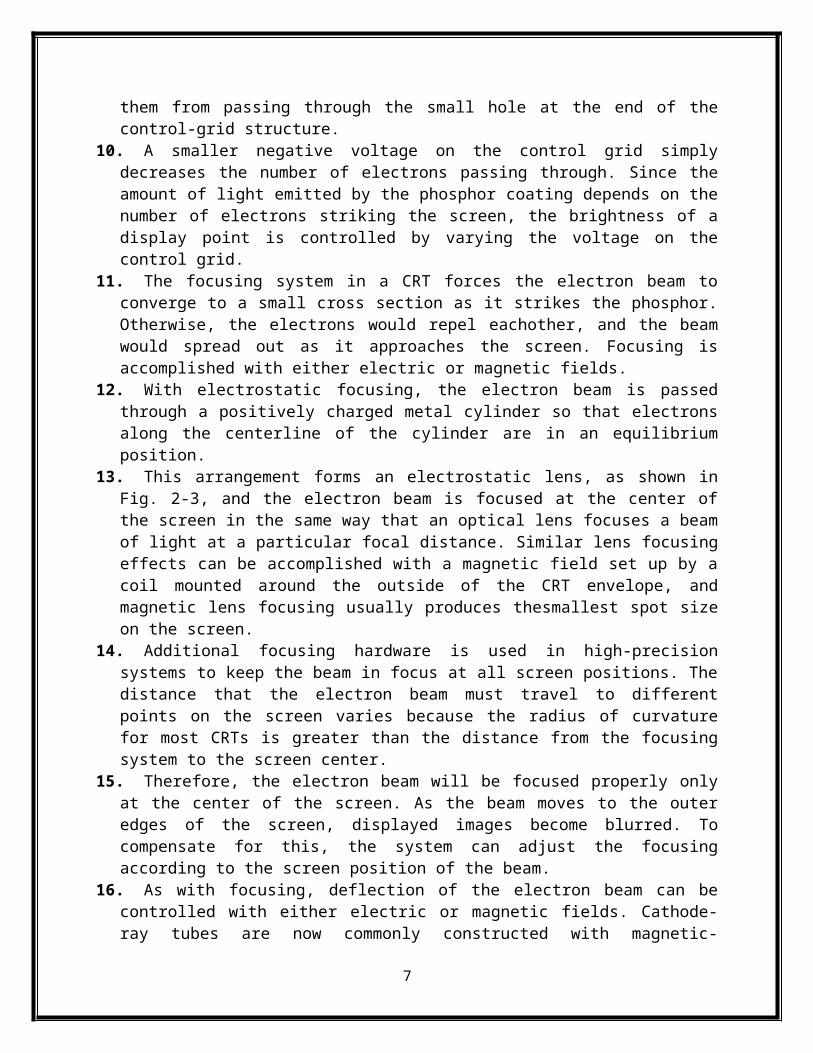
Fig 2.6 Two Illuminated phosphor spots are distinguishable when their separation is greater than the diameter at which a spot intensity has fallen to 60 percent of maximum.
RASTER-SCAN DISPLAYS
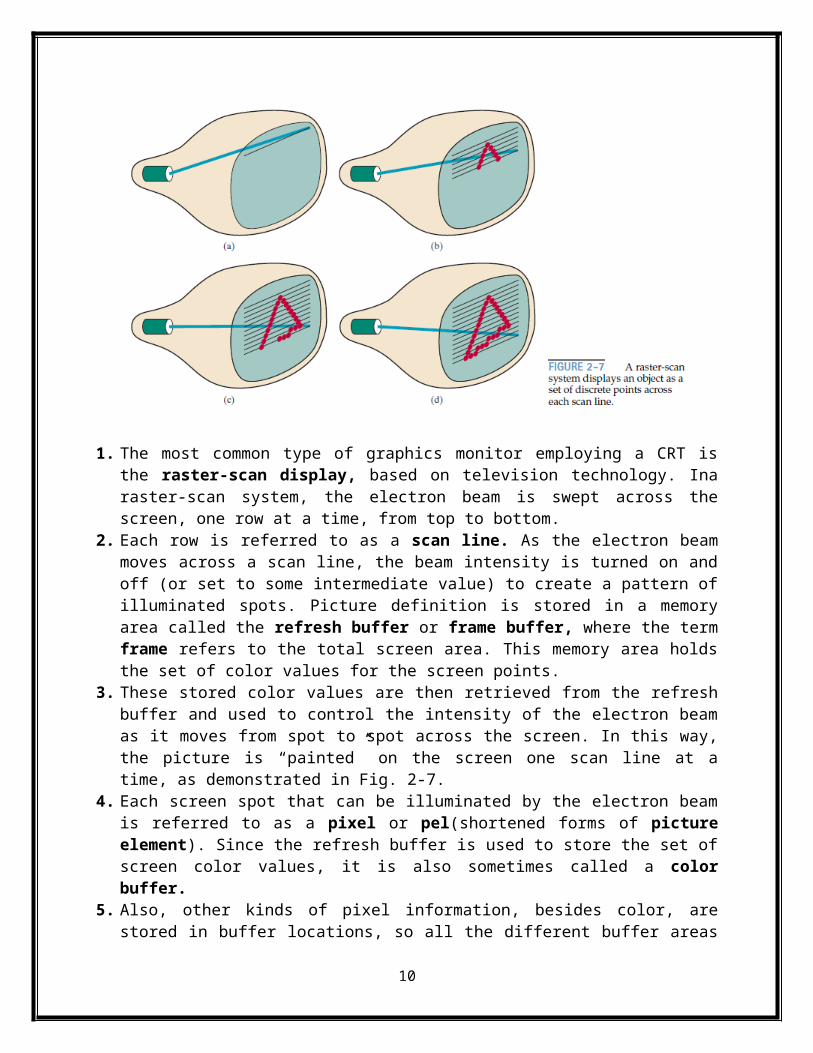
1. The most common type of graphics monitor employing a CRT is the raster-scan display, based on television technology. Ina raster-scan system, the electron beam is swept across the screen, one row at a time, from top to bottom.
2. Each row is referred to as a scan line. As the electron beam moves across a scan line, the beam intensity is turned on and off (or set to some intermediate value) to create a pattern of illuminated spots. Picture definition is stored in a memory area called the refresh buffer or frame buffer, where the term frame refers to the total screen area. This memory area holds the set of color values for the screen points.
3. These stored color values are then retrieved from the refresh buffer and used to control the intensity of the electron beam as it moves from spot to spot across the screen. In this way, the picture is “painted” on the screen one scan line at a time, as demonstrated in Fig. 2-7.
4. Each screen spot that can be illuminated by the electron beam is referred to as a pixel or pel(shortened forms of picture element). Since the refresh buffer is used to store the set of screen color values, it is also sometimes called a color buffer.
5. Also, other kinds of pixel information, besides color, are stored in buffer locations, so all the different buffer areas are sometimes referred to collectively as the “frame buffer”. The capability of a raster-scan system to store color information for each screen point makes it well suited for the realistic display of scenes containing subtle shading and color patterns.
7
6. Home television sets and printers are examples of other systems using raster-scan methods. Raster systems are commonly characterized by their resolution, which is the number of pixel positions that can be plotted.
7. Another property of video monitors is aspect ratio, which is now often defined as the number of pixel columns divided by the number of scan lines that can be displayed by the system. (Sometimes the term aspect ratio is used to refer to the number of scan lines divided by the number of pixel columns.) Aspect ratio can also be described as the number of horizontal points to vertical points (or vice versa) necessary to produce equal-length lines in both directions on the screen.
8. The number of bits per pixel in a frame buffer is sometimes referred to as either the depth of the buffer area or the number of bit planes. Also, a frame buffer with one bit per pixel is commonly called a bitmap, and a frame buffer with multiple bits per pixel is a pixmap.
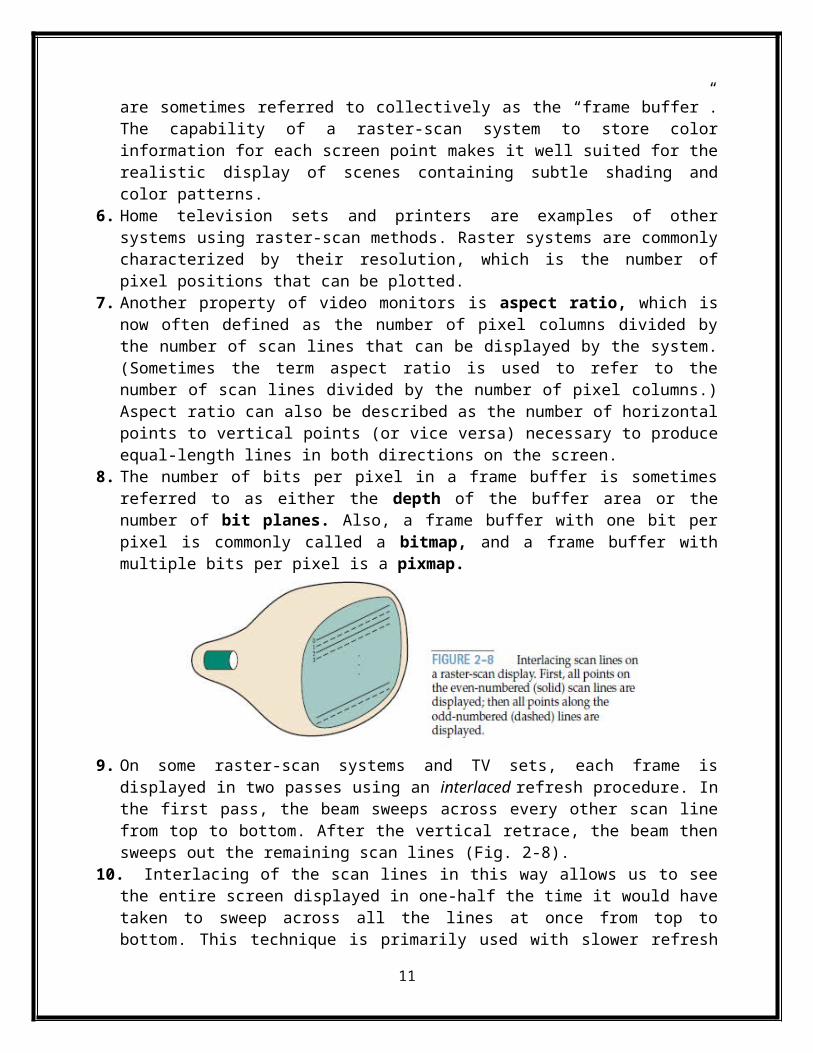
9. On some raster-scan systems and TV sets, each frame is displayed in two passes using an interlaced refresh procedure. In the first pass, the beam sweeps across every other scan line from top to bottom. After the vertical retrace, the beam then sweeps out the remaining scan lines (Fig. 2-8).
10. Interlacing of the scan lines in this way allows us to see the entire screen displayed in one-half the time it would have taken to sweep across all the lines at once from top to bottom. This technique is primarily used with slower refresh rates. On an older, 30 frame per- second, non-interlaced display, for instance, some flicker is noticeable. But with interlacing, each of the two passes can be accomplished in 1/60 of a second, which brings the refresh rate nearer to 60 frames per second. This is an effective technique for avoiding flicker provided that adjacent scan lines contain similar display information.
RANDOM-SCAN DISPLAYS
8
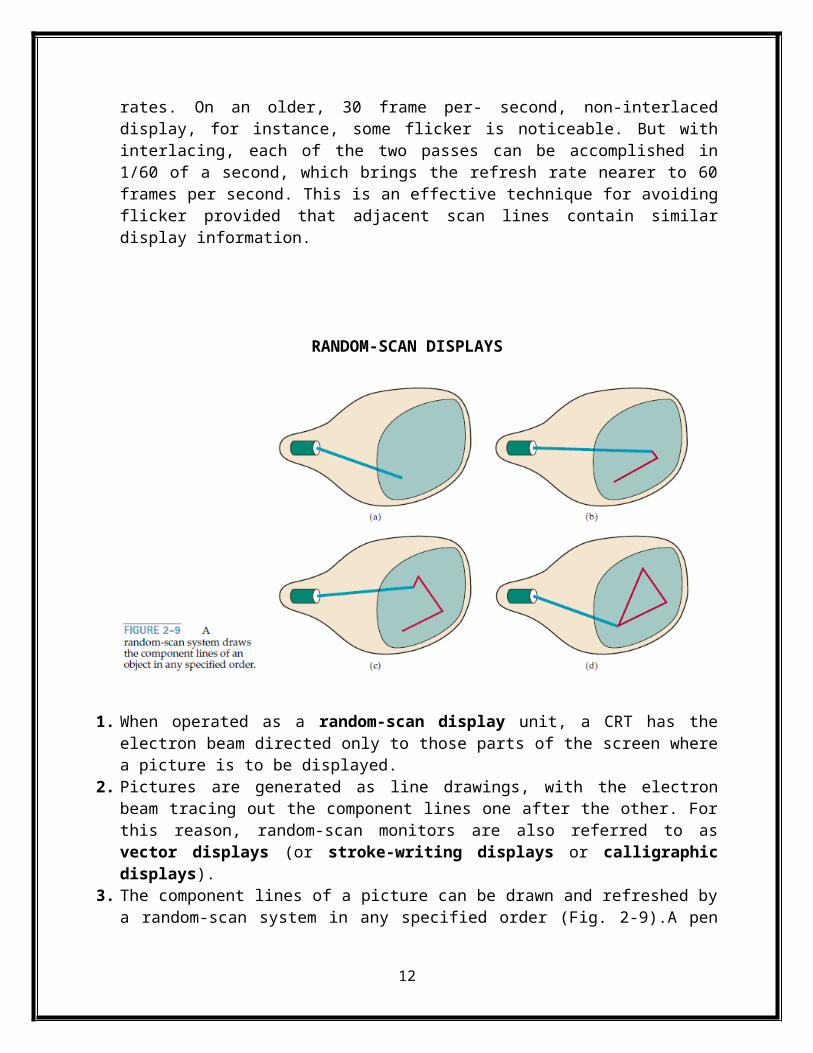
1. When operated as a random-scan display unit, a CRT has the electron beam directed only to those parts of the screen where a picture is to be displayed.
2. Pictures are generated as line drawings, with the electron beam tracing out the component lines one after the other. For this reason, random-scan monitors are also referred to as vector displays (or stroke-writing displays or calligraphic displays).
3. The component lines of a picture can be drawn and refreshed by a random-scan system in any specified order (Fig. 2-9).A pen plotter operates in a similar way and is an example of a random-scan, hard-copy device.
4. Refresh rate on a random-scan system depends on the number of lines to be displayed on that system. Picture definition is now stored as a set of line-drawing commands in an area of memory referred to as the display list, refresh display file, vector file, or display program.
5. To display a specified picture, the system cycles through the set of commands in the display file, drawing each component line in turn. After all line-drawing commands have been processed, the system cycles back to the first line command in the list.
6. Random-scan displays are designed to draw all the component lines of a picture 30 to 60 times each second, with up to 100,000 “short” lines in the display list. When a small set of lines is to be displayed, each refresh cycle is delayed to avoid very high refresh rates, which could burn out the phosphor.
7. Random-scan systems were designed for line-drawing applications, such as architectural and engineering layouts, and they cannot display realistic shaded scenes. Since picture definition is stored as a set of line-drawing instructions rather than as a set of intensity values for all screen points, vector displays generally have higher resolutions than raster systems.
8. Also, vector displays produce smooth line drawings because the CRT beam directly follows the line path. A raster system, by contrast, produces jagged lines that are plotted as discrete point sets. However, the greater flexibility and improved line-drawing capabilities of raster systems have resulted in the abandonment of vector technology.
COLOR CRT MONITORS
9
1. A CRT monitor displays color pictures by using a combination of phosphors that emit different-colored light.
2. The emitted light from the different phosphors merges to form a single perceived color, which depends on the particular set of phosphors that have been excited. One way to play color pictures is to coat the screen with layers of different colored phosphors. The emitted color depends on how far the electron beam penetrates into the phosphor layers. This approach, called the beam-penetration method, typically used only two phosphor layers: red and green.
3. A beam of slow electrons excites only the outer red layer, but a beam of very fast electrons penetrates through the red layer and excites the inner green layer. At intermediate beam speeds, combinations of red and green light are emitted to show two additional colors, orange and yellow.
4. The speed of the electrons, and hence the screen color at any point, is controlled by the beam acceleration voltage. Beam penetration has been an inexpensive way to produce color, but only a limited number of colors are possible, and picture quality is not as good as with other methods.
5. Shadow-mask methods are commonly used in raster-scan systems (including color TV) since they produce a much wider range of colors than the beam penetration method. This approach is based on the way that we seem to perceive colors as combinations of red, green, and blue components, called the RGB color model.
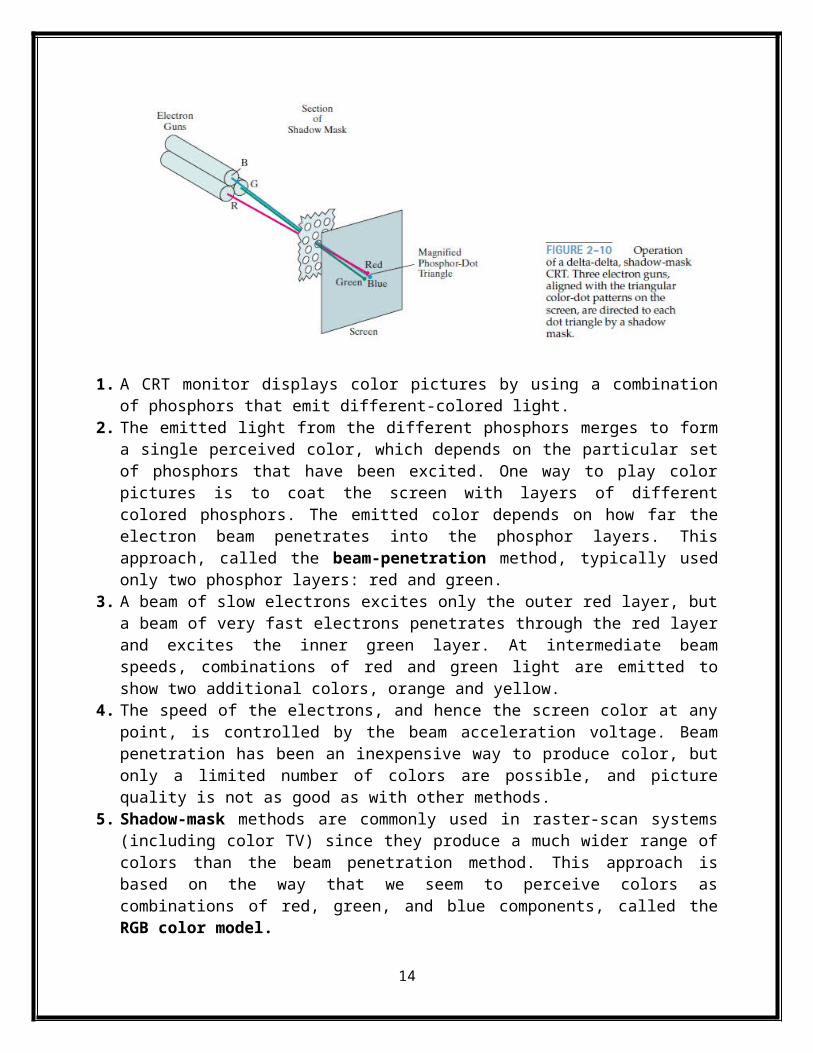
6. Thus, a shadow-mask CRT uses three phosphor color dots at each pixel position. One phosphor dot emits a red light, another emits a green light, and the third emits a blue light. This type of CRT has three electron guns, one for each color dot, and a shadow-mask grid just behind the phosphor-coated screen. The light emitted from the three phosphors results in a small spot of color at each pixel position, since our eyes tend to merge the light emitted from the three dots into one composite color.
7. Figure 2-10 illustrates the delta-delta shadow-mask method, commonly used in color CRT systems. The three electron beams are deflected and focused as a group onto the shadow mask, which contains a series of holes aligned with the phosphor-dot patterns. When the three beams pass through a hole in the shadow mask, they activate a dot triangle, which appears as a small color spot on the screen. The phosphor dots in the triangles are arranged so
10
that each electron beam can activate only its corresponding color dot when it passes through the shadow mask. Another configuration for the three electron guns is an in-line arrangement in which the three electron guns, and the corresponding red-green-blue color dots on the screen, are aligned along one scan line instead of in a triangular pattern. This in-line arrangement of electron guns is easier to keep in alignment and is commonly used in high-resolution color CRTs.
8. Composite monitors are adaptations of TV sets that allow bypass of the broadcast circuitry. These display devices still require that the picture information be combined, but no carrier signal is needed. Since picture information is combined into a composite signal and then separated by the monitor, the resulting picture quality is still not the best attainable.
9. Color CRTs in graphics systems are designed as RGB monitors. These monitors use shadow-mask methods and take the intensity level for each electron gun (red, green, and blue) directly from the computer system without any intermediate processing. High-quality raster-graphics systems have 24 bits per pixel in the frame buffer, allowing 256 voltage settings for each electron gun and nearly 17 million color choices for each pixel. An RGB color systemwith24 bits of storage per pixel is generally referred to as a full-color system or a true-color system.
FLAT-PANEL DISPLAYS
1. The term flat-panel display refers to a class of video devices that have reduced volume, weight, andpower requirements compared to a CRT.
2. A significant feature of flat-panel displays is that they are thinner than CRTs, and we can hang them on walls or wear them on our wrists. Since we can even write on some flat-panel displays, they are also available as pocket notepads. Some additional uses for flat-panel displays are as small TV monitors, calculator screens, pocket video-game screens, laptop computer screens, armrest movie-viewing stations on airlines, advertisement boards in elevators, and graphics displays in applications requiring rugged, portable monitors.
3. We can separate flat-panel displays into two categories: emissive displays and nonemissive displays. The emissive displays (or emitters) are devices that convert electrical energy into light.
4. Plasma panels, thin-film electroluminescent displays, and light-emitting diodes are examples of emissive displays. Flat CRTs have also been devised, in which electron beams are accelerated parallel to the screen and then deflected 90r onto the screen. But flat CRTs have not proved to be as successful as other emissive devices.
5. Non emissive displays (or nonemitters) use optical effects to convert sunlight or light from some other source into graphicspatterns. The most important example of a nonemissive flat-panel display is a liquid-crystal device.
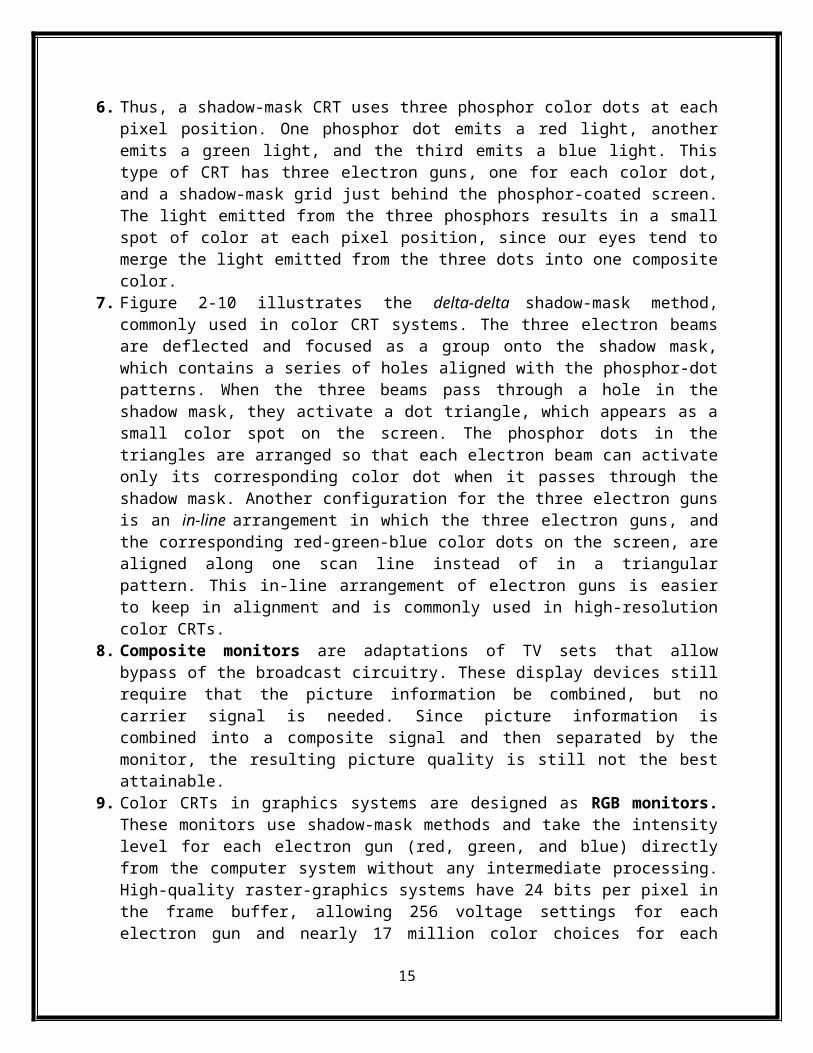
6. Plasma panels, also called gas-discharge displays, are constructed by filling the region between two glass plates with a mixture of gases that usually includes neon. A series of vertical conducting ribbons is placed on one glass panel, and a set of horizontal conducting ribbons is built into the other glass panel (Fig. 2-11).
11
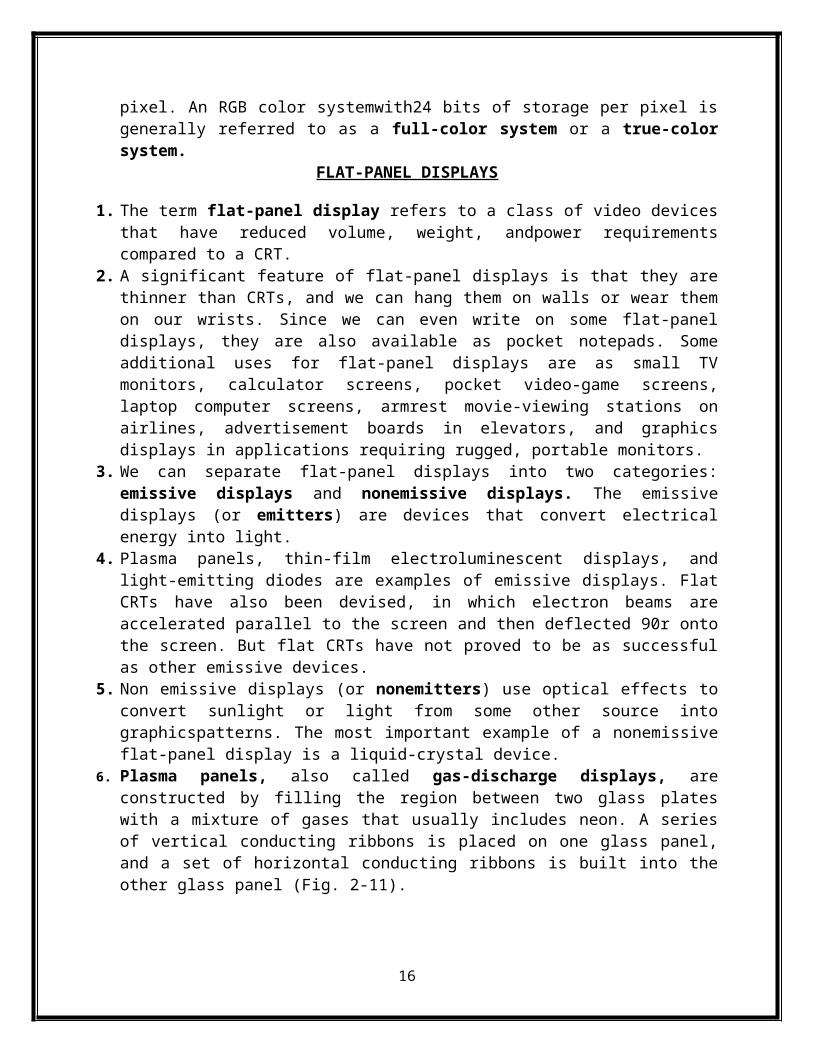
7. Thin-film electroluminescent displays are similar in construction to plasma panels. The difference is that the region between the glass plates is filled with a phosphor, such as zinc sulfide doped with manganese, instead of a gas (Fig. 2-13). When a sufficiently high voltage is applied to a pair of crossing electrodes, the phosphor becomes a conductor in the area of the intersection of the two electrodes.
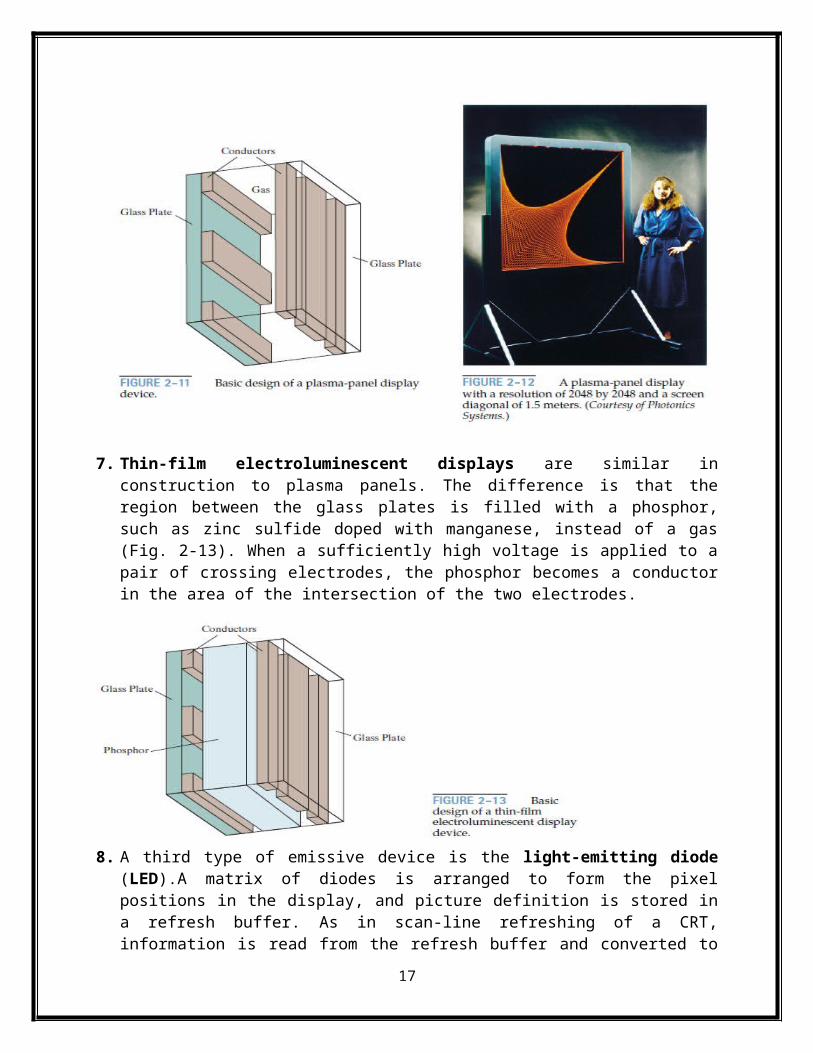
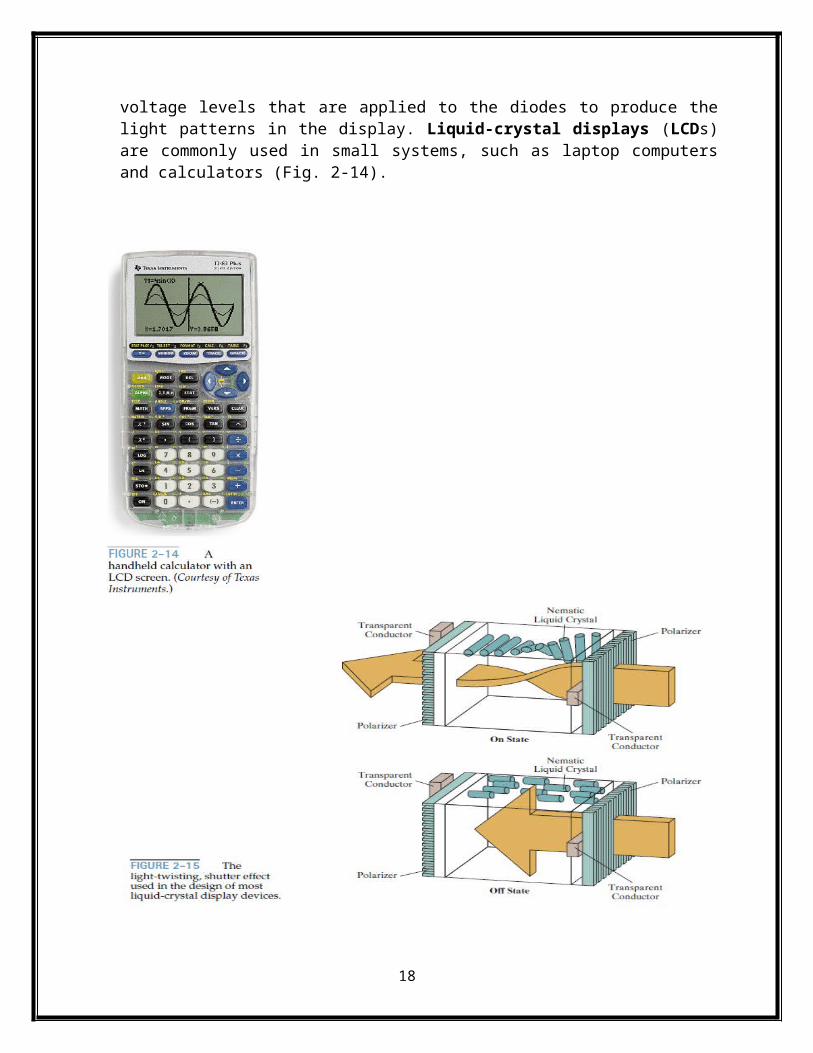
8. A third type of emissive device is the light-emitting diode (LED).A matrix of diodes is arranged to form the pixel positions in the display, and picture definition is stored in a refresh buffer. As in scan-line refreshing of a CRT, information is read from the refresh buffer and converted to voltage levels that are applied to the diodes to produce the light patterns in the display. Liquid-crystal displays (LCDs) are commonly used in small systems, such as laptop computers and calculators (Fig. 2-14).
12
9. The term liquid crystal refers to the fact that these compounds have a crystalline arrangement of molecules, yet they flow like a liquid. Flat-panel displays commonly use nematic (threadlike) liquid-crystal compounds that tend to keep the long axes of the rod-shaped molecules aligned. The intersection of two conductors defines a pixel position. Normally, the molecules are aligned as shown in the “on state” of Fig. 2-15.
10. Polarized light passing through the material is twisted so that it will pass through the opposite polarizer. The light is then reflected back to the viewer. To turn off the pixel, weapply a voltage to the two intersecting conductors toalign the molecules so that the light is not twisted. This type of flat-panel device is referred to as a passive-matrix LCD.
13
THREE-DIMENSIONAL VIEWING DEVICES
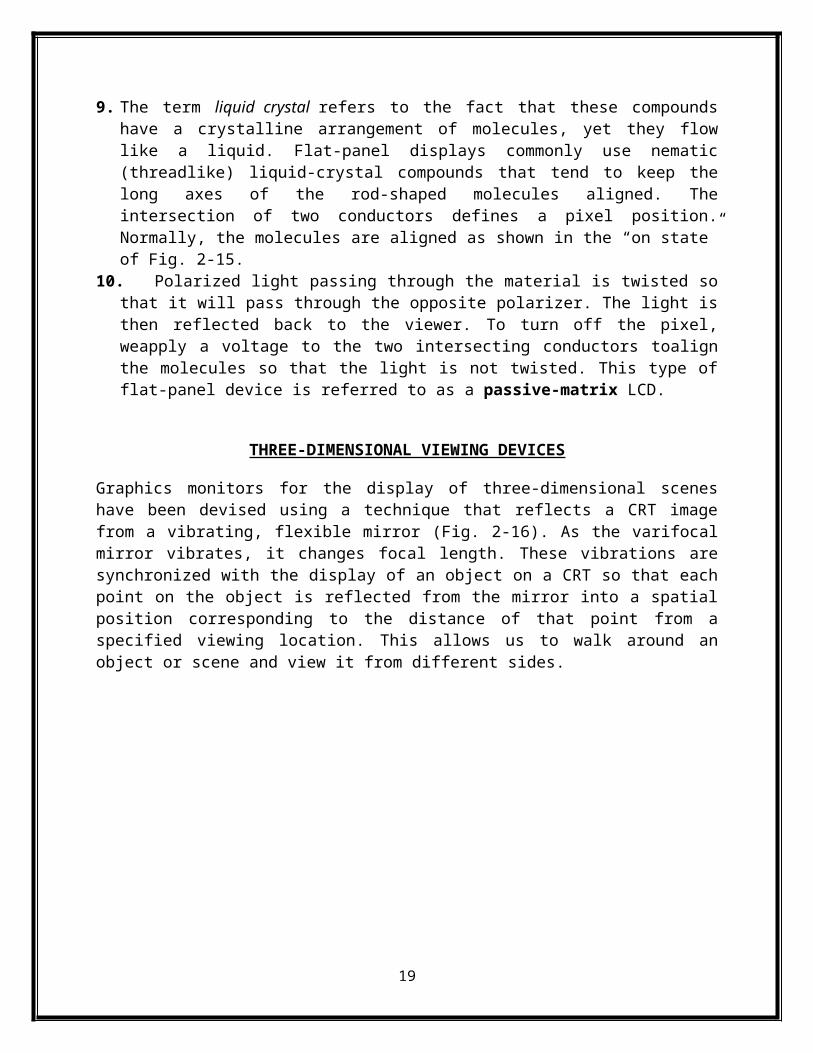
Graphics monitors for the display of three-dimensional scenes have been devised using a technique that reflects a CRT image from a vibrating, flexible mirror (Fig. 2-16). As the varifocal mirror vibrates, it changes focal length. These vibrations are synchronized with the display of an object on a CRT so that each point on the object is reflected from the mirror into a spatial position corresponding to the distance of that point from a specified viewing location. This allows us to walk around an object or scene and view it from different sides.
STEREOSCOPIC AND VIRTUAL-REALITY SYSTEMS
1. One way to produce a stereoscopic effect on a raster system is to display each of the two views on alternate refresh cycles. The screen is viewed through glasses, with each lens designed to act as a rapidly alternating shutter that is synchronized to block out one of the views.
2. To obtain a stereoscopic projection, we must obtain two views of a scene generated with viewing directions along the lines from the position of each eye (left and right) to the scene. We can construct the two views as computer-generated scenes with different viewing positions, or we can use a stereo camera pair to photograph an object or scene.
3. Stereoscopic viewing is also a component in virtual-reality systems, where users can step into a scene and interact with the environment.
2.2 RASTER-SCAN SYSTEMS
14
VIDEO CONTROLLER
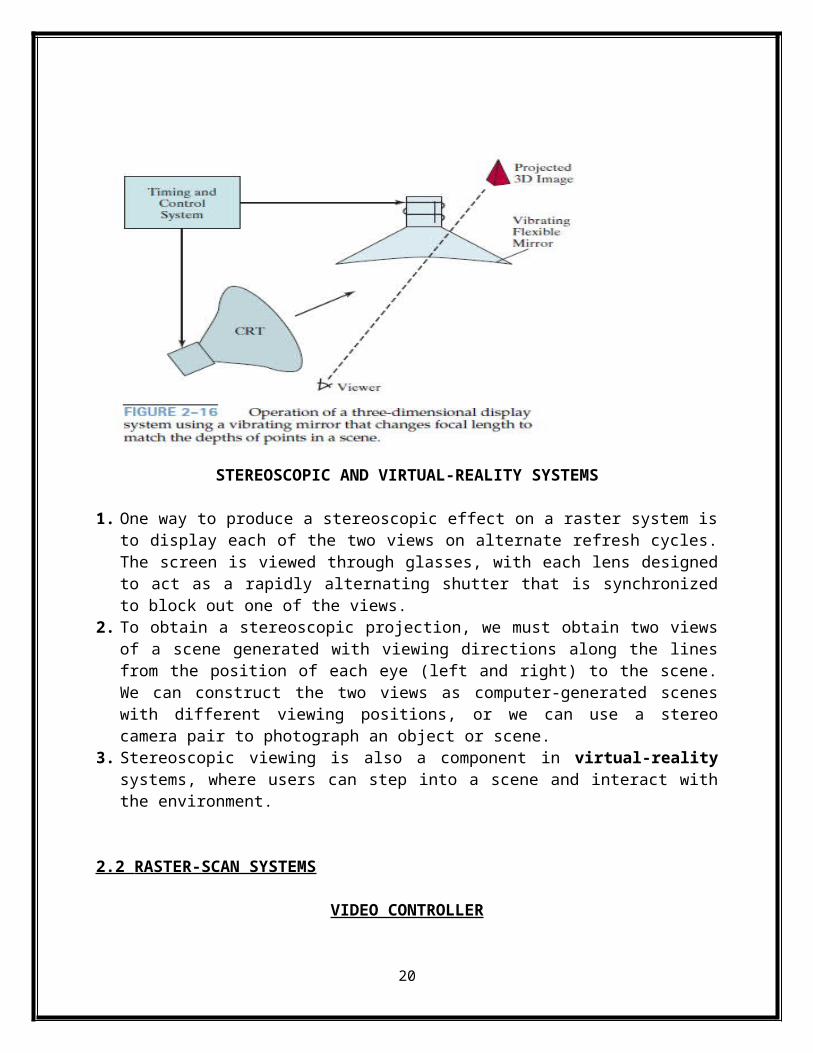
1. Figure 2-25 shows a commonly used organization for raster systems. A fixed area of the system memory is reserved for the frame buffer, and the video controller is given direct access to the frame-buffer memory. Frame-buffer locations, and the corresponding screen positions, are referenced in Cartesian coordinates. In an application program, we use the commands within a graphics software package to set coordinate positions for displayed objects relative to the origin of the Cartesian reference frame.
2. Figure 2-26 shows a two-dimensional Cartesian reference frame with the origin at the lower-left screen corner. The screen surface is then represented as the first quadrant of a two-
15
dimensional system, with positive x values increasing from left to right and positive y values increasing from the bottom of the screen to the top. Pixel positions are then assigned integer x values that range from 0 to xmax across the screen, left to right, and integer y values that vary from 0 to ymax, bottom to top
3. In Fig. 2-27, the basic refresh operations of the video controller are diagrammed. Two registers are used to store the coordinate values for the screen pixels. Initially, the x register is set to 0 and the y register is set to the value for the top scan line.
4. Since the screen must be refreshed at a rate of at least 60 frames per second, the simple procedure illustrated in Fig. 2-27may not be accommodated by typical RAM chips if the cycle time is too slow.
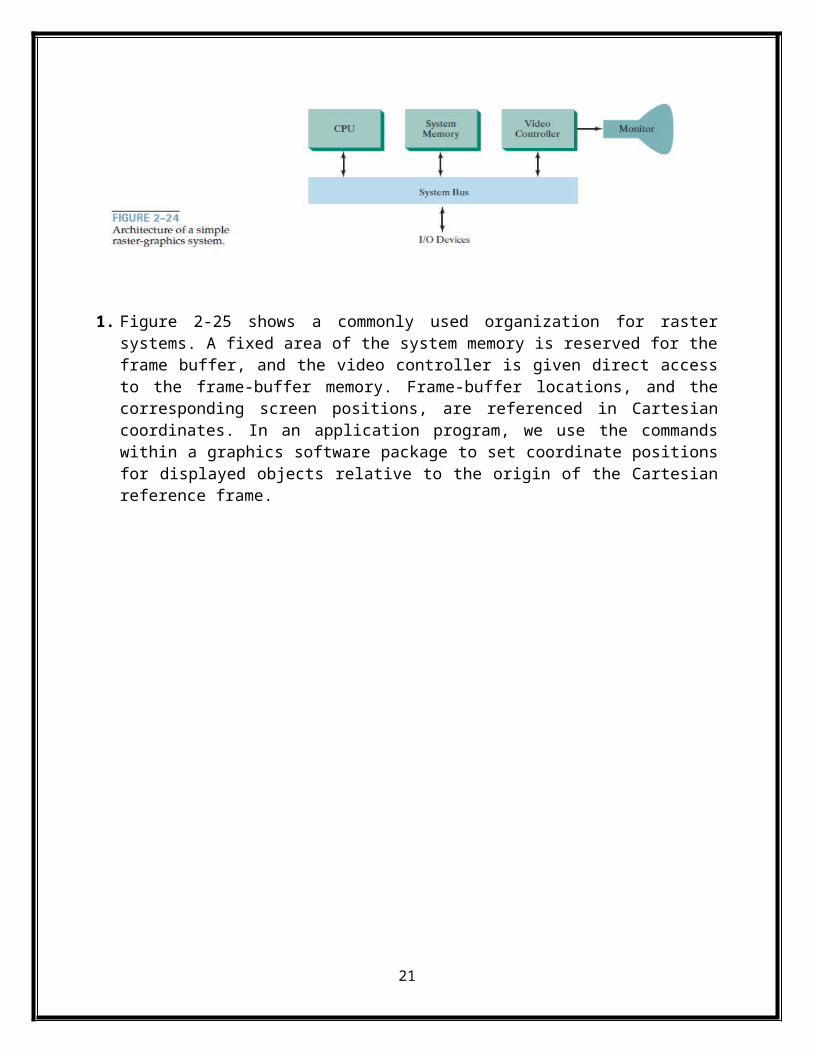
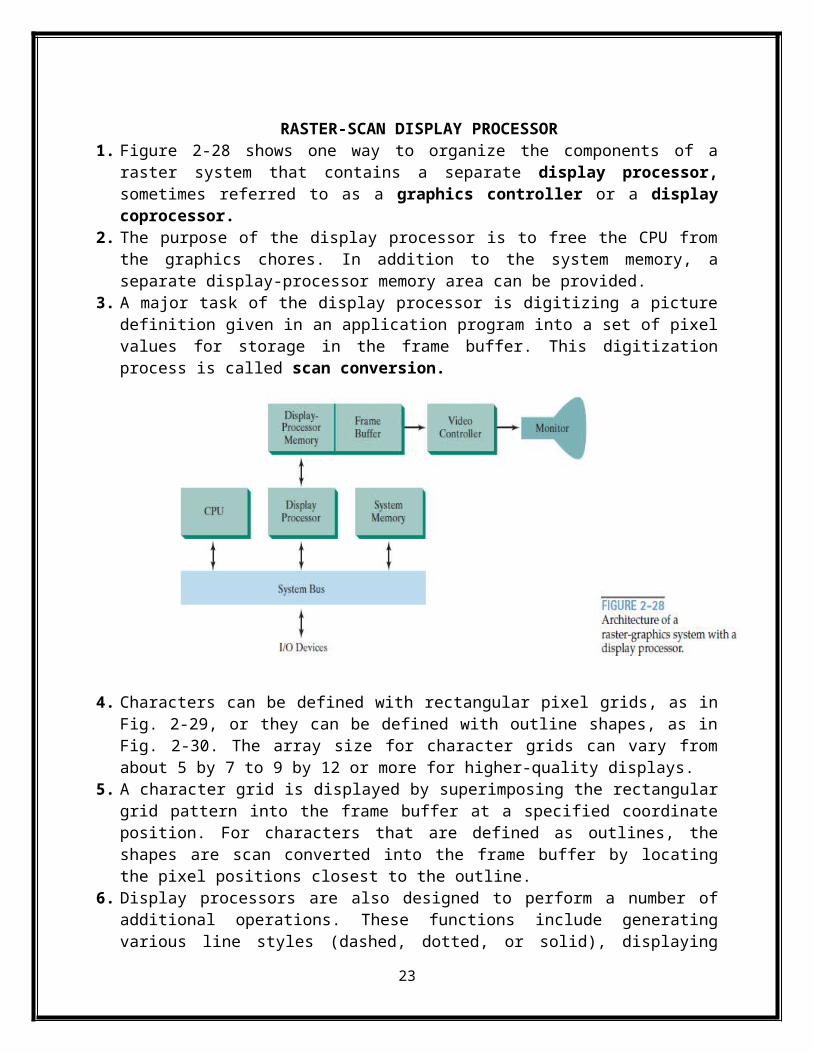
RASTER-SCAN DISPLAY PROCESSOR1. Figure 2-28 shows one way to organize the components of a raster system that contains a
separate display processor, sometimes referred to as a graphics controller or a display coprocessor.
2. The purpose of the display processor is to free the CPU from the graphics chores. In addition to the system memory, a separate display-processor memory area can be provided.
3. A major task of the display processor is digitizing a picture definition given in an application program into a set of pixel values for storage in the frame buffer. This digitization process is called scan conversion.
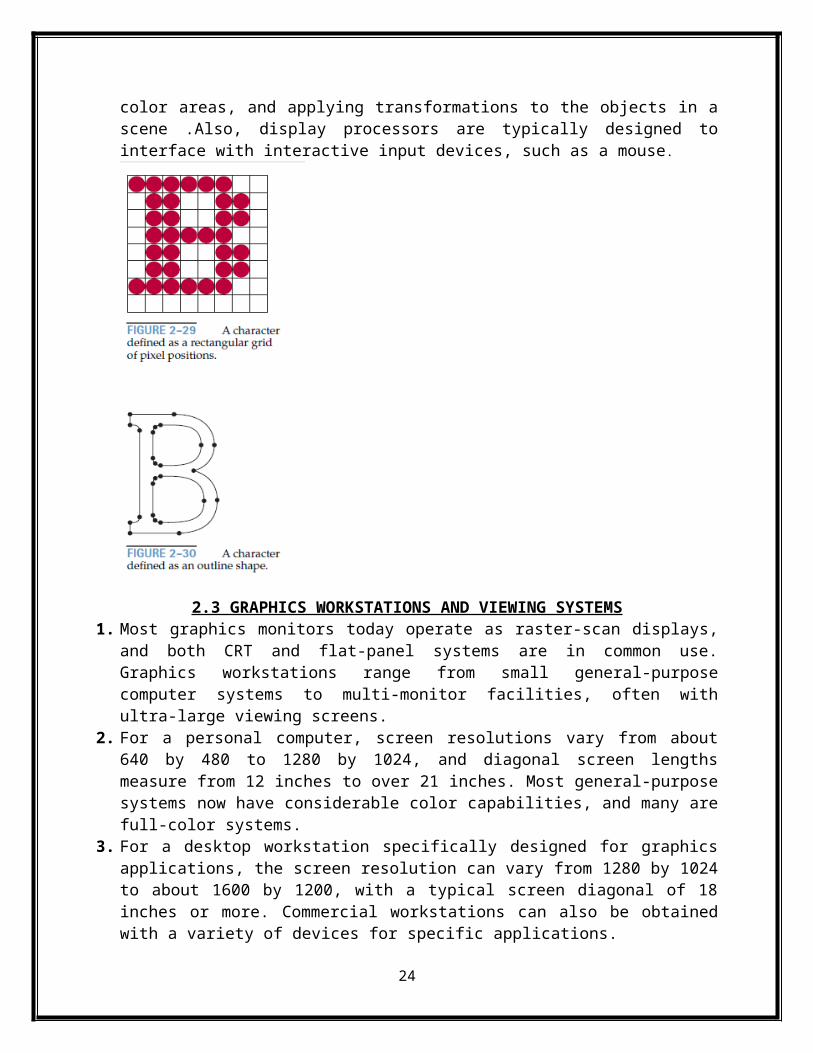
4. Characters can be defined with rectangular pixel grids, as in Fig. 2-29, or they can be defined with outline shapes, as in Fig. 2-30. The array size for character grids can vary from about 5 by 7 to 9 by 12 or more for higher-quality displays.
5. A character grid is displayed by superimposing the rectangular grid pattern into the frame buffer at a specified coordinate position. For characters that are defined as outlines, the shapes are scan converted into the frame buffer by locating the pixel positions closest to the outline.
6. Display processors are also designed to perform a number of additional operations. These functions include generating various line styles (dashed, dotted, or solid), displaying color
16
areas, and applying transformations to the objects in a scene .Also, display processors are typically designed to interface with interactive input devices, such as a mouse.
2.3 GRAPHICS WORKSTATIONS AND VIEWING SYSTEMS1. Most graphics monitors today operate as raster-scan displays, and both CRT and flat-panel
systems are in common use. Graphics workstations range from small general-purpose computer systems to multi-monitor facilities, often with ultra-large viewing screens.
2. For a personal computer, screen resolutions vary from about 640 by 480 to 1280 by 1024, and diagonal screen lengths measure from 12 inches to over 21 inches. Most general-purpose systems now have considerable color capabilities, and many are full-color systems.
3. For a desktop workstation specifically designed for graphics applications, the screen resolution can vary from 1280 by 1024 to about 1600 by 1200, with a typical screen diagonal of 18 inches or more. Commercial workstations can also be obtained with a variety of devices for specific applications.
2.4 INPUT DEVICES
KEYBOARDS, BUTTON BOXES, AND DIALS1. An alphanumeric keyboard on a graphics system is used primarily as a device for entering
text strings, issuing certain commands, and selecting menu options. 2. The keyboard is an efficient device for inputting such nongraphic data as picture labels
associated with a graphics display. Keyboards can also be provided with features to facilitate entry of screen coordinates, menu selections, or graphics functions.
3. Cursor-control keys and function keys are common features on general purpose keyboards. Function keys allow users to select frequently accessed operations with a single keystroke,
17
and cursor-control keys are convenient for selecting a displayed object or a location by positioning the screen cursor.
4. A keyboard can also contain other types of cursor-positioning devices, such as a trackball or joystick, along with a numeric keypad for fast entry of numeric data.
MOUSE DEVICESA typical design for one-button mouse, which is a small hand-held unit that is usually moved around on a flat surface to position the screen cursor. Wheels or rollers on the bottom of the mouse can be used to record the amount and direction of movement. Additional features can be included in the basic mouse design to increase the number of allowable input parameters
TRACKBALLS AND SPACEBALLS1. A trackball is a ball device that can be rotated with the fingers or palm of the hand to
produce screen-cursor movement. Potentiometers, connected to the ball, measure the amount and direction of rotation.
2. Laptop keyboards are often equipped with a trackball to eliminate the extra space required by a mouse. An extension of the two-dimensional trackball concept is the spaceball which provides six degrees of freedom.
3. Unlike the trackball, a space balldoes not actually move. Strain gauges measure the amount of pressure applied to the space ball to provide input for spatial positioning and orientation as the ball is pushed or pulled in various directions.
JOYSTICKSAnother positioning device is the joystick, which consists of a small, vertical lever (called the stick) mounted on a base. Pressure-sensitive joysticks, also called isometric joysticks, have a non-movable stick. A push or pull on the stick is measured with strain gauges and converted to movement of the screen cursor in the direction of the applied pressure.
DATA GLOVESA data glove that can be used to grasp a “virtual object”. The glove is constructed with a series of sensors that detect hand and finger motions. Electromagnetic coupling between transmitting antennas and receiving antennas are used to provide information about the position and orientation of the hand.
DIGITIZERS1. A common device for drawing, painting, or interactively selecting positions is a digitizer.
These devices can be designed to input coordinate values in either a two-dimensional or a three-dimensional space.
2. One type of digitizer is the graphics tablet (also referred to as a data tablet), which is used to input two-dimensional coordinates by activating a hand cursor or stylus at selected positions on a flat surface
3. An acoustic (or sonic) tablet uses sound waves to detect a stylus position. Either strip microphones or point microphones can be employed to detect the sound emitted by an electrical spark from a stylus tip.
18
4. The position of the stylus is calculated by timing the arrival of the generated sound at the different microphone positions. An advantage of two-dimensional acoustic tablets is that the microphones can be placed on any surface to form the “tablet” work area.
5. For example, the microphones could be placed on a book page while a figure on that page is digitized.
6. Three-dimensional digitizers use sonic or electromagnetic transmissions to record positions.
IMAGE SCANNERSDrawings, graphs, photographs, or text can be stored for computer processing with an image scanner by passing an optical scanning mechanism over the information to be stored.
TOUCH PANELS1. Touch panels allow displayed objects or screen positions to be selected with the touch of a
finger. Atypical application of touch panels is for the selection of processing options that are represented as a menu of graphical icons.
2. Some monitors, such as the plasma panels are designed with touch screens. 3. Other systems can be adapted for touch input by fitting a transparent device containing a
touch-sensing mechanism over the video monitor screen.
LIGHT PENS1. Such pencil-shaped devices are used to select screen positions by detecting the light coming
from points on the CRT screen. 2. They are sensitive to the short burst of light emitted from the phosphor coating at the instant
the electron beam strikes a particular point. Other light sources, such as the background light in the room, are usually not detected by a light pen.
3. An activated light pen, pointed at a spot on the screen as the electron beam lights up that spot, generates an electrical pulse that causes the coordinate position of the electron beam to be recorded.
VOICE SYSTEMS1. The voice system input can be used to initiate graphics operations or to enter data. 2. These systems operate by matching an input against a predefined dictionary of words and
phrases. A dictionary is set up by speaking the command words several times. 3. The system then analyzes each word and establishes a dictionary of word frequency patterns,
along with the corresponding functions that are to be performed.
2.5 HARD – COPY DEVICES1. Printers produce output by either impact or nonimpact methods. Impact printer’s press
formed character faces against an inked ribbon onto the paper. A line printer is an example of an impact device, with the typefaces mounted on bands, chains, drums, or wheels
2. Nonimpact printers and plotters use laser techniques, ink-jet sprays, electrostatic methods, and electro thermal methods to get images onto paper.
3. Character impact printers often have a dot-matrix print head containing a rectangular array of protruding wire pins, with the number of pins dependent upon the quality of the printer.
19
4. In a laser device, a laser beam creates a charge distribution on a rotating drum coated with a photoelectric material, such as selenium. Toner is applied to the drum and then transferred to paper.
5. Ink-jet methods produce output by squirting ink in horizontal rows across a roll of paper wrapped on a drum. The electrically charged ink stream is deflected by an electric field to produce dot-matrix patterns.
2.6 GRAPHICS NETWORKS1. A graphics monitor on a network is generally referred to as a graphics server, or simply a
server. 2. Often, the monitor includes standard input devices such as a keyboard and a mouse or
trackball. In that case, the system can provide input, as well as being an output server. 3. The computer on the network that is executing a graphics application program is called the
client, and the output of the program is displayed on a server.4. A workstation that includes processors, as well as a monitor and input devices, can function
as both a server and a client. When operating on a network, a client computer transmits the instructions for displaying a picture to the monitor (server).
2.7 GRAPHICS ON THE INTERNET 1. A great deal of graphics development is now done on the Internet, which is a global network
of computer networks. 2. Computers on the Internet communicate using TCP/IP (transmission control
protocol/internetworking protocol).3. In addition, the World Wide Web provides a hypertext system that allows users to locate
and view documents that can contain text, graphics, and audio. Resources, such as graphics files, are identified by a uniform resource locator (URL).
4. Documents on the Internet can be constructed with the Hypertext Markup Language (HTML). The development of HTML provided a simple method for describing a document containing text, graphics, and references (hyperlinks) to other documents.
2.8 GRAPHICS SOFTWARE 1. There are two broad classifications for computer-graphics software: special purpose packages
and general programming packages. 2. Special-purpose packages are designed for nonprogrammers who want to generate pictures,
graphs, or charts in some application area without worrying about the graphics procedures that might be needed to produce such displays.
3. A set of graphics functions is often called a computer-graphics application programming interface (CG API), because the library provides a software interface between a programming language (such as C++) and the hardware.
COORDINATE REPRESENTATIONS
1. In general, several different Cartesian reference frames are used in the process of constructing and displaying a scene.
2. First, we can define the shapes of individual objects, such as trees or furniture, within a separate coordinate reference frame for each object.
20
3. These reference frames are called modeling coordinates, or sometimes local coordinates or master coordinates. Once the individual object shapes have been specified, we can construct (“model”) a scene by placing the objects into appropriate locations within a scene reference frame called world coordinates.
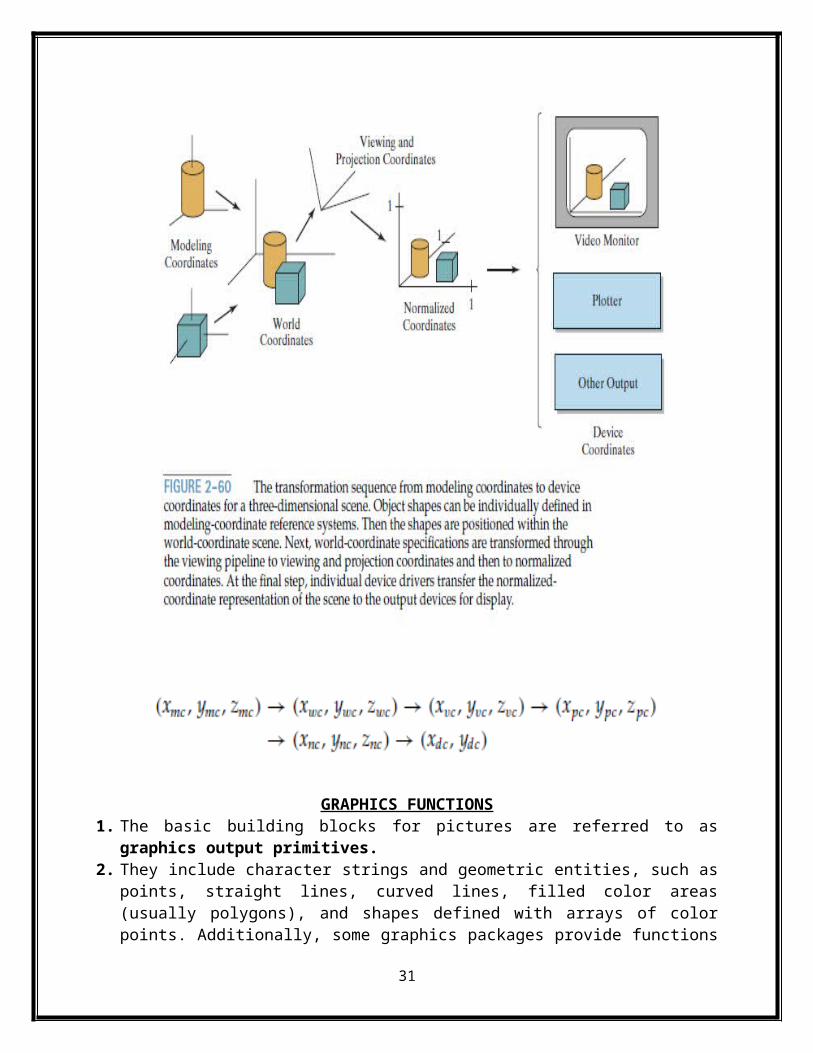
4. After all parts of a scene have been specified, the overall world-coordinate description is processed through various routines on to one or more output-device reference frames for display. This process is called the viewing pipeline.
5. The coordinate systems for display devices are generally called device coordinates, or screen coordinates in the case of a video monitor.
6. Often, both normalized coordinates and screen coordinates are specified in a left handed coordinate reference frame so that increasing positive distances from thexy plane (the screen, or viewing plane) can be interpreted as being farther from the viewing position.
21

GRAPHICS FUNCTIONS1. The basic building blocks for pictures are referred to as graphics output primitives. 2. They include character strings and geometric entities, such as points, straight lines, curved
lines, filled color areas (usually polygons), and shapes defined with arrays of color points. Additionally, some graphics packages provide functions for displaying more complex shapes such as spheres, cones, and cylinders.
3. Routines for generating output primitives provide the basic tools for constructing pictures.4. Attributes are properties of the output primitives; that is, an attribute describes how a
particular primitive is to be displayed. 5. This includes color specifications, line styles, text styles, and area-filling patterns. We can
change the size, position, or orientation of an object within a scene using geometric transformations.
6. Some graphics packages provide an additional set of functions for performing modeling transformations, which are used to construct a scene where individual object descriptions are given in local coordinates.
7. Viewing transformations are used to select a view of the scene, the type of projection to be used, and the location on a video monitor where the view is to be displayed. Other routines are available for managing the screen display area by specifying its position, size, and structure. For three-dimensional scenes, visible objects are identified and the lighting conditions are applied.
8. Interactive graphics applications make use of various kinds of input devices, including a mouse, a tablet, or a joystick. Input functions are used to control and process the data flow from these interactive devices.
SOFTWARE STANDARDS
1. International and national standards-planning organizations in many countries have cooperated in an effort to develop a generally accepted standard for computer graphics.
2. After considerable effort, this work on standards led to the development of the Graphical Kernel System (GKS) in 1984.
3. This system was adopted as the first graphics software standard by the International Standards Organization (ISO) and by various national standards organizations, including the American National Standards Institute (ANSI).
4. Although GKS was originally designed as a two-dimensional graphics package, a three-dimensional GKS extension was soon developed.
5. The second software standard to be developed and approved by the standards organizations was PHIGS (Programmer’s Hierarchical Interactive Graphics Standard), which is an extension of GKS. Increased capabilities for hierarchical object modeling, color specifications, surface rendering, and picture manipulations are provided in PHIGS.
22
OTHER GRAPHICS PACKAGES
1. A package called Open Inventor furnishes a set of object-oriented routines for describing a scene that is to be displayed with calls to OpenGL.
2. The Virtual-Reality Modeling Language (VRML), which began as a subset of Open Inventor, allows us to set up three-dimensional models of virtual worlds on the Internet.
2.9 INTRODUCTION TO OpenGL
Function names in the OpenGL basic library (also called the OpenGL corelibrary) are prefixed with gl, and each component word within a function name has its first letter capitalized. The following examples illustrate this naming convention.
glBegin, glClear, glCopyPixels, glPolygonMode
Certain functions require that one (or more) of their arguments be assigned a symbolic constant specifying, for instance, a parameter name, a value for a parameter, or a particular mode. All such constants begin with the uppercase letters GL. In addition, component words within a constant name are written incapital letters, Andtheunderscore ( ) isused asaseparator between all component words in the name. Following are a fewexamples of the several hundred symbolic constants available for use with OpenGL functions.
GL_2D, GL_RGB, GL_CCW, GL_POLYGON, GL_AMBIENT_AND_DIFFUSE
The OpenGL functions also expect specific data types. For example, an OpenGL function parameter might expect a value that is specified as a 32-bit integer. But the size of an integer specification can be different on different machines. To indicate a specific data type, OpenGL uses special built-in, data-type names, such as
GLbyte, GLshort, GLint, GLfloat, GLdouble, GLboolean
Each data-type name begins with the capital letters GL and the remainder of the name is a standard data-type designation, written in lower-case letters. Some arguments of OpenGL functions can be assigned values using an array that lists a set of data values. This is an option for specifying a list of values as a pointer to an array, rather than specifying each element of the list explicitly as a parameter argument. A typical example of the use of this option is in specifying xyz coordinate values.
HEADER FILESSo the source file in this case would begin with#include <windows.h>#include <GL/gl.h>#include <GL/glu.h>
23
PHIGS Workstations Workstation generally, the tern refers to a computer system with a combination of input and output devices that is designed for a single user. In PHIGS and GKS, however, the term workstation is used to identify various combinations of graphics hardware and software.
A PHIGS workstation can be a single output device, a single input device, a combination of input and output devices, a file, or even a window displayed on a video monitor. To define and use various "workstations" within an applications program, we need to specify a workstation identifier and the workstation type. The following statements give the general structure of a PHIGS program:
openphigs (errorFile, memorysize) openworkstation (ws, connection. type) {create and display picture} closeworkstation (ws) closephigs
OUTPUT PRIMITIVES
1. Points and Lines Point plotting is accomplished by converting a single coordinate position furnished by an application program into appropriate operations for the output device.
2. With a CRT monitor, for example, the electron beam is turned on to illuminate the screen phosphor at the selected location
3. Line drawing is accomplished by calculating intermediate positions along the line path between two specified end points positions.
4. An output device is then directed to fill in these positions between the end points Digital devices display a straight line segment by plotting discrete points between the two end points.
5. Discrete coordinate positions along the line path are calculated from the equation of the line.
6. For a raster video display, the line color (intensity) is then loaded into the frame buffer at the corresponding pixel coordinates. Reading from the frame buffer, the video controller then plots “the screen pixels”.
7. Pixel positions are referenced according to scan-line number and column number (pixel position across a scan line). Scan lines are numbered consecutively from 0, starting at the bottom of the screen; and pixel columns are numbered from 0, left to right across each scan line
24
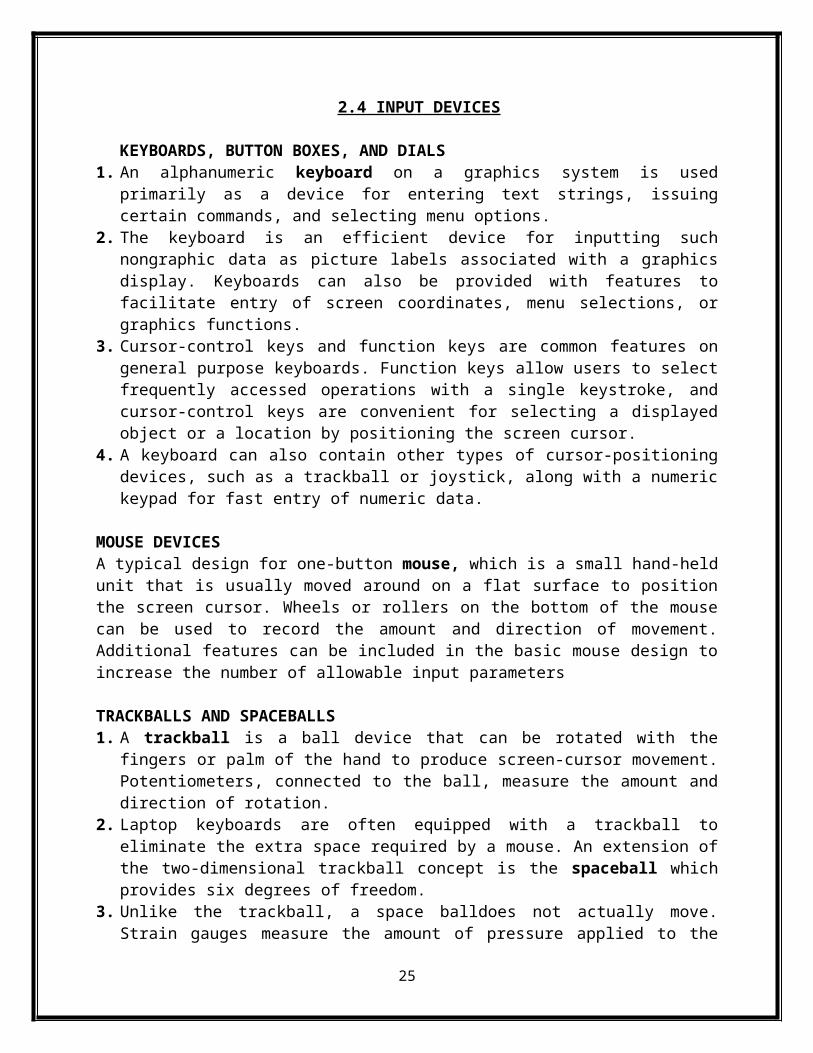
Figure : Pixel Postions reference by scan line number and column number .
8. To load an intensity value into the frame buffer at a position corresponding to column x along scan line y, setpixel (x, y)
9. To retrieve the current frame buffer intensity setting for a specified location we use a low level function getpixel (x, y)
Line Drawing Algorithms
1. Digital Differential Analyzer (DDA) Algorithm 2. Bresenham’s Line Algorithm
The Cartesian slope-intercept equation for a straight line is y = m . x + b (1)
Where m as slope of the line and b as the y intercept
Figure : Line Path between endpoint positions (x1,y1) and (x2,y2) m = Δy / Δx = y2-y1 / x2 - x1 (2) b= y1 - m .x1 (3) For any given x interval Δx along a line, we can compute the corresponding y interval Δ y Δy= m Δx (4) We can obtain the x interval Δx corresponding to a specified Δy as Δ x = Δ y/m (5)
For lines with slope magnitudes |m| < 1, Δx can be set proportional to a small horizontal deflection voltage and the corresponding vertical deflection is then set proportional to Δy as calculated from Eq (4).
For lines whose slopes have magnitudes |m | >1 , Δy can be set proportional to a small vertical deflection voltage with the corresponding horizontal deflection voltage set proportional to Δx, calculated from Eq (5)
25
DIGITAL DIFFERENTIAL ANALYZER (DDA) ALGORTIHM
Algorithm
#define ROUND(a) ((int)(a+0.5)) voidlineDDA (int xa, int ya, int xb, int yb) { int dx = xb - xa, dy = yb - ya, steps, k; floatxIncrement, yIncrement, x = xa, y = ya; if (abs (dx) > abs (dy) steps = abs (dx) ; else steps = abs dy); xIncrement = dx / (float) steps; yIncrement = dy / (float) steps setpixel (ROUND(x), ROUND(y) ) : for (k=0; k<steps; k++) { x += xIncrement; y += yIncrement; setpixel (ROUND(x), ROUND(y)); } }Algorithm Description:
Step 1 :Accept Input as two endpoint pixel positions Step 2: Horizontal and vertical differences between the endpoint positions are assigned to parameters dx and dy (Calculate dx=xb-xa and dy=yb-ya). Step 3:The difference with the greater magnitude determines the value of parameter steps. Step 4 :Starting with pixel position (xa, ya), determine the offset needed at each step to generate the next pixel position along the line path. Step 5: loop the following process for steps number of times a. Use a unit of increment or decrement in the x and y direction b. if xa is less than xb the values of increment in the x and y directions are 1 and m c. if xa is greater than xb then the decrements -1 and – m are used.
Example: Consider the line from (0,0) to (4,6)
1. xa=0, ya =0 and xb=4 yb=6 2. dx=xb-xa = 4-0 = 4 and dy=yb-ya=6-0= 6 3. x=0 and y=0 4. 4 > 6 (false) so, steps=6 5. Calculate xIncrement = dx/steps = 4 / 6 = 0.66 and yIncrement = dy/steps =6/6=1 6. Setpixel(x,y) = Setpixel(0,0) (Starting Pixel Position) 7. Iterate the calculation for xIncrement and yIncrement for steps(6) number of times 8. Tabulation of the each iteration
26
k x Y Plotting points (Rounded to Integer)0 0+0.66=0.66 0+1=1 (1,1)1 0.66+0.66=1.32 1+1=2 (1,2)2 1.32+0.66=1.98 2+1=3 (2,3)3 1.98+0.66=2.64 3+1=4 (3,4)4 2.64+0.66=3.3 4+1=5 (3,5)
RESULT:
Advantages of DDA Algorithm 1. It is the simplest algorithm 2. It is a is a faster method for calculating pixel positions
Disadvantages of DDA Algorithm 1. Floating point arithmetic in DDA algorithm is still time-consuming 2. End point accuracy is poor
BRESENHAM’S LINE ALGORITHM
1. Input the two line endpoints and store the left end point in (x0,y0) 2. load (x0,y0) into frame buffer, ie. Plot the first point. 3. Calculate the constants Δx, Δy, 2Δy and obtain the starting value for the decision parameter as P0 = 2Δy-Δx 4. At each xkalong the line, starting at k=0 perform the following test
If Pk< 0, the next point to plot is(xk+1,yk) and Pk+1 = Pk+ 2Δy
27
Otherwise, the next point to plot is (xk+1,yk+1) and Pk+1 = Pk+ 2Δy - 2Δx 5. Perform step4 Δx times.
Implementation of Bresenham Line drawing Algorithm voidlineBres (int xa,intya,intxb, int yb) { int dx = abs( xa – xb) , dy = abs (ya - yb); int p = 2 * dy – dx; inttwoDy = 2 * dy, twoDyDx = 2 *(dy - dx); int x , y, xEnd; /* Determine which point to use as start, which as end * /if (xa> x b ) {x = xb; y = yb; xEnd = xa; } else{ x = xa; y = ya;xEnd = xb; } setPixel(x,y); while(x<xEnd) {x++; if (p<0) p+=twoDy; else{ y++; p+=twoDyDx;} setPixel(x,y);} }
Example : Consider the line with endpoints (20,10) to (30,18) The line has the slope m= (18-10)/(30-20)=8/10=0.8
Δx = 10Δy=8 The initial decision parameter has the value p0 = 2Δy- Δx = 6 and the increments for calculating successive decision parameters are 2Δy=16 2Δy-2 Δx= -4 We plot the initial point (x0,y0) = (20,10) and determine successive pixel positions along the line path from the decision parameter as
28
TABULATION:k pk (xk+1, yK+1)0 6 (21,11)1 2 (22,12)2 -2 (23,12)3 14 (24,13)4 10 (25,14)5 6 (26,15)6 2 (27,16)7 -2 (28,16)8 14 (29,17)9 10 (30,18)
RESULT:
Advantages 1. Algorithm is Fast 2. Uses only integer calculations
Disadvantages It is meant only for basic line drawing
LINE FUNCTION
The two dimension line function is Polyline(n,wcPoints) where n is assigned an integer value equal to the number of coordinate positions to be input and wcPointsis the array of input world-coordinate values for line segment endpoints.
29
polyline function is used to define a set of n – 1 connected straight line segments To display a single straight-line segment we have to set n=2 and list the x and y values of the two endpoint coordinates in wcPoints. Example :following statements generate 2 connected line segments with endpoints at (50, 100), (150, 250), and (250, 100) typedefstructmyPt{int x, y;};myPtwcPoints[3];wcPoints[0] .x = 50;wcPoints[0] .y = 100;wcPoints[1] .x = 150;wcPoints[1].y = 50;wcPoints[2].x = 250;wcPoints[2] .y = 100;polyline ( 3 , wcpoints);
CIRCLE-GENERATING ALGORITHMS
A circle is defined as a set of points that are all the given distance (xc,yc).
(x – xc)2+ (y – yc) 2 = r2
Midpoint circle Algorithm 1. Input radius r and circle center (xc,yc) and obtain the first point on the circumference of the circle centered on the origin as (x0,y0) = (0,r) 2. Calculate the initial value of the decision parameter as P0=(5/4)-r 3. At each xk position, starting at k=0, perform the following test. If Pk<0 the next point along the circle centered on (0,0) is (xk+1,yk) and
Pk+1=Pk+2xk+1+1 Otherwise the next point along the circle is (xk+1,yk-1) and
Pk+1=Pk+2xk+1+1-2 yk+1 Where 2xk+1=2xk+2 and 2yk+1=2yk-2 4. Determine symmetry points in the other seven octants. 5. Move each calculated pixel position (x,y) onto the circular path centered at (xc,yc) and plot the coordinate values. x=x+xc y=y+yc 6. Repeat step 3 through 5 until x>=y.
30
Example: Midpoint Circle DrawingGiven a circle radius r=10 The circle octant in the first quadrant from x=0 to x=y. The initial value of the decision parameter is
P0=1-r = - 9For the circle centered on the coordinate origin, the initial point is
(X0, y0)=(0, 10) and initial increment terms for calculating the decision parameters are
2x0=0, 2y0=20 Successive midpoint decision parameter values and the corresponding coordinate positions along the circle path are listed in the following table.
TABULATION :
k pk (xk+1, yk-1) 2xk+1 2yk+1
0 -9 (1,10) 2 201 -6 (2,10) 4 202 -1 (3,10) 6 203 6 (4,9) 8 184 -3 (5,9) 10 185 8 (6,8) 12 166 5 (7,7) 14 14
RESULT :
Implementation of Midpoint Circle AlgorithmvoidcircleMidpoint (int xCenter, int yCenter, int radius) { int x = 0; int y = radius; int p = 1 - radius;
31
voidcirclePlotPoints (int, int, int, int); /* Plot first set of points */ irclePlotPoints (xCenter, yCenter, x, y);while (x < y) { x++ ;if (p < 0) p +=2*x +1; else{ y--; p +=2* (x - Y) + 1; } circlePlotPoints(xCenter, yCenter, x, y) }} voidcirclePlotPolnts (int xCenter, int yCenter, int x, int y) { setpixel (xCenter + x, yCenter + y ) ;setpixel (xCenter - x. yCenter + y); setpixel (xCenter + x, yCenter - y); setpixel (xCenter - x, yCenter - y ) ; setpixel (xCenter + y, yCenter + x); setpixel (xCenter - y , yCenter + x); setpixel (xCenter t y , yCenter - x); setpixel (xCenter - y , yCenter - x); }
ELLIPSE-GENERATING ALGORITHMS
An ellipse is an elongated circle. Therefore, elliptical curves can be generated by modifying circle-drawing procedures to take into account the different dimensions of an ellipse along the major and minor axesOUTPUT FOR THE BELOW SUM :
Mid point Ellipse Algorithm
1. Input rx,ry and ellipse center (xc ,yc) and obtain the first point on an ellipse centered on the origin as (x0,y0) = (0,ry)
32
33
34