Embed Size (px)
Citation preview

HIGLEY UNIFIED SCHOOL DISTRICTINSTRUCTIONAL ALIGNMENT
HS Algebra I Semester 2
Module 3: Linear and Exponential Relationships (35 days)Topic B: Functions and Their Graphs (7 days)
In Topic B, students connect their understanding of functions to their knowledge of graphing from Grade 8. They learn the formal definition of a function and how to recognize, evaluate, and interpret functions in abstract and contextual situations (F-IF.A.1, F-IF.A.2). Students examine the graphs of a variety of functions and learn to interpret those graphs using precise terminology to describe such key features as domain and range, intercepts, intervals where the function is increasing or decreasing, and intervals where the function is positive or negative. (F-IF.A.1, F-IF.B.4, F-IF.B.5, F-IF.C.7a).
Big Idea: A function is a correspondence between two sets, X, and Y, in which each element of X is matched to one and only one element of Y. The graph of f is the same as the graph of the equation y = f(x). A function that grows exponentially will eventually exceed a function that grows linearly.
Essential Questions:
What are the essential parts of a function?
Vocabulary Function, correspondence between two sets, generic correspondence, range of a function, equivalent functions, identity, notation of f, polynomial function, algebraic function, linear function
Assessments Galileo: Topic B Assessment
Standard Common Core Standards Explanations & Examples Resources
F.IF.A.1 A. Understand the concept of a function and use function notation
Understand that a function from one set (called the domain) to another set (called the range) assigns to each element of the domain exactly one element of the range. If f is a function and x is an element of its domain, then f(x) denotes the output of f corresponding to the input x. The graph of f is the graph of the equation y = f(x).
Is the correspondence described below a function? Explain your reasoning.𝑀:{𝑤𝑜𝑚𝑒𝑛}→{𝑝𝑒𝑜𝑝𝑙𝑒}Assign each woman their child.This is not a function because a woman who is a mother could have more than one child.
Eureka Math:Module 3 Lesson 9Module 3 Lesson 10Module 3 Lesson 11Module 3 Lesson 12
5/8/2023 Page 1 of 66
F.IF.A.2 A. Understand the concept of a function and use function notation
Use function notation, evaluate functions for inputs in their domains, and interpret statements that use function notation in terms of a context.
This function assigns all people to their biological father. The domain is all people. The codomain is all males, and the range is the subset of the males who have fathered a child. 𝑓:{𝑝𝑒𝑜𝑝𝑙𝑒}→{𝑚𝑒𝑛}𝐴𝑠𝑠𝑖𝑔𝑛 𝑎𝑙𝑙 𝑝𝑒𝑜𝑝𝑙𝑒 𝑡𝑜 𝑡ℎ𝑒𝑖𝑟 𝑏𝑖𝑜𝑙𝑜𝑔𝑖𝑐𝑎𝑙 𝑓𝑎𝑡ℎ𝑒𝑟.Domain: all peopleRange: men who are fathers
𝑳𝒆𝒕 𝒇:{𝒑𝒐𝒔𝒊𝒕𝒊𝒗𝒆 𝒊𝒏𝒕𝒆𝒈𝒆𝒓𝒔}→{𝒑𝒆𝒓𝒇𝒆𝒄𝒕 𝒔𝒒𝒖𝒂𝒓𝒆𝒔}Assign each term number to the square of that number.a. What is (𝟑)? What does it mean?
𝒇(𝟑)=𝟗. It is the value of the 𝟑rd square number. 𝟗 dots can be arranged in a 𝟑 by 𝟑 square array.
Eureka Math:Module 3 Lesson 8Module 3 Lesson 9Module 3 Lesson 10
F.IF.B.4 B. Interpret functions that arise in applications in terms of the context
For a function that models a relationship between two quantities, interpret key features of graphs and tables in terms of the quantities, and sketch graphs showing key features given a verbal description of the relationship. Key features include: intercepts; intervals where the function is increasing, decreasing, positive, or negative; relative maximums and minimums; symmetries; end behavior; and periodicity.
Tasks have a real-world context. In Algebra I, tasks are limited to linear functions, quadratic functions, square-root functions, cube-root functions, piecewise functions (including step functions and absolute-value functions), and exponential functions with domains in the integers.
Eureka Math:Module 3 Lesson 8Module 3 Lesson 9Module 3 Lesson 11Module 3 Lesson 12Module 3 Lesson 13Module 3 Lesson 14
5/8/2023 Page 2 of 66

Let 𝑓 be a function whose domain and range are the subsets of the real numbers.
A function 𝑓 is called increasing on an interval 𝐼 if (𝑥1)<𝑓(𝑥2) whenever 𝑥1<𝑥2 in 𝐼.
A function 𝑓 is called decreasing on an interval 𝐼 if (𝑥1)>𝑓(𝑥2) whenever 𝑥1<𝑥2 in 𝐼.
A function 𝑓 is called positive on an interval 𝐼 if (𝑥)>0 for all 𝑥 in 𝐼.
A function 𝑓 is called negative on an interval 𝐼 if (𝑥)<0 for all 𝑥 in 𝐼.
F.IF.B.5 B. Interpret functions that arise in applications in terms of the context
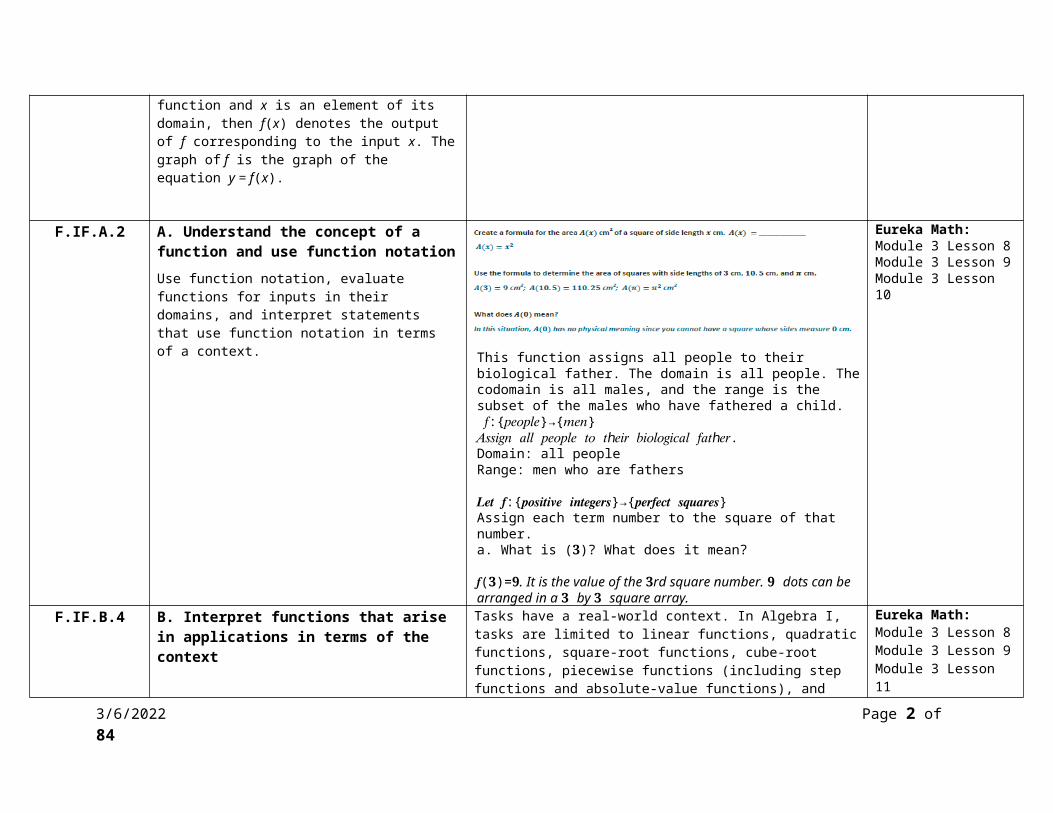
Relate the domain of a function to its graph and, where applicable, to the quantitative relationship it describes. For example, if the function h(n) gives the number of person-hours it takes to assemble n engines in a factory, then the positive integers would be an appropriate domain for the function.
Jenna knits scarves and then sells them on Etsy, an online marketplace. Let (𝑥)=4𝑥+20 represent the cost 𝐶 in dollars to produce from 1 to 6 scarves.a. Create a table to show the relationship between the number of scarves 𝑥 and the cost 𝐶.
b. What are the domain and range of 𝐶?
c. What is the meaning of (3)?
d. What is the meaning of the solution to the equation (𝑥)=40?
Eureka Math:Module 3 Lesson 8Module 3 Lesson 11Module 3 Lesson 12Module 3 Lesson 14
5/8/2023 Page 3 of 66
F.IF.C.7a C. Analyze functions using different representations.
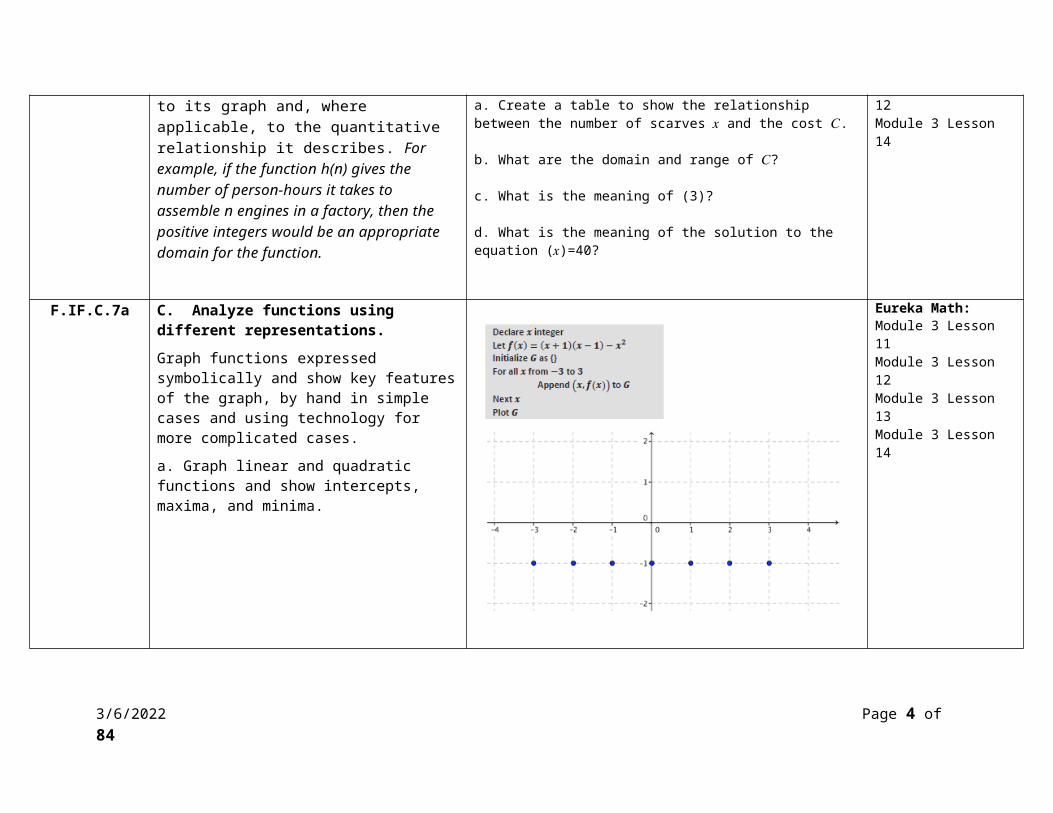
Graph functions expressed symbolically and show key features of the graph, by hand in simple cases and using technology for more complicated cases.
a. Graph linear and quadratic functions and show intercepts, maxima, and minima.
Eureka Math:Module 3 Lesson 11Module 3 Lesson 12Module 3 Lesson 13Module 3 Lesson 14
5/8/2023 Page 4 of 66

HS Algebra I Semester 2
Module 3: Linear and Exponential Relationships (35 days)Topic C: Transformations of Functions (6 days)
In Topic C, students extend their understanding of piecewise functions and their graphs including the absolute value and step functions. They learn a graphical approach to circumventing complex algebraic solutions to equations in one variable, seeing them as (𝑥) = (𝑥) and recognizing that the intersection of the graphs of (𝑥) and (𝑥) are solutions to the original equation (A-REI.D.11). Students use the absolute value function and other piecewise functions to investigate transformations of functions and draw formal conclusions about the effects of a transformation on the function’s graph (F-IF.C.7, F-BF.B.3).
Big Idea: Different expressions can be used to define a function over different subsets of the domain. Absolute value and step functions can be represented as piecewise functions. The transformation of the function is itself another function (and not a graph).
Essential Questions:
How do intersection points of the graphs of two functions 𝑓 and 𝑔 relate to the solution of an equation in the form (𝑥)=𝑔(𝑥)? What are some benefits of solving equations graphically? What are some limitations?
Vocabulary Piecewise function, step function, absolute value function, floor function, ceiling function, sawtooth function, vertical scaling, horizontal scaling
Assessments Galileo: Topic C Assessment
Standard Common Core Standards Explanations & Examples Resources
A.REI.D.11 D. Represent and solve equations and inequalities graphically
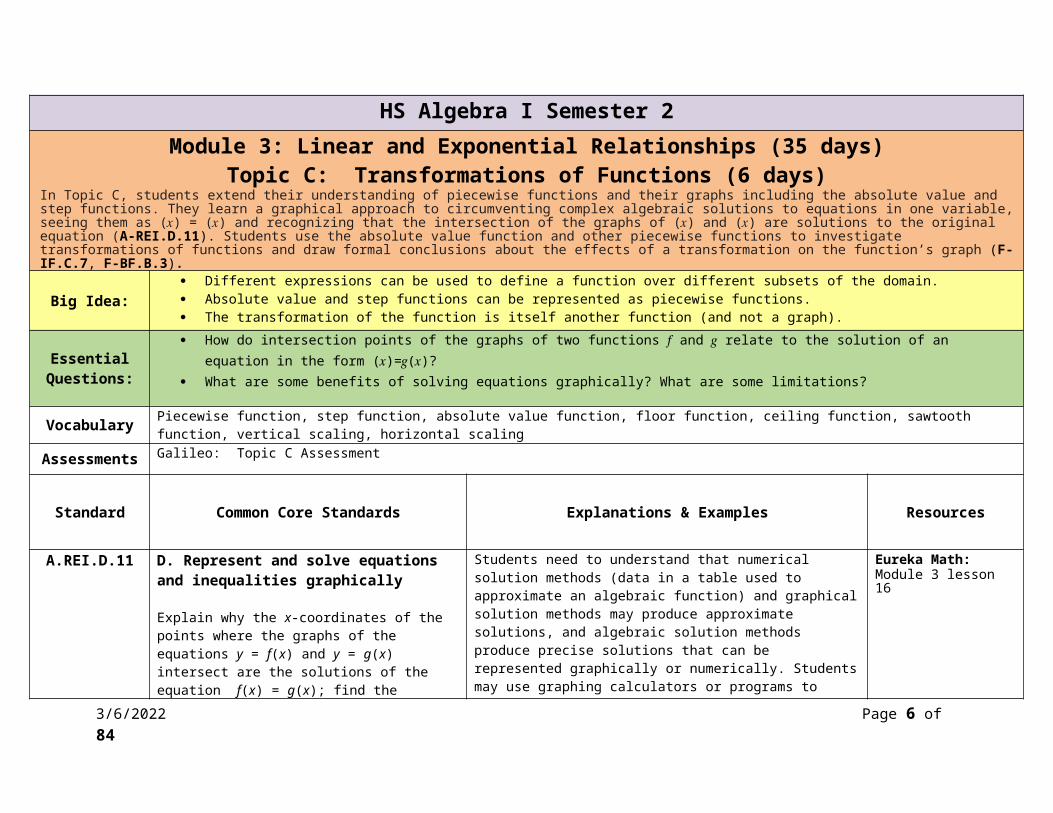
Explain why the x-coordinates of the points where the graphs of the equations y = f(x) and y = g(x) intersect are the solutions of the equation f(x) = g(x); find the solutions approximately, e.g., using technology to graph the functions, make tables of values, or find successive approximations. Include cases where f(x) and/or g(x) are linear, polynomial, rational, absolute value, exponential, and logarithmic functions.
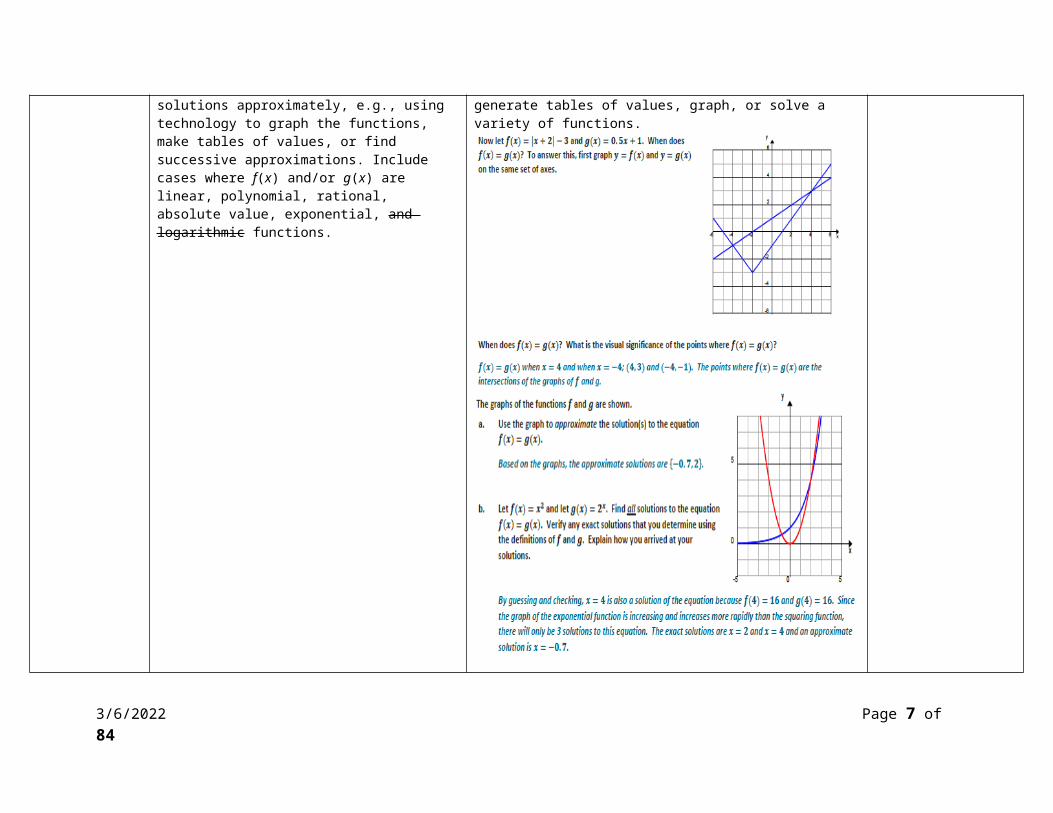
Students need to understand that numerical solution methods (data in a table used to approximate an algebraic function) and graphical solution methods may produce approximate solutions, and algebraic solution methods produce precise solutions that can be represented graphically or numerically. Students may use graphing calculators or programs to generate tables of values, graph, or solve a variety of functions.
Eureka Math:Module 3 lesson 16
5/8/2023 Page 5 of 66
5/8/2023 Page 6 of 66
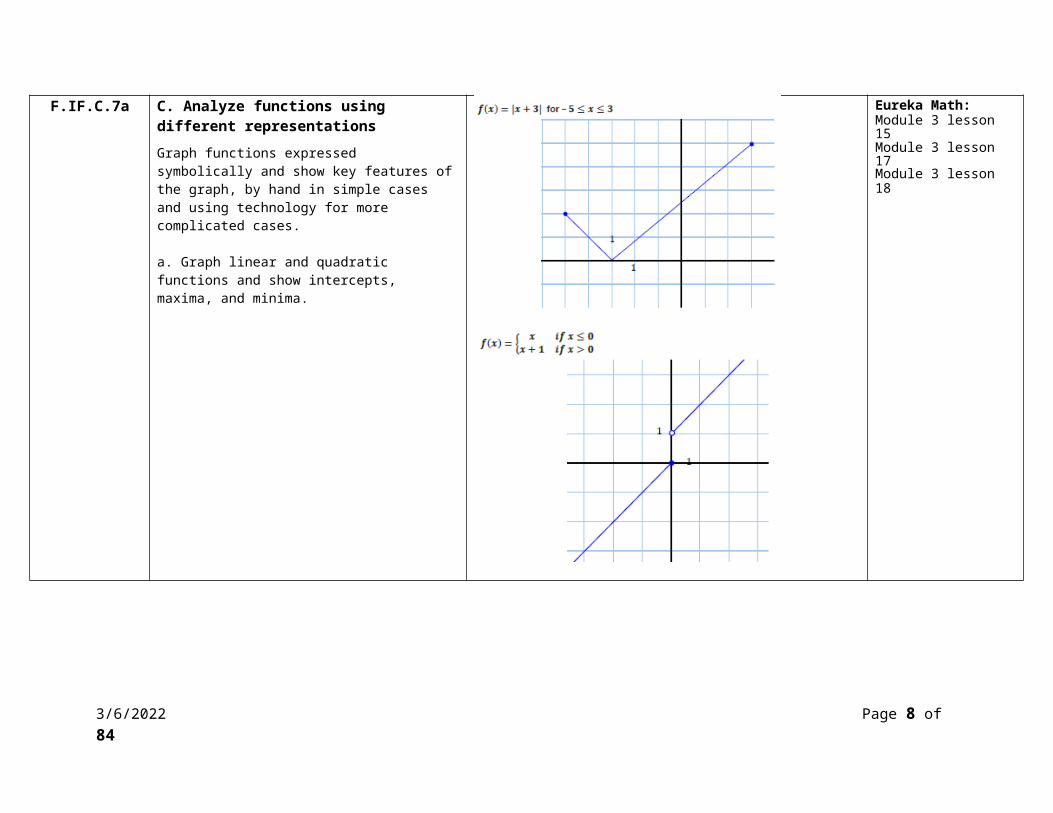
F.IF.C.7a C. Analyze functions using different representations
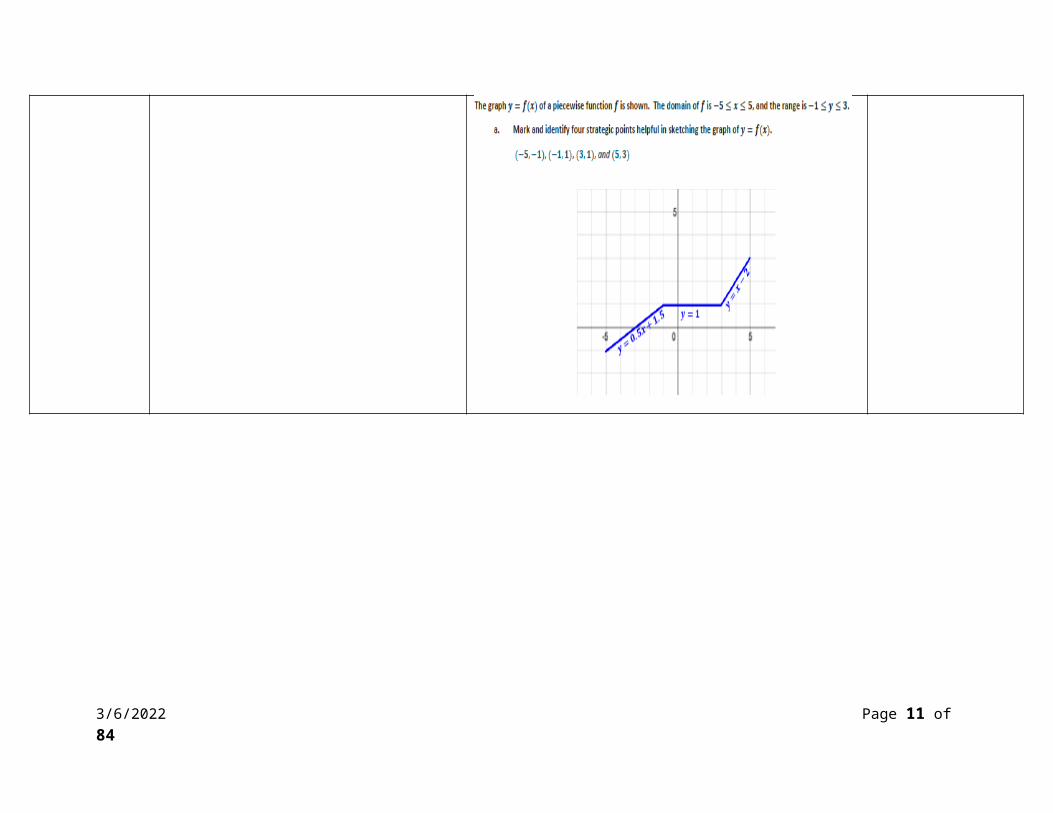
Graph functions expressed symbolically and show key features of the graph, by hand in simple cases and using technology for more complicated cases.
a. Graph linear and quadratic functions and show intercepts, maxima, and minima.
Eureka Math:Module 3 lesson 15Module 3 lesson 17Module 3 lesson 18
5/8/2023 Page 7 of 66
5/8/2023 Page 8 of 66

F.BF.B.3 B. Build new functions from existing functions
Identify the effect on the graph of replacing f(x) by f(x) + k, k f(x), f(kx), and f(x + k) for specific values of k (both positive and negative); find the value of k given the graphs. Experiment with cases and illustrate an explanation of the effects on the graph using technology. Include recognizing even and odd functions from their graphs and algebraic expressions for them.
Eureka Math:Module 3 lesson 15Module 3 lesson 17Module 3 lesson 18Module 3 lesson 19Module 3 lesson 20
5/8/2023 Page 9 of 66

5/8/2023 Page 10 of 66
MP.3 Construct viable arguments and critique the reasoning of others.
They are able to analyze situations by breaking them into cases, and can recognize and use counterexamples. They justify their conclusions, communicate them to others, and respond to the arguments of others
Eureka Math:Module 3 lesson 17Module 3 lesson 18Module 3 lesson 19
MP.6 Attend to precision. Mathematically proficient students try to communicate precisely to others. They try to use clear definitions in discussion with others and in their own reasoning. They state the meaning of the symbols they choose, including using the equal sign consistently and appropriately. They are careful about specifying units of measure, and labeling axes to clarify the correspondence with quantities in a problem. They calculate accurately and efficiently, express numerical answers with a degree of precision appropriate for the problem context.
Eureka Math:Module 3 lesson 15Module 3 lesson 19
MP.8 Look for and express regularity in repeated reasoning.
They pay close attention to calculations involving the properties of operations, properties of equality, and properties of inequalities, to find equivalent expressions and solve equations, while recognizing
Eureka Math:Module 3 lesson 17Module 3 lesson 19
5/8/2023 Page 11 of 66

common ways to solve different types of equations.
5/8/2023 Page 12 of 66

HS Algebra I Semester 2
Module 3: Linear and Exponential Relationships (35 days)Topic D: Using Functions and Graphs to Solve Problems (4 days)
In Topic D, students explore application of functions in real-world contexts and use exponential, linear, and piecewise functions and their associated graphs to model the situations. The contexts include the population of an invasive species, applications of Newton’s Law of Cooling, and long-term parking rates at the Albany International Airport. Students are given tabular data or verbal descriptions of a situation and create equations and scatterplots of the data. They use continuous curves fit to population data to estimate average rate of change and make predictions about future population sizes. They write functions to model temperature over time, graph the functions they have written, and use the graphs to answer questions within the context of the problem. They recognize when one function is a transformation of another within a context involving cooling substances.
Big Idea: For every two inputs that are given apart, the difference in their corresponding outputs is constant – dataset could be a linear function. For every two inputs that are a given difference apart, the quotient if the corresponding outputs is constant-dataset could be an exponential function. An increasing exponential function will eventually exceed any linear function.
Essential Questions:
How can you tell whether input-output pairs in a table are describing a linear relationship or an exponential relationship?
Vocabulary Piecewise function, step function, absolute value function, floor function, ceiling function
Assessment Galileo: Topic D Assessment
Standard Common Core Standards Explanations & Examples Resources
A.CED.A.1 A. Create equations that describe numbers or relationships
Create equations and inequalities in one variable and use them to solve problems. Include equations arising from linear and quadratic functions, and simple rational and exponential functions.
Equations can represent real world and mathematical problems. Include equations and inequalities that arise when comparing the values of two different functions, such as one describing linear growth and one describing exponential growth.
Eureka Math:Module 3 Lesson 21
5/8/2023 Page 13 of 66

A.SSE.B.3C B. Write expressions in equivalent forms to solve problems
Choose and produce an equivalent form of an expression to reveal and explain properties of the quantity represented by the expression.
c. Use the properties of exponents to transform expressions for exponential functions. For example the expression 1.15t can be rewritten as (1.151/12)12t ≈ 1.01212t to reveal the approximate equivalent monthly interest rate if the annual rate is 15%.
Students will use the properties of operations to create equivalent expressions.
Eureka Math:Module 3 Lesson 21Module 3 Lesson 22Module 3 Lesson 23Module 3 Lesson 24
5/8/2023 Page 14 of 66

F.IF.B.4 B. Interpret functions that arise in applications in terms of the context
For a function that models a relationship between two quantities, interpret key features of graphs and tables in terms of the quantities, and sketch graphs showing key features given a verbal description of the relationship. Key features include: intercepts; intervals where the function is increasing, decreasing, positive, or negative; relative maximums and minimums; symmetries; end behavior; and periodicity.
Eureka Math:Module 3 Lesson 21Module 3 Lesson 22Module 3 Lesson 23Module 3 Lesson 24
5/8/2023 Page 15 of 66

F.IF.B.6 B. Interpret functions that arise in applications in terms of the context
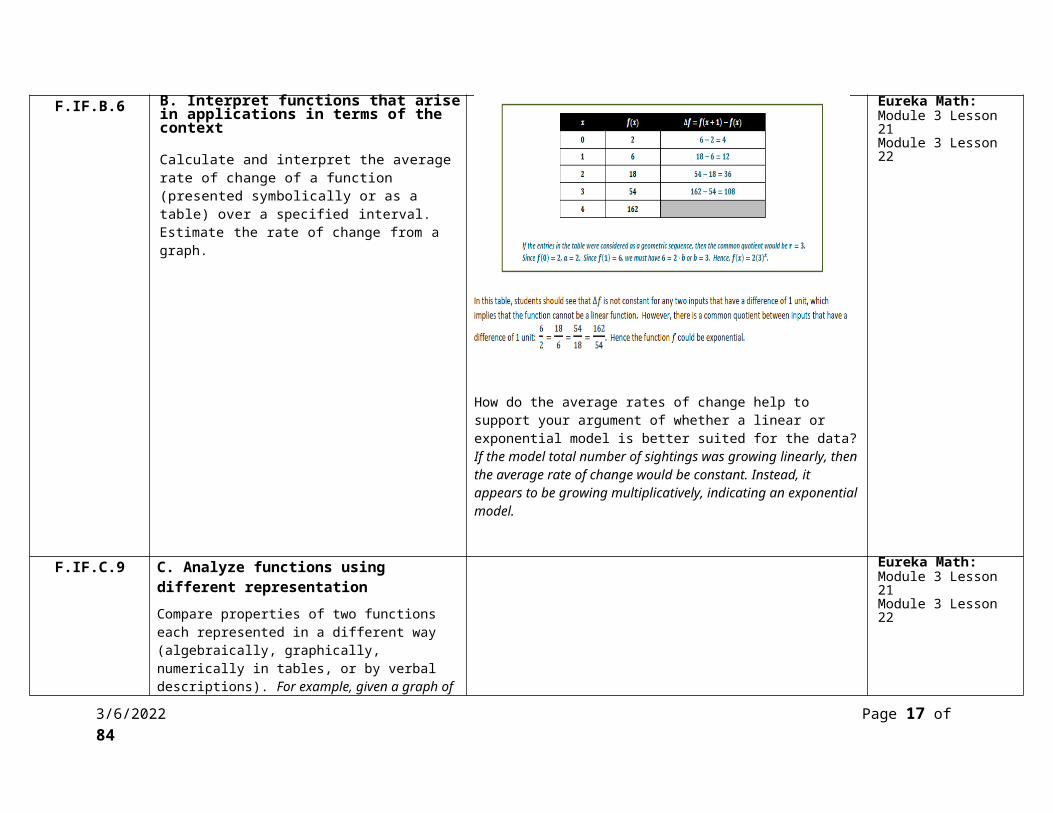
Calculate and interpret the average rate of change of a function (presented symbolically or as a table) over a specified interval. Estimate the rate of change from a graph.
How do the average rates of change help to support your argument of whether a linear or exponential model is better suited for the data?If the model total number of sightings was growing linearly, then the average rate of change would be constant. Instead, it appears to be growing multiplicatively, indicating an exponential model.
Eureka Math:Module 3 Lesson 21Module 3 Lesson 22
F.IF.C.9 C. Analyze functions using different representation
Compare properties of two functions each represented in a different way (algebraically, graphically, numerically in tables, or by verbal descriptions). For example, given a graph of one quadratic function and an algebraic expression for another, say which has the larger maximum.
Eureka Math:Module 3 Lesson 21Module 3 Lesson 22
F.BF.A.1a A. Build a function that models a relationship between two quantities
Use the regression feature of a graphing calculator to find an equation that models the number of lionfish sightings each year.
Eureka Math:Module 3 Lesson 21Module 3 Lesson 22
5/8/2023 Page 16 of 66
Write a function that describes a relationship between two quantities.
a. Determine an explicit expression, a recursive process, or steps for calculation from a context.
Module 3 Lesson 23Module 3 Lesson 24
F.LE.A.2 A. Construct and compare linear, quadratic, and exponential models and solve problems
Construct linear and exponential functions, including arithmetic and geometric sequences, given a graph, a description of a relationship, or two input- output pairs ‐(include reading these from a table).
Students may use graphing calculators or programs, spreadsheets, or computer algebra systems to construct linear and exponential functions.
Eureka Math:Module 3 Lesson 21Module 3 Lesson 22Module 3 Lesson 23Module 3 Lesson 24
F.LE.B.5 B. Interpret expressions for functions in terms of the situation they model
Interpret the parameters in a linear or exponential function in terms of a context.
Students may use graphing calculators or programs, spreadsheets, or computer algebra systems to model and interpret parameters in linear, quadratic or exponential functions.
Eureka Math:Module 3 Lesson 21Module 3 Lesson 22Module 3 Lesson 23Module 3 Lesson 24
MP.2 Reason abstractly and quantitatively. Students analyze graphs of non-constant rate measurements and apply reason (from the shape of the graphs) to infer the quantities being displayed and consider possible units to represent those quantities.
Eureka Math:Module 3 Lesson 22
MP.4 Model with mathematics. Students have numerous opportunities to solve problems that arise in everyday life, society, and the workplace (e.g., modeling bacteria growth and understanding the federal progressive income tax system).
Eureka Math:Module 3 Lesson 22Module 3 Lesson 23
5/8/2023 Page 17 of 66

MP.5 Use appropriate tools strategically. Mathematically proficient students consider the available tools when solving a mathematical problem. These tools might include pencil and paper, concrete models, a ruler, a protractor, a calculator, a spreadsheet, a computer algebra system, a statistical package, or dynamic geometry software. They are able to use technological tools to explore and deepen their understanding of concepts.
Eureka Math:Module 3 Lesson 24
MP.7 Look for and make use of structure. Students reason with and analyze collections of equivalent expressions to see how they are linked through the properties of operations. They discern patterns in sequences of solving equation problems that reveal structures in the equations themselves. (e.g., 2𝑥+4=10, 2(𝑥−3)+4=10, 2(3𝑥−4)+4=10)
Eureka Math:Module 3 Lesson 21
5/8/2023 Page 18 of 66

HS Algebra I Semester 2
Module 4: Polynomial and Quadratic Expressions, Equations and Functions (30 days)Topic A: Quadratic Expressions, Equations, Functions, and Their Connection to Rectangles (10 days)
By the end of middle school, students are familiar with linear equations in one variable (6.EE.B.5, 6.EE.B.6, 6.EE.B.7) and have applied graphical and algebraic methods to analyze and manipulate equations in two variables (7.EE.A.2). They used expressions and equations to solve real-life problems (7.EE.B.4). They have experience with square and cube roots, irrational numbers (8.NS.A.1), and expressions with integer exponents (8.EE.A.1).In Grade 9, students have been analyzing the process of solving equations and developing fluency in writing, interpreting, and translating between various forms of linear equations (Module 1) and linear and exponential functions (Module 3). These experiences combined with modeling with data (Module 2), set the stage for Module 4. Here students continue to interpret expressions, create equations, rewrite equations and functions in different but equivalent forms, and graph and interpret functions, but this time using polynomial functions, and more specifically quadratic functions, as well as square root and cube root functions.Topic A introduces polynomial expressions. In Module 1, students learned the definition of a polynomial and how to add, subtract, and multiply polynomials. Here their work with multiplication is extended and then, connected to factoring of polynomial expressions and solving basic polynomial equations (A-APR.A.1, A-REI.D.11). They analyze, interpret, and use the structure of polynomial expressions to multiply and factor polynomial expressions (A-SSE.A.2). They understand factoring as the reverse process of multiplication. In this topic, students develop the factoring skills needed to solve quadratic equations and simple polynomial equations by using the zero-product property (A-SSE.B.3a). Students transform quadratic expressions from standard or extended form, 𝑎𝑥2+𝑏𝑥+𝑐, to factored form and then solve equations involving those expressions. They identify the solutions of the equation as the zeros of the related function. Students apply symmetry to create and interpret graphs of quadratic functions (F-IF.B.4, F-IF.C.7a). They use average rate of change on an interval to determine where the function is increasing/decreasing (F-IF.B.6). Using area models, students explore strategies for factoring more complicated quadratic expressions, including the product-sum method and rectangular arrays. They create one- and two-variable equations from tables, graphs, and contexts and use them to solve contextual problems represented by the quadratic function (A-CED.A.1, A-CED.A.2) and relate the domain and range for the function, to its graph, and the context (F-IF.B.5).
Big Idea:
Factoring is the reverse process of multiplication. Multiplying binomials is an application of the distributive property; each term in the first binomial is distributed over the terms of the second
binomial. The area model can be modified into a tabular form to model the multiplication of binomials (or other polynomials) that may involve negative terms. Quadratic functions create a symmetrical curve with its highest or lowest point corresponding to its vertex and an axis of symmetry passing through it
when graphed.
Essential Questions:
Why is the final result when you multiply two binomials sometimes only three terms? How can we know whether a graph of a quadratic function will open up or down? How are finding the slope of a line and finding the average rate of change on an interval of a quadratic function similar? Different? Why is the leading coefficient always negative for functions representing falling objects?
Vocabulary Binomial, expanding, polynomial expression, quadratic expression, product-sum method, splitting the linear term, tabular model, axis of symmetry, vertex, end behavior of a graph, rate of change
Assessment Galileo: Module 4 Foundational Skills Assessment; Topic A Assessment
Standard Common Core Standards Explanations & Examples Resources
5/8/2023 Page 19 of 66

A.SSE.A.1 A. Interpret the structure of expressions
a. Interpret parts of an expression, such as terms, factors, and coefficients.
b. Interpret complicated expressions by viewing one or more of their parts as a single entity. For example, interpret P(1+r)n as the product of P and a factor not depending on P.
Students should understand the vocabulary for the parts that make up the whole expression and be able to identify those parts and interpret their meaning in terms of a context.
A.SSE.A.2 A. Interpret the structure of expressions
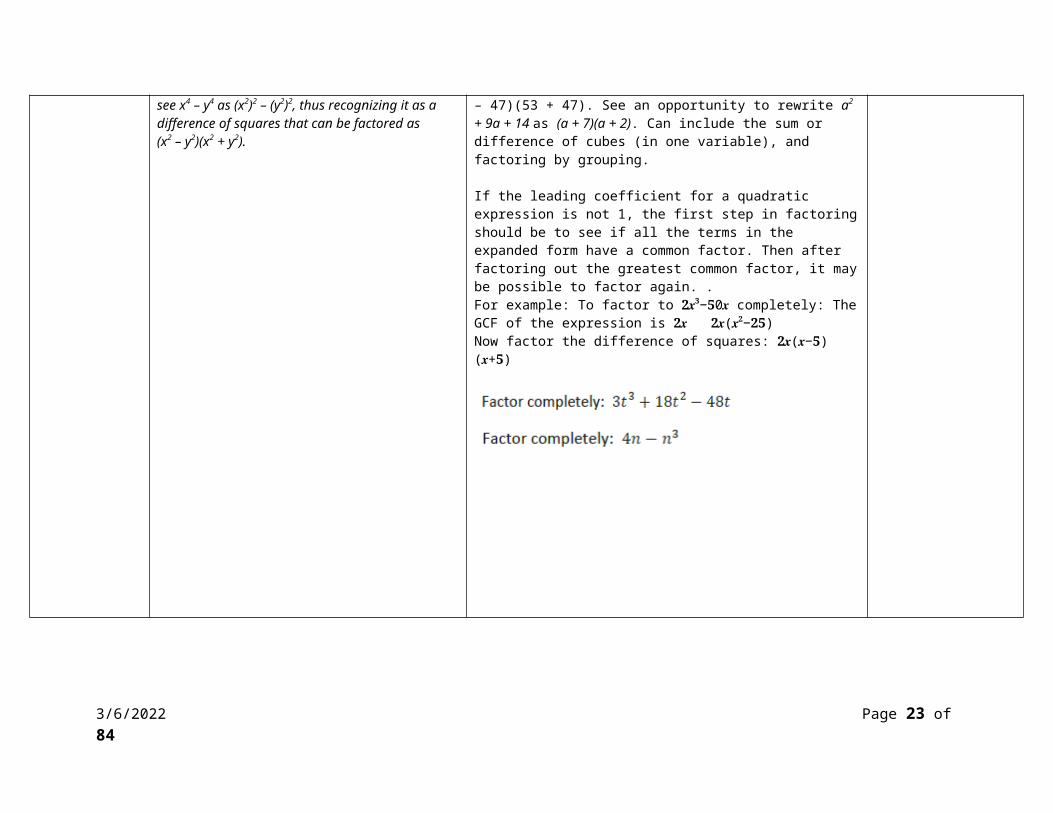
Use the structure of an expression to identify ways to rewrite it. For example,see x4 – y4 as (x2)2 – (y2)2, thus recognizing it as a difference of squares that can be factored as(x2 – y2)(x2 + y2).
In Algebra I, tasks are limited to numerical expressions and polynomial expressions in one variable. Examples: Recognize that 532 – 472 is the difference of squares and see an opportunity to rewrite it in the easier-to-evaluate form (53 – 47)(53 + 47). See an opportunity to rewrite a2 + 9a + 14 as (a + 7)(a + 2). Can include the sum or difference of cubes (in one variable), and factoring by grouping.
If the leading coefficient for a quadratic expression is not 1, the first step in factoring should be to see if all the terms in the expanded form have a common factor. Then after factoring out the greatest common factor, it may be possible to factor again. .For example: To factor to 𝟐𝒙𝟑−𝟓0𝒙 completely: The GCF of the expression is 𝟐𝒙 𝟐𝒙(𝒙𝟐−𝟐𝟓)Now factor the difference of squares: 𝟐𝒙(𝒙−𝟓)(𝒙+𝟓)
Eureka Math:Module 4 Lesson 2Module 4 Lesson 3Module 4 Lesson 4
5/8/2023 Page 20 of 66

A.SSE.B.3a B. Write expressions in equivalent forms to solve problems
Choose and produce an equivalent form of an expression to reveal and explain properties of the quantity represented by the expression.
a. Factor a quadratic expression to reveal the zeros of the function it defines.
A.SSE.3a Write expressions in equivalent forms by factoring to find the zeros of a quadratic function and explain the meaning of the zeros.
Given a quadratic function explain the meaning of the zeros of the function. That is if f(x) = (x – c) (x – a) then f(a) = 0 and f(c) = 0.
Given a quadratic expression, explain the meaning of the zeros graphically. That is for an expression (x –a) (x – c), a and c correspond to the x-intercepts (if a and c are real).
Eureka Math:Module 4 Lesson 7
5/8/2023 Page 21 of 66

A.APR.A.1 A. Perform arithmetic operations on polynomials
Understand that polynomials form a system analogous to the integers, namely, they are closed under the operations of addition, subtraction, and multiplication; add, subtract, and multiply polynomials.
Eureka Math:Module 4 Lesson 1Module 4 Lesson 2
A.APR.B.3 B. Understand the relationship between zeros and factors of polynomials.
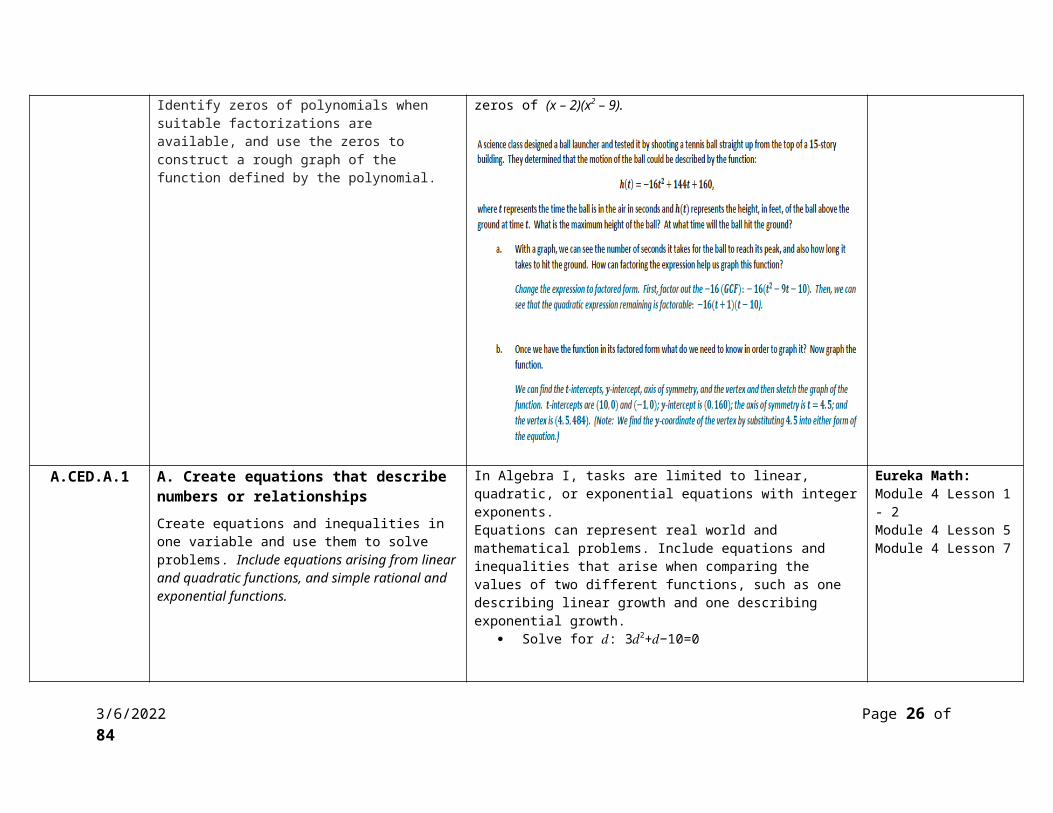
Identify zeros of polynomials when suitable factorizations are available, and use the zeros to construct a rough graph of the function defined by the
In Algebra I, tasks are limited to quadratic and cubic polynomials, in which linear and quadratic factors are available. For example, find the zeros of (x – 2)(x2 – 9).
Eureka Math:Module 4 Lesson 9
5/8/2023 Page 22 of 66
polynomial.
A.CED.A.1 A. Create equations that describe numbers or relationships
Create equations and inequalities in one variable and use them to solve problems. Include equations arising from linear and quadratic functions, and simple rational and exponential functions.
In Algebra I, tasks are limited to linear, quadratic, or exponential equations with integer exponents.Equations can represent real world and mathematical problems. Include equations and inequalities that arise when comparing the values of two different functions, such as one describing linear growth and one describing exponential growth.
Solve for 𝑑: 3𝑑2+𝑑−10=0
Eureka Math:Module 4 Lesson 1 - 2Module 4 Lesson 5Module 4 Lesson 7
5/8/2023 Page 23 of 66

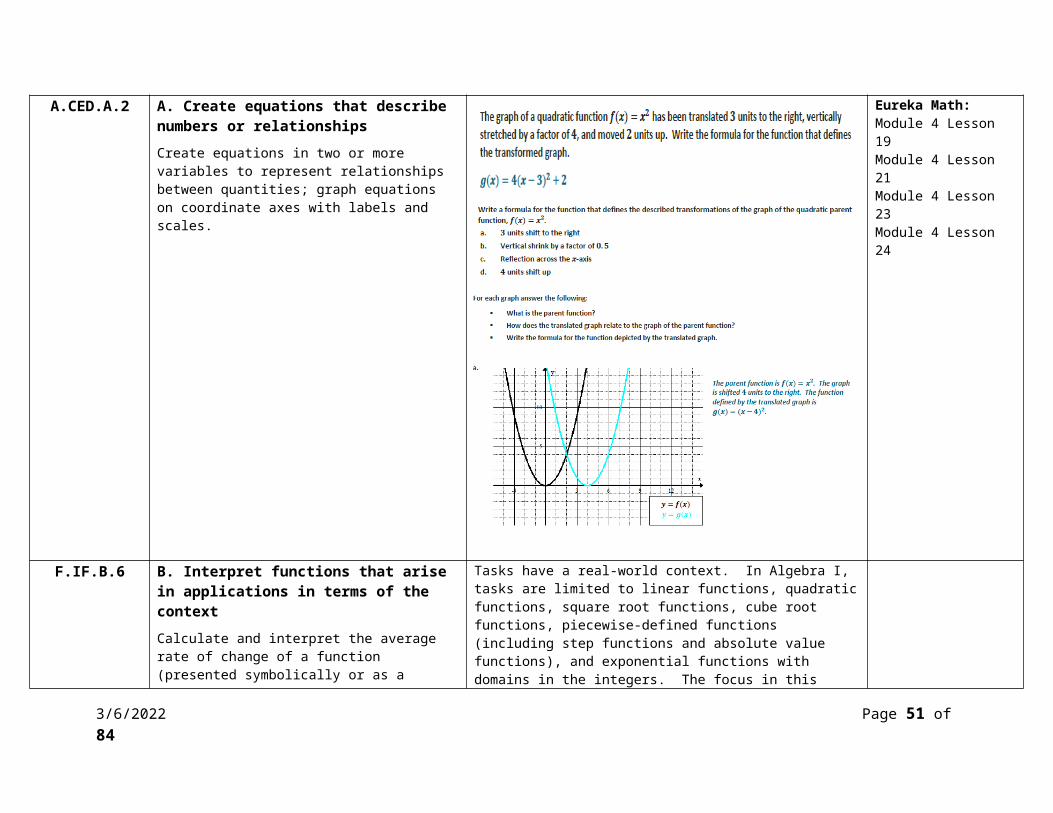
A.CED.A.2 A. Create equations that describe numbers or relationships
Create equations in two or more variables to represent relationships between quantities; graph equations on coordinate axes with labels and scales.
Eureka Math:Module 4 Lesson 7
5/8/2023 Page 24 of 66

A.REI.B.4b B. Solve equations and inequalities in one variable
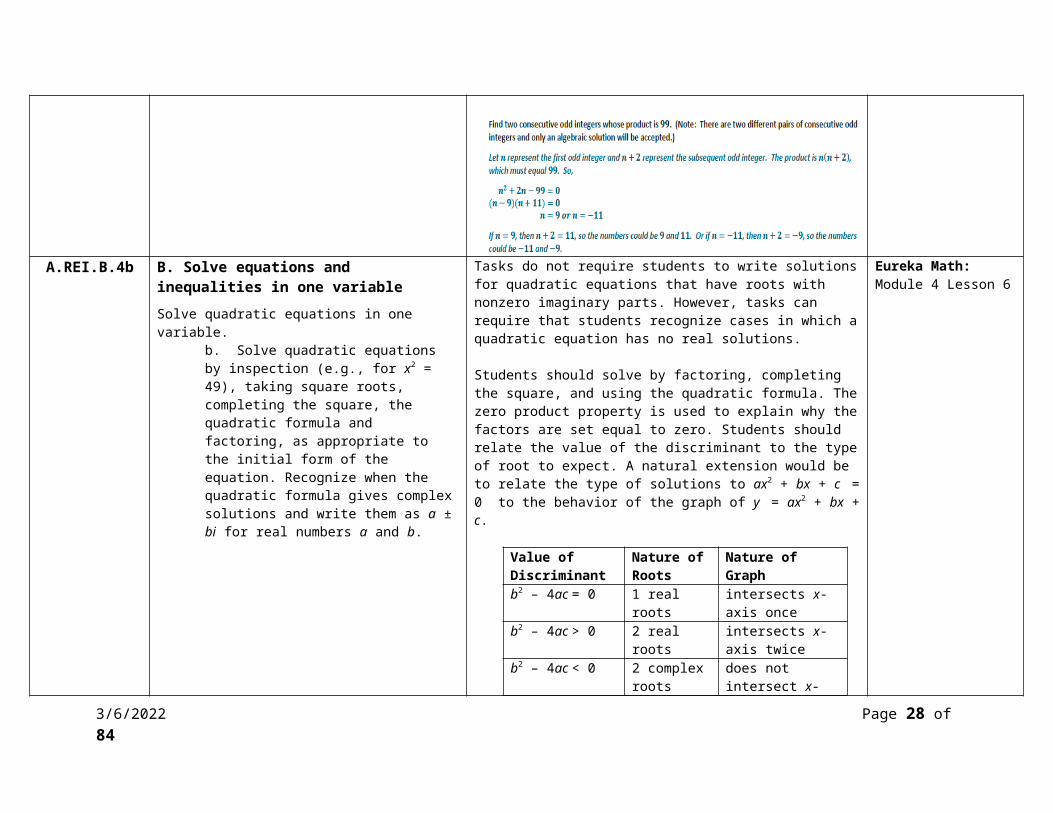
Solve quadratic equations in one variable.b. Solve quadratic equations by inspection (e.g., for x2 = 49), taking square roots, completing the square, the quadratic formula and factoring, as appropriate to the initial form of the equation. Recognize when the quadratic formula gives complex solutions and write them as a ± bi for real numbers a and b.
Tasks do not require students to write solutions for quadratic equations that have roots with nonzero imaginary parts. However, tasks can require that students recognize cases in which a quadratic equation has no real solutions.
Students should solve by factoring, completing the square, and using the quadratic formula. The zero product property is used to explain why the factors are set equal to zero. Students should relate the value of the discriminant to the type of root to expect. A natural extension would be to relate the type of solutions to ax2 + bx + c = 0 to the behavior of the graph of y = ax2 + bx + c.
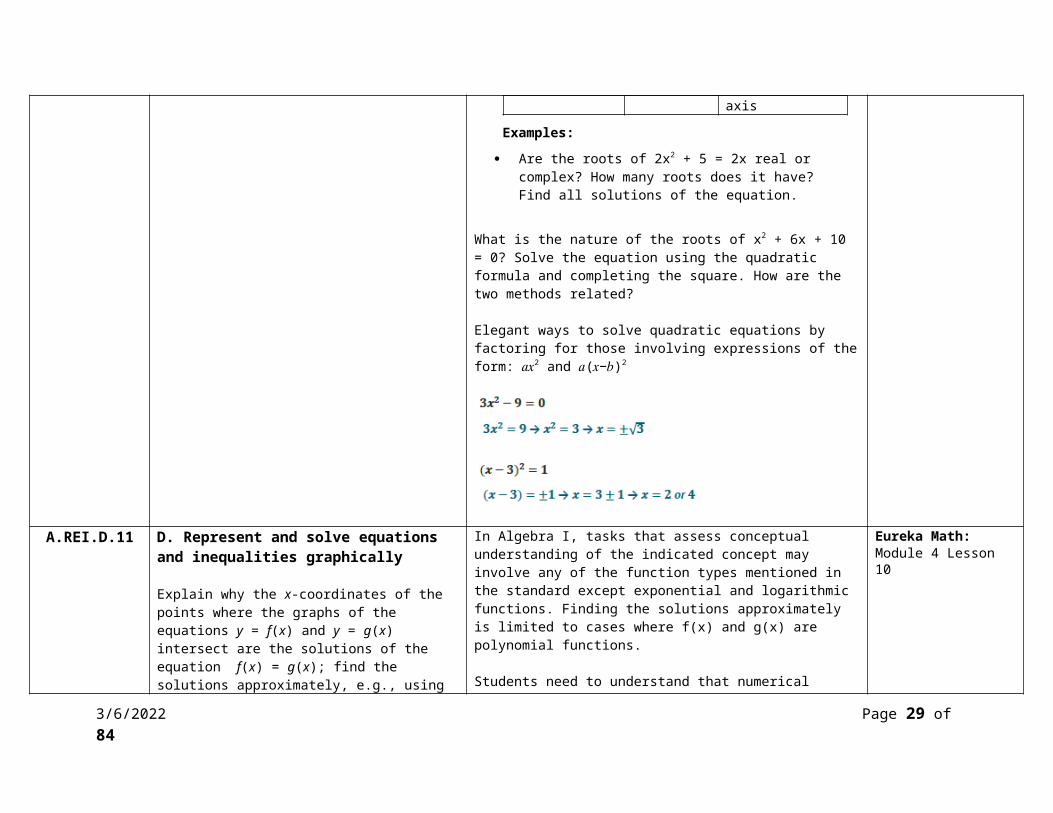
Value of Discriminant
Nature of Roots
Nature of Graph
b2 – 4ac = 0 1 real roots intersects x-axis once
b2 – 4ac > 0 2 real roots intersects x-axis twice
b2 – 4ac < 0 2 complex roots
does not intersect x-axis
Examples:
Are the roots of 2x2 + 5 = 2x real or complex? How many roots does it have? Find all solutions of the equation.
What is the nature of the roots of x2 + 6x + 10 = 0? Solve the equation using the quadratic formula and completing the square. How are the two methods related?
Eureka Math:Module 4 Lesson 6
5/8/2023 Page 25 of 66
Elegant ways to solve quadratic equations by factoring for those involving expressions of the form: 𝑎𝑥2 and 𝑎(𝑥−𝑏)2
A.REI.D.11 D. Represent and solve equations and inequalities graphically
Explain why the x-coordinates of the points where the graphs of the equations y = f(x) and y = g(x) intersect are the solutions of the equation f(x) = g(x); find the solutions approximately, e.g., using technology to graph the functions, make tables of values, or find successive approximations. Include cases where f(x) and/or g(x) are linear, polynomial, rational, absolute value, exponential, and logarithmic functions.
In Algebra I, tasks that assess conceptual understanding of the indicated concept may involve any of the function types mentioned in the standard except exponential and logarithmic functions. Finding the solutions approximately is limited to cases where f(x) and g(x) are polynomial functions.
Students need to understand that numerical solution methods (data in a table used to approximate an algebraic function) and graphical solution methods may produce approximate solutions, and algebraic solution methods produce precise solutions that can be represented graphically or numerically. Students may use graphing calculators or programs to generate tables of values, graph, or solve a variety of functions.
Eureka Math:Module 4 Lesson 10
F.IF.B.4 B. Interpret functions that arise in applications in terms of the context
For a function that models a relationship between two quantities, interpret key features of graphs and tables in terms of the quantities, and sketch graphs showing
Tasks have a real-world context. In Algebra I, tasks are limited to linear functions, quadratic functions, square root functions, cube root functions, piecewise-defined functions (including step functions and absolute value functions), and exponential functions with domains in the integers.
Eureka Math:Module 4 Lesson 8Module 4 Lesson 10
5/8/2023 Page 26 of 66

key features given a verbal description of the relationship. Key features include: intercepts; intervals where the function is increasing, decreasing, positive, or negative; relative maximums and minimums; symmetries; end behavior; and periodicity.
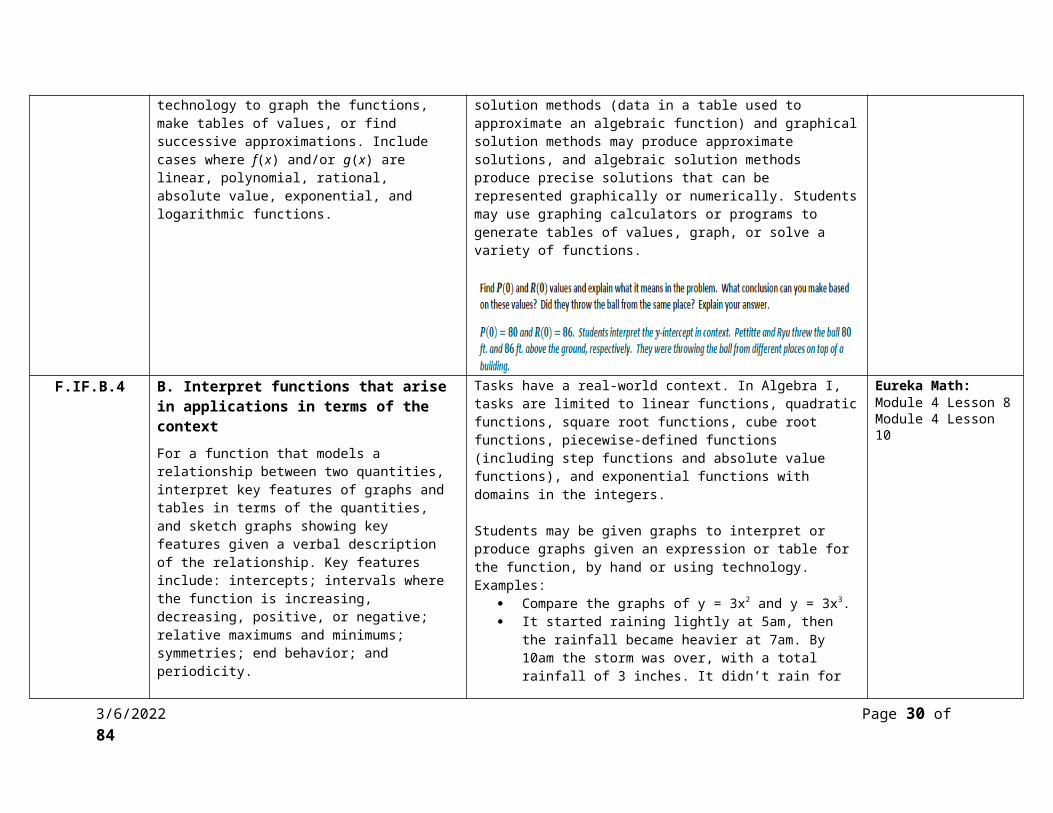
Students may be given graphs to interpret or produce graphs given an expression or table for the function, by hand or using technology.Examples:
Compare the graphs of y = 3x2 and y = 3x3. It started raining lightly at 5am, then the rainfall became
heavier at 7am. By 10am the storm was over, with a total rainfall of 3 inches. It didn’t rain for the rest of the day. Sketch a possible graph for the number of inches of rain as a function of time, from midnight to midday.
F.IF.B.5 B. Interpret functions that arise in applications in terms of the context
Relate the domain of a function to its graph and, where applicable, to the quantitative relationship it describes. For example, if the function h(n) gives the number of person- hours it takes to assemble n engines in a ‐factory, then the positive integers would be an appropriate domain for the function.
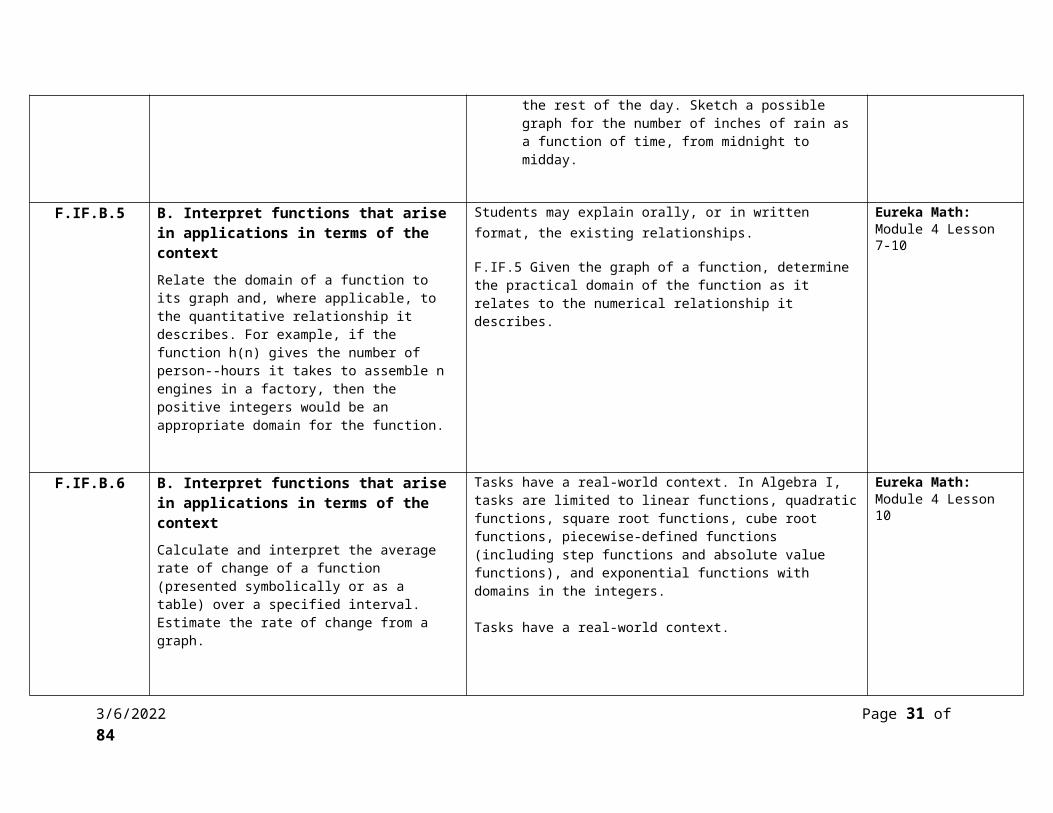
Students may explain orally, or in written format, the existing relationships.
F.IF.5 Given the graph of a function, determine the practical domain of the function as it relates to the numerical relationship it describes.
Eureka Math:Module 4 Lesson 7-10
F.IF.B.6 B. Interpret functions that arise in applications in terms of the context
Calculate and interpret the average rate of change of a function (presented symbolically or as a table) over a specified interval. Estimate the rate of change from a graph.
Tasks have a real-world context. In Algebra I, tasks are limited to linear functions, quadratic functions, square root functions, cube root functions, piecewise-defined functions (including step functions and absolute value functions), and exponential functions with domains in the integers.
Tasks have a real world context.‐
Eureka Math:Module 4 Lesson 10
F.IF.C.7a C. Analyze functions using different representations
Graph functions expressed symbolically and show key features of the graph, by hand in simple cases and using technology for more complicated cases.
a. Graph linear and quadratic functions and show
Key characteristics include but are not limited to maxima, minima, intercepts, symmetry, end behavior, and asymptotes. Students may use graphing calculators or programs, spreadsheets, or computer algebra systems to graph functions.
Eureka Math:Module 4 Lesson 8Module 4 Lesson 9
5/8/2023 Page 27 of 66
intercepts, maxima, and minima.
5/8/2023 Page 28 of 66
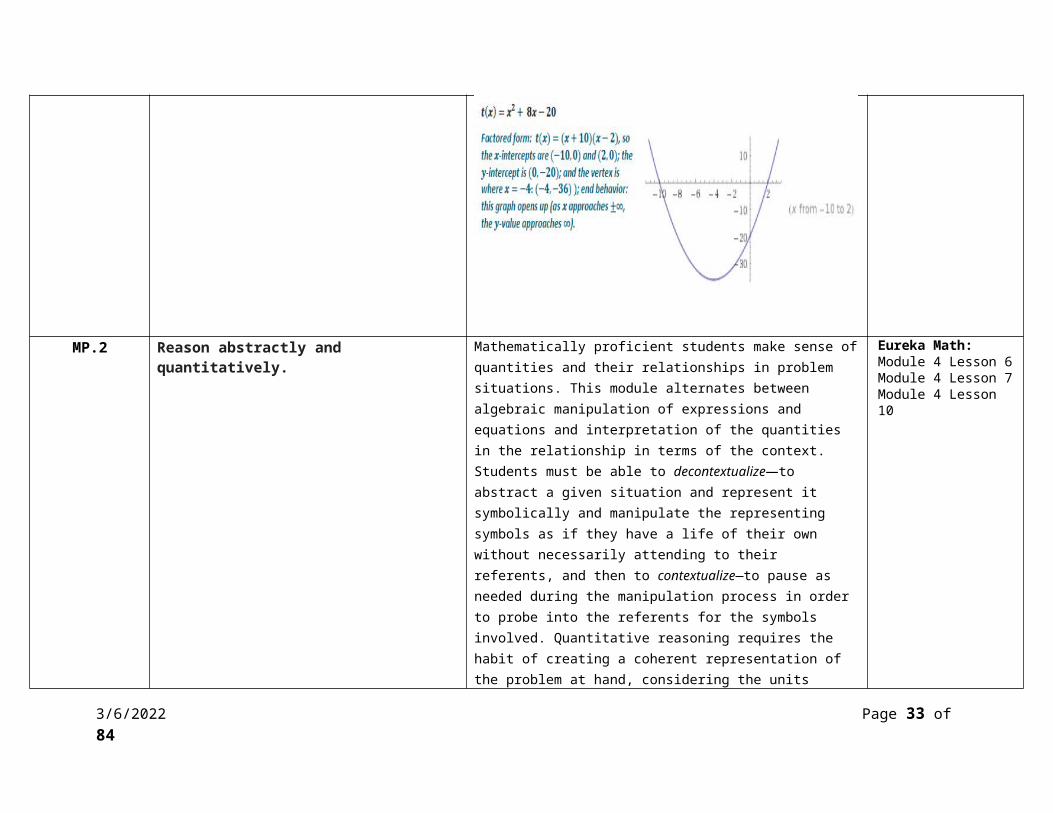
MP.2 Reason abstractly and quantitatively. Mathematically proficient students make sense of quantities and their relationships in problem situations. This module alternates between algebraic manipulation of expressions and equations and interpretation of the quantities in the relationship in terms of the context. Students must be able to decontextualize―to abstract a given situation and represent it symbolically and manipulate the representing symbols as if they have a life of their own without necessarily attending to their referents, and then to contextualize―to pause as needed during the manipulation process in order to probe into the referents for the symbols involved. Quantitative reasoning requires the habit of creating a coherent representation of the problem at hand, considering the units involved, attending to the meaning of quantities (not just how to compute them), knowing different properties of operations, and flexibility in using them.
Eureka Math:Module 4 Lesson 6Module 4 Lesson 7Module 4 Lesson 10
MP.3 Construct viable arguments and critique the reasoning of others.
Mathematically proficient students understand and use stated assumptions, definitions, and previously established results in constructing arguments. They make conjectures and build a logical progression of statements to explore the truth of their conjectures. They are able to analyze situations by breaking them into cases, and can recognize and use counterexamples. They justify their conclusions, communicate them to others, and respond to the arguments of others.
Eureka Math:Module 4 Lesson 10
MP.4 Model with mathematics. Mathematically proficient students can apply the mathematics they know to solve problems arising in everyday life, society, and the workplace. In this module, students create a function from a contextual situation described verbally, create a graph of their function, interpret key features of both the function and the graph (in the terms of the context), and answer questions related to the function and its graph. They also create a function from a data set based on a contextual situation.
Eureka Math:Module 4 Lesson 1Module 4 Lesson 2Module 4 Lesson 9
5/8/2023 Page 29 of 66
Lesson 1 asks students to use geometric models to demonstrate their understanding of multiplication of polynomials.
Lesson 2 students represent multiplication of binomials and factoring quadratic polynomials using geometric models.
MP.7 Look for and make use of structure. Mathematically proficient students look closely to discern a pattern or structure. They can see algebraic expressions as single objects, or as a composition of several objects. In this Module, students use the structure of expressions to find ways to rewrite them in different but equivalent forms. For example, in the expression 𝑥2 + 9𝑥 + 14, students must see the 14 as 2 ×7 and the 9 as 2 +7 to find the factors of the quadratic. In relating an equation to a graph, they can see 𝑦 = −3(𝑥 − 1)2 + 5 as 5 added to a negative number times a square and realize that its value cannot be more than 5 for any real domain value.
Throughout lesson 3, students are asked to make use of the structure of an expression, seeing part of a complicated expression as a single entity in order to factor quadratic expressions and to compare the areas in using geometric and tabular models.
In lesson 4, students look to discern a pattern or structure in order to rewrite a quadratic trinomial in an equivalent form.
Eureka Math:Module 4 Lesson 3Module 4 Lesson 4Module 4 Lesson 6
5/8/2023 Page 30 of 66
HS Algebra I Semester 2
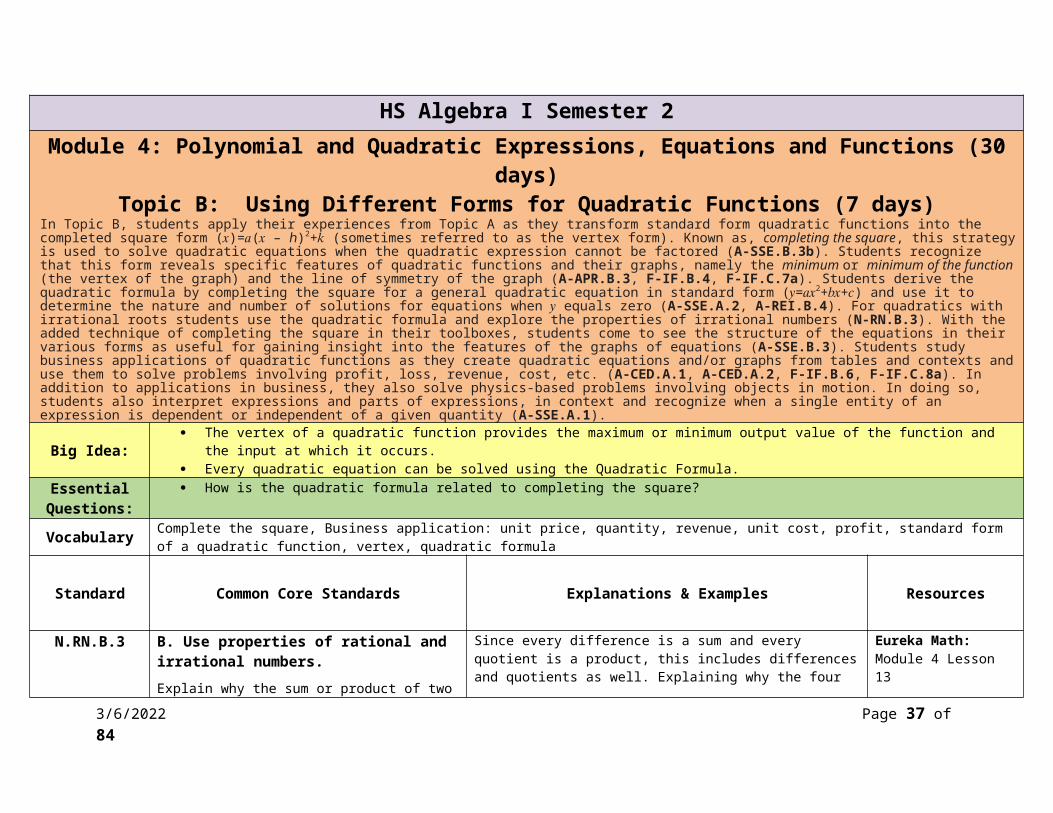
Module 4: Polynomial and Quadratic Expressions, Equations and Functions (30 days)Topic B: Using Different Forms for Quadratic Functions (7 days)
In Topic B, students apply their experiences from Topic A as they transform standard form quadratic functions into the completed square form (𝑥)=𝑎(𝑥 – ℎ)2+𝑘 (sometimes referred to as the vertex form). Known as, completing the square, this strategy is used to solve quadratic equations when the quadratic expression cannot be factored (A-SSE.B.3b). Students recognize that this form reveals specific features of quadratic functions and their graphs, namely the minimum or minimum of the function (the vertex of the graph) and the line of symmetry of the graph (A-APR.B.3, F-IF.B.4, F-IF.C.7a). Students derive the quadratic formula by completing the square for a general quadratic equation in standard form (𝑦=𝑎𝑥2+𝑏𝑥+𝑐) and use it to determine the nature and number of solutions for equations when 𝑦 equals zero (A-SSE.A.2, A-REI.B.4). For quadratics with irrational roots students use the quadratic formula and explore the properties of irrational numbers (N-RN.B.3). With the added technique of completing the square in their toolboxes, students come to see the structure of the equations in their various forms as useful for gaining insight into the features of the graphs of equations (A-SSE.B.3). Students study business applications of quadratic functions as they create quadratic equations and/or graphs from tables and contexts and use them to solve problems involving profit, loss, revenue, cost, etc. (A-CED.A.1, A-CED.A.2, F-IF.B.6, F-IF.C.8a). In addition to applications in business, they also solve physics-based problems involving objects in motion. In doing so, students also interpret expressions and parts of expressions, in context and recognize when a single entity of an expression is dependent or independent of a given quantity (A-SSE.A.1).
Big Idea: The vertex of a quadratic function provides the maximum or minimum output value of the function and the input at which it occurs. Every quadratic equation can be solved using the Quadratic Formula.
Essential Questions:
How is the quadratic formula related to completing the square?
Vocabulary Complete the square, Business application: unit price, quantity, revenue, unit cost, profit, standard form of a quadratic function, vertex, quadratic formula
Standard Common Core Standards Explanations & Examples Resources
N.RN.B.3 B. Use properties of rational and irrational numbers.
Explain why the sum or product of two rational numbers is rational; that the sum of a rational number and an irrational number is irrational; and that the product of a nonzero rational number and an irrational number is irrational.
Since every difference is a sum and every quotient is a product, this includes differences and quotients as well. Explaining why the four operations on rational numbers produce rational numbers can be a review of students understanding of fractions and negative numbers. Explaining why the sum of a rational and an irrational number is irrational, or why the product is irrational, includes reasoning about the inverse relationship between addition and subtraction (or between multiplication and addition).
Example:
Explain why the number 2π must be irrational, given that π is irrational. Answer: if 2π were rational, then half of 2π would also be rational, so π
Eureka Math:Module 4 Lesson 13
5/8/2023 Page 31 of 66

would have to be rational as well.
The sum or product of two rational numbers is always a rational number.The sum of a rational number and an irrational number is always an irrational number.The product of a rational number and an irrational number is an irrational number as long as the rational number is not zero.
A.SSE.A.1 A. Interpret the structure of expressions
Interpret expressions that represent a quantity in terms of its context
a. Interpret parts of an expression, such as terms, factors, and coefficients.
b. Interpret complicated expressions by viewing one or more of their parts as a single entity. For example, interpret P(1+r)n as the product of P and a factor not depending on P.
Students should understand the vocabulary for the parts that make up the whole expression and be able to identify those parts and interpret their meaning in terms of a context.
Eureka Math:Module 4 Lesson 11 - 17
A.SSE.A.2 A. Interpret the structure of expressions
Use the structure of an expression to identify ways to rewrite it. For example,see x4 – y4 as (x2)2 – (y2)2, thus recognizing it as a difference of squares that can be factored as(x2 – y2)(x2 + y2).
In Algebra I, tasks are limited to numerical expressions and polynomial expressions in one variable. Examples: Recognize that 532 – 472 is the difference of squares and see an opportunity to rewrite it in the easier-to-evaluate form (53 – 47)(53 + 47). See an opportunity to rewrite a2 + 9a + 14 as (a + 7)(a + 2). Can include the sum or difference of cubes (in one variable), and factoring by grouping.
Eureka Math:Module 4 Lesson 11Module 4 Lesson 12Module 4 Lesson 13Module 4 Lesson 14
5/8/2023 Page 32 of 66
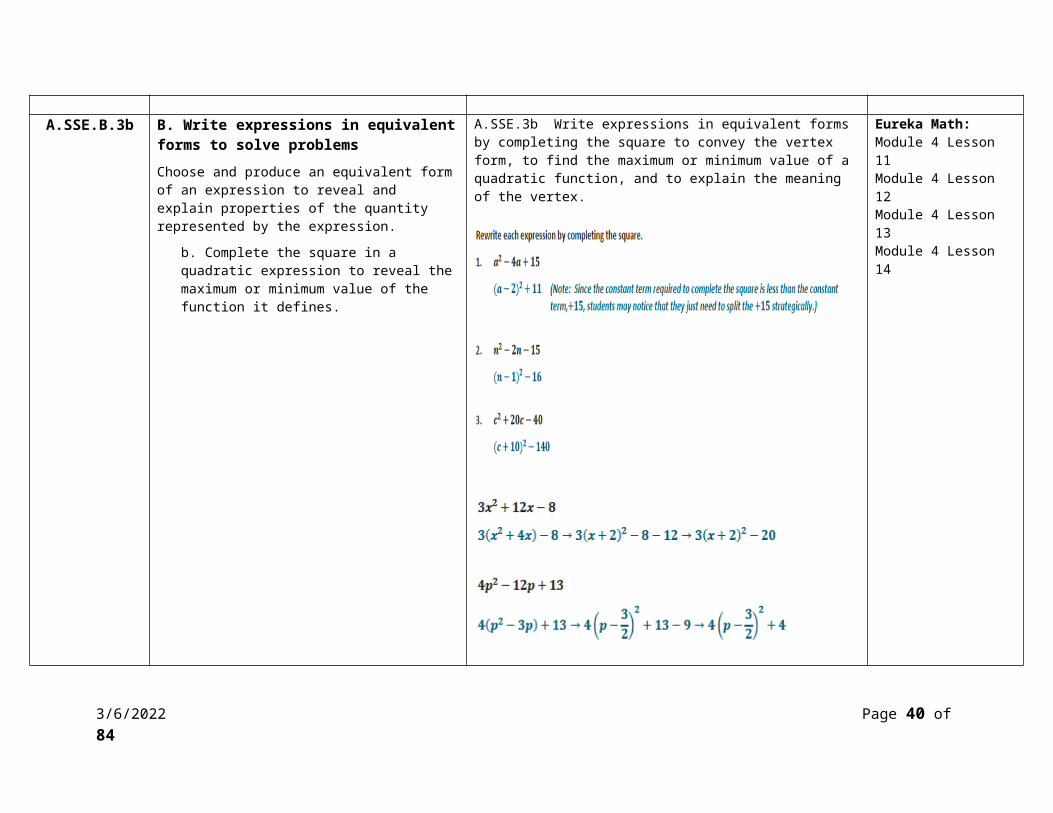
A.SSE.B.3b B. Write expressions in equivalent forms to solve problems
Choose and produce an equivalent form of an expression to reveal and explain properties of the quantity represented by the expression.
b. Complete the square in a quadratic expression to reveal the maximum or minimum value of the function it defines.
A.SSE.3b Write expressions in equivalent forms by completing the square to convey the vertex form, to find the maximum or minimum value of a quadratic function, and to explain the meaning of the vertex.
Eureka Math:Module 4 Lesson 11Module 4 Lesson 12Module 4 Lesson 13Module 4 Lesson 14
5/8/2023 Page 33 of 66
A.REI.B.4 B. Solve equations and inequalities in one variable
Solve quadratic equations in one variable.
a. Use the method of completing the square to
Students should solve by factoring, completing the square, and using the quadratic formula. The zero product property is used to explain why the factors are set equal to zero. Students should relate the value of the discriminant to the type of root to expect. A natural extension would be to relate the type of solutions to ax2 + bx + c = 0 to the
Eureka Math:Module 4 Lesson 13Module 4 Lesson 14Module 4 Lesson 15Module 4 Lesson 17
5/8/2023 Page 34 of 66
transform any quadratic equation in x into an equation of the form (x – p)2 = q that has the same solutions. Derive the quadratic formula from this form.
b. b. Solve quadratic equations by inspection (e.g., for x = 49), taking square roots, completing the square, the quadratic formula and factoring, as appropriate to the initial form of the equation. Recognize when the quadratic formula gives complex solutions and write them as a ± bi for real numbers a and b.
behavior of the graph of y = ax2 + bx + c .
Are the roots of 2x2 + 5 = 2x real or complex? How many roots does it have? Find all solutions of the equation.
What is the nature of the roots of x2 + 6x + 10 = 0? Solve the equation using the quadratic formula and completing the square. How are the two methods related?
5/8/2023 Page 35 of 66

A.APR.B.3 B. Understand the relationship between zeros and factors of polynomials
Identify zeros of polynomials when suitable factorizations are available, and use the zeros to construct a rough graph of the function defined by the polynomial.
Graphing calculators or programs can be used to generate graphs of polynomial functions.In Algebra I, tasks are limited to quadratic and cubic polynomials, in which linear and quadratic factors are available. For example, find the zeros of (x – 2)(x2 – 9).
Eureka Math:Module 4 Lesson 14
A.CED.A.1 A. Create equations that describe numbers or relationships
Create equations and inequalities in one variable and use them to solve problems. Include equations arising from linear and quadratic functions, and simple rational and exponential functions.
Equations can represent real world and mathematical problems. Include equations and inequalities that arise when comparing the values of two different functions, such as one describing linear growth and one describing exponential growth.
In Algebra I, tasks are limited to linear, quadratic, or exponential equations with integer exponents.
Examples:
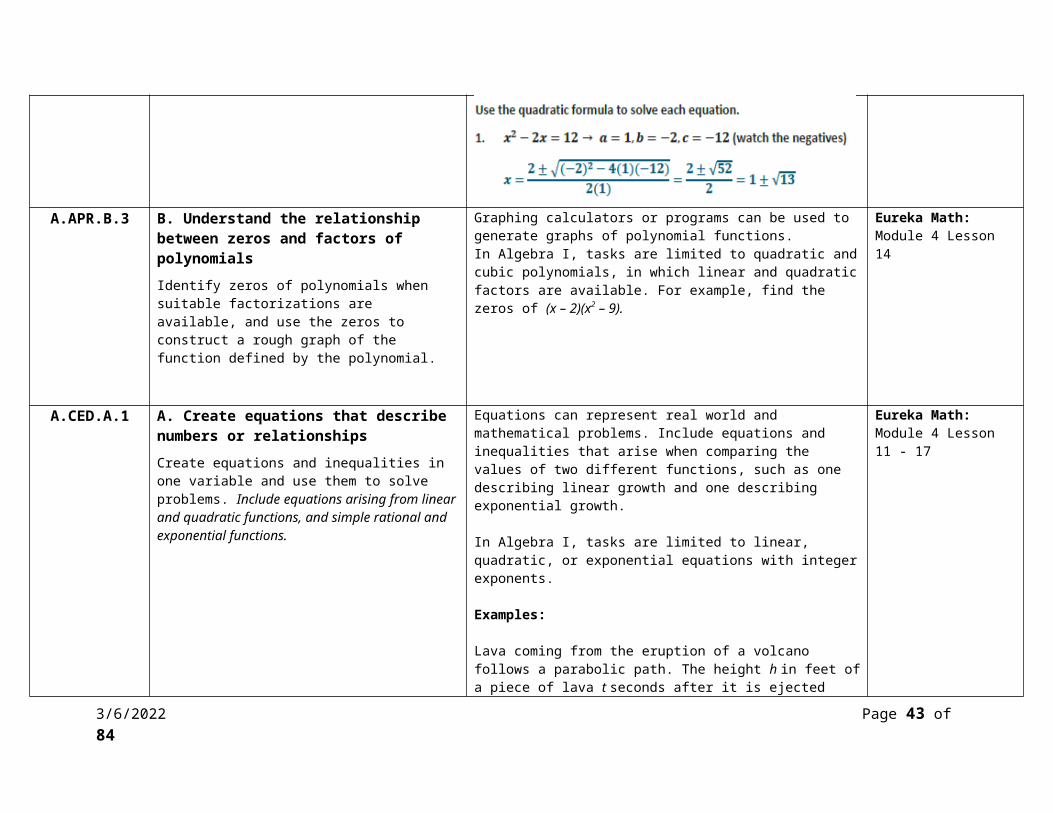
Lava coming from the eruption of a volcano follows a parabolic path. The height h in feet of a piece of lava t seconds after it is ejected from the volcano is given by h( t)=−t 2+16 t+936. After how many seconds does the lava reach its maximum height of 1000 feet?
Eureka Math:Module 4 Lesson 11 - 17
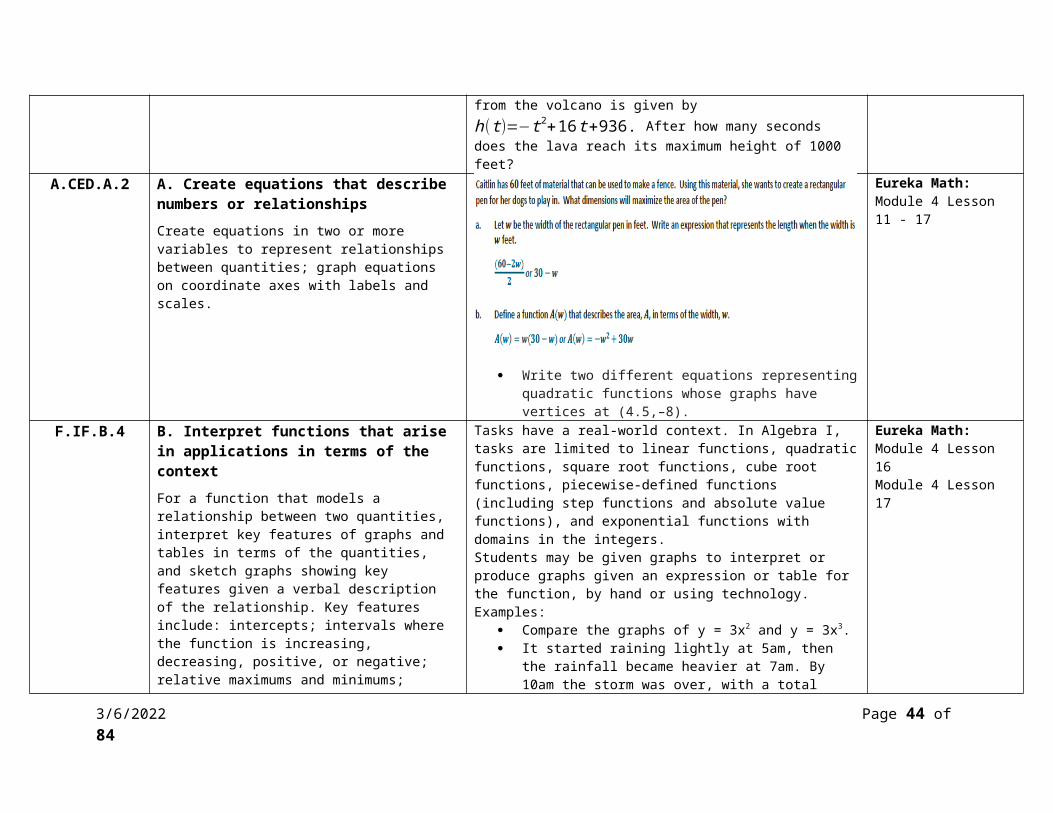
A.CED.A.2 A. Create equations that describe numbers or relationships
Create equations in two or more variables to represent relationships between quantities; graph equations on coordinate axes with labels and scales.
Write two different equations representing quadratic functions whose graphs have vertices at (4.5,–8).
Eureka Math:Module 4 Lesson 11 - 17
F.IF.B.4 B. Interpret functions that arise in applications in Tasks have a real-world context. In Algebra I, tasks are limited to linear Eureka Math:
5/8/2023 Page 36 of 66
terms of the context
For a function that models a relationship between two quantities, interpret key features of graphs and tables in terms of the quantities, and sketch graphs showing key features given a verbal description of the relationship. Key features include: intercepts; intervals where the function is increasing, decreasing, positive, or negative; relative maximums and minimums; symmetries; end behavior; and periodicity.
functions, quadratic functions, square root functions, cube root functions, piecewise-defined functions (including step functions and absolute value functions), and exponential functions with domains in the integers.Students may be given graphs to interpret or produce graphs given an expression or table for the function, by hand or using technology.Examples:
Compare the graphs of y = 3x2 and y = 3x3. It started raining lightly at 5am, then the rainfall became
heavier at 7am. By 10am the storm was over, with a total rainfall of 3 inches. It didn’t rain for the rest of the day. Sketch a possible graph for the number of inches of rain as a function of time, from midnight to midday.
Module 4 Lesson 16Module 4 Lesson 17
F.IF.B.6 B. Interpret functions that arise in applications in terms of the context
Calculate and interpret the average rate of change of a function (presented symbolically or as a table) over a specified interval. Estimate the rate of change from a graph.
Tasks have a real-world context. In Algebra I, tasks are limited to linear functions, quadratic functions, square root functions, cube root functions, piecewise-defined functions (including step functions and absolute value functions), and exponential functions with domains in the integers.
Eureka Math:Module 4 Lesson 17
F.IF.C.7a C. Analyze functions using different representations
Graph functions expressed symbolically and show key features of the graph, by hand in simple cases and using technology for more complicated cases.
a. Graph linear and quadratic functions and show intercepts, maxima, and minima.
Key characteristics include but are not limited to maxima, minima, intercepts, symmetry, end behavior, and asymptotes. Students may use graphing calculators or programs, spreadsheets, or computer algebra systems to graph functions.
Eureka Math:Module 4 Lesson 16Module 4 Lesson 17
5/8/2023 Page 37 of 66

F.IF.C.8a C. Analyze functions using different representations
Write a function defined by an expression in different but equivalent forms to reveal and explain different properties of the function.
a. Use the process of factoring and completing the square in a quadratic function to show zeros, extreme values, and symmetry of the graph, and interpret these in terms of a context.
Eureka Math:Module 4 Lesson 14Module 4 Lesson 16Module 4 Lesson 17
MP.1 Make sense of problems and persevere in solving them.
Mathematically proficient students start by explaining to themselves the meaning of a problem and looking for entry points to its solution. They analyze givens, constraints, relationships, and goals. In Module 4, students make sense of problems by analyzing the critical components of the problem, a verbal description, data set, or graph and persevere in writing the appropriate function to describe the relationship between two quantities.
Eureka Math:Module 4 Lesson 13Module 4 Lesson 14
5/8/2023 Page 38 of 66

MP.2 Reason abstractly and quantitatively. Mathematically proficient students make sense of quantities and their relationships in problem situations. This module alternates between algebraic manipulation of expressions and equations and interpretation of the quantities in the relationship in terms of the context. Students must be able to decontextualize―to abstract a given situation and represent it symbolically and manipulate the representing symbols as if they have a life of their own without necessarily attending to their referents, and then to contextualize―to pause as needed during the manipulation process in order to probe into the referents for the symbols involved. Quantitative reasoning requires the habit of creating a coherent representation of the problem at hand, considering the units involved, attending to the meaning of quantities (not just how to compute them), knowing different properties of operations, and flexibility in using them.
Eureka Math:Module 4 Lesson 17
MP.4 Model with mathematics. Mathematically proficient students can apply the mathematics they know to solve problems arising in everyday life, society, and the workplace. In this module, students create a function from a contextual situation described verbally, create a graph of their function, interpret key features of both the function and the graph (in the terms of the context), and answer questions related to the function and its graph. They also create a function from a data set based on a contextual situation. In Topic C, students use the full modeling cycle. They model quadratic functions presented mathematically or in a context. They explain the reasoning used in their writing or using appropriate tools, such as graphing paper, graphing calculator, or computer software.
Eureka Math:Module 4 Lesson 16
MP.7 Look for and make use of structure. Mathematically proficient students look closely to discern a pattern or structure. They can see algebraic expressions as single objects, or as a composition of several objects. In this Module, students use the structure of expressions to find ways to rewrite them in different but equivalent forms. For example, in the expression 𝑥2 + 9𝑥 + 14, students must see the 14 as 2 ×7 and the 9 as 2 +7 to find the factors of the quadratic. In relating an equation to a graph, they can see 𝑦 = −3(𝑥 − 1)2 + 5 as 5 added to a negative number times a square and realize that its value cannot be more than 5 for any real domain value.
Eureka Math:Module 4 Lesson 11Module 4 Lesson 12Module 4 Lesson 14Module 4 Lesson 16
MP.8 Look for and express regularity in repeated reasoning.
Mathematically proficient students notice if calculations are repeated, and look both for general methods and for shortcuts. As they work to solve a problem, mathematically proficient students maintain oversight of the process, while attending to the details. They continually evaluate
Eureka Math:Module 4 Lesson 16
5/8/2023 Page 39 of 66
the reasonableness of their intermediate results.
5/8/2023 Page 40 of 66

HS Algebra I Semester 2
Module 4: Polynomial and Quadratic Expressions, Equations and Functions (30 days)Topic C: Function Transformations and Modeling (7 days)
In topic C, students explore the families of functions that are related to the parent functions, specifically for quadratic ((𝑥)=𝑥2), square root (𝑓(𝑥)=√𝑥), and cube root (𝑓(𝑥)=√𝑥3), to perform first horizontal and vertical translations and shrinking and stretching the functions (F-IF.C.7b, F-BF.B.3). They recognize the application of transformations in the vertex form for the quadratic function and use it to expand their ability to efficiently sketch graphs of square and cube root functions. Students compare quadratic, square root, or cube root functions in context, and each represented in different ways (verbally with a description, as a table of values, algebraically, or graphically). In the final two lessons, students are given real-world problems of quadratic relationships that may be given as a data set, a graph, described relationship, and/or an equation. They choose the most useful form for writing the function and apply the techniques learned throughout the module to analyze and solve a given problem (A-CED.A.2), including calculating and interpreting the rate of change for the function over an interval (F-IF.B.6).
Big Idea: The key features of a quadratic function, which are the zeros (roots), the vertex, and the leading coefficient, can be used to interpret the function in a
context.
Essential Questions:
What is the relevance of the vertex in physics and business applications?
Vocabulary Horizontal/vertical stretch, negative scale factor, shrink, parent function, vertical scaling, scale factor,
Assessment Galileo: Topic C Assessment
Standard Common Core Standards Explanations & Examples Resources
A.CED.A.2 A. Create equations that describe numbers or relationships
Create equations in two or more variables to represent relationships between quantities; graph equations on coordinate axes with labels and scales.
Eureka Math:Module 4 Lesson 19Module 4 Lesson 21Module 4 Lesson 23Module 4 Lesson 24
5/8/2023 Page 41 of 66

F.IF.B.6 B. Interpret functions that arise in applications in terms of the context
Calculate and interpret the average rate of change of a function (presented symbolically or as a table) over a specified interval. Estimate the rate of change from a graph.
Tasks have a real-world context. In Algebra I, tasks are limited to linear functions, quadratic functions, square root functions, cube root functions, piecewise defined functions (including step functions and ‐absolute value functions), and exponential functions with domains in the integers. The focus in this module is on linear and exponential functions.
F.IF.C.7ab C. Analyze functions using different representations
Graph functions expressed symbolically and show key features of the graph, by hand in simple cases and using technology for more complicated cases.
a. Graph linear and quadratic functions and show intercepts, maxima, and minima.
b. Graph square root, cube root, and piecewise-defined functions, including step functions and absolute value functions.
Key characteristics include but are not limited to maxima, minima, intercepts, symmetry, end behavior, and asymptotes. Students may use graphing calculators or programs, spreadsheets, or computer algebra systems to graph functions.
Eureka Math:Module 4 Lesson 18 - 23
5/8/2023 Page 42 of 66
F.IF.C.8a C. Analyze functions using different representations
Write a function defined by an expression in different but equivalent forms to reveal and explain different properties of the function.
a. Use the process of factoring and completing the square in a quadratic function to show zeros, extreme values, and symmetry of the graph, and interpret these in terms of a context.
Eureka Math:Module 4 Lesson 21Module 4 Lesson 22Module 4 Lesson 23Module 4 Lesson 24
F.IF.C.9 C. Analyze functions using different representation
Compare properties of two functions each represented in a different way (algebraically, graphically, numerically in tables, or by verbal descriptions). For example, given a graph of one quadratic function and an algebraic expression for another, say which has the larger maximum.
In Algebra I, tasks are limited to linear functions, quadratic functions, square root functions, cube root functions, piecewise defined ‐functions (including step functions and absolute value functions), and exponential functions with domains in the integers.
Example: Examine the functions below. Which function has the larger
maximum? How do you know?
f ( x )=−2 x2−8x+20
Eureka Math:Module 4 Lesson 21Module 4 Lesson 22Module 4 Lesson 24
5/8/2023 Page 43 of 66
5/8/2023 Page 44 of 66
F.BF.B.3 Build new functions from existing functions
Identify the effect on the graph of replacing f(x) by f(x) + k, k f(x), f(kx), and f(x + k) for specific values of k (both positive and negative); find the value of k given the graphs. Experiment with cases and illustrate an explanation of the effects on the graph using technology. Include recognizing even and odd functions from their graphs and algebraic expressions for them.
In Algebra I, identifying the effect on the graph of replacing f(x) by f(x) + k, k f(x), f(kx), and f(x+k) for specific values of k (both positive and negative) is limited to linear and quadratic functions. Experimenting with cases and illustrating an explanation of the effects on the graph using technology is limited to linear functions, quadratic functions, square root functions, cube root functions, piecewise-defined functions (including step functions and absolute value functions), and exponential functions with domains in the integers. Tasks do not involve recognizing even and odd functions. The focus in this module is
Eureka Math:Module 4 Lesson 18Module 4 Lesson 19Module 4 Lesson 20
5/8/2023 Page 45 of 66

on linear and exponential functions.
MP.1 Make sense of problems and persevere in solving them.
Mathematically proficient students start by explaining to themselves the meaning of a problem and looking for entry points to its solution. They analyze givens, constraints, relationships, and goals. In Module 4,
Eureka Math:Module 4 Lesson 23Module 4 Lesson 24
5/8/2023 Page 46 of 66
students make sense of problems by analyzing the critical components of the problem, a verbal description, data set, or graph and persevere in writing the appropriate function to describe the relationship between two quantities.
MP.2 Reason abstractly and quantitatively. Mathematically proficient students make sense of quantities and their relationships in problem situations. This module alternates between algebraic manipulation of expressions and equations and interpretation of the quantities in the relationship in terms of the context. Students must be able to decontextualize―to abstract a given situation and represent it symbolically and manipulate the representing symbols as if they have a life of their own without necessarily attending to their referents, and then to contextualize―to pause as needed during the manipulation process in order to probe into the referents for the symbols involved. Quantitative reasoning requires the habit of creating a coherent representation of the problem at hand, considering the units involved, attending to the meaning of quantities (not just how to compute them), knowing different properties of operations, and flexibility in using them.
Eureka Math:Module 4 Lesson 23Module 4 Lesson 24
MP.3 Construct viable arguments and critique the reasoning of others.
Mathematically proficient students understand and use stated assumptions, definitions, and previously established results in constructing arguments. They make conjectures and build a logical progression of statements to explore the truth of their conjectures. They are able to analyze situations by breaking them into cases, and can recognize and use counterexamples. They justify their conclusions, communicate them to others, and respond to the arguments of others.
Eureka Math:Module 4 Lesson 19Module 4 Lesson 20
MP.4 Model with mathematics. Mathematically proficient students can apply the mathematics they know to solve problems arising in everyday life, society, and the workplace. In this module, students create a function from a contextual situation described verbally, create a graph of their function, interpret key features of both the function and the graph (in the terms of the context), and answer questions related to the function and its graph. They also create a function from a data set based on a contextual situation. In Topic C, students use the full modeling cycle. They model quadratic functions presented mathematically or in a context. They explain the reasoning used in their writing or using appropriate tools, such as graphing paper, graphing calculator, or computer software.
Eureka Math:Module 4 Lesson 23Module 4 Lesson 24
MP.6 Attend to precision. Mathematically proficient students try to communicate precisely to others. They state the meaning of the symbols they choose, including
Eureka Math:Module 4 Lesson 22
5/8/2023 Page 47 of 66
using the equal sign consistently and appropriately. They are careful about specifying units of measure and labeling axes to clarify the correspondence with quantities in a problem. When calculating and reporting quantities in all topics of Module 4, students must be precise in choosing appropriate units and use the appropriate level of precision based on the information as it is presented. When graphing, they must select an appropriate scale.
Module 4 Lesson 23Module 4 Lesson 24
MP.7 Look for and make use of structure. Mathematically proficient students look closely to discern a pattern or structure. They can see algebraic expressions as single objects, or as a composition of several objects. In this Module, students use the structure of expressions to find ways to rewrite them in different but equivalent forms. For example, in the expression 𝑥2 + 9𝑥 + 14, students must see the 14 as 2 ×7 and the 9 as 2 +7 to find the factors of the quadratic. In relating an equation to a graph, they can see 𝑦 = −3(𝑥 − 1)2 + 5 as 5 added to a negative number times a square and realize that its value cannot be more than 5 for any real domain value.
Eureka Math:Module 4 Lesson 19Module 4 Lesson 20Module 4 Lesson 21
MP.8 Look for and express regularity in repeated reasoning.
Mathematically proficient students notice if calculations are repeated, and look both for general methods and for shortcuts. As they work to solve a problem, mathematically proficient students maintain oversight of the process, while attending to the details. They continually evaluate the reasonableness of their intermediate results.
Eureka Math:Module 4 Lesson 19Module 4 Lesson 20
5/8/2023 Page 48 of 66

HS Algebra I Semester 2
Module 5: A Synthesis of Modeling with Equations and Functions (20 Days)Topic A: Elements of Modeling (3 days)
In Grade 8, students use functions for the first time to construct a function to model a linear relationship between two quantities (8.F.4) and to describe qualitatively the functional relationship between two quantities by analyzing a graph (8.F.5). In the first four modules of Grade 9, students learn to create and apply linear, quadratic, and exponential functions, in addition to square and cube root functions (F-IF.C.7). In Module 5, they synthesize what they have learned during the year by selecting the correct function type in a series of modeling problems without the benefit of a module or lesson title that includes function type to guide them in their choices. This supports the CCSS requirement that students use the modeling cycle, in the beginning of which they must formulate a strategy. Skills and knowledge from the previous modules will support the requirements of this module, including writing, rewriting, comparing, and graphing functions (F- IF.C.7, F-IF.C.8, F-IF.C.9) and interpretation of the parameters of an equation (F-LE.B.5). They also draw on their study of statistics in Module 2, using graphs and functions to model a context presented with data and/or tables of values (S-ID.B.6). In this module, we use the modeling cycle (see page 72 of the CCSS) as the organizing structure, rather than function type.Topic A focuses on the skills inherent in the modeling process: representing graphs, data sets, or verbal descriptions using explicit expressions (F-BF.A.1a) when presented in graphic form in Lesson 1, as data in Lesson 2, or as a verbal description of a contextual situation in Lesson 3. They recognize the function type associated with the problem (F-LE.A.1b, F-LE.A.1c) and match to or create 1- and 2-variable equations (A- CED.A.1, A-CED.2) to model a context presented graphically, as a data set, or as a description (F-LE.A.2). Function types include linear, quadratic, exponential, square root, cube root, absolute value, and other piecewise functions. Students interpret features of a graph in order to write an equation that can be used to model it and the function (F-IF.B.4, F-BF.A.1) and relate the domain to both representations (F-IF.B.5). This topic focuses on the skills needed to complete the modeling cycle and sometimes uses purely mathematical models, sometimes real-world contexts.
Big Idea: Graphs are used to represent a function and to model a context. Identifying a parent function and thinking of the transformation of the parent function to the graph of the function can help with creating the
analytical representation of the function.
Essential Questions:
When presented with a graph, what is the most important key feature that will help one recognize they type of function it represents? Which graphs have a minimum/maximum value? Which graphs have domain restrictions? Which of the parent functions are transformations of other parent functions? How is one able to recognize the function if the graph is a transformation of the parent function? How would one know which function to use to model a word problem?
VocabularyAnalytic model, descriptive model, (function, range, parent function, linear function, quadratic function, exponential function, average rate of change, cube root function, square root function, end behavior, recursive process, piecewise defined function, parameter, arithmetic sequence, geometric sequence, first differences, second differences, analytical model)
Assessments Galileo: Foundational Skills Assessment for Module 5; topic A assessment
Standard Common Core Standards Explanations & Examples Resources
N.Q.A.2 A. Reason quantitatively and use units to solve This standard will be assessed in Algebra I by ensuring that some Eureka Math:
5/8/2023 Page 49 of 66
problems.
Define appropriate quantities for the purpose of descriptive modeling.
modeling tasks (involving Algebra I content or securely held content from Grades 6–8) require the student to create a quantity of interest in the situation being described.
Module 5 Lesson 1 - 3
A.CED.A.1 A. Create equations that describe numbers or relationships
Create equations and inequalities in one variable and use them to solve problems. Include equations arising from linear and quadratic functions, and simple rational and exponential functions.
In Algebra I, tasks are limited to linear, quadratic, or exponential equations with integer exponents.
Eureka Math:Module 5 Lesson 1 - 3
A.CED.A.2 A. Create equations that describe numbers or relationships
Create equations in two or more variables to represent relationships between quantities; graph equations on coordinate axes with labels and scales.
Eureka Math:Module 5 Lesson 1 - 3
F.IF.B.4 B. Interpret functions that arise in applications in terms of the context
For a function that models a relationship between two quantities, interpret key features of graphs and tables in terms of the quantities, and sketch graphs showing key features given a verbal description of the relationship. Key features include: intercepts; intervals where the function is increasing, decreasing, positive, or
Tasks have a real-world context. In Algebra I, tasks are limited to linear functions, quadratic functions, square root functions, cube root functions, piecewise-defined functions (including step functions and absolute value functions), and exponential functions with domains in the integers.Students may be given graphs to interpret or produce graphs given an expression or table for the function, by hand or using technology.
Eureka Math:Module 5 Lesson 1 - 3
5/8/2023 Page 50 of 66
negative; relative maximums and minimums; symmetries; end behavior; and periodicity.
F.IF.B.5 B. Interpret functions that arise in applications in terms of the context
Relate the domain of a function to its graph and, where applicable, to the quantitative relationship it describes. For example, if the function h(n) gives the number of person-hours it takes to assemble n engines in a factory, then the positive integers would be an appropriate domain for the function.
Eureka Math:Module 5 Lesson 1 - 3
F.IF.B.6 B. Interpret functions that arise in applications in terms of the context
Calculate and interpret the average rate of change of a function (presented symbolically or as a table) over a specified interval. Estimate the rate of change from a graph.
Note: Tasks have a real-world context. In Algebra I, tasks are limited to linear, quadratic, square root, cube root, piecewise-defined (including step functions and absolute value functions), and exponential functions with domains in the integers.
Eureka Math:Module 5 Lesson 1 - 3
F.BF.A.1a Build a function that models a relationship between two quantities
Write a function that describes a relationship between two quantities.
a. Determine an explicit expression, a recursive process, or steps for calculation from a context.
Tasks have a real-world context. In Algebra I, tasks are limited to linear functions, quadratic functions, and exponential functions with domains in the integers.
Students will analyze a given problem to determine the function expressed by identifying patterns in the function’s rate of change. They will specify intervals of increase, decrease, constancy, and, if possible, relate them to the function’s description in words or graphically. Students may use graphing calculators or programs, spreadsheets, or computer algebra systems to model functions.
Eureka Math:Module 5 Lesson 1 - 3
F.LE.A.1bc A. Construct and compare linear, quadratic, and exponential models and solve problems
Distinguish between situations that can be modeled with linear functions and with exponential functions.
Students may use graphing calculators or programs, spreadsheets, or computer algebra systems to model and compare linear and exponential functions.
Eureka Math:Module 5 Lesson 1 - 3
5/8/2023 Page 51 of 66

b. Recognize situations in which one quantity changes at a constant rate per unit interval relative to another.
c. Recognize situations in which a quantity grows or decays by a constant percent rate per unit interval relative to another.
F.LE.A.2 A. Construct and compare linear, quadratic, and exponential models and solve problems
Construct linear and exponential functions, including arithmetic and geometric sequences, given a graph, a description of a relationship, or two input-output pairs (include reading these from a table).
In Algebra I, tasks are limited to constructing linear and exponential functions in simple context (not multi-step).
Students may use graphing calculators or programs, spreadsheets, or computer algebra systems to construct linear and exponential functions.
Eureka Math:Module 5 Lesson 1 - 3
MP.1 Make sense of problems and persevere in solving them.
Mathematically proficient students start by explaining to themselves the meaning of a problem and looking for entry points to its solution. They analyze givens, constraints, relationships, and goals. In Module 5, students make sense of the problem by analyzing the critical components of the problem, presented as a verbal description, a data set, or a graph and persevere in writing the appropriate function that describes the relationship between two quantities. Then, they interpret the function in the context.
Eureka Math:Module 5 Lesson 1Module 5 Lesson 2Module 5 Lesson 3
MP.3 Construct viable arguments and critique the reasoning of others.
Mathematically proficient students understand and use stated assumptions, definitions, and previously established results in constructing arguments. They make conjectures and build a logical progression of statements to explore the truth of their conjectures. They are able to analyze situations by breaking them into cases, and can recognize and use counterexamples. They justify their conclusions, communicate them to others, and respond to the arguments of others.
Eureka Math:Module 5 Lesson 2
MP.4 Model with mathematics. Mathematically proficient students can apply the mathematics they know to solve problems arising in everyday life, society, and the workplace. In this module, students create a function from a contextual situation described verbally, create a graph of their function, interpret key features of both the function and the graph in the terms of the context, and answer questions related to the function and its graph. They also create a function from a data set based on a contextual
Eureka Math:Module 5 Lesson 1Module 5 Lesson 2Module 5 Lesson 3
5/8/2023 Page 52 of 66

situation. In Topic B, students use the full modeling cycle with functions presented mathematically or in a context, including linear, quadratic, and exponential. They explain their mathematical thinking in writing and/or by using appropriate tools, such as graph paper, graphing calculator, or computer software.
MP.5 Use appropriate tools strategically. Mathematically proficient students consider the available tools when solving a mathematical problem. These tools might include pencil and paper, concrete models, a ruler, a protractor, a calculator, a spreadsheet, a computer algebra system, a statistical package, or dynamic geometry software. Proficient students are sufficiently familiar with tools appropriate for their grade or course to make sound decisions about when each of these tools might be helpful, recognizing both the insight to be gained and their limitations. Throughout the entire module students must decide whether or not to use a tool to help find solutions. They must graph functions that are sometimes difficult to sketch (e.g., cube root and square root) and sometimes are required to perform procedures that can be tedious, and sometimes distract from the mathematical thinking, when performed without technology (e.g., completing the square with non-integer coefficients). In these cases, students must decide whether to use a tool to help with the calculation or graph so they can better analyze the model. Students should have access to a graphing calculator for use on the module assessment.
Eureka Math:Module 5 Lesson 3
MP.8 Look for and express regularity in repeated reasoning.
Mathematically proficient students notice if calculations are repeated, and look both for general methods and for shortcuts. As they work to solve a problem, mathematically proficient students maintain oversight of the process, while attending to the details. They continually evaluate the reasonableness of their intermediate results.
Eureka Math:Module 5 Lesson 2
5/8/2023 Page 53 of 66
HS Algebra I Semester 2
Module 5: A Synthesis of Modeling with Equations and Functions (20 Days)Topic B: Completing the Modeling Cycle (6 days)
Tables, graphs, and equations all represent models. We use terms such as “symbolic” or “analytic” to refer specifically to the equation form of a function model; “descriptive model” refers to a model that seeks to describe or summarize phenomena, such as a graph. In Topic B, students expand on their work in Topic A to complete the modeling cycle for a real-world contextual problem presented as a graph, a data set, or a verbal description. For each, they formulate a function model, perform computations related to solving the problem, interpret the problem and the model, and then, through iterations of revising their models as needed, validate, and report their results.Students choose and define the quantities of the problem (N-Q.A.2) and the appropriate level of precision for the context (N-Q.A.3). They create 1- and 2-variable equations (A-CED.A.1, A-CED.A.2) to model the context when presented as a graph, as data and as a verbal description. They can distinguish between situations that represent a linear (F-LE.A.1b), quadratic, or exponential (F-LE.A.1c) relationship. For data, they look for first differences to be constant for linear, second differences to be constant for quadratic, and a common ratio for exponential. When there are clear patterns in the data, students will recognize when the pattern represents a linear (arithmetic) or exponential (geometric) sequence (F-BF.A.1a, F-LE.A.2). For graphic presentations, they interpret the key features of the graph, and for both data sets and verbal descriptions they sketch a graph to show the key features (F-IF.B.4). They calculate and interpret the average rate of change over an interval, estimating when using the graph (F-IF.B.6), and relate the domain of the function to its graph and to its context (F-IF.B.5).
Big Idea:
Data plots and other visual displays of data can help us determine the function type that appears to be the best fit for the data. The full modeling cycle is used to interpret the function and its graph, compute for the rate of change over an interval and attend to precision to solve real world problems in context of population growth and decay and other problems in geometric sequence or
forms of linear, exponential, and quadratic functions.
Essential Questions:
Why would one want to represent a graph of a function in analytical form? Why would one want to represent a graph as a table of values?
VocabularyAnalytic model, descriptive model, (function, range, parent function, linear function, quadratic function, exponential function, average rate of change, cube root function, square root function, end behavior, recursive process, piecewise defined function, parameter, arithmetic sequence, geometric sequence, first differences, second differences, analytical model)
Assessment Galileo: Topic B Assessment
Standard Common Core Standards Explanations & Examples Comments
N.Q.A.2 A. Reason qualitatively and units to solve problems
Define appropriate quantities for the purpose of descriptive modeling.
This standard will be assessed in Algebra I by ensuring that some modeling tasks (involving Algebra I content or securely held content from Grades 6–8) require the student to create a quantity of interest in the situation being described.
Eureka Math:Module 5 Lesson 4 - 9
5/8/2023 Page 54 of 66

N.Q.A.3 A. Reason qualitatively and units to solve problems
Choose a level of accuracy appropriate to limitations on measurement when reporting quantities.
Eureka Math:Module 5 Lesson 4 - 9
A.CED.A.1 A. Create equations that describe numbers or relationships
Create equations and inequalities in one variable and use them to solve problems. Include equations arising from linear and quadratic functions, and simple rational and exponential functions.
In Algebra I, tasks are limited to linear, quadratic, or exponential equations with integer exponents.
Equations can represent real world and mathematical problems. Include equations and inequalities that arise when comparing the values of two different functions, such as one describing linear growth and one describing exponential growth.
Eureka Math:Module 5 Lesson 4 - 9
5/8/2023 Page 55 of 66

A.CED.A.2 A. Create equations that describe numbers or relationships
Create equations in two or more variables to represent relationships between quantities; graph equations on coordinate axes with labels and scales.
Eureka Math:Module 5 Lesson 4 - 9
F.IF.B.4 B. Interpret functions that arise in applications in terms of the context
For a function that models a relationship between two quantities, interpret key features of graphs and tables in terms of the quantities, and sketch graphs showing key features given a verbal description of the relationship. Key features include: intercepts; intervals where the function is increasing, decreasing, positive, or negative; relative maximums and minimums; symmetries; end behavior; and periodicity.
Tasks have a real-world context. In Algebra I, tasks are limited to linear functions, quadratic functions, square root functions, cube root functions, piecewise-defined functions (including step functions and absolute value functions), and exponential functions with domains in the integers.
Students may be given graphs to interpret or produce graphs given an expression or table for the function, by hand or using technology.Examples:
A rocket is launched from 180 feet above the ground at time t = 0. The function that models this situation is given by h = – 16t2 + 96t + 180, where t is measured in seconds and h is height above the ground measured in feet.o What is a reasonable domain restriction for t in this
Eureka Math:Module 5 Lesson 4 - 9
5/8/2023 Page 56 of 66

context?o Determine the height of the rocket two seconds after it
was launched.o Determine the maximum height obtained by the rocket.o Determine the time when the rocket is 100 feet above the
ground.o Determine the time at which the rocket hits the ground.o How would you refine your answer to the first question
based on your response to the second and fifth questions?
F.IF.B.5 B. Interpret functions that arise in applications in terms of the context
Relate the domain of a function to its graph and, where applicable, to the quantitative relationship it describes. For example, if the function h(n) gives the number of person-hours it takes to assemble n engines in a factory, then the positive integers would be an appropriate domain for the function.
F.IF.5 Given the graph of a function, determine the practical domain of the function as it relates to the numerical relationship it describes.
Eureka Math:Module 5 Lesson 4 - 9
5/8/2023 Page 57 of 66
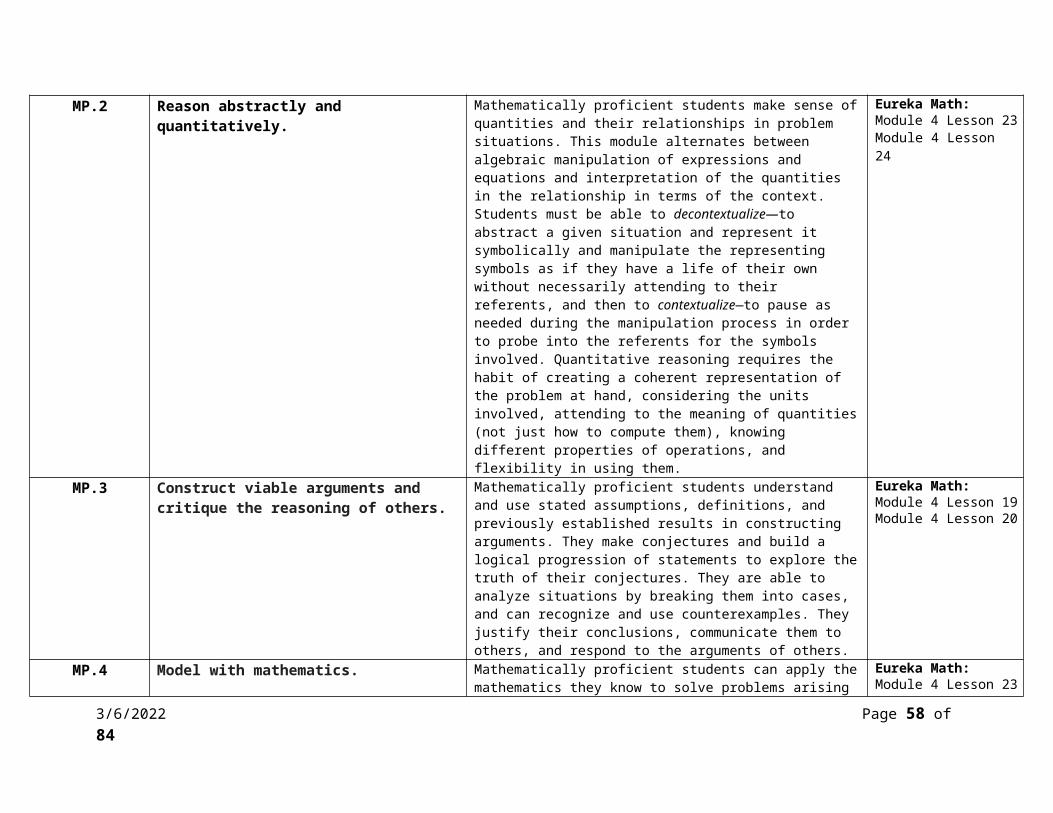
F.IF.B.6 B. Interpret functions that arise in applications in terms of the context
Calculate and interpret the average rate of change of a function (presented symbolically or as a table) over a specified interval. Estimate the rate of change from a graph.
In Algebra I, tasks are limited to linear functions, quadratic functions, square root functions, cube root functions, piecewise defined ‐functions (including step functions and absolute value functions), and exponential functions with domains in the integers.
Eureka Math:Module 5 Lesson 4 - 9
F.BF.A.1a Build a function that models a relationship Tasks have a real-world context. In Algebra I, tasks are limited to linear Eureka Math:
5/8/2023 Page 58 of 66
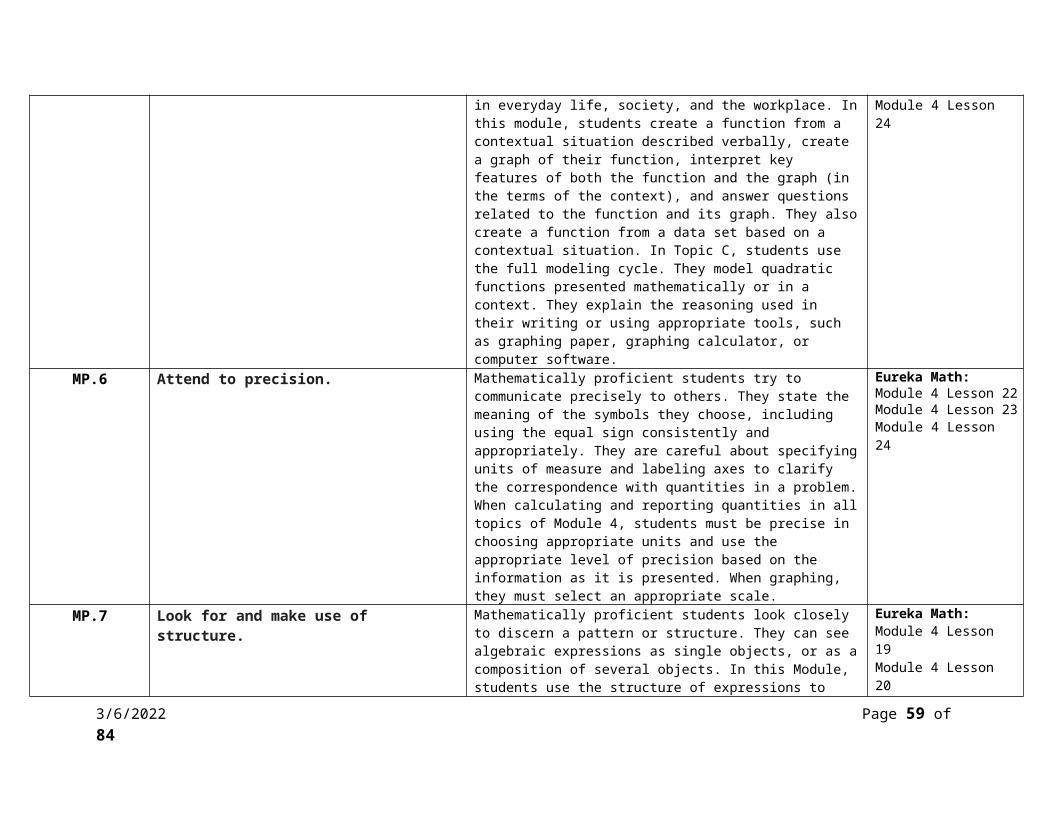
between two quantities
Write a function that describes a relationship between two quantities.
a. Determine an explicit expression, a recursive process, or steps for calculation from a context.
functions, quadratic functions, and exponential functions with domains in the integers.
Students will analyze a given problem to determine the function expressed by identifying patterns in the function’s rate of change. They will specify intervals of increase, decrease, constancy, and, if possible, relate them to the function’s description in words or graphically. Students may use graphing calculators or programs, spreadsheets, or computer algebra systems to model functions.
Examples:
You buy a $10,000 car with an annual interest rate of 6 percent compounded annually and make monthly payments of $250. Express the amount remaining to be paid off as a function of the number of months, using a recursion equation.
A cup of coffee is initially at a temperature of 93º F. The difference between its temperature and the room temperature of 68º F decreases by 9% each minute. Write a function describing the temperature of the coffee as a function of time.
The radius of a circular oil slick after t hours is given in feet by r=10t 2−0.5 t , for 0 ≤ t ≤ 10. Find the area of the oil slick as a function of time.
Module 5 Lesson 4 - 9
F.LE.A.1bc A. Construct and compare linear, quadratic, and exponential models and solve problems
Distinguish between situations that can be modeled with linear functions and with exponential functions.
b. Recognize situations in which one quantity changes at a constant rate per unit interval relative to another.
c. Recognize situations in which a quantity grows or decays by a constant percent rate per unit interval relative to another.
Students may use graphing calculators or programs, spreadsheets, or computer algebra systems to model and compare linear and exponential functions.Examples:
A cell phone company has three plans. Graph the equation for each plan, and analyze the change as the number of minutes used increases. When is it beneficial to enroll in Plan 1? Plan 2? Plan 3?
1. $59.95/month for 700 minutes and $0.25 for each additional minute,
2. $39.95/month for 400 minutes and $0.15 for each additional minute, and
3. $89.95/month for 1,400 minutes and $0.05 for each additional minute.
Eureka Math:Module 5 Lesson 4 - 9
5/8/2023 Page 59 of 66
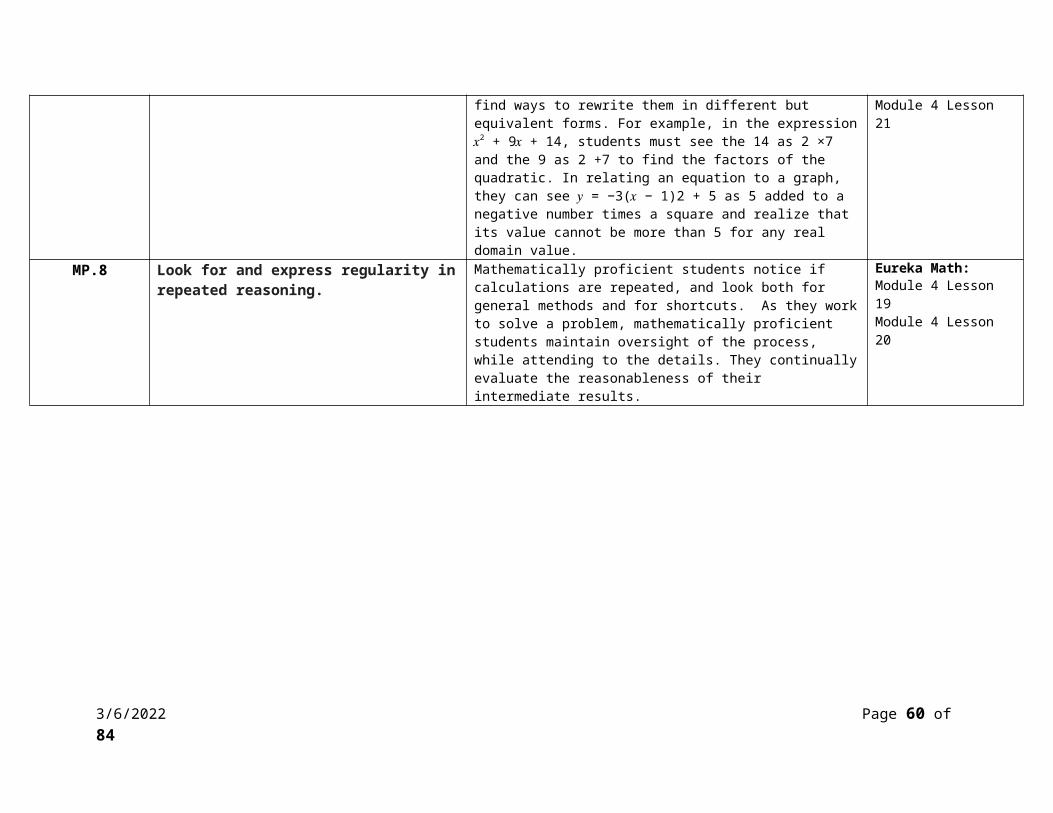
A computer store sells about 200 computers at the price of $1,000 per computer. For each $50 increase in price, about ten fewer computers are sold. How much should the computer store charge per computer in order to maximize their profit?
Students can investigate functions and graphs modeling different situations involving simple and compound interest. Students can compare interest rates with different periods of compounding (monthly, daily) and compare them with the corresponding annual percentage rate. Spreadsheets and applets can be used to explore and model different interest rates and loan terms.Students can use graphing calculators or programs, spreadsheets, or computer algebra systems to construct linear and exponential functions.Examples:
A couple wants to buy a house in five years. They need to save a down payment of $8,000. They deposit $1,000 in a bank account earning 3.25% interest, compounded quarterly. How much will they need to save each month in order to meet their goal?
Sketch and analyze the graphs of the following two situations. What information can you conclude about the types of growth each type of interest has?
Lee borrows $9,000 from his mother to buy a car. His mom charges him 5% interest a year, but she does not compound the interest.
Lee borrows $9,000 from a bank to buy a car. The bank charges 5% interest compounded annually.
Calculate the future value of a given amount of money, with and without technology.
Calculate the present value of a certain amount of money for a given length of time in the future, with and without technology.
F.LE.A.2 A. Construct and compare linear, quadratic, and exponential models and solve problems
Construct linear and exponential functions, including arithmetic and geometric sequences, given a graph, a
In Algebra I, tasks are limited to constructing linear and exponential functions in simple context (not multi-step).Students may use graphing calculators or programs, spreadsheets, or computer algebra systems to construct linear and exponential functions.
Eureka Math:Module 5 Lesson 4 - 9
5/8/2023 Page 60 of 66
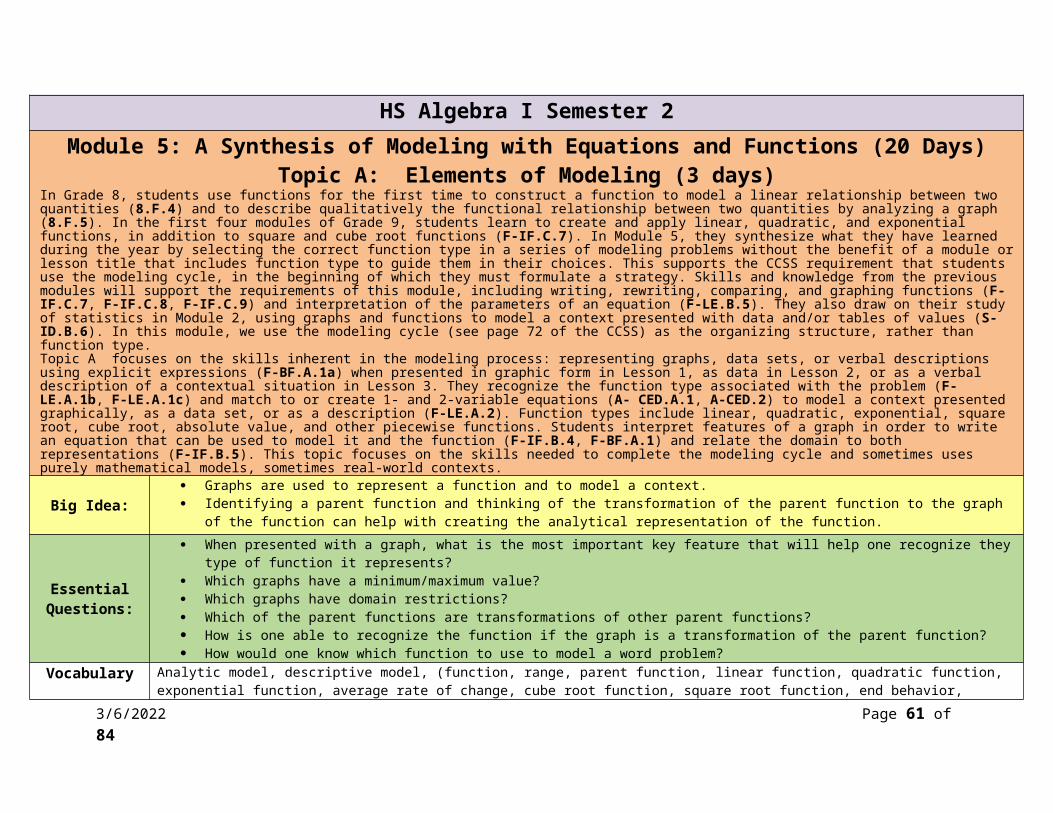
description of a relationship, or two input-output pairs (include reading these from a table).
Examples: Determine an exponential function of the form f(x) = abx using
data points from the table. Graph the function and identify the key characteristics of the graph.
x f(x)0 11 33 27
Sara’s starting salary is $32,500. Each year she receives a $700 raise. Write a sequence in explicit form to describe the situation.
F.IF.B.6 B. Interpret functions that arise in applications in terms of the context
Calculate and interpret the average rate of change of a function (presented symbolically or as a table) over a specified interval. Estimate the rate of change from a graph.
In Algebra I, tasks are limited to linear functions, quadratic functions, square root functions, cube root functions, piecewise defined ‐functions (including step functions and absolute value functions), and exponential functions with domains in the integers. The focus in this module is on linear and exponential functions.
Eureka Math:Module 5 Lesson 4 - 9
F.BF.A.1a A. Build a function that models a relationship between two quantities
Write a function that describes a relationship between two quantities.
a. Determine an explicit expression, a recursive process, or steps for calculation from a context.
Tasks have a real-world context. In Algebra I, tasks are limited to linear functions, quadratic functions, and exponential functions with domains in the integers.
Students will analyze a given problem to determine the function expressed by identifying patterns in the function’s rate of change. They will specify intervals of increase, decrease, constancy, and, if possible, relate them to the function’s description in words or graphically. Students may use graphing calculators or programs, spreadsheets, or computer algebra systems to model functions.Examples:
Eureka Math:Module 5 Lesson 4 - 9
5/8/2023 Page 61 of 66
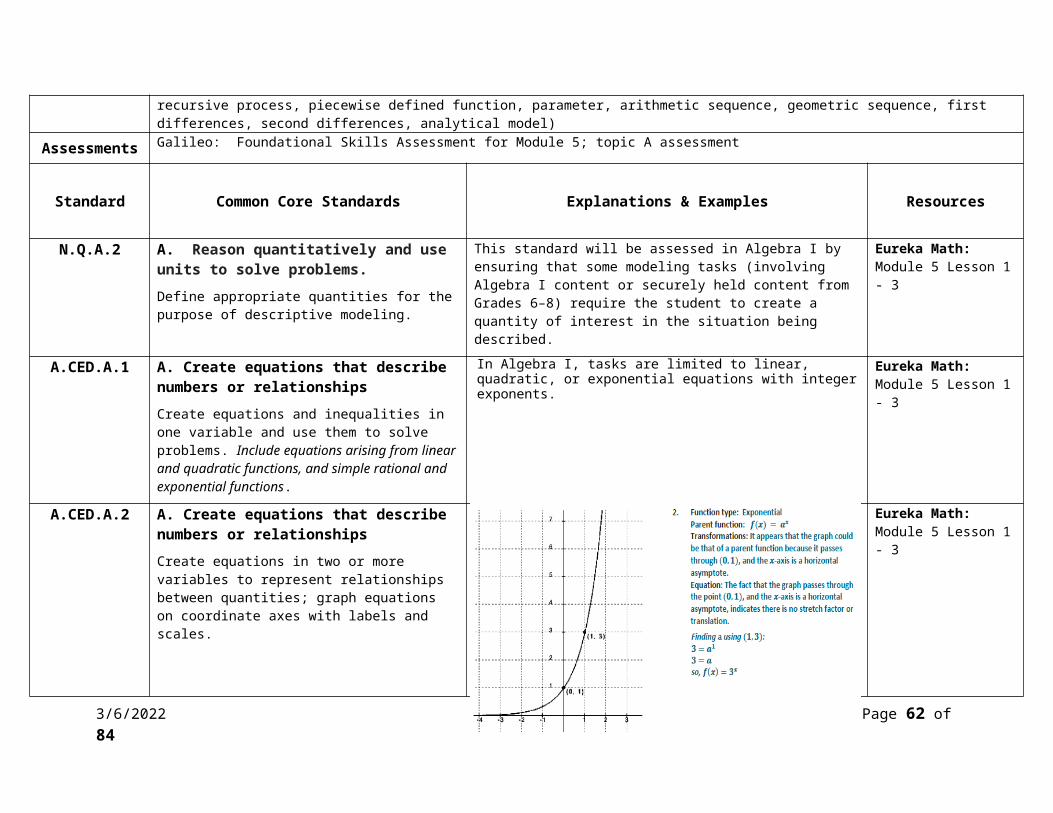
You buy a $10,000 car with an annual interest rate of 6 percent compounded annually and make monthly payments of $250. Express the amount remaining to be paid off as a function of the number of months, using a recursion equation.
A cup of coffee is initially at a temperature of 93º F. The difference between its temperature and the room temperature of 68º F decreases by 9% each minute. Write a function describing the temperature of the coffee as a function of time.
F.LE.A.1 A. Construct and compare linear, quadratic, and exponential models and solve problems
Distinguish between situations that can be modeled with linear functions and with exponential functions.
Students may use graphing calculators or programs, spreadsheets, or computer algebra systems to model and compare linear and exponential functions.Examples:
A computer store sells about 200 computers at the price of $1,000 per computer. For each $50 increase in price, about ten fewer computers are sold. How much should the computer store charge per computer in order to maximize their profit?
Students can investigate functions and graphs modeling different situations involving simple and compound interest. Students can compare interest rates with different periods of compounding
Eureka Math:Module 5 Lesson 4 - 9
5/8/2023 Page 62 of 66

(monthly, daily) and compare them with the corresponding annual percentage rate. Spreadsheets and applets can be used to explore and model different interest rates and loan terms.Students can use graphing calculators or programs, spreadsheets, or computer algebra systems to construct linear and exponential functions.
A couple wants to buy a house in five years. They need to save a down payment of $8,000. They deposit $1,000 in a bank account earning 3.25% interest, compounded quarterly. How much will they need to save each month in order to meet their goal?
Sketch and analyze the graphs of the following two situations. What information can you conclude about the types of growth each type of interest has?o Lee borrows $9,000 from his mother to buy a car. His
mom charges him 5% interest a year, but she does not compound the interest.
o Lee borrows $9,000 from a bank to buy a car. The bank charges 5% interest compounded annually.
Calculate the future value of a given amount of money, with and without technology.
Calculate the present value of a certain amount of money for a given length of time in the future, with and without technology.
F.LE.A.2 A. Construct and compare linear, quadratic, and exponential models and solve problems
Construct linear and exponential functions, including arithmetic and geometric sequences, given a graph, a description of a relationship, or two input- output ‐pairs (include reading these from a table).
In Algebra I, tasks are limited to constructing linear and exponential functions in simple context (not multi-step).
Students may use graphing calculators or programs, spreadsheets, or computer algebra systems to construct linear and exponential functions.Examples:
Sara’s starting salary is $32,500. Each year she receives a $700 raise. Write a sequence in explicit form to describe the situation.
In Algebra I, tasks are limited to constructing linear and exponential functions in simple context (not multi step).‐
Eureka Math:Module 5 Lesson 4 - 9
5/8/2023 Page 63 of 66

5/8/2023 Page 64 of 66

F.LE.A.3 A. Construct and compare linear, quadratic, and exponential models and solve problems
Observe using graphs and tables that a quantity increasing exponentially eventually exceeds a quantity increasing linearly, quadratically, or (more generally) as a polynomial function.
Example:Contrast the growth of the f(x)=x3 and f(x)=3x.
Eureka Math:Module 5 Lesson 4 - 9
MP.1 Make sense of problems and persevere in solving them.
Mathematically proficient students start by explaining to themselves the meaning of a problem and looking for entry points to its solution. They analyze givens, constraints, relationships, and goals. In Module 5, students make sense of the problem by analyzing the critical components of the problem, presented as a verbal description, a data set, or a graph and persevere in writing the appropriate function that describes the relationship between two quantities. Then, they interpret the function in the context.
Eureka Math:Module 5 Lesson 4Module 5 Lesson 8
MP.4 Model with mathematics. Mathematically proficient students can apply the mathematics they know to solve problems arising in everyday life, society, and the workplace. In this module, students create a function from a contextual situation described verbally, create a graph of their function, interpret key features of both the function and the graph in the terms of the context, and answer questions related to the function and its graph. They also create a function from a data set based on a contextual situation. In Topic B, students use the full modeling cycle with functions presented mathematically or in a context, including linear, quadratic, and exponential. They explain their mathematical thinking in writing and/or by using appropriate tools, such as graph paper, graphing calculator, or computer software.
Eureka Math:Module 5 Lesson 4Module 5 Lesson 5Module 5 Lesson 8Module 5 Lesson 9
MP.6 Attend to precision. Mathematically proficient students try to communicate precisely to others. They state the meaning of the symbols they choose, including using the equal sign consistently and appropriately. They are careful about specifying units of measure and labeling axes to clarify the correspondence with quantities in a problem. When calculating and reporting quantities in all topics of Module 5 students must choose the appropriate units and use the appropriate level of precision based on the information as it is presented. When graphing they must select an
Eureka Math:Module 5 Lesson 6Module 5 Lesson 7Module 5 Lesson 9
5/8/2023 Page 65 of 66

appropriate scale.MP.7 Look for and make use of structure. Mathematically proficient students look closely to discern a pattern or
structure. They also can step back for an overview and shift perspective. They can see complicated things, such as some algebraic expressions, as single objects or as being composed of several objects.
Eureka Math:Module 5 Lesson 5
5/8/2023 Page 66 of 66