Embed Size (px)
Citation preview
CTS850 SDH/PDH Test Set User Manual 3�229
Viewing Results
This section describes how to view, save, recall, and print test results.
You can look at test results while a test is running or after it hascompleted. The CTS850 SDH/PDH Test Set can display test resultsas a summary or in a more detailed tabular form. The CTS850 alsodisplays measurement history in a graphical format.
Press the RESULTS button in the middle of the front panel to call upthe RESULTS menus.
G.826, M.2101.1, M.2100, and G.821 AnalysisG.826 � Error Performance � By monitoring Severly ErroredSeconds (SES) events for both directions at a single path end point, anetwork provider is able to determine the unavailable state of thepath. This service measure is intended for in�service qualitymeasurements of 2 Mb/s and above (including SDH rates). G.826uses block�based measurements, that is, multiple errors in a blockare counted as one block error.
PDH G.826 is based on frame and CRC errors and is an in�servicemeasurement. G.826 makes use of block�based measurements to getmedia�independent results and thus is more convenient forin�service measurement.
M.2101.1 � This ITU�T provides limits for bringing�into�service(BIS), and limits for maintenance of international SDH paths andinternational SDH multiplex sections in order to achieve theperformance objectives given for a multiservice environment. Theseobjectives include error performance (Recommendation G.826) andunavailability (Recommendation G.827).

Viewing Results
3�230 CTS850 SDH/PDH Test Set User Manual
M.2100 � This measure of service quality is similar to G.821 in thatis uses bit�based error measurement. M.2100 combines all errorsources during a one (1) errored second count without regard tosource (for example, FAS, CRC�4, Code violation, etc.). Out�of�ser-vice measurements use a PRBS pattern, and count bit errors as wellas frame�related in�service error types (for example, FAS, CRC�4).In�service measurements count frame�related in�service error typesonly (FAS, CRC�4).
G.821 analysis is based on pattern bit errors occurring within thepayload of an SDH or PDH rate signal. Bit�based measurements aremade on the payload with a PRBS pattern. G.821 is anout�of�servicemeasurement since the normal traffic payload isreplaced by a test pattern.
Viewing a Summary of ResultsTo display a summary of test results:
Press MenuButton
Select MenuPage
HighlightParameter Select Choice
RESULTS TEST SUMMARY none none
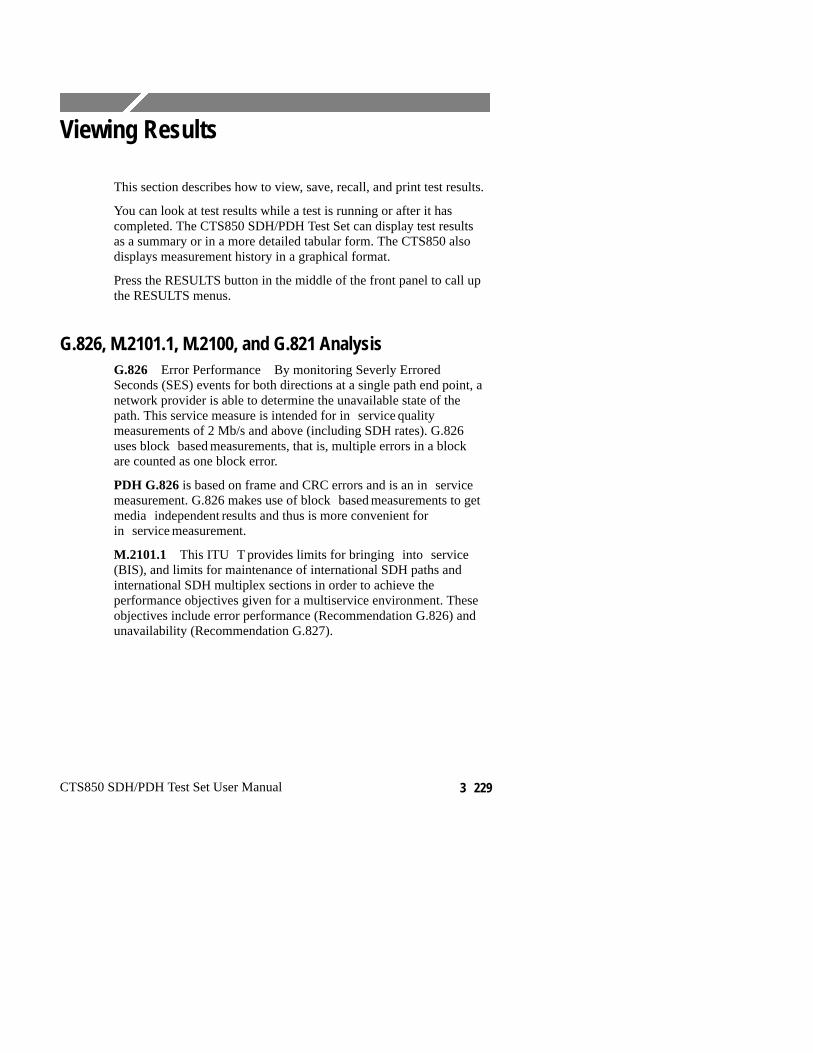
Figure 3�85 shows the TEST SUMMARY page. The top half of thedisplay shows the source of the displayed results, the rate of thedisplayed results, the structure and payload of the displayed results,when the displayed test results started and the duration of the test(elapsed time). The Results structure is the Receive Setup structuresetting for the active test, Payload is the active payload.
The bottom half of the display is where the TroubleScan featuredisplays information. TroubleScan provides a quick overview of testresults by displaying the four most significant alarm, failure, or errorconditions that have occurred during the test. The specific conditionsthat TroubleScan displays depends on the problems detected in thesignal during the test.
Viewing Results
CTS850 SDH/PDH Test Set User Manual 3�231
Figure 3�85:The Test Summary Page
Viewing Detailed ResultsYou can view results either as a summary or as a history. Thesummary format displays test results in a table. The history formatdisplays test results in a graphical format.
The summary format is displayed on a number of pages in theRESULTS menu. The sub�pages available under the RESULTSmenu are shown in the table below.
RESULTS
TestSummary
SDHResults
PDHResults
Jitter &Wander
ErrorAnalysis
PerfAnalysis
�More�1 of 2
TestSummary
SDHResults
PDHResults
HistoryGraphs
SaveResults
RecallResults
�More�2 of 2
The choices available from each sub�page are listed in the followingtable.

Viewing Results
3�232 CTS850 SDH/PDH Test Set User Manual
Table 3�37:Vertical Menu Choices, from RESULTS Sub�Pages
RESULTS Sub�Page Menu choices Displayed
SDH Results Network Defects
Section Defects
Path Defects
SDH Anomalies
Pointers
PDH Results Network Defects
PDH Defects
PDH Anomalies
PDH Slips
Jitter & Wander Jitter
Wander frequency
Error Analysis SDH G.826
PDH G.826
SDH M.2101.1
PDH M.2100
Pattern Bit G.821
Performance Analysis G.826
M.2101.1
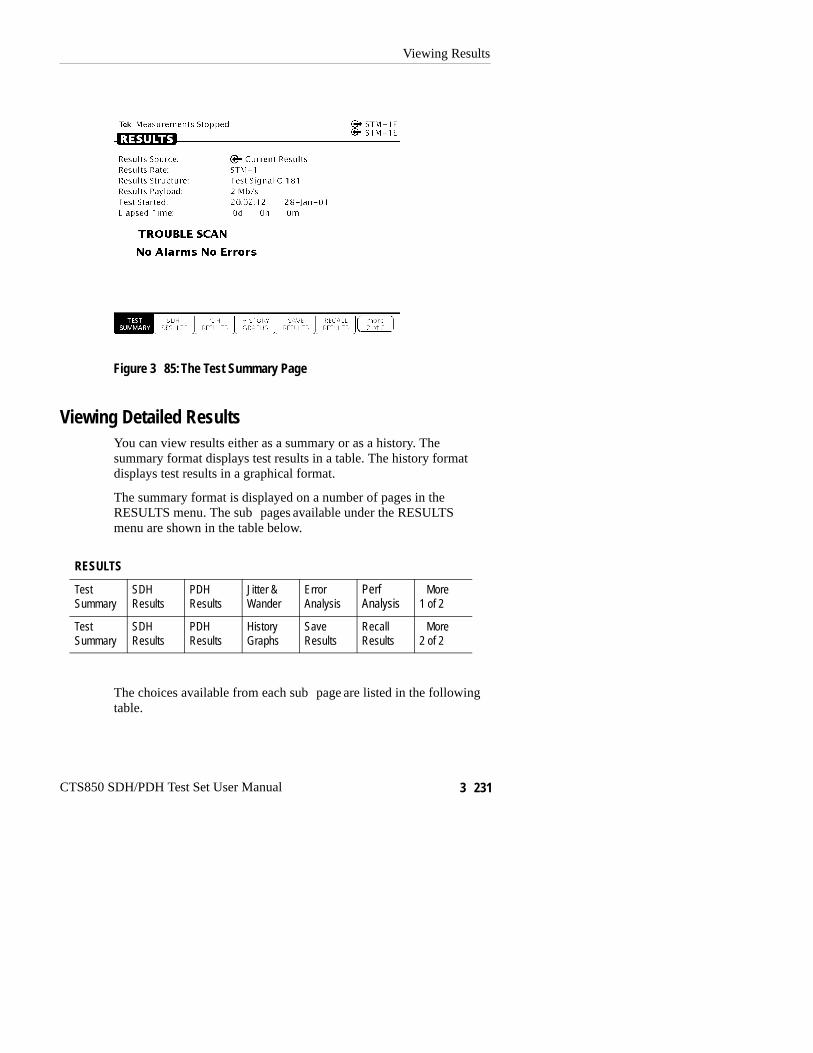
The following menu screens illustrate examples of the sub�pagesavailable from the RESULTS menu.
Viewing Results
CTS850 SDH/PDH Test Set User Manual 3�233
Figure 3�86:Example of RESULTS menu, SDH Results,SDH Path Defects
Figure 3�87:Example of RESULTS menu, PDH Results, PDH Anomalies
Viewing Results
3�234 CTS850 SDH/PDH Test Set User Manual
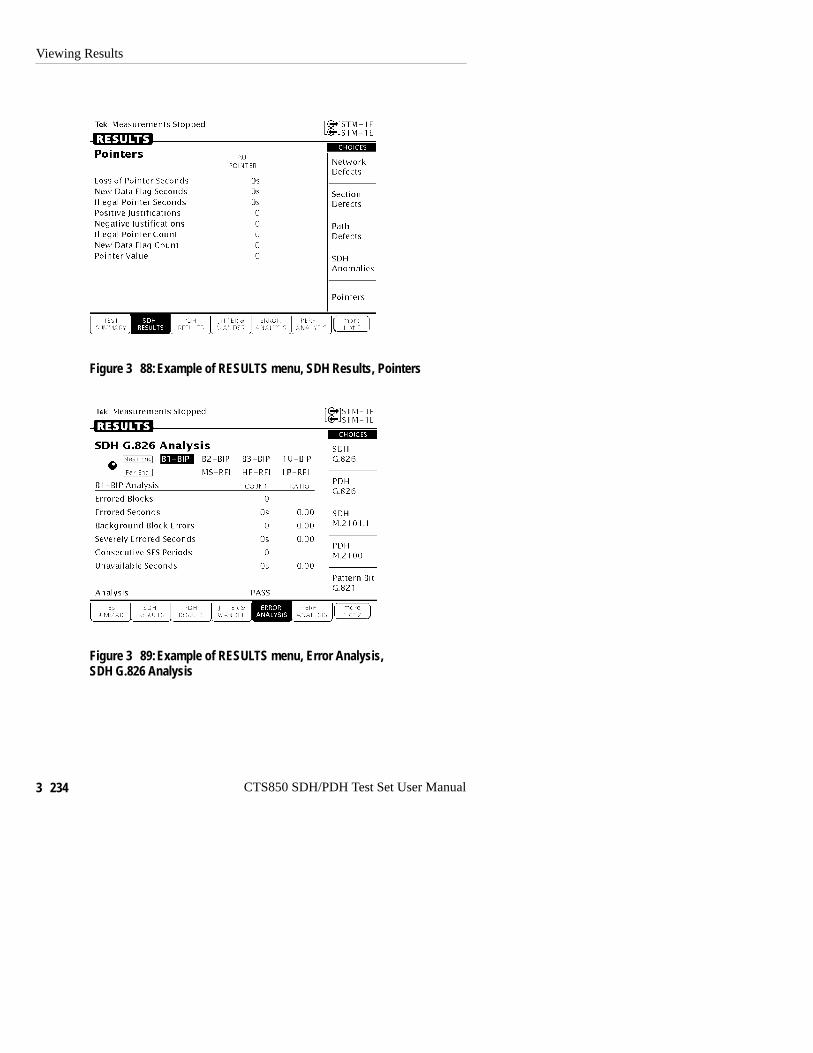
Figure 3�88:Example of RESULTS menu, SDH Results, Pointers
Figure 3�89:Example of RESULTS menu, Error Analysis,SDH G.826 Analysis
Viewing Results
CTS850 SDH/PDH Test Set User Manual 3�235
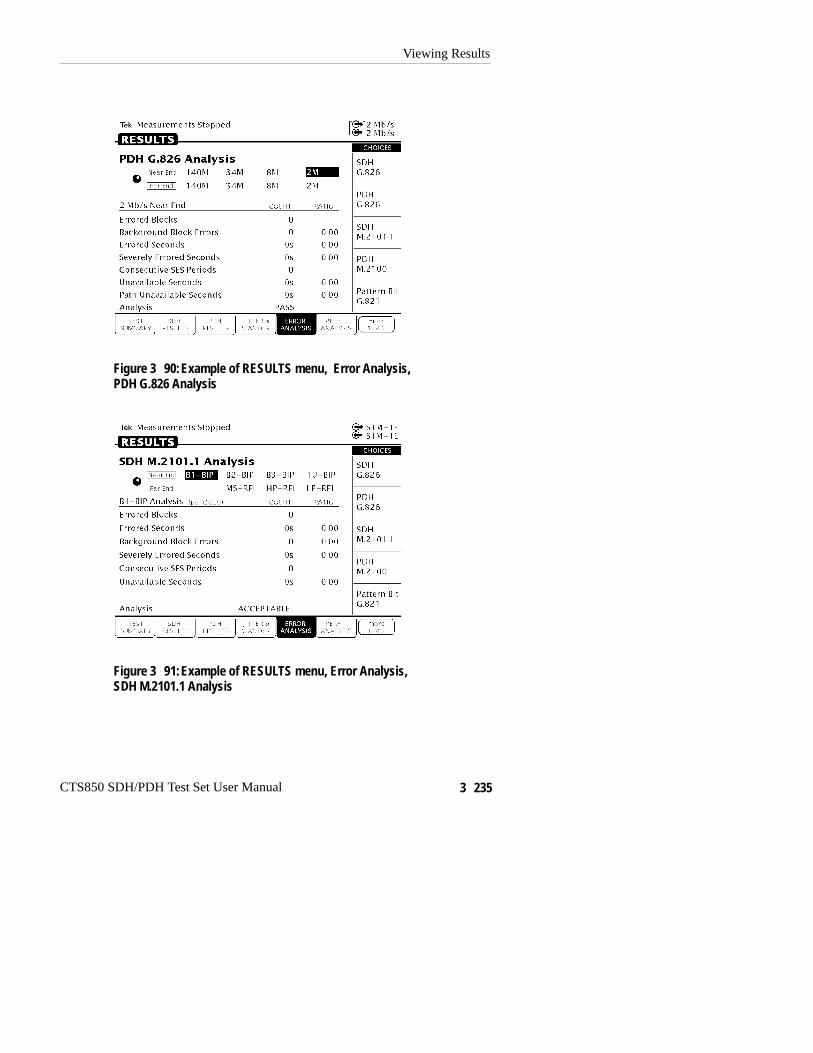
Figure 3�90:Example of RESULTS menu, Error Analysis,PDH G.826 Analysis
Figure 3�91:Example of RESULTS menu, Error Analysis,SDH M.2101.1 Analysis
Viewing Results
3�236 CTS850 SDH/PDH Test Set User Manual
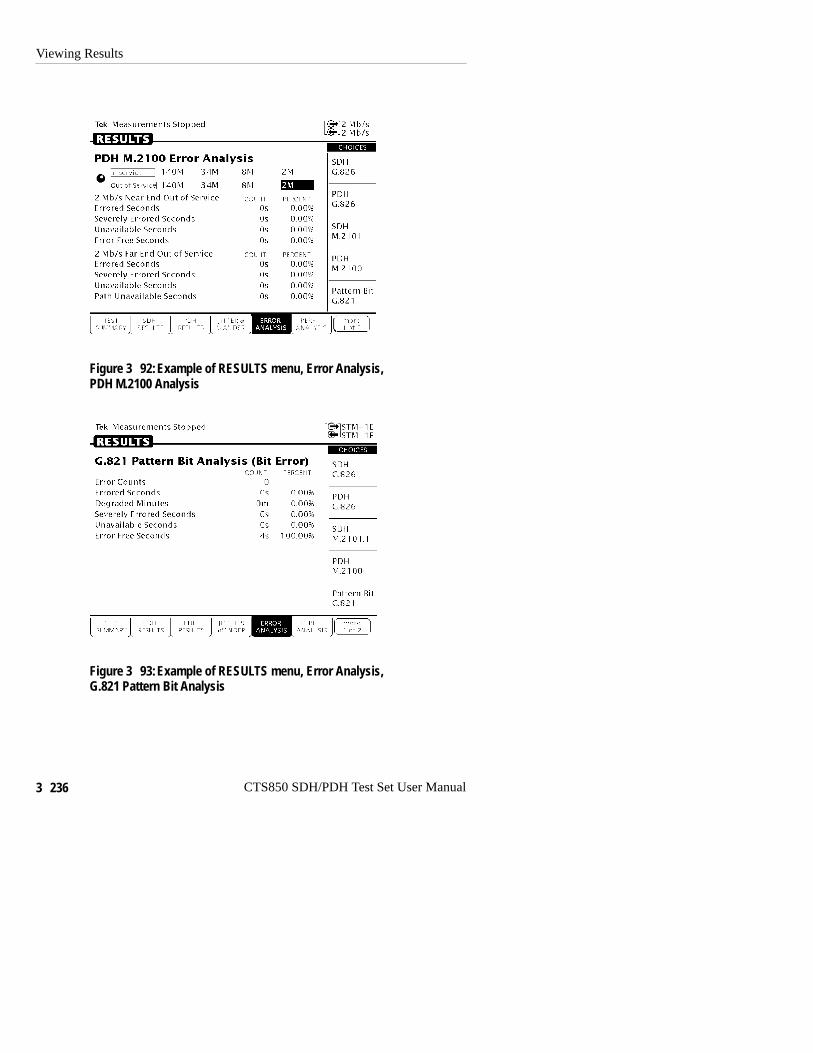
Figure 3�92:Example of RESULTS menu, Error Analysis,PDH M.2100 Analysis
Figure 3�93:Example of RESULTS menu, Error Analysis,G.821 Pattern Bit Analysis
Viewing Results
CTS850 SDH/PDH Test Set User Manual 3�237
Displaying an Analysis of Test Results
To display an analysis of test results:
Press MenuButton
Select MenuPage
HighlightParameter Select Choice
RESULTS See specificchoices
see specificchoices
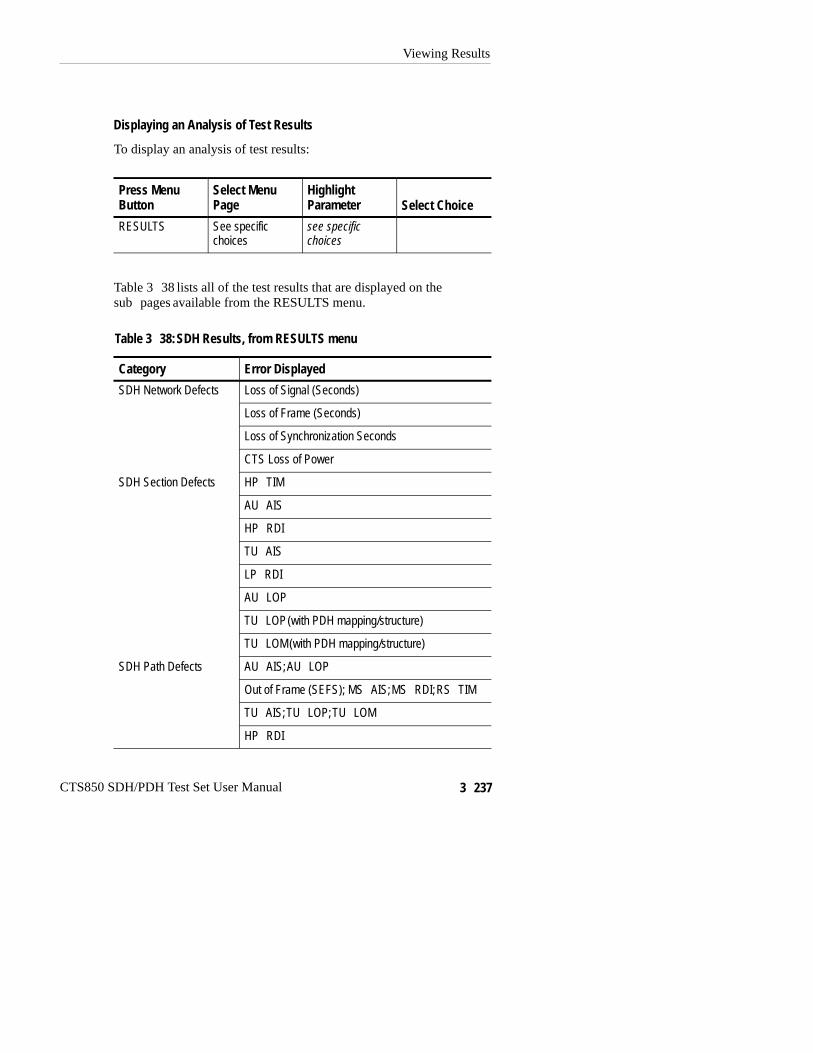
Table 3�38 lists all of the test results that are displayed on thesub�pages available from the RESULTS menu.
Table 3�38:SDH Results, from RESULTS menu
Category Error Displayed
SDH Network Defects Loss of Signal (Seconds)
Loss of Frame (Seconds)
Loss of Synchronization Seconds
CTS Loss of Power
SDH Section Defects HP�TIM
AU�AIS
HP�RDI
TU�AIS
LP�RDI
AU�LOP
TU�LOP(with PDH mapping/structure)
TU�LOM(with PDH mapping/structure)
SDH Path Defects AU�AIS;AU�LOP
Out of Frame (SEFS); MS�AIS;MS�RDI;RS�TIM
TU�AIS;TU�LOP;TU�LOM
HP�RDI

Viewing Results
3�238 CTS850 SDH/PDH Test Set User Manual
Table 3�38:SDH Results, from RESULTS menu (Cont.)
Category Error Displayed
LP�RDI;LP�RFI
HP�TIM;HP�PLM;HP�UNEQ
LP�TIM;LP�PLM;LP�UNEQ
SDH Anomalies STM FAS
RS B1 BIP
MS B2 BIP
Path B3 BIP
TU Path BIP
Pattern Bit
MS�REI
HP�REI,LP�REI
Pointers Loss of Pointer Seconds
New Data Flag Seconds
Illegal Pointer Seconds
Positive Justifications
Negative Justifications
Illegal Pointer Count
New Data Flag Count
Pointer Value
Table 3�39:PDH Results, from RESULTS menu
Category Error Displayed
PDH Network Defects Loss of Signal (Seconds)
Loss of Frame (Seconds)
Viewing Results
CTS850 SDH/PDH Test Set User Manual 3�239
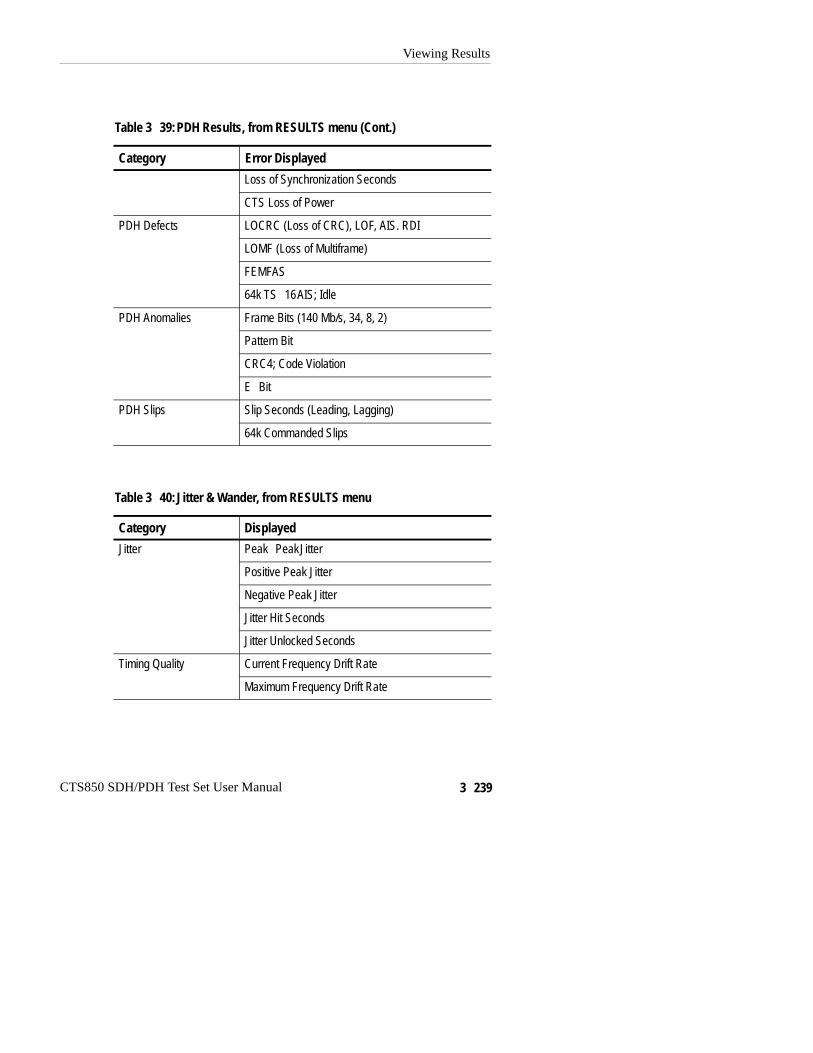
Table 3�39:PDH Results, from RESULTS menu (Cont.)
Category Error Displayed
Loss of Synchronization Seconds
CTS Loss of Power
PDH Defects LOCRC (Loss of CRC), LOF, AIS. RDI
LOMF (Loss of Multiframe)
FEMFAS
64k TS�16AIS; Idle
PDH Anomalies Frame Bits (140 Mb/s, 34, 8, 2)
Pattern Bit
CRC4; Code Violation
E�Bit
PDH Slips Slip Seconds (Leading, Lagging)
64k Commanded Slips
Table 3�40:Jitter & Wander, from RESULTS menu
Category Displayed
Jitter Peak�PeakJitter
Positive Peak Jitter
Negative Peak Jitter
Jitter Hit Seconds
Jitter Unlocked Seconds
Timing Quality Current Frequency Drift Rate
Maximum Frequency Drift Rate

Viewing Results
3�240 CTS850 SDH/PDH Test Set User Manual
Table 3�40:Jitter & Wander, from RESULTS menu (Cont.)
Category Displayed
Wander Peak�PeakWander
TIE
Estimated Bit Slips (2 Mb/s rate only)
Estimated Frame Slips (2 Mb/s rate only)
Line Frequency Current Frequency
Maximum Frequency
Minimum Frequency
Table 3�41:Error Analysis, from RESULTS menu
Category Error Displayed
SDH G.826 Near End �B1�BIP;B2�BIP, B3�BIP, TU�BIPUse the front panel knob to selectlayer sub�choices
Far End �MS�REI;HP�REI;LP�REIUse the front panel knob to selectlayer sub�choices
The following may or may not be available for eachof the Near End & Far End sub�choicesabove:
Errored Blocks; Errored Seconds; Background BlockErrors; Severely Erroed Seconds; Consecutive SESPeriods; Unavailable Seconds; Path UnavailableSeconds; Analysis
PDH G.826 Near End �140M; 34M; 8M; 2MUse the front panel knob to selectparameters of interest
Far End � 140M; 34M; 8M; 2MUse the front panel knob to selectlayer sub�choices
Viewing Results
CTS850 SDH/PDH Test Set User Manual 3�241
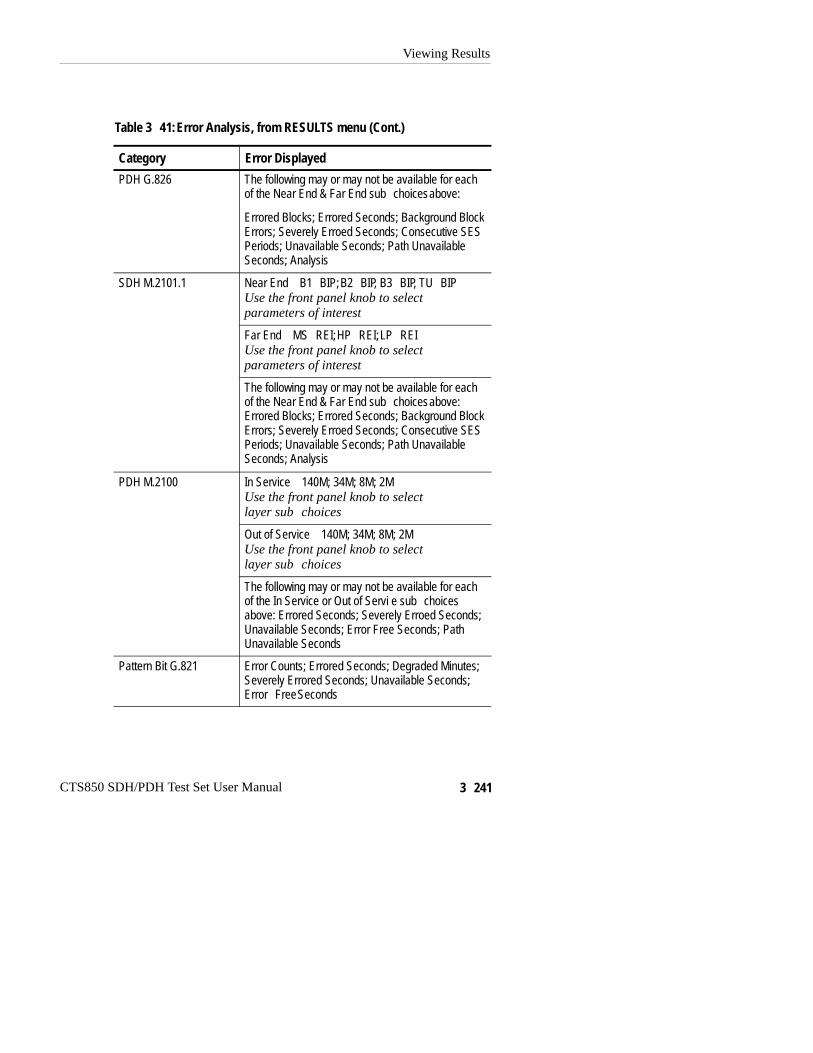
Table 3�41:Error Analysis, from RESULTS menu (Cont.)
Category Error Displayed
PDH G.826 The following may or may not be available for eachof the Near End & Far End sub�choicesabove:
Errored Blocks; Errored Seconds; Background BlockErrors; Severely Erroed Seconds; Consecutive SESPeriods; Unavailable Seconds; Path UnavailableSeconds; Analysis
SDH M.2101.1 Near End �B1�BIP;B2�BIP, B3�BIP, TU�BIPUse the front panel knob to selectparameters of interest
Far End �MS�REI;HP�REI;LP�REIUse the front panel knob to selectparameters of interest
The following may or may not be available for eachof the Near End & Far End sub�choicesabove:Errored Blocks; Errored Seconds; Background BlockErrors; Severely Erroed Seconds; Consecutive SESPeriods; Unavailable Seconds; Path UnavailableSeconds; Analysis
PDH M.2100 In Service �140M; 34M; 8M; 2MUse the front panel knob to selectlayer sub�choices
Out of Service �140M; 34M; 8M; 2MUse the front panel knob to selectlayer sub�choices
The following may or may not be available for eachof the In Service or Out of Servi e sub�choicesabove: Errored Seconds; Severely Erroed Seconds;Unavailable Seconds; Error Free Seconds; PathUnavailable Seconds
Pattern Bit G.821 Error Counts; Errored Seconds; Degraded Minutes;Severely Errored Seconds; Unavailable Seconds;Error�FreeSeconds
Viewing Results
3�242 CTS850 SDH/PDH Test Set User Manual
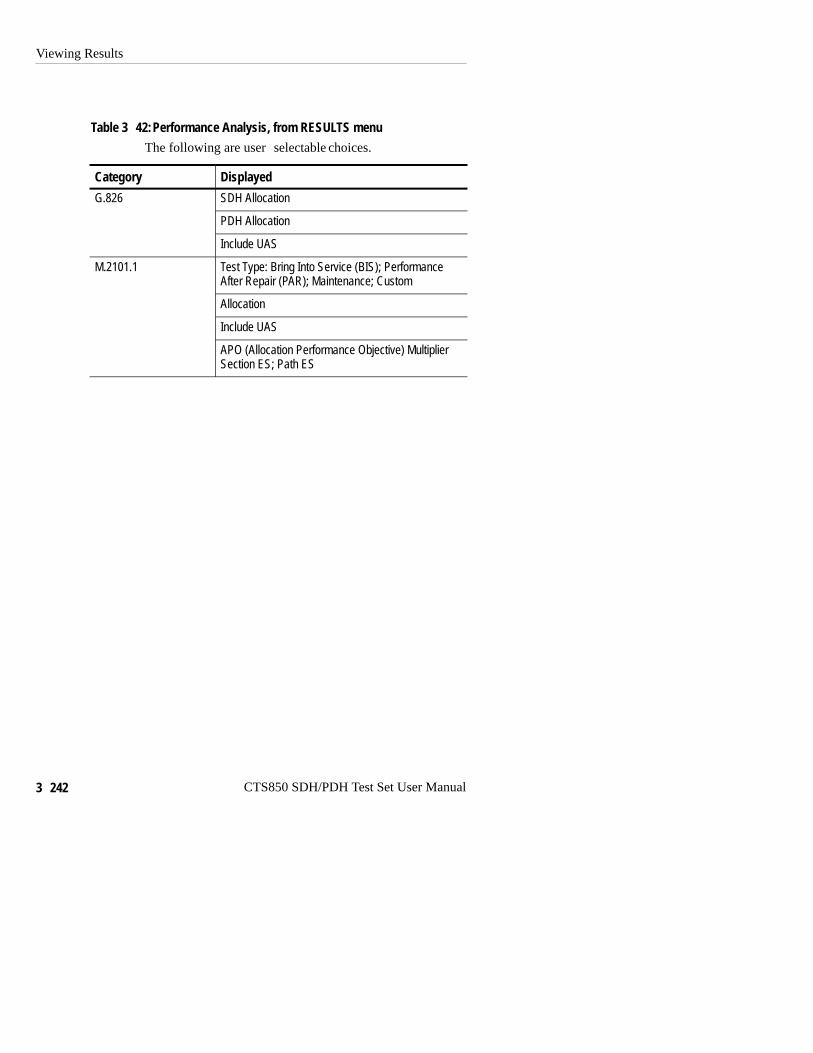
Table 3�42:Performance Analysis, from RESULTS menuThe following are user�selectable choices.
Category Displayed
G.826 SDH Allocation
PDH Allocation
Include UAS
M.2101.1 Test Type: Bring Into Service (BIS); PerformanceAfter Repair (PAR); Maintenance; Custom
Allocation
Include UAS
APO (Allocation Performance Objective) Multiplier �Section ES; Path ES
Viewing Results
CTS850 SDH/PDH Test Set User Manual 3�243
Viewing Measurement HistoriesThe CTS850 records measurement histories whenever you run a test.Measurement histories are displayed as graphs. The graph displayshow an individual measurement changed over time. The vertical axisof a graph depends on what is displayed, but the horizontal axisalways displays time.
To display a history graph:
Press MenuButton
Select MenuPage
HighlightParameter Select Choice
RESULTS HISTORYGRAPHS
none none
Types of Graphs
There are three types of history graphs: bar graphs, line graphs, andon/off graphs.
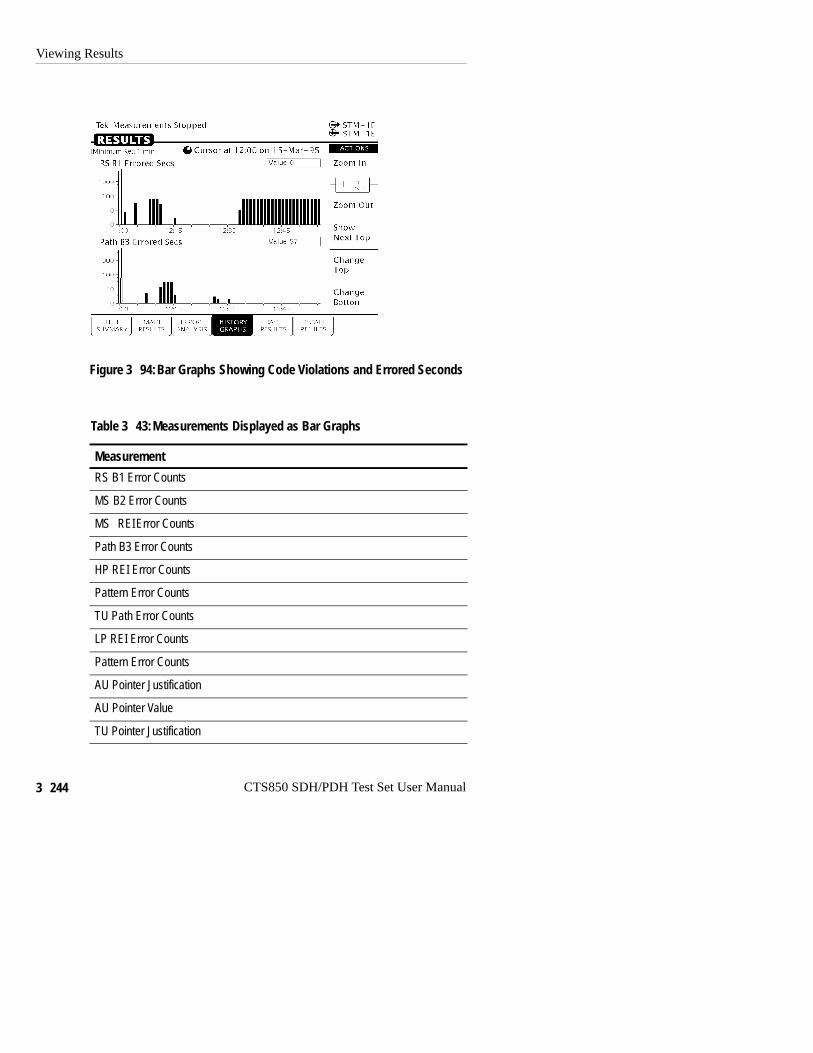
Bar Graphs. Bar graphs are used for most measurements (seeFigure 3�94). There are two kinds of bar graphs: a count graph thatdisplays code violations and pointer justifications and an erroredseconds graph that displays errored seconds. Table 3�43 lists thedifferent bar graphs that can be displayed.
Viewing Results
3�244 CTS850 SDH/PDH Test Set User Manual
Figure 3�94:Bar Graphs Showing Code Violations and Errored Seconds
Table 3�43:Measurements Displayed as Bar Graphs
Measurement
RS B1 Error Counts
MS B2 Error Counts
MS�REIError Counts
Path B3 Error Counts
HP REI Error Counts
Pattern Error Counts
TU Path Error Counts
LP REI Error Counts
Pattern Error Counts
AU Pointer Justification
AU Pointer Value
TU Pointer Justification
Viewing Results
CTS850 SDH/PDH Test Set User Manual 3�245
Table 3�43:Measurements Displayed as Bar Graphs (Cont.)
Measurement
TU 12 Pointer Value
E1 Frame Error Counts
CRC Error Counts
Max. Peak�to�PeakJitter, UI
Max. Peak�to�PeakJitter, Log Scale
Max. Rate of Frequency Drift, ppm/sec
Jitter Status
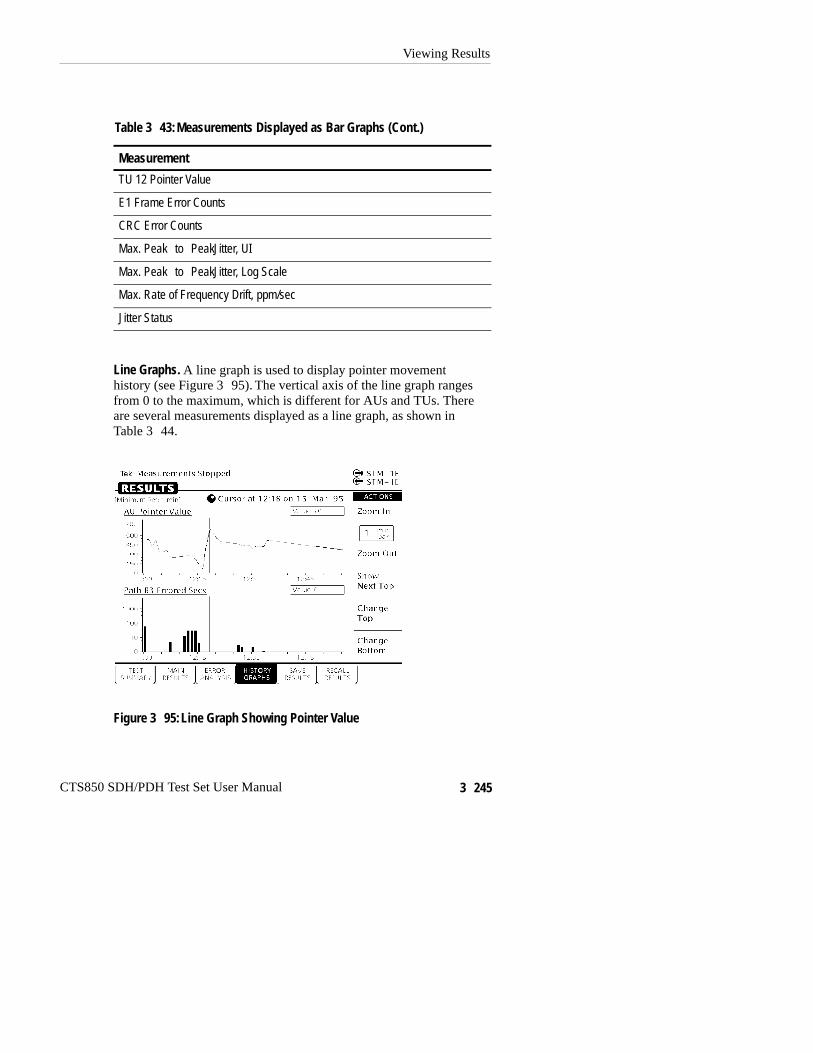
Line Graphs. A line graph is used to display pointer movementhistory (see Figure 3�95). The vertical axis of the line graph rangesfrom 0 to the maximum, which is different for AUs and TUs. Thereare several measurements displayed as a line graph, as shown inTable 3�44.
Figure 3�95:Line Graph Showing Pointer Value
Viewing Results
3�246 CTS850 SDH/PDH Test Set User Manual
Table 3�44:Measurements Displayed as a Line Graph
Displayed Value
AU-4 Pointer Value
TU Pointer Value
Delta Frequency
TIE
Frequency Drift
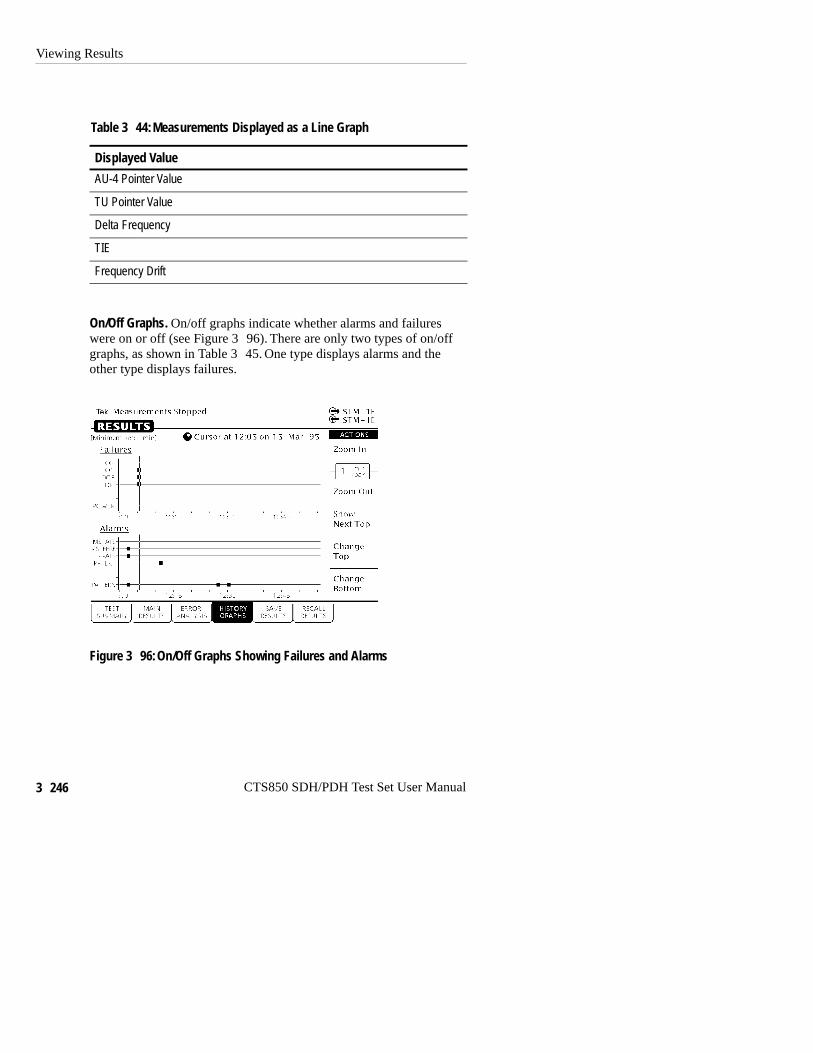
On/Off Graphs. On/off graphs indicate whether alarms and failureswere on or off (see Figure 3�96). There are only two types of on/offgraphs, as shown in Table 3�45. One type displays alarms and theother type displays failures.
Figure 3�96:On/Off Graphs Showing Failures and Alarms
Viewing Results
CTS850 SDH/PDH Test Set User Manual 3�247
Table 3�45:Measurements Displayed as On/Off Graphs for SDHRates
Graph Type Displayed Value
Failures LOS
LOF
OOF
AU LOP
TU LOP
TU LOM
Power
SDH Defects MS-AIS; MS�RDI;AU AIS
HP RDI; TU AIS; LP RDI
Pattern Lock
HP�Line;LP�Line
HP�PLM;LP�PLM
LP RFI
Table 3�46:Measurements Displayed as On/Off Graphs for PDHRates
Graph Type Displayed Value
PDH Defects LOF
AIS
RDI
LES; LAS
LOCRC

Viewing Results
3�248 CTS850 SDH/PDH Test Set User Manual
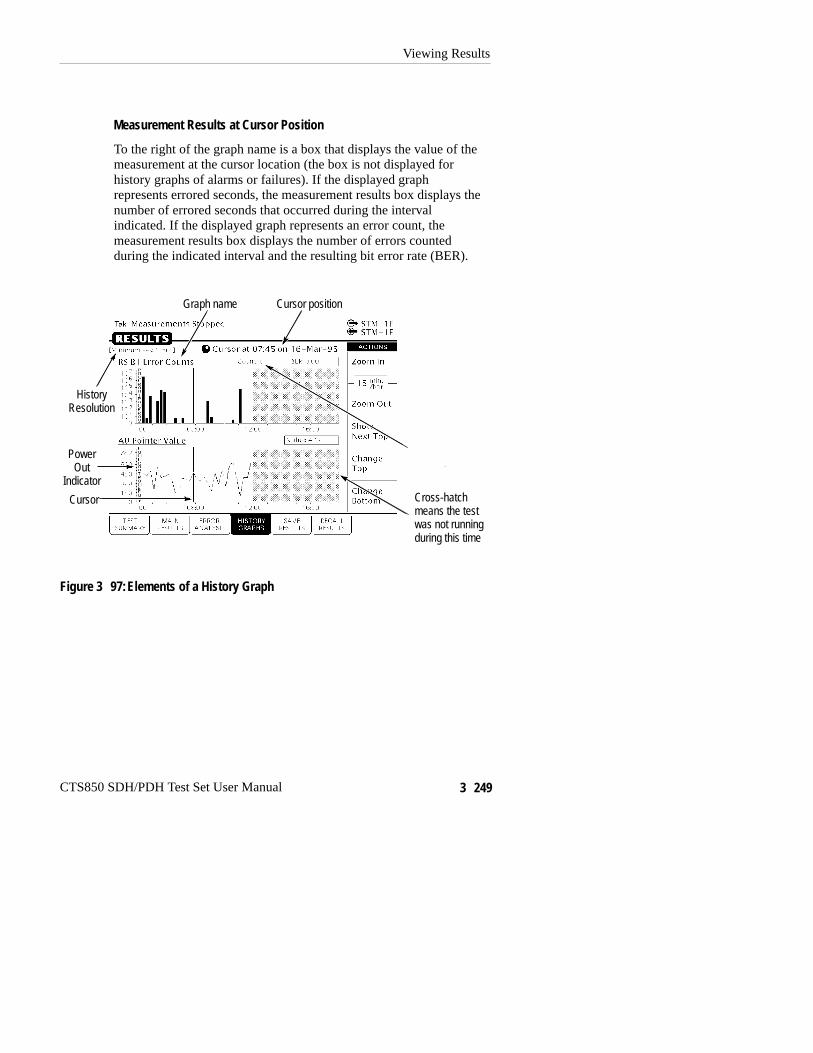
Elements of the History Graph DisplayFigure 3�97 shows the elements of a typical history graph display.The HISTORY GRAPHS page always displays two graphs. The twographs can be changed to display any measurement taken during atest.
Graph Name
Above each graph is a name that identifies the measurement thegraph illustrates.
History Resolution
Above the graph name is a line that states the minimum resolution atwhich the graph can be displayed. The minimum resolution is set atthe time the test is run.
Power Out Indicator
If the power to the CTS850 fails while a test is running, the CTS850displays the words “POWEROUT” on the history graph. POWER-OUT is displayed vertically on the graph and spans the period oftime the CTS850 was without power.
Cursor
The cursor is a line that is scrolled across the graph using the knob.
Cursor Position
Just below the menu name is a line that identifies the position of thecursor. Cursor position is identified by time and date.
Viewing Results
CTS850 SDH/PDH Test Set User Manual 3�249
Measurement Results at Cursor Position
To the right of the graph name is a box that displays the value of themeasurement at the cursor location (the box is not displayed forhistory graphs of alarms or failures). If the displayed graphrepresents errored seconds, the measurement results box displays thenumber of errored seconds that occurred during the intervalindicated. If the displayed graph represents an error count, themeasurement results box displays the number of errors countedduring the indicated interval and the resulting bit error rate (BER).
Cursor positionGraph name
Cursor
Measurementresults atcursor position
Cross-hatchmeans the testwas not runningduring this time
HistoryResolution
PowerOut
Indicator
Figure 3�97:Elements of a History Graph
Viewing Results
3�250 CTS850 SDH/PDH Test Set User Manual
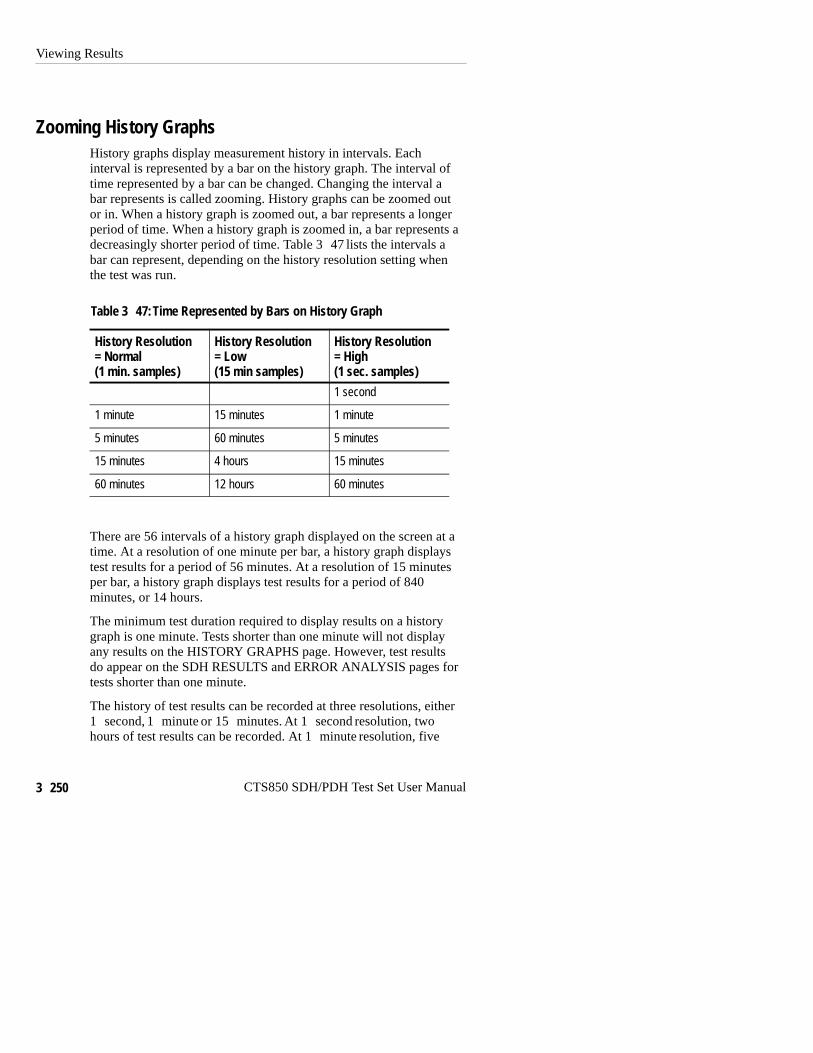
Zooming History GraphsHistory graphs display measurement history in intervals. Eachinterval is represented by a bar on the history graph. The interval oftime represented by a bar can be changed. Changing the interval abar represents is called zooming. History graphs can be zoomed outor in. When a history graph is zoomed out, a bar represents a longerperiod of time. When a history graph is zoomed in, a bar represents adecreasingly shorter period of time. Table 3�47 lists the intervals abar can represent, depending on the history resolution setting whenthe test was run.
Table 3�47:Time Represented by Bars on History Graph
History Resolution= Normal(1 min. samples)
History Resolution= Low(15 min samples)
History Resolution= High(1 sec. samples)1 second
1 minute 15 minutes 1 minute
5 minutes 60 minutes 5 minutes
15 minutes 4 hours 15 minutes
60 minutes 12 hours 60 minutes
There are 56 intervals of a history graph displayed on the screen at atime. At a resolution of one minute per bar, a history graph displaystest results for a period of 56 minutes. At a resolution of 15 minutesper bar, a history graph displays test results for a period of 840minutes, or 14 hours.
The minimum test duration required to display results on a historygraph is one minute. Tests shorter than one minute will not displayany results on the HISTORY GRAPHS page. However, test resultsdo appear on the SDH RESULTS and ERROR ANALYSIS pages fortests shorter than one minute.
The history of test results can be recorded at three resolutions, either1�second, 1�minute or 15�minutes. At 1�second resolution, twohours of test results can be recorded. At 1�minute resolution, five

Viewing Results
CTS850 SDH/PDH Test Set User Manual 3�251
days of test results can be recorded. At 15�minutes resolution, 75days of test results can be recorded.
NOTE. When viewing long test durations (for example, five days) at aresolution of one minute, you might see a timestamp error. Forexample, you might see two one-minute intervals stamped with thesame time. The timestamp error is simply revealing the clockaccuracy. The correct number of intervals for the test duration arepresent.
Panning History GraphsYou can display different portions of a history graph by panning thegraph. Panning a history graph shifts the displayed section of thegraph to the left or right.
At the maximum resolution of one second per bar, a history graphcan display only about one hour of test results. To maintainmaximum resolution, you can display the graph at maximumresolution (one second per bar) and pan to other portions of thehistory graph as necessary.
To pan a history graph, turn the knob.
When the knob is turned, the cursor moves across the history graph.If the history graph contains more data than will fit on the display,the history graph shifts to display additional information. Thedirection the display shifts depends on which direction the knob isturning.

Viewing Results
3�252 CTS850 SDH/PDH Test Set User Manual
Changing the Displayed History GraphTo change the displayed history graph:
Press MenuButton
Select MenuPage
HighlightParameter Select Choice
RESULTS HISTORYGRAPHS
Show Next Top
Change Top
Change Bottom
select graph withknob(see Figure 3�98)
Select Graph
H Select Show Next Top to automatically display the next graph onthe top half of the screen.
H Select Change Top to select a different graph for display on thetop half of the screen.
H Select Change Bottom to select a different graph for display onthe bottom half of the screen.
H Select Cancel if you decide not to change the displayed graph.
Displaying Mini-Graphs
When you select either Change Top or Change Bottom from theHISTORY GRAPHS page, the selected graph is replaced by threemini-graphs (see Figure 3�98). Each mini-graph is a reduced-sizeversion of a normal graph. Turn the knob to display a different graph.The middle graph, which is highlighted, is the graph that will bedisplayed full-size when you choose Select Graph. When you turnthe knob, the mini-graphs scroll either up or down depending onwhich direction you turn the knob. Whether the next mini-graphappears at the top or the bottom depends on the direction the knobturns.
Use the mini-graph capability to view several results at once. Withmini-graphs displayed, the CTS850 displays four graphs at the same

Viewing Results
CTS850 SDH/PDH Test Set User Manual 3�253
time. This will enable you to see relationships between differentresults that might otherwise be difficult to spot.
Figure 3�98:Changing the Displayed History Graph
Saving and Recalling ResultsYou can save the current test results to disk and recall that one set oftest results for later display and analysis. If you want to save testresults permanently, you must save the test results to disk.
Saving Test Results to Disk
NOTE. The CTS850 saves only the last 5 days (at a HistoryResolution of Normal) or 75 days (at a History Resolution of Low) oftest results. If a test runs longer than these limits, the results olderthan 5 days/ 75 days are discarded.
Viewing Results
3�254 CTS850 SDH/PDH Test Set User Manual
To save test results to disk:
1. Name the test results file as follows:
Press MenuButton
Select MenuPage
HighlightParameter Select Choice
RESULTS SAVE RESULTS(see Figure 3�99)
Name RESLT_XX
Clear
EDIT NAME
H If you wish to name the results file as RESLT<Number>, youcan save time by selecting RESLT_XX. Once you selectRESLT_XX, select EDIT NAME and edit XX to the desirednumber (or letter). Select DONE when you are finishedediting the setup name. Be aware that the test set only savesone set of test results to the unit’s disk memory.
H Select Clear to remove an existing name. A message appearsto remind you that you cannot save results to disk without aname.
H Select EDIT NAME to enter a name other than RESLT_XXfor the pass/fail test. Select DONE when you are finishedediting the test name.
Viewing Results
CTS850 SDH/PDH Test Set User Manual 3�255
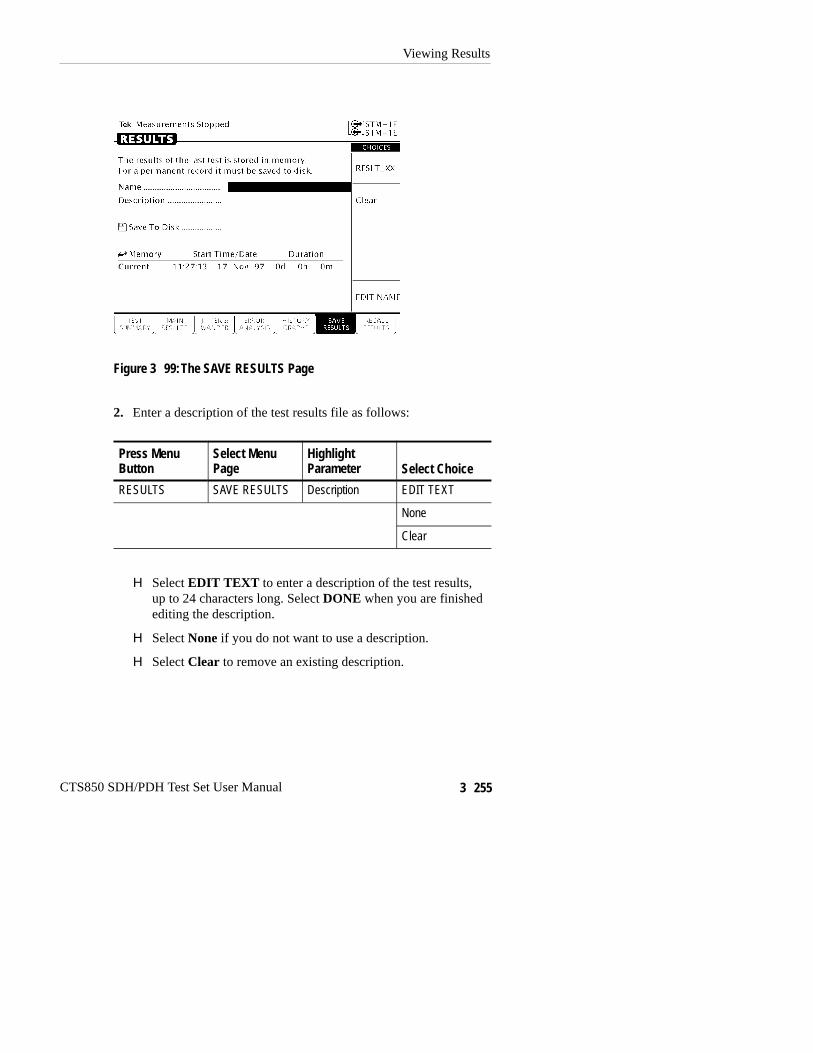
Figure 3�99:The SAVE RESULTS Page
2. Enter a description of the test results file as follows:
Press MenuButton
Select MenuPage
HighlightParameter Select Choice
RESULTS SAVE RESULTS Description EDIT TEXT
None
Clear
H Select EDIT TEXT to enter a description of the test results,up to 24 characters long. Select DONE when you are finishedediting the description.
H Select None if you do not want to use a description.
H Select Clear to remove an existing description.
Viewing Results
3�256 CTS850 SDH/PDH Test Set User Manual
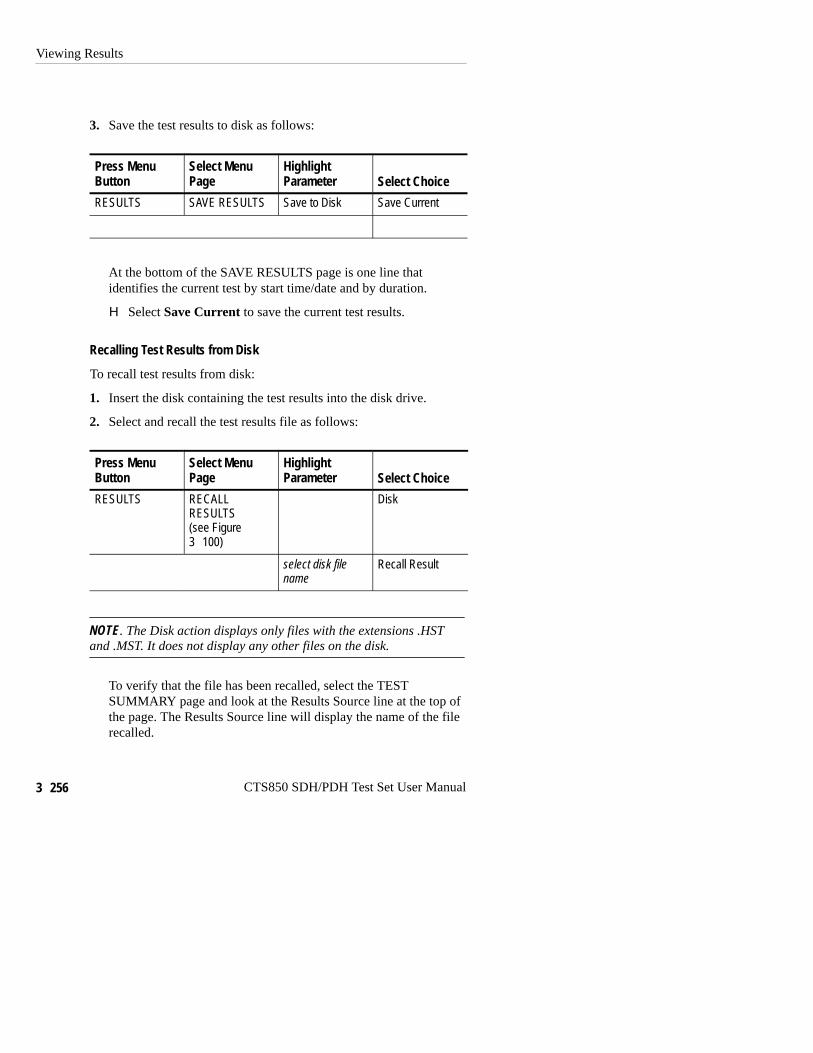
3. Save the test results to disk as follows:
Press MenuButton
Select MenuPage
HighlightParameter Select Choice
RESULTS SAVE RESULTS Save to Disk Save Current
At the bottom of the SAVE RESULTS page is one line thatidentifies the current test by start time/date and by duration.
H Select Save Current to save the current test results.
Recalling Test Results from Disk
To recall test results from disk:
1. Insert the disk containing the test results into the disk drive.
2. Select and recall the test results file as follows:
Press MenuButton
Select MenuPage
HighlightParameter Select Choice
RESULTS RECALLRESULTS(see Figure3�100)
Disk
select disk filename
Recall Result
NOTE. The Disk action displays only files with the extensions .HSTand .MST. It does not display any other files on the disk.
To verify that the file has been recalled, select the TESTSUMMARY page and look at the Results Source line at the top ofthe page. The Results Source line will display the name of the filerecalled.
Viewing Results
CTS850 SDH/PDH Test Set User Manual 3�257
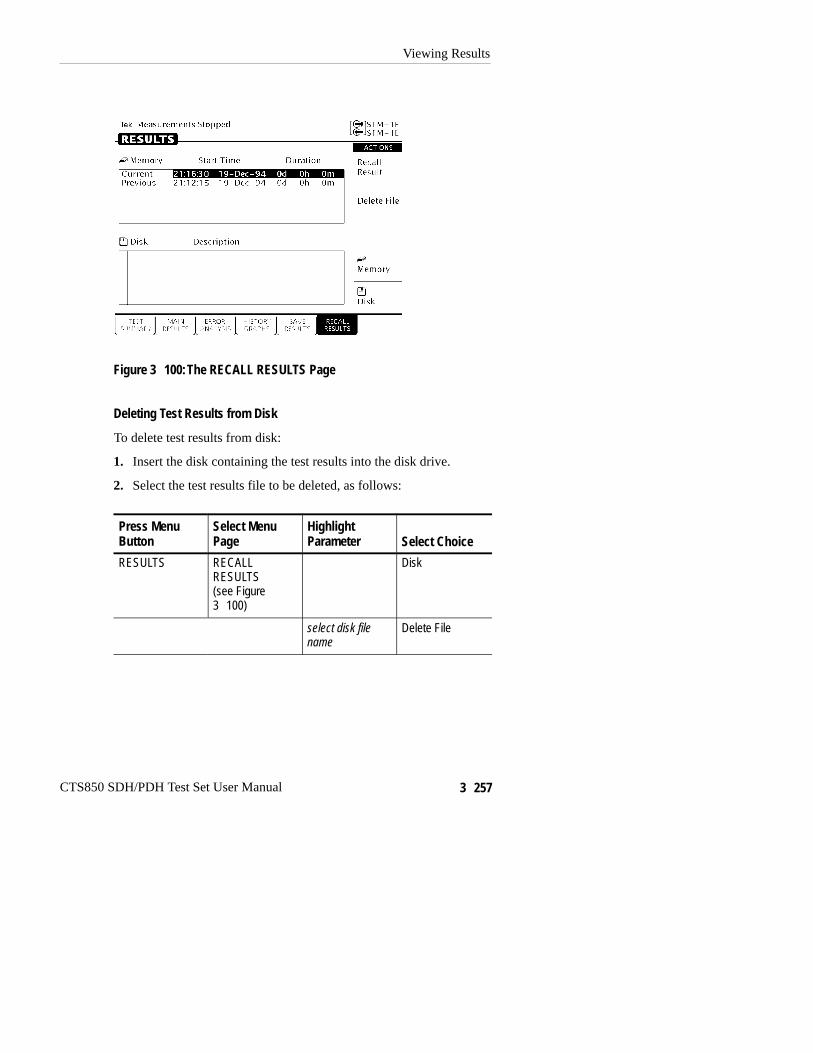
Figure 3�100:The RECALL RESULTS Page
Deleting Test Results from Disk
To delete test results from disk:
1. Insert the disk containing the test results into the disk drive.
2. Select the test results file to be deleted, as follows:
Press MenuButton
Select MenuPage
HighlightParameter Select Choice
RESULTS RECALLRESULTS(see Figure3�100)
Disk
select disk filename
Delete File

Viewing Results
3�258 CTS850 SDH/PDH Test Set User Manual
Recalling Test Results from Memory
To recall test results from memory:
Press MenuButton
Select MenuPage
HighlightParameter Select Choice
RESULTS RECALLRESULTS
Memory(see Figure3�100)
Printing ResultsThere are two ways to print out the results of the current test. Oneway is to tell the CTS850 which results to print from the print dialogbox. The second way is to display the results you wish to print outand then print the displayed screen (this is the only way to print outhistory graphs).
Results are printed according to the Printer Type, which is set on thePRINTER SETUP page. Results can be printed to a printer or to adisk file. Results can be printed to disk in four formats: WindowsBMP format, Interleaf image format, Encapsulated PostScriptformat, and ASCII text.
Printing Results or Error Analysis
When the CTS850 prints test results, it prints out the contents of theSDH RESULTS page or the ERROR ANALYSIS page. The printedresults are reformatted so that all results fit on a single page.
Before printing results, check that the printer setup is correct. Theprinter setup is displayed on the PRINTER SETUP page of theUTILITY menu.
Viewing Results
CTS850 SDH/PDH Test Set User Manual 3�259
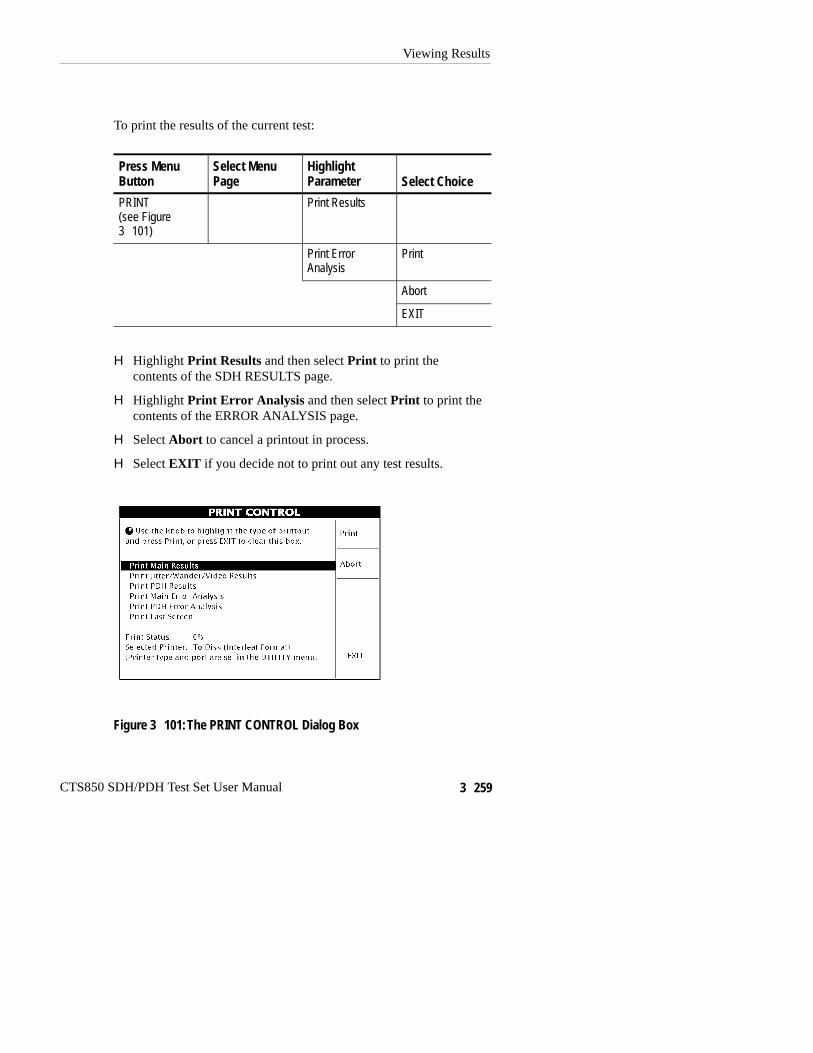
To print the results of the current test:
Press MenuButton
Select MenuPage
HighlightParameter Select Choice
PRINT(see Figure3�101)
Print Results
Print ErrorAnalysis
Abort
EXIT
H Highlight Print Results and then select Print to print thecontents of the SDH RESULTS page.
H Highlight Print Error Analysis and then select Print to print thecontents of the ERROR ANALYSIS page.
H Select Abort to cancel a printout in process.
H Select EXIT if you decide not to print out any test results.
Figure 3�101:The PRINT CONTROL Dialog Box
Viewing Results
3�260 CTS850 SDH/PDH Test Set User Manual
To print the results of a test saved on disk, recall the results (seepage 3�256) and then print as previously described.
Printing History Graphs
To print a history graph from the CTS850:
1. Display the history graph you want to print.
The history graph can be for the current test or it can be recalledfrom disk.
2. Print the history graph as follows:
Press MenuButton
Select MenuPage
HighlightParameter Select Choice
PRINT(see Figure3�101)
Print Last Screen Print
Abort
EXIT
H Select Print to print the displayed history graph using thesettings on the PRINTER SETUP page of the UTILITYmenu.
H Select EXIT if you decide not to print any test results.
H Select Abort to cancel a printout in process.


![YSLO RTS ELEC BOARD FR - Somfy...BIP-BIP [] BIP-BIP [] BIP-BIP [] BIP-BIP [_____] BIP-BIP [] BIP-BIP [] BIP-BIP []… Appuyer sur la touche jusqu’au va-et-vient du vantail prioritaire](https://img.pdfslide.us/doc/110x75/60fbc1563febf120f853a528/yslo-rts-elec-board-fr-somfy-bip-bip-bip-bip-bip-bip-bip-bip-.jpg)