Embed Size (px)
Citation preview
111Equation Chapter 1 Section 1TITLEResponse analysis of a parked spar-type wind turbine under different environmental conditions and blade pitch mechanism fault
PAPER No. 2012-TPC-0668
ABSTRACTOffshore floating wind turbines are subjected to harsh environmental conditions and fault scenarios. Load cases considering parked and fault conditions are important for the design of wind turbines and are defined in the IEC61400-3 and other design standards. Limited research has been carried out considering fault conditions so far. For a parked wind turbine, the blades are usually feathered and put parallel to the wind direction during survival conditions to minimize the aerodynamic load. However, if the pitch mechanism fails, the blades cannot be feathered to the maximum pitch set point―the blades are seized. The accidental seizure of the blade will likely cause a large drag loading and increase the extreme responses. For a floating turbine, the consequences could be quite severe. The uneven wind loads together with the wave loads can jeopardize the dynamic responses such as yaw, pitch and the tower bending moment. The degree of impact depends on the environmental conditions as well as the position of the turbine blades. Wind turbines are supposed to be designed for survival of environmental events with a return period of 50 years as well as certain combined fault and environmental conditions with an equivalent occurrence rate. However, the probability of fault scenarios is not well known. Hence, this study is based on parked turbines and conditions on the 1-year and 50-year environmental contour line for a site in the North Sea. Three parked scenarios are considered: fault with one seized blade, fault with three seized blades and normal condition. The turbine’s steady responses to the wave direction and blade azimuth position are investigated. A spar-type wind turbine is used in this study. It is found that most of the response extremes and standard deviations are sensitive to the wave direction. For the normal parked conditions, yaw of the platform is sensitive to the blade azimuth while surge and pitch are not. The blade azimuth position also plays a key role in responses such as roll and yaw for the parked conditions with one faulted blade. The fault cases under 1-year environmental condition are also compared with the normal parked ones with an environmental condition corresponding to 50-year recurrence period. Due to the asymmetry of blade position, fault with one seized blade often leads to the largest roll resonance and yaw extreme angle and the extremes may exceed the 50-year reference values by more than 16%. The linked structural responses are not as critical, however. Fault with three seized blades causes an average rise of 38% and 23% for surge and pitch extremes over the 50-year references due to the large aerodynamic drag. The tower bottom bending moment and the blade root bending moment may also exceed the 50-year values by more than 10%.
INTRODUCTIONOffshore wind energy has witnessed rapid development in recent years. The total installed capacity in 2010 reached approximately 3000 MW, some 1.5% of worldwide wind farm capacity[1]. Development has mainly taken place in North European countries, mostly around the North Sea and the Baltic Sea, where to date a few more than 20 projects have been implemented[2]. In the design of offshore wind turbines, a set of design conditions and load
1

cases with a relevant probability of occurrence shall be considered. The load cases, which are used to verify the structural integrity of an offshore wind turbine, should include normal, fault and transportation both operational and non-operational design situations design situations such as power production, parked and fault conditions, etc.with various external conditions[3, 4]. Despite the need for defining a possible fault case, the correlation between a likely environmental condition and a fault situation remain virtually unknown for a land-based turbine or, let alone an offshore one. Therefore, it is necessary to assume appropriate environmental conditions corresponding to the specified fault scenario in the design case analysis.
The occurrence of the faults and the severity of the end-effects are important for offshore wind turbines. The former can be quantified based on the statistics about the failures experienced by wind farms[5, 6]. The end-effects, namely the potential harm inflicted on the wind turbines, are the main topic of this paper. Based on the field database of 450 onshore wind farms, it was shown in the recent RELIAWIND project [7, 8] that the pitch system failure contribute 21.3% to the total failure rate. Among the various forms of pitch actuator faults, valve blockage is safety critical and leads to an inoperable pitch actuator and a fixed blade[9]. Upon the presence of such severe fault, the protection system, designed by a fail-safe philosophy, is activated to ensure immediate shutdown[10]. The rotor is brought to a standing still or idling state by brakes. For an offshore floating wind turbine (FWT) with the fault mentioned, the outcome is largely decided by the wave and the wind that it is subjected to for a certain period of time.
Simulation of FWT considering parked and fault conditions have been limited so far. Bir et al. found that certain parked (idling) conditions can lead to instabilities involving side-to-side motion of the tower and yawing of the platform for a barge-type wind turbine[11]. Jonkman[12] and Matha[13] also documented platform yaw instability when they considered the blade fault with an idling rotor. The instability may be caused by a coupling of the barge-yaw motion with the azimuthal motion of the blade. Madjid et al.[14] compared two non-operational cases for a standing still spar-type wind turbine under harsh environment and observed extra nacelle surge for the case with yaw fault. When a FWT rotor is brought to a complete rest, the aerodynamic excitation and damping are sensitive to the blade azimuth angle and angle of attack (AOA) relative to the inflow wind. Blade azimuth angle is associated with load distribution due to wind shear and geometrical symmetry. AOA impacts the lift, drag and damping. Pitch or yaw mechanism fault may affect the AOA directly and spread the effect to the hydrodynamic loads that are related to the platform motion. Thus, it would be interesting to investigate which response is significantly affected by the fault condition and to which degree the influence is compared with the normal parked condition.
In this paper, a catenary moored deep spar FWT is selected. The aerodynamic load and hydrodynamic load under normal and fault conditions are analyzed. The steady state responses of the parked turbine are performed using the HAWC2 code[15]. Nonlinear mooring line forces are fed to HAWC2 at each time step through the dynamic link library. Aerodynamic loads are calculated based on the steady-state airfoil data of lift and drag coefficient. Hydrodynamic forces are calculated based on Morison equation considering instantaneous position of the platform. Validation of the hydrodynamics of HAWC2 can be found in[16, 17]. Responses are calculated based on a multi-body formulation.
Environmental conditions with 1-year and 50-year recurrence period are chosen from the environmental contour line due to lack of knowledge of fault situation and extreme external
2
conditions. This may be on the conservative side. Since the correlation between a fault situation and an extreme external condition remains unknown, the parked plus fault cases are simulated under the extreme sea states with a 1-year return period, as suggested by [3]. The normal parked cases are run under both 1-year and 50-year environmental conditions for comparison. The effect of blade azimuth angle and wave misalignment on the responses is investigated. The fault cases under 1-year extreme environmental condition are compared with the normal parked cases with an environmental condition corresponding to 1-year and 50-year recurrence period. Characteristic extreme values of the motion responses as well as the structural responses are compared. Some light is shed on how the pitch mechanism fault may affect the dynamic responses of the FWT.THEORYParked and fault scenarioIt is possible to actively adjust the pitch angle of the entire blade on a pitch regulated wind turbine[18]. By doing so, the angles of attack along the blade length can be simultaneously changed to control the power output during operation. The pitch mechanism is a hydraulic system consisting of pump station, accumulator, valves and hydraulic actuators. The position of the piston and the blade pitch angle is determined by the applied hydraulic pressure. As Fig.1 suggests, blockage of valve 2, 3 or 4 can disable the pitch actuator of blade; while blockage of pump or valve 1 can seize the three blades to a locked position. The severity of these faults can be deemed as ‘very high’ and will call for a shut-down of turbine to prevent further damage. {Thomas Esbensen, 2009 #166}The Each fault can be ranked based on the degrees of severity. The fault of valve blockage and pump blockage are critical, assigned with an index of 8 and 9 respectively in a scale of 10 [9]. The severity can be deemed as ‘very high’ and will call for a shut-down of turbine to prevent further damage. In comparison, when a turbine is normally parked and prevented from idling, the blades are usually feathered and stay parallel to the oncoming wind direction with the azimuth angle of blade 1 as γ1 (Fig.2). In this paper, the faulted blade is assumed to be seized at the pitch point of 0 degree. The change of blade pitch position will influence platform motion and structural responses significantly under harsh environmental conditions and. will be shown in the paper.
Fig.1 Sketch of a typical blade pitch mechanism for an individually controlled blade system
3

Fig.2 Blade azimuth position, normal and fault condition for a standing still rotor
Fig.3 Quasi-steady aerodynamic forces on a typical blade section with one degree of freedom
For a given blade section, the AOA experiences constant change due to the unsteady oncoming wind flow and the motion of the blade itself. So are the lift and the drag force. For simplicity, we ignore the torsional motion of the blade and consider a typical section as illustrated in Fig.3. The blade section is assumed to have one translational degree of freedom described by θ. W0 is the relative velocity which takes into account the inflow wind and the rigid body motion of the blade, φ0 is the steady state inflow angle and αW is the steady-state AOA. The quasi-steady aerodynamic forces per unit length can be written as
22\* MERGEFORMAT ()
33\* MERGEFORMAT ()Where ρ is the air density, CL and CD are the lift and drag coefficients, c(r) is the cord length at a given radius and W is the relative speed. For a parked wind turbine, the blades are non-
4

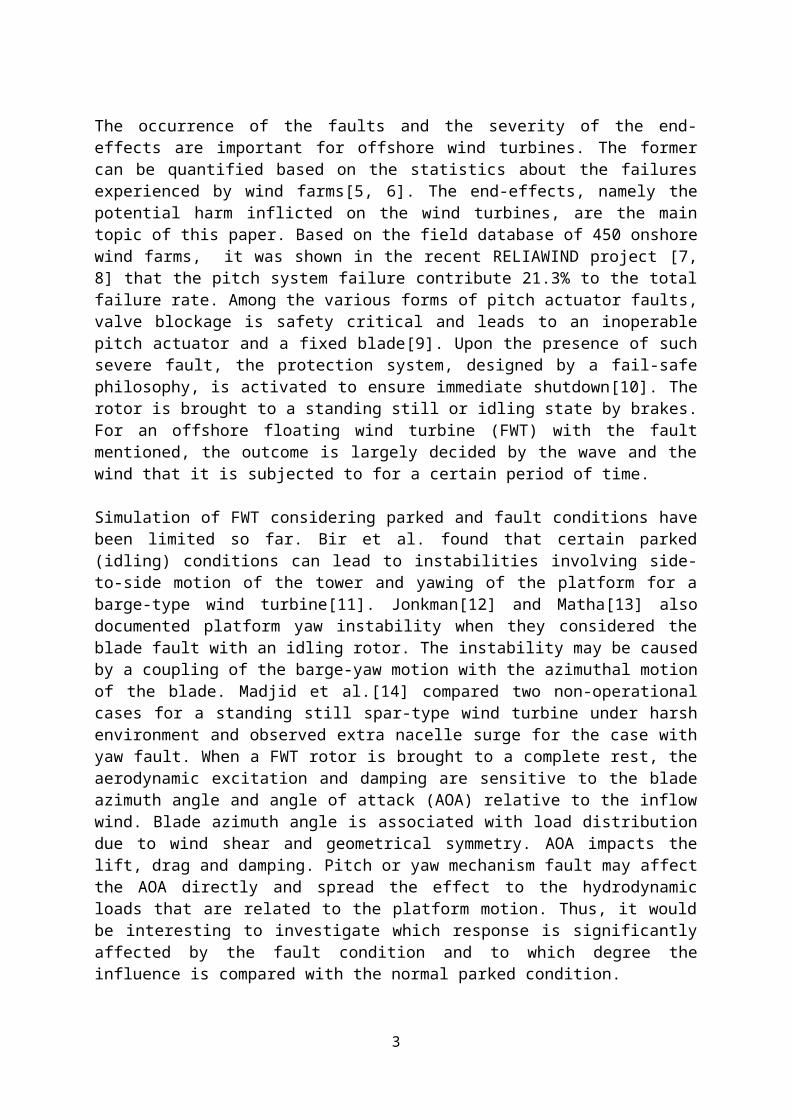
rotating and the axial and the tangential induction factor is are approximately 0zero. At each time step, the HAWC2 code calculates the AOA the aerodynamic load based on the steady-state airfoil characteristicson each blade section., computes the loads and the response based on a multi-body formulation. For a feathered blade parallel to the wind, the aerodynamic load is dominated by lift. For a seized blade, the load is drag-dominated. Due to the motion of the blade and the turbulent nature of the wind, there exists minor lift force (Fig.4).
0 200 400 600 800-1
0
1
2
3
4
5
6
Time (s)
Load
on
blad
e2, r
adiu
s=50
m (k
N)
LiftDrag
Fig.4 Time history of aerodynamic loads on a seized blade, V=38.7m/s, I=0.12, Hs=12m, Tp=14.2s
0 200 400 600 800-1
0
1
2
3
4
5
Time (s)
Nor
mal
ized
thru
st
All blades featheredBlade 2 seizedAll blades seized
Fig.5 Time history of normalized thrust =thrust/Mean tower drag, blade azimuth 0, V=38.7m/s, Hs=12m, Tp=14.2s, wave misalignment=0
5

0 0.5 1 1.50
1
2
3
4
5
6x 10
4
Frequency [rad/s]
S(
) [k
N2 s
/rad
]
Normal, blades featheredFault type 1, blade 2 seizedFault type 3, all blades seized
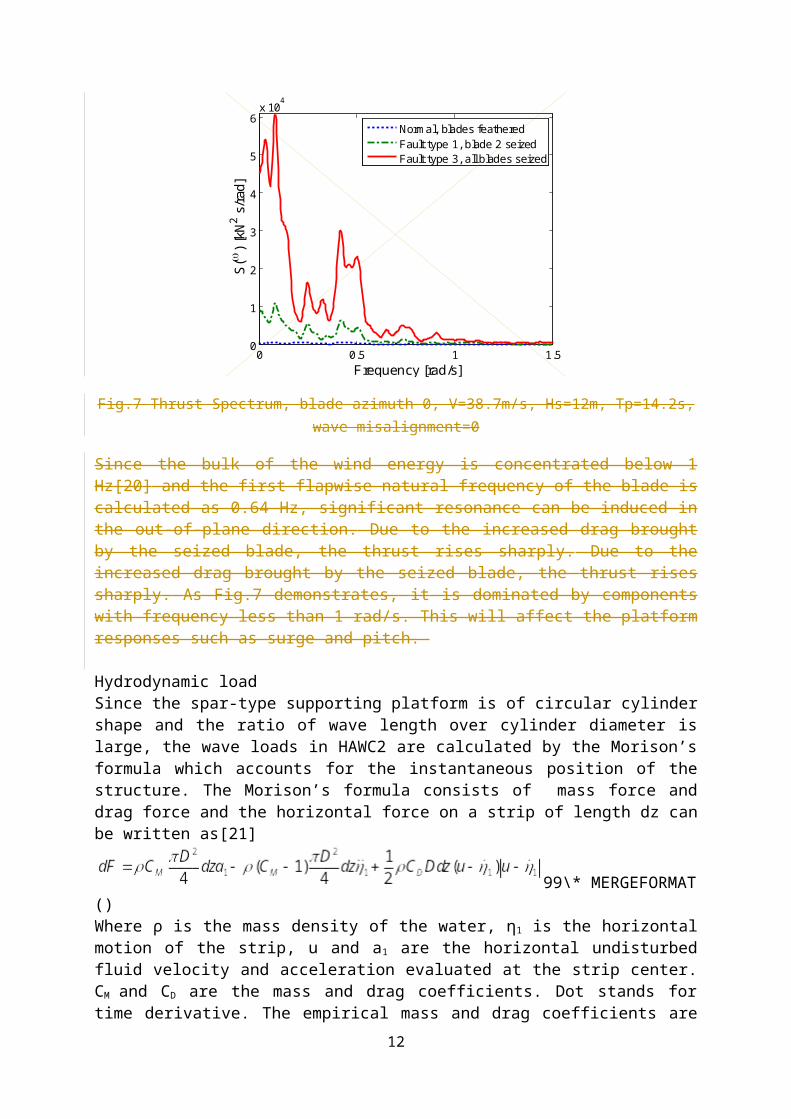
Fig.6 Thrust Spectrum, blade azimuth 0, V=38.7m/s, Hs=12m, Tp=14.2s, wave misalignment=0
Since the bulk of the wind energy is concentrated below 1 Hz[19] and the first flapwise natural frequency of the blade is calculated as 0.64 Hz, significant resonance can be induced in the out-of-plane direction. Fig.5 shows a time history of the normalized thrust which is the ratio of the thrust over the mean aerodynamic drag on the tower for the three studied cases. When blades are feathered, tower drag vouches for about 90% of the total aerodynamic drag on the turbine; while the drag on the blades begin to dominate as one or three blades are seized. Fig.6 manifests that the thrust is dominated by components with frequency less than 1 rad/s. This will affect the platform responses such as surge and pitch.
0 200 400 600 800-1
0
1
2
3
4
5
6
Time (s)
Load
on
blad
e2, r
adiu
s=50
m (k
N)
LiftDrag
Fig.4 Time history of aerodynamic loads on a seized blade, V=38.7m/s, I=0.12, Hs=12m, Tp=14.2s
At a time instant, the relative velocity and the AOA of the blade considering its unidirectional vibration can be expressed as
44\* MERGEFORMAT ()
55\* MERGEFORMAT ()
6

Where is the blade vibration velocity, α is the AOA. The aerodynamic forces, if projected onto the direction of vibration η, lead to[20]
66\* MERGEFORMAT ()Fη can be expanded by Taylor series about
77\* MERGEFORMAT ()
Where F0 is the mean excitation force and the first mode damping coefficient in –η direction is given by[20]
88\* MERGEFORMAT ()
The aerodynamic damping coefficient is proportional to the relative inflow speed and is sensitive to inflow direction. Negative aerodynamic damping would result in instability if the structural damping is insufficient to dissipate the absorbed energy during vibration. The NACA 64 airfoil is applied in this study. Take the average AOA at radius 45m. It varies from -13 to +9 degree for a feathered blade and from 73 to 100 degree for a seized blade under the environmental conditions considered. From Figs.57-6 8, we can observe: a)indicate that the linear aerodynamic damping coefficient for a seized blade is can be higher than that of a feathered blade. b) For a seized blade, the damping stays less sensitive to AOA and reaches maximum around the flapwise direction and minimum around the edgewise direction. The coefficient oscillates harmonically and has a similar variation pattern for a seized blade at different angle of AOA. The linear damping coefficient of a seized blade stays positive and approaches maximum near the flapwise direction ; whilec) a A feathered blade may have light negative aerodynamic damping which is often compensated by structural damping. . The blade structural damping is limiting the blade tip deflections. It is demonstrated here that the aerodynamic forces loads and damping level are quite different when blades are seized. Classical flutter, a more violent blade instability phenomenon, is not likely to occur for the 5-MW turbine at standstill. However, at an unrealistically high rotor speed of 24 rpm, a flutter mode with negative damping is observed [20]. Interested readers are referred to [1, 19, 20] for more on aeroelastic instability issues [1, 19, 20] are out of the scope of this study.
7

-90 -60 -30 0 30 60 90-1.5
-1
-0.5
0
0.5
1
1.5
Direction of vibration [deg]
Line
ar d
ampi
ng c
oeffi
cien
t
[cW
0/2]
AOA -13 degAOA -7 degAOA -1 degAOA 5 degAOA 11 deg
Fig.5 7 Aerodynamic damping coefficient of a feathered blade, NACA 64 airfoil
-90 -60 -30 0 30 60 902.5
3
3.5
4
4.5
5
5.5
Direction of vibration [deg]
Line
ar d
ampi
ng c
oeffi
cien
t [
cW0/2
]
NACA64, Seized Blade
AOA 73 degAOA 82 degAOA 91 degAOA 100 deg
Fig.6 8 Aerodynamic damping coefficient of a seized blade, NACA 64 airfoil
8
0 0.5 1 1.50
1
2
3
4
5
6x 10
4
Frequency [rad/s]
S(
) [k
N2 s
/rad
]
Normal, blades featheredFault type 1, blade 2 seizedFault type 3, all blades seized
Fig.7 Thrust Spectrum, blade azimuth 0, V=38.7m/s, Hs=12m, Tp=14.2s, wave misalignment=0
Since the bulk of the wind energy is concentrated below 1 Hz[20] and the first flapwise natural frequency of the blade is calculated as 0.64 Hz, significant resonance can be induced in the out-of-plane direction. Due to the increased drag brought by the seized blade, the thrust rises sharply. Due to the increased drag brought by the seized blade, the thrust rises sharply. As Fig.7 demonstrates, it is dominated by components with frequency less than 1 rad/s. This will affect the platform responses such as surge and pitch.
Hydrodynamic loadSince the spar-type supporting platform is of circular cylinder shape and the ratio of wave length over cylinder diameter is large, the wave loads in HAWC2 are calculated by the Morison’s formula which accounts for the instantaneous position of the structure. The Morison’s formula consists of mass force and drag force and the horizontal force on a strip of length dz can be written as[21]
99\* MERGEFORMAT()Where ρ is the mass density of the water, η1 is the horizontal motion of the strip, u and a1 are the horizontal undisturbed fluid velocity and acceleration evaluated at the strip center. CM and CD are the mass and drag coefficients. Dot stands for time derivative. The empirical mass and drag coefficients are dependent on the Reynolds number, the Keulegan-Carpenter number and the surface roughness of the cylinder. For deep water and the chosen coefficients, the wave loads are dominated by inertia loading (Fig.8) and decay with depth exponentially[21]. Figs. 9-10 illustrate that the wave loading at the upper part of the spar platform contributes more to the total force. The second term in Eq. (8) indicates that the dominating inertia force is sensitive to the acceleration of the platform motion. Due to the presence of the aerodynamic drag load in wind direction, the fault cases with one or three blades seized were associated with larger thrusts. The heavier loads in the tower top lead to more pronounced platform motion. The water depth being small near the free surface zone, the hydrodynamic loading is dominated by the first term in Eq. (8). That is to say, regardless of the blade pitch position, the wave force remains at the same level. A minor resonant peak can be found in Fig.9 around the first tower fore-aft elastic mode (2.37 rad/s). When the water depth becomes large, the first term dies out and the wave force
9

becomes dominated by the second term which is related to the acceleration of platform motion. In some situation, the fault cases with seized blades may have lower hydrodynamic loads on the spar column. This is due to the elasticity of turbine tower and disappears for a rigid tower. As is shown by Fig.10, when the wave misalignment is 0 deg and there is wind, the wave excitation on the lower part of the spar platform resembles that of a condition with wave alone. Reduced excitation is observed when blades are seized. Due to the increased thrust force acting in the same direction of wave propagation, platform motion velocity rises but acceleration drops. However, the fault cases have larger hydrodynamic loads when the wave misalignment turns 90 deg (Fig.11) because there exist less aerodynamic forces in the wave direction when blades are seized. Due to the long length of the spar column, the hydrodynamic force on the lower part of the spar may affect some structural responses.
200 300 400 500 600 700 800 900
-200
-150
-100
-50
0
50
100
150
200
250
Time (s)
Hyd
rody
nam
ic lo
ad (
kN)
SparU wavedir=0, Hs=12, Tp=14.2, V=38.7M/S
massdrag
Fig.8 9 Hydrodynamic force at 2.53m below MWL, blade2seized, V=38.7m/s
0 0.5 1 1.5 2 2.5 30
500
1000
1500
2000
2500
Frequency [rad/s]
S(
) [k
N2 s
/rad
]
SparU, Azimuth 0, Wavedir=0, Hs=12, Tp=14.2, V=38.7
All blades feathered, V=38.7m/sBlade 2 seized, V=38.7m/sAll blades seized, V=38.7m/sNormal, All blades feathered, V=0m/s
Fig.9 10 Spectrum of wave force at 2.53m below MWL,
Blade azimuth 0 deg, wave misalignment 0 deg, V=38.7m/s, Hs=12m, Tp=14.2s
10

Fig.10 11 Spectrum of wave force Fy at 115m 119m below MWL
Blade azimuth 0 deg, wave misalignment 0 deg, Hs=12m, Tp=14.2s
0 0.5 1 1.5 2 2.5 30
500
1000
1500
Frequency [rad/s]
S(
) [k
N2 s
/rad
]
SparL, Azimuth 0, Wavedir=0, Hs=12, Tp=14.2, V=38.7
All blades feathered, V=38.7m/sBlade 2 seized, V=38.7m/sAll blades seized, V=38.7m/sAll blades feathered, V=0m/s
Fig.11 12 Spectrum of wave force Fx at 115m 119m below MWL
Blade azimuth 0 deg, wave misalignment 90 deg, Hs=12m, Tp=14.2s
For deep water and the chosen coefficients, the wave loads are dominated by inertia loading (Fig.9). From Fig.10 we can see that the hydrodynamic forces at 3m below the mean water level (MWL) remain at the same level regardless of the blade pitch position. The presence of wind does not contribute much compared with a wave-alone case. Near the MWL, since the first term in Eq.(8) dominates, the wave forces are less affected by the platform motion. The spectrum of wave force along two wave directions at a position far from the MWL are given
11
in Figs.11-12. Evident difference between the feathered case and the seized cases is observed for the peak around the first tower elastic mode (2.37 rad/s). When wave misalignment from wind is 0 deg, there is larger wind loads for the seized cases in the direction of wave propagation. The seized cases damp out the peak. When wave misalignment turns 90 deg, the feathered cases do so since there is larger wind loads in wave direction for the feathered cases. As the water depth grows large, the first term in Eq.(8) dies out exponentially and the wave force becomes dominated by the second term which is related to the acceleration of platform. It is observed that the platform motion acceleration decreases as a consequence of increased aerodynamic load acting in the same direction of the wave. This is due to the interaction between wave and wind. It is also worthy of note that the bulk of hydrodynamic force is concentrated around the water surface, as is shown by comparing Fig. 10 and Fig.11.
Environmental conditionThe Statfjord site was chosen as a representative site for the wind turbine considered. The environment of the site can be described by a joint probabilistic model proposed by [22]. The marginal distribution of the 1-hour mean wind speed at 10 m is given by
1010\* MERGEFORMAT ()Where α=1.708 and β=8.426. The conditional distribution of Hs for given V was also described by the 2-parameter Weibull distribution with
1111\* MERGEFORMAT ()The conditional distribution of Tp can be best fitted by a lognormal distribution
1212\* MERGEFORMAT ()Where the μln(Tp) and σln(Tp) are the mean value and standard deviation of ln(Tp). They can be expressed as
1313\* MERGEFORMAT ()
Where μTp and σTp are calculated by
1414\* MERGEFORMAT ()Based on the joint model, a contour surface[23] with a given return period can be obtained:
12

05
1015
0
10
200
10
20
30
Hs [m]
1-yr Contour Surface
Tp [s]
V [m
/s]
Fig.12 13 Contour surface of the joint distribution for wind and waves, 1-year return period
0 2 4 6 8 10 120
5
10
15
20
25
30
Hs [m]
V [m
/s]
Projection of 1-yr Contour Surface to 2-D
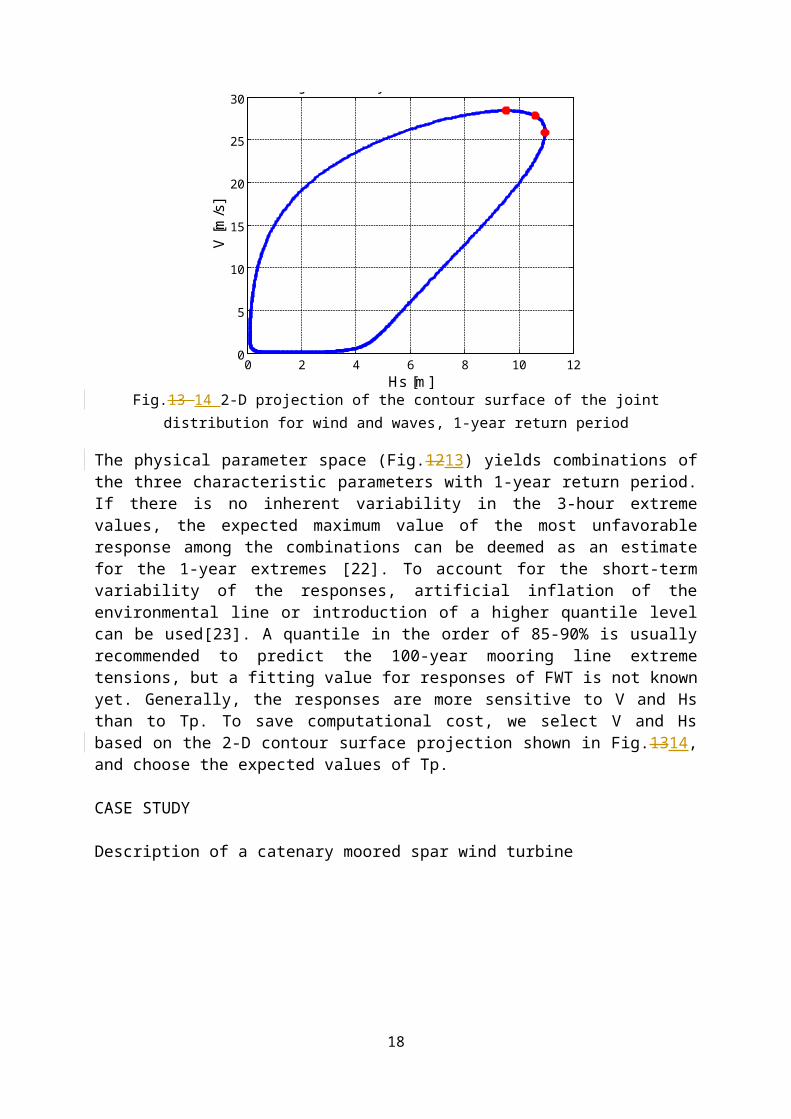
Fig.13 14 2-D projection of the contour surface of the joint distribution for wind and waves, 1-year return period
The physical parameter space (Fig.1213) yields combinations of the three characteristic parameters with 1-year return period. If there is no inherent variability in the 3-hour extreme values, the expected maximum value of the most unfavorable response among the combinations can be deemed as an estimate for the 1-year extremes [22]. To account for the short-term variability of the responses, artificial inflation of the environmental line or introduction of a higher quantile level can be used[23]. A quantile in the order of 85-90% is usually recommended to predict the 100-year mooring line extreme tensions, but a fitting value for responses of FWT is not known yet. Generally, the responses are more sensitive to V and Hs than to Tp. To save computational cost, we select V and Hs based on the 2-D contour surface projection shown in Fig.1314, and choose the expected values of Tp.
CASE STUDY
Description of a catenary moored spar wind turbine
13

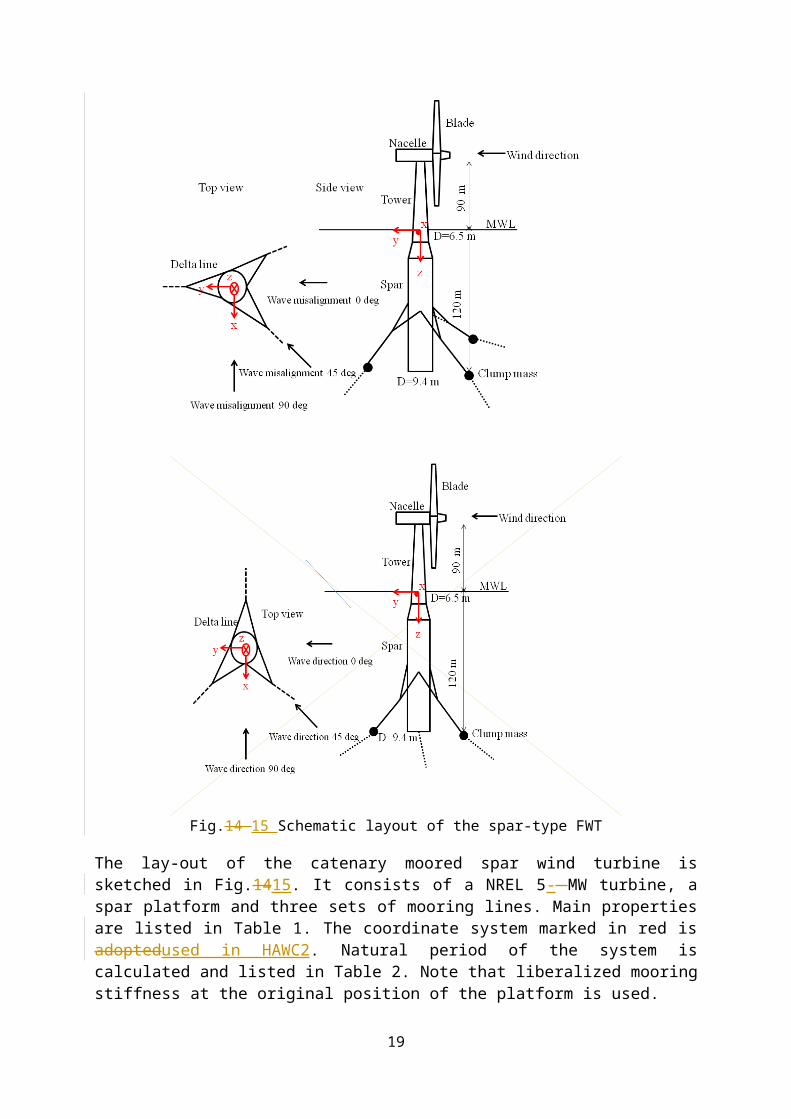
Fig.14 15 Schematic layout of the spar-type FWT
The lay-out of the catenary moored spar wind turbine is sketched in Fig.1415. It consists of a NREL 5- MW turbine, a spar platform and three sets of mooring lines. Main properties are listed in Table 1. The coordinate system marked in red is adoptedused in HAWC2. Natural period of the system is calculated and listed in Table 2. Note that liberalized mooring stiffness at the original position of the platform is used.
Table 1 Properties of the spar-type wind turbineTurbine NREL 5MW
14

Water depth (m) 320
Draft (m) 120
Displacement (m3) 8016
Diameter MWL (m) 6.5
Diameter at bottom (m) 9.4
Mass (t) 8216
Centre of gravity (m) -78.5
Mass (t) 8216
Mass moment of inertia, Ixx and Iyy (t∙m2) 6.98∙107
Mass moment of inertia, Izz (t∙m2) 1.68∙104
Fairlead elevation (m) 70
Table 2 Natural frequencies of the wind turbine
Motion Natural period (s) Natural frequency (rad/s)
Surge 115 0.055
Sway 125 0.05
Heave 31.4 0.2
Roll/pitch 32.7 0.19
Yaw 7.6 0.838
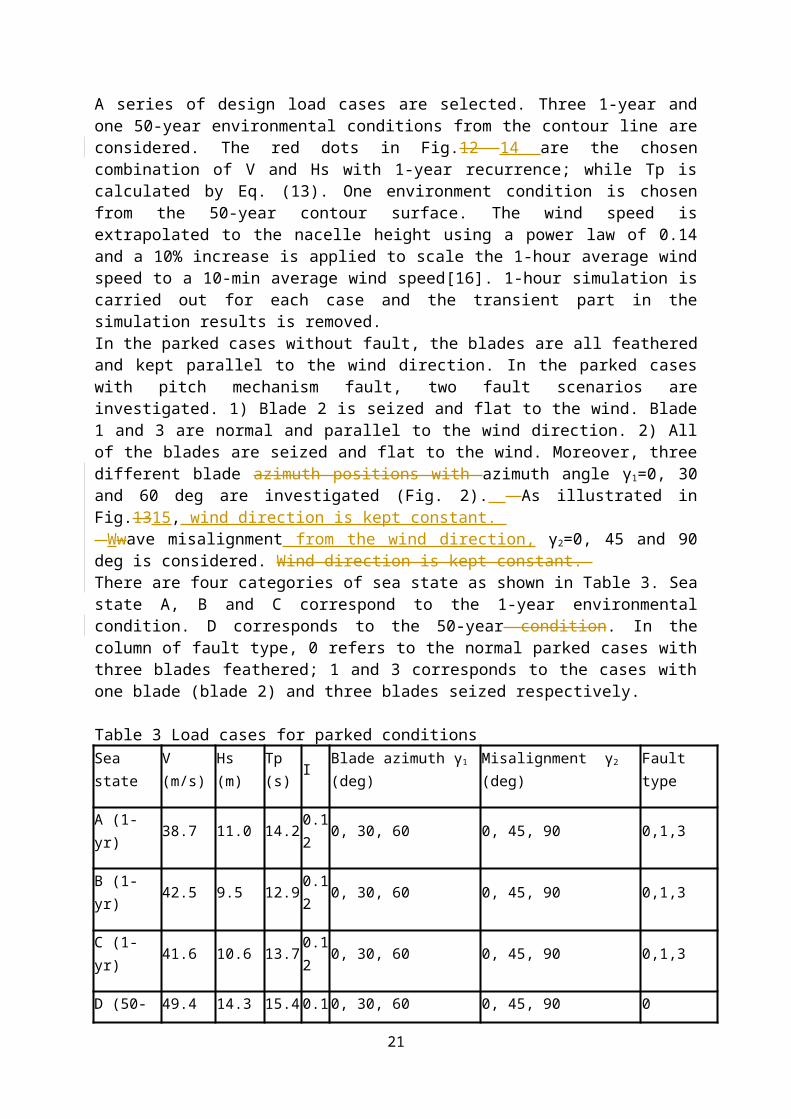
Load casesA series of design load cases are selected. Three 1-year and one 50-year environmental conditions from the contour line are considered. The red dots in Fig.12 14 are the chosen combination of V and Hs with 1-year recurrence; while Tp is calculated by Eq. (13). One environment condition is chosen from the 50-year contour surface. The wind speed is extrapolated to the nacelle height using a power law of 0.14 and a 10% increase is applied to scale the 1-hour average wind speed to a 10-min average wind speed[16]. 1-hour simulation is carried out for each case and the transient part in the simulation results is removed.In the parked cases without fault, the blades are all feathered and kept parallel to the wind direction. In the parked cases with pitch mechanism fault, two fault scenarios are investigated. 1) Blade 2 is seized and flat to the wind. Blade 1 and 3 are normal and parallel to the wind direction. 2) All of the blades are seized and flat to the wind. Moreover, three different blade
15

azimuth positions with azimuth angle γ1=0, 30 and 60 deg are investigated (Fig. 2). As illustrated in Fig.1315, Wwind direction is kept constant. Wwave misalignment from the wind direction, γ2=0, 45 and 90 deg is considered. Wind direction is kept constant. There are four categories of sea state as shown in Table 3. Sea state A, B and C correspond to the 1-year environmental condition. D corresponds to the 50-year condition. In the column of fault type, 0 refers to the normal parked cases with three blades feathered; 1 and 3 corresponds to the cases with one blade (blade 2) and three blades seized respectively.
Table 3 Load cases for parked conditionsSea state V (m/s) Hs (m) Tp (s) I Blade azimuth γ1 (deg) Misalignment γ2 (deg) Fault type
A (1-yr) 38.7 11.0 14.2 0.12 0, 30, 60 0, 45, 90 0,1,3
B (1-yr) 42.5 9.5 12.9 0.12 0, 30, 60 0, 45, 90 0,1,3
C (1-yr) 41.6 10.6 13.7 0.12 0, 30, 60 0, 45, 90 0,1,3
D (50-yr) 49.4 14.3 15.4 0.10 0, 30, 60 0, 45, 90 0
RESULSTS AND DISCUSSIONS
Effect of blade azimuth position and wave misalignmentWhen the rotor is brought to standstill, blade 1 would assume an azimuth angle γ1. If γ1=0 or 60 deg, blades are axis-symmetrical about the tower. Azimuth position would affect the aerodynamic loading and thus the responses due to wind shear and load balanceblade symmetry. For a given environmental condition and wave misalignment, when the turbine is normal feathered (fault type 0), the wind-induced yaw responses are affected by the change of blade loads (Fig.16). For sea state A, γ2=0 deg, maximum yaw angle at γ1=0 deg is 6.1 deg, 128% larger than that at γ1=60 deg. Roll motion is slightly affected.
0 500 1000 1500 2000 2500 3000 3500-10
-5
0
5
10
Time (s)
Yaw
Ang
le (
deg)
2=0 Uw=49.4m/s Hs=15.6m/s, Tp=15.4m/s
1=0 deg
1=30 deg
1=60 deg
Fig.15 16 Normal parked condition, γ2=0 deg, sea state D
16

0 0.5 1 1.50
5
10
15
20
25
30
Frequency [rad/s]
S(
) [d
eg2 s
/rad
]
1=0 deg
1=30 deg
1=60 deg
Wave frequency response
Yaw resonant response
0 0.5 1 1.50
5
10
15
20
25
30
Frequency [rad/s]
S(
) [d
eg2 s
/rad
]
2=0 deg
2=30 deg
2=60 deg
Wave frequency response
Yaw resonant response
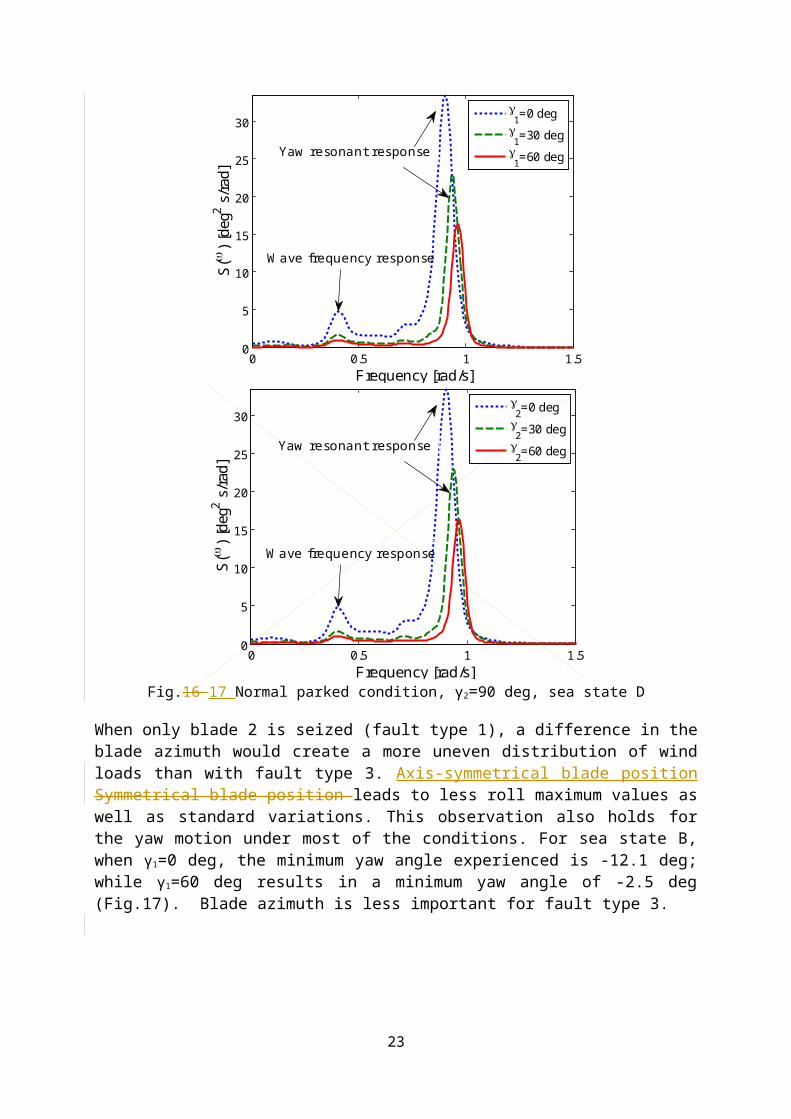
Fig.16 17 Normal parked condition, γ2=90 deg, sea state D
When only blade 2 is seized (fault type 1), a difference in the blade azimuth would create a more uneven distribution of wind loads than with fault type 3. Axis-symmetrical blade position Symmetrical blade position leads to less roll maximum values as well as standard variations. This observation also holds for the yaw motion under most of the conditions. For sea state B, when γ1=0 deg, the minimum yaw angle experienced is -12.1 deg; while γ1=60 deg results in a minimum yaw angle of -2.5 deg (Fig.17). Blade azimuth is less important for fault type 3.
17
0 45 90-12
-11
-10
-9
-8
-7
-6
-5
-4
-3
-2
Wave misalignment (deg)
Min
yaw
(de
g)
sea state 2 Fault type 1
1=0 deg
1=30 deg
1=60 deg
Fig.17 18 Variation of the extreme yaw angle with wave direction, sea state B, fault type 1
Wave misalignment plays a big role in the extreme values and the standard deviation of the responses. The mean values of the responses are governed by the wind loads and are less sensitive to the wave direction. All of the extreme responses except yaw motion have consistent wave misalignment in the 1-year sea states. It is shown in Table 4 that sea state B which has the largest wind speed is linked with all of the response extremes. Under the 1-year environmental condition, wind speed seems to contribute more to the response extremes than significant wave height does.
Table 4 Response extremes and characteristics of the parked cases (based on 1-year environment and 1-hour simulation)
18
Comparison of normal and fault conditionsThe occurrence of blade pitch mechanism fault alters the AOA on the blade, changing the blade loads, platform motion and structural response consequently. Since the extreme responses of FWT are governed by survival conditions[16], it is worthwhile to compare the consequences of the pitch mechanism fault in a less harsh condition (1-year) with those under a survival condition (50-year). Motion responsePlatform pitch motion and nacelle surge motion are in the direction of the inflow wind. Fault type 1 and 3 lead to evident increases of thrust loads. The low frequency excitation contributes to the larger surge and pitch resonant responses (Fig.1819). The wave frequency response is almost unaffected due to negligible difference of hydrodynamic force near the free water surface (Fig.10).
0 0.2 0.4 0.6 0.8 10
50
100
150
200
250
300
350
400
Frequency [rad/s]
S(
) [m
2 s/r
ad]
Compar. Wavdir0 Narcelle Surge, Hs=12, Tp=14.2, V=38.7M/S
Fault type 0, blades featheredFault type 1, blade 2 seizedFault type 3, all blades seized
Fig.18 19 Nacelle surge spectrum, blade azimuth γ1=0 deg, Sea State A
19
Extreme Value
Blade Azimuth γ1 (deg)
Misalignment γ2 (deg)
Sea StateFault type
Surge (m) 77.2 30 0 B 3
Sway (m) -24.1 60 90 B 0
Roll (deg) 5.9 30 90 B 1
Pitch (deg) 15.3 30 0 B 3
Yaw (deg) -12.1 0 0 B 1
Tower shear Fy (kN) 3573.9 0 0 B 3
Tower moment My (kN∙m)
214049.0 30 90 B 1
Flapwise bending moment of blade1 (kN∙m)
13074.7 0 90 B 1
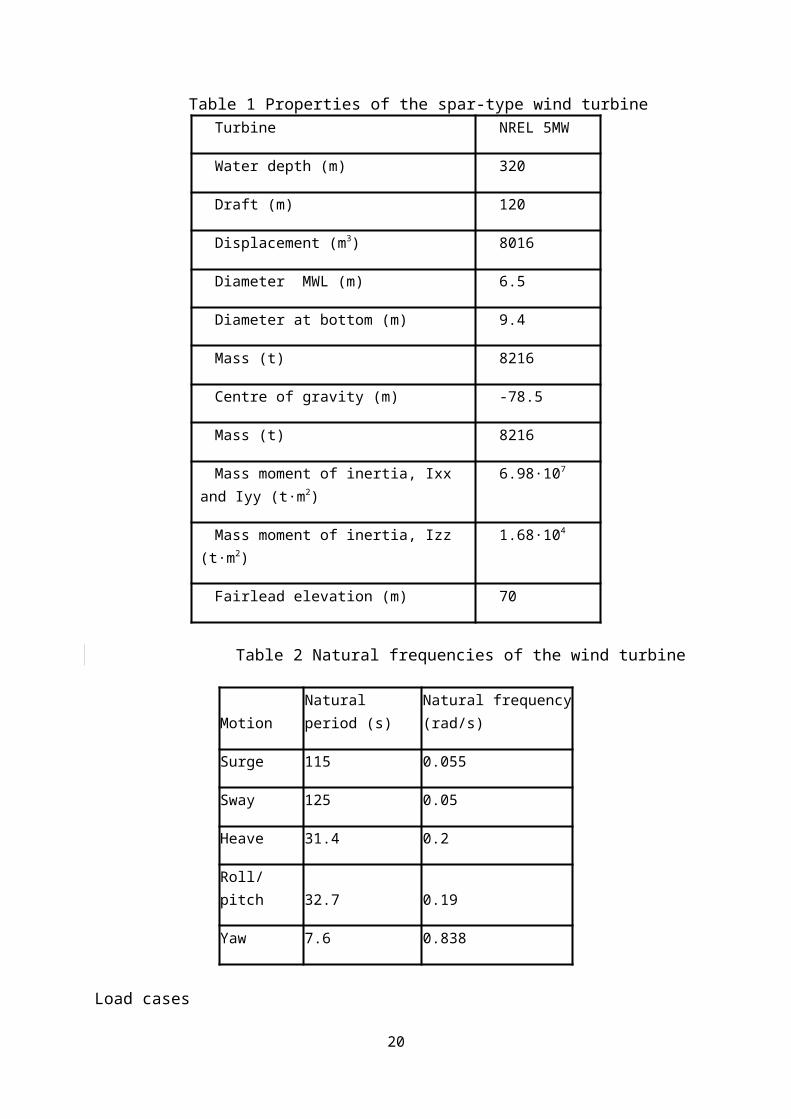
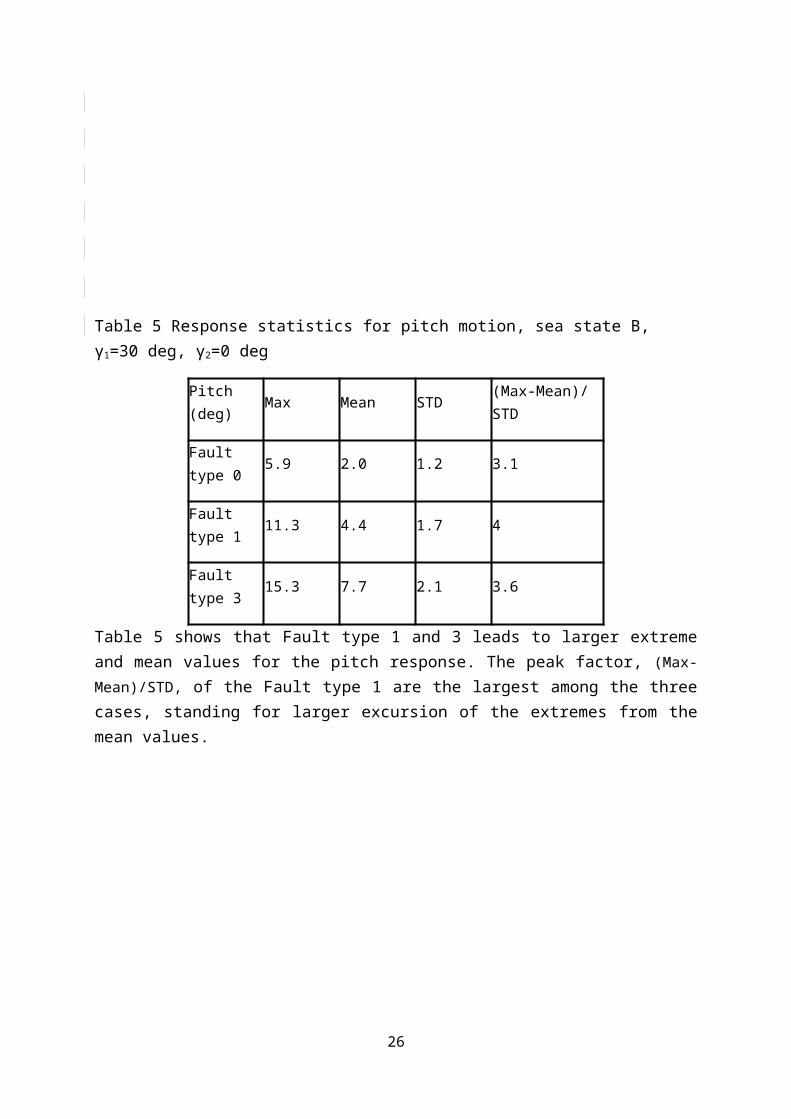
Table 5 Response statistics for pitch motion, sea state B, γ1=30 deg, γ2=0 deg
Pitch (deg) Max Mean STD (Max-Mean)/STD
Fault type 0 5.9 2.0 1.2 3.1
Fault type 1 11.3 4.4 1.7 4
Fault type 3 15.3 7.7 2.1 3.6
Table 5 shows that Fault type 1 and 3 leads to larger extreme and mean values for the pitch response. The peak factor, (Max-Mean)/STD, of the Fault type 1 are the largest among the three cases, standing for larger excursion of the extremes from the mean values.
0 0.5 1 1.50
2
4
6
8
10
12
14
16
18
Frequency [rad/s]
S(
) [d
eg2 s
/rad
]
Compar. wavdir90 Spar Roll, Hs=10.4, Tp=12.9, V=42.5
Fault type 0, blades featheredFault type 1, blade 2 seizedFault type 3, all blades seized
Roll resonant response
Wave frequency response
Fig.19 20 Spectrum of roll motion, γ1=30 deg, γ2=90 deg, Sea State B
Fault type 1 is connected with more larger roll responses compared with fault type 0 and 3 (Fig.19) only if the blade azimuth γ1 is other than 60 deg (Fig.20). The response of the yaw is very sensitive to the wave direction as well. Only when γ1 is other than 60 deg and γ2 is 0 deg will fault type 1 lead to the largest response resonances among the three conditions.
20
1 2 30.9
1
1.1
1.2
1.3
1.4
1.5
1.6
1.7
1.8
1.9
Case No.
Nor
mal
ized
res
pons
e m
axim
um
Blade2 seized
surge, 1-yr with fault type1pitch, 1-yr with fault type1yaw, 1-yr with fault type1roll, 1-yr with fault type11-yr with fault type 0
Fig.20 21 Extreme values of motion responses of fault type 1 normalized by the 1-year response of fault type 0 (Normal normal case)
1 2 30.85
0.9
0.95
1
1.05
1.1
1.15
1.2
1.25
1.3
1.35
Case No.
Nor
mal
ized
res
pons
e m
axim
um
Blade2 seized
surge, 1-yr with fault type1pitch, 1-yr with fault type1yaw, 1-yr with fault type1roll, 1-yr with fault type150-yr with fault type 0
Fig.21 22 Extreme values of motion response of fault type 1 normalized by the 50-year response of fault type 0 (normal case)(Normal case)
21

1 2 30.8
1
1.2
1.4
1.6
1.8
2
2.2
2.4
2.6
Case No.
Nor
mal
ized
res
pons
e m
axim
um
Blade123 seized
Surge, 1-year with fault type 3pitch, 1-yr with fault type 3yaw, 1-yr with fault type 3roll, 1-yr with fault type 31-yr with fault type 0
Fig.22 23 Extreme values of motion response of fault type 3 normalized by the 1-year response of fault type 0 (Normal normal ccasease)
1 2 30.5
0.6
0.7
0.8
0.9
1
1.1
1.2
1.3
1.4
1.5
Case No.
Nor
mal
ized
res
pons
e m
axim
um
Blade123 seized
surge, 1-yr with fault type 3pitch, 1-yr with fault type 3yaw, 1-yr with fault type 3roll, 1-yr with fault type 350-yr with fault type 0
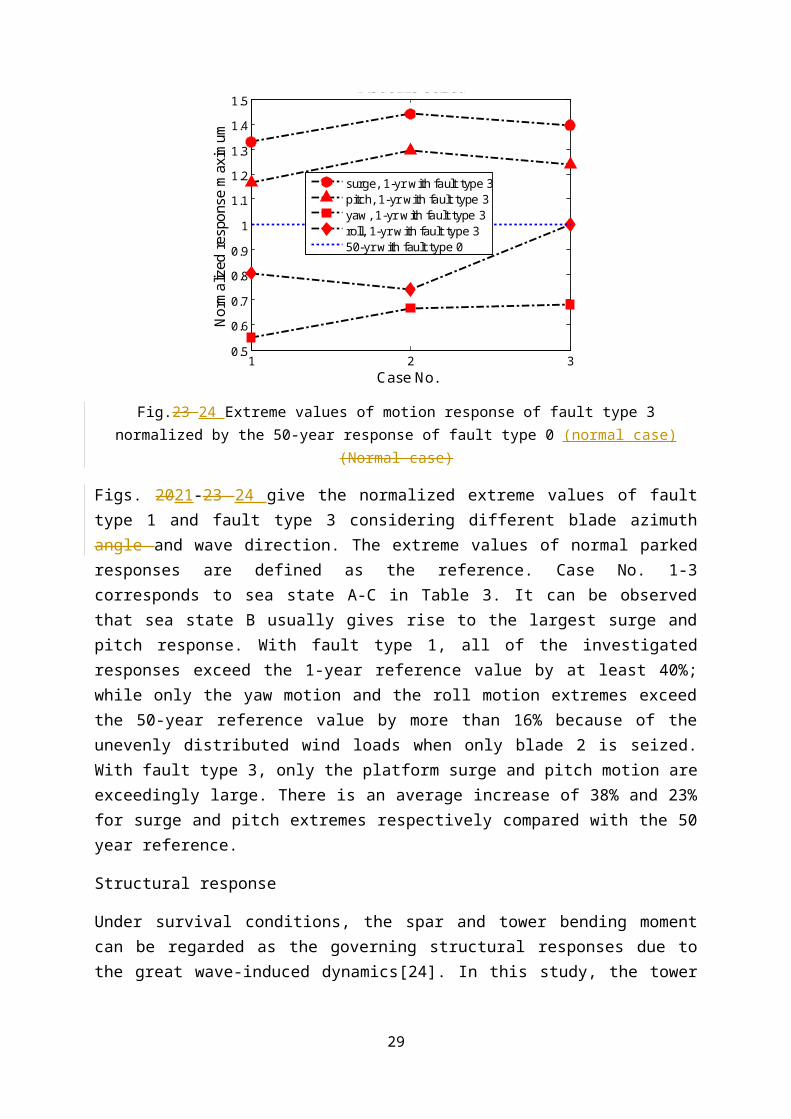
Fig.23 24 Extreme values of motion response of fault type 3 normalized by the 50-year response of fault type 0 (normal case)(Normal case)
Figs. 2021-23 24 give the normalized extreme values of fault type 1 and fault type 3 considering different blade azimuth angle and wave direction. The extreme values of normal parked responses are defined as the reference. Case No. 1-3 corresponds to sea state A-C in Table 3. It can be observed that sea state B usually gives rise to the largest surge and pitch response. With fault type 1, all of the investigated responses exceed the 1-year reference value by at least 40%; while only the yaw motion and the roll motion extremes exceed the 50-year reference value by more than 16% because of the unevenly distributed wind loads when only blade 2 is seized. With fault type 3, only the platform surge and pitch motion are exceedingly
22
large. There is an average increase of 38% and 23% for surge and pitch extremes respectively compared with the 50 year reference.
Structural response
Under survival conditions, the spar and tower bending moment can be regarded as the governing structural responses due to the great wave-induced dynamics[24]. In this study, the tower bottom bending moment and shear force at 0 m elevation are selected for the spectrum analysis.
0 0.5 1 1.5 2 2.5 30
2
4
6
8
10
12x 10
9
Frequency [rad/s]
S(
) [k
Nm
2 s/r
ad]
Fault type 0, blades featheredFault type 1, blade 2 seizedFault type 3, all blades seized
Fig.24 25 Tower bottom bending moment Mx spectrum, blade azimuth γ1=30 deg, γ2=0 deg, sea state B
23

0 0.5 1 1.5 2 2.5 30
2
4
6
8
10
12
14x 10
5
Frequency [rad/s]
S(
) [k
N2 s
/rad
]
Fault type 0, blades featheredFault type 1, blade 2 seizedFault type 3, all blades seized
0 0.5 1 1.5 2 2.5 30
2
4
6
8
10
12
14x 10
5
Frequency [rad/s]
S(
) [k
N2 s
/rad
]
Fault type 0, blades featheredFault type 1, blade 2 seizedFault type 3, all blades seized
Fig.25 26 Tower bottom shear force Fy spectrum, γ1=30 deg, γ2=0 deg, sea state B
24

0 0.5 1 1.5 2 2.5 30
2
4
6
8
10
12
x 109
Frequency [rad/s]
S(
) [k
Nm
2 s/r
ad]
Fault type 0, blades featheredFault type 1, blade 2 seizedFault type 3, all blades seized
Fig.26 27 Tower bottom bending moment My spectrum, blade azimuth γ1=30 deg, γ2=90 deg, sea state C
0 0.5 1 1.5 2 2.5 30
2
4
6
8
10
12
14
16
x 105
Frequency [rad/s]
S(
) [k
N2 s
/rad
]
Fault type 0, blades featheredFault type 1, blade 2 seizedFault type 3, all blades seized
Fig.27 28 Tower bottom shear force Fx spectrum, γ1=30 deg, γ2=90 deg, sea state C
In Figs.2425-27 28 the spectrums of the dominating tower bottom bending moment and shear force have been plotted. They are smoothed with the Parzen window[25]. It is clear from the analysis of hydrodynamic load that the influence of fault types depends on the wave direction. When wave misalignment γ2=0 deg, the occurrence of fault reduce the resonant response near the first tower elastic mode (Figs.2425-2526). However, when wave misalignment increases, the occurrence of fault may enhances the resonant response (Figs.2627-2728). The structural
25
resonant responses may beare especially due to the hydrodynamic excitation at lower part of the spar column (Figs.11-12).
1 2 30.7
0.8
0.9
1
1.1
1.2
1.3
Case No.
Nor
mal
ized
res
pons
e m
axim
um
Blade2 seized
Mx tower, 1-year with fault type1My tower, 1-yr with fault type1Fy tower, 1-yr with fault type1Mx blade1, 1-yr with fault type11-yr with fault type 0
Fig.28 29 Extreme values of structural response of fault type 1 normalized by the 1-year response of fault type 0
1 2 30
0.2
0.4
0.6
0.8
1
Case No.
Nor
mal
ized
res
pons
e st
d.
Blade2 seized
Mx tower, 1-year with fault type1My tower, 1-yr with fault type1Fy tower, 1-yr with fault type1Mx blade1, 1-yr with fault type150-yr with fault type 0
Fig.29 30 Extreme values of structural response of fault type 1 normalized by the 50-yr response of fault type 0
26

1 2 30.6
0.8
1
1.2
1.4
1.6
1.8
Case No.
Nor
mal
ized
res
pons
e m
axim
um
Blade123 seized
Mx tower, 1-yr with fault type 3My tower, 1-yr with fault type 3Fy tower, 1-yr with fault type 3Mx blade1, 1-yr with fault type 31-yr with fault type 0
Fig.30 31 Extreme values of structural response of fault type 3 normalized by the 1-yr response of fault type 0
1 2 30.65
0.7
0.75
0.8
0.85
0.9
0.95
1
1.05
1.1
1.15
Case No.
Nor
mal
ized
res
pons
e m
axim
um
Blade123 seized
Mx tower, 1-yr with fault type 3My tower, 1-yr with fault type 3Fy tower, 1-yr with fault type 3Mx blade1, 1-yr with fault type 350-yr with fault type 0
Fig.31 32 Extreme values of structural response of fault type 3 normalized by the 50-yr response of fault type 0
The normalized extreme structural responses are presented in Figs. 2829-3132. In each figure the tower bottom bending moment, shear force and flapwise bending moment of blade 1 with two different conditions are compared. Most of the extreme values of fault type 1 exceed those of fault type 0 by at least 10% under the same 1-year sea state. Tower bottom shear Fy is about the same level of the reference. The extremes are well below those of a 50-year response without fault and can be deemed as uncritical. In comparison, the structural responses related to fault type 3 could be more challenging. The relative increase of fault type 3 over fault type 0 varies from sea state to sea state and larger disparity is expected for blade root bending moment and tower bottom moment in –x direction. Contrasted with the 50-year responses, the increases for both can still be 10 % in sea state B (Fig. 31Fig. 32).
27

Peak response of the bladeThe extreme value of the flapwise bending moment is key to blade design. As noted above, the extreme blade responses related to the fault conditions can be particularly high. However, the corresponding variances are not as large. This will affect the peak factor g, which denotes the departure of the maximum from the mean and can be written as
1515\* MERGEFORMAT ()Where Mmax and Mmean are the maximum and mean value of blade root bending moment. For a Gaussian process, the peak factor has been shown by Davenport as
1616\* MERGEFORMAT ()
Where ν is the mean zero-upcrossing frequency of the root moment fluctuations and T is the mean wind speed averaging period. Note that g in Eq. (15) is the asymptotic value which is used to derive the expected value of the largest maximum. The blade flapwise bending moment is approximately Gaussian and g is close to 3.9 in this study.
1 2 33.6
3.8
4
4.2
4.4
4.6
4.8
5
Case No.
Pea
k fa
ctor
g
1=0 2=30
1-yr with fault type 01-yr with fault type 11-yr with fault type 3Asympotic value
Fig.32 33 Peak factor of flapwise bending moment of blade 1, γ1=30 deg, γ2=0 deg, sea state BAs shown by Fig. 32Fig. 33, the peak factors of the responses with fault type 1 and 3 are generally higher than the asymptotic value for a given blade azimuth and wave misalignmentand the results of the normal condition. This is likely to be caused by the larger pitch, surge and roll motion response of the platform upon the occurrence of fault. The large excursion of peak factors from asymptotic is expected to drop as the number of simulation is increased.
CONCLUSIONS AND FUTURE WORK
It is parked wind turbines that are likely to experience challenging environments. Besides, the occurrence of fault poses extra safety concerns for FWTs. Herein two kinds of blade fault, valve blockage and pump blockage are assumed to have occurred to the blade pitch
28
mechanism. As a consequence, the wind turbine blades are seized and prevented from pitching or idling. The wind loads on the turbine are altered, making an impact on the responses as well. In this paper, the steady-state responses of a spar-type wind turbine are carried out accordingly based on environmental conditions from the 1-year contour line. Similarly, simulations are run for a normal parked turbine with fully feathered blades under 1-year and 50-year environmental conditions for comparison.
The turbine blades assume certain azimuth position when parked. Three different azimuth angle, γ1=0 deg, 30 deg and 60 deg are assumed. It is found that the blade azimuth affects yaw and roll motion most. For a standing still floating turbine, tower-axis symmetrical blade position with γ1=60 deg should be adopted. This can reduce the extreme values of yaw angle by 128% for a normal one and by four times for one with blade 2 seized. The impact is negligible for one with three blades seized, nonetheless.
Three wave misalignments, γ2=0 deg, 45 deg and 90 deg are considered. The response extremes and standard deviations stay sensitive to the wave direction, but the mean values does not since they are dominated by wind loads.
Seized blade which is related to the fault condition increases the aerodynamic drag significantly. Compared with the normal feathered condition, the contribution of one seized blade can be larger than the averaged aerodynamic drag on the tower.
The hydrodynamic loads at the lower part of the spar platform are affected by the fault condition. But they are not necessarily larger when fault occurs and are small compared with those at the upper part.
The platform motion responses are more affected by the defined faults than the structural responses do. Fault type 1 typically has the largest roll resonance and yaw extreme angle among the three, extremes exceeding the 50 year reference values by more than 16%. Fault type 3 causes a dramatic increase of platform surge and pitch motion. There is an average increase of 38% and 23% for surge and pitch extremes respectively compared with the 50-year reference.
In contrast, the structural responses such as tower bottom bending moment and shear force are are sensitive to the wave direction and do not necessarily have larger responses under the fault condition. With fault type 1, all of the response extremes are less than the 50-year reference. With fault type 3, the tower bottom bending moment and blade root bending moment may exceed the 50-year reference by more than 10% under certain environmental condition. Since the flapwise bending moment of the blade 1 are approximately Gaussian, the peak factor of the three fault types are evaluated. Seized blades lead to extremes departing more from the mean values. Due to the limited simulations, the peak factors do not converge to the asymptotic value.
Among the three 1-year environment conditions investigated, sea state B, the condition with the largest mean wind velocity, contributes to most of the extreme response values. Thus,
29

wind velocity may be regarded as the most important environmental parameter affecting response extremes for a parked FWT.
Upon the occurrence of fault, the transient responses of a wind turbine in operation can be of great importance. The responses of the mechanical parts as well as the platform motion will be investigated in the future.
ACKNOWLEDGEMENTS
REFERENCES R
[1] Burton T, Jenkins N, Sharpe D, Bossanyi E. Wind Energy Handbook: Wiley Online Library; 2011.[2] Twidell J, Gaudiosi G. Offshore Wind Power. Wind Engineering. 2010;34:123-4.[3] Comission IE. IEC 61400-3 Ed.3. Wind Turbines. Part3: Design Requirements for offshore wind turbines. Geneva2009.[4] DNV. DNV-OS-J101 Design of Offshore Wind Turbine Structures. 2010.[5] Arabian-Hoseynabadi H, Oraee H, Tavner P. Failure Modes and Effects Analysis (FMEA) for wind turbines. International Journal of Electrical Power & Energy Systems. 2010;32:817-24.[6] Ribrant J. Reliability performance and maintenance-a survey of failures in wind power systems.[7] Michael Wilkinson BH. Deliverable 1.3: Report on Wind Turbine Reliability Profiles. GL Garrad Hassan; 2011.[8] Tavner P. Recommendations from the ReliaWind Consortium for the Standardisation for the Wind Industry of Wind Turbine Reliability Taxonomy, Terminology and Data Collection. Durham University; 2011.[9] Thomas Esbensen CS. Fault Diagnosis and Fault-Tolerant Control of Wind Turbines: Aalborg University; 2009.[10] DNV/Risø. Guidelines for Design of Wind Turbines. 2002.[11] Bir G, Jonkman J. Aeroelastic instabilities of large offshore and onshore wind turbines. IOP Publishing; 2007. p. 012069.[12] Jonkman J, Buhl Jr M. Loads Analysis of a Floating Offshore Wind Turbine Using Fully Coupled Simulation. 2007.[13] Matha D. Model Development and Loads Analysis of an Offshore Wind Turbine on a Tension Leg Platform with a Comparison to Other Floating Turbine Concepts: April 2009. National Renewable Energy Laboratory (NREL), Golden, CO.; 2010.[14] Karimirad M, Moan T. Effect of Aerodynamic and Hydrodynamic Damping on Dynamic Response of Spar Type Floating Wind Turbine. European Wind Energy Conference2010. p. 55.[15] Laboratory RN. How 2 HAWC2, The User's Manual. Technical University of Denmark; 2009.[16] Karimirad M, Moan T. Wave and Wind Induced Dynamic Response of a Spar Type Offshore Wind‐ Turbine. Journal of Waterway, Port, Coastal, and Ocean Engineering. 2011;1:55.[17] Karimirad M, Meissonnier Q, Gao Z, Moan T. Hydroelastic code-to-code comparison for a tension leg spar-type floating wind turbine. Marine Structures. 2011.[18] Hansen MOL. Aerodynamics of wind turbines: Earthscan/James & James; 2008.[19] Holmes JD. Wind loading of structures: Taylor & Francis Group; 2007.[20] Hansen MH. Aeroelastic instability problems for wind turbines. Wind Energy. 2007;10:551-77.[21] Faltinsen OM. Sea loads on ships and offshore structures: Cambridge Univ Pr; 1993.
30

[22] Johannessen K, Meling T, Haver S. Joint distribution for wind and waves in the northern north sea. 2001.[23] Haver SK. Prediction of Characteristic Response for Design Purposes (PRELIMINARY VERSION). Statoil; 2011.[24] Karimirad M, Moan T. Extreme dynamic structural response analysis of catenary moored spar wind turbine in harsh environmental conditions. Journal of Offshore Mechanics and Arctic Engineering. 2011;133:041103.[25] Brodtkorb PA, Johannesson P, Lindgren G, Rychlik I, Rydén J, Sjö E. WAFO—a Matlab toolbox for analysis of random waves and loads. 2000.
31


![CE 160 Notes - Live Load Lab 5 notes.pdfVukazich CE 160 Live Load Notes [L5] 3 Floor Live Load reduction is permitted in most cases for members with large influence area (A I) Tributary](https://img.pdfslide.us/doc/110x75/5f0db8747e708231d43bc088/ce-160-notes-live-load-lab-5-notespdf-vukazich-ce-160-live-load-notes-l5-3.jpg)