Embed Size (px)
Citation preview
'Development of a high throughput UHPLC-MS/MS (SRM) method for the quantitation of
endogenous glucagon from human plasma
James W Howard1, 2†, Richard G Kay1, Tricia Tan3, James Minnion3, Mohammad Ghatei3,
Steve Bloom3 and Colin S Creaser2
1 LGC Limited, Newmarket Road, Fordham, Cambridgeshire,
CB7 5WW, UK
2 Centre for Analytical Science, Department of Chemistry, Loughborough University,
Leicestershire, LE11 3TU, UK
3 Imperial College, Department of Investigative Medicine, Hammersmith Hospital Campus,
Du Cane Road, London, W12 0NN, UK
† Author for correspondence. Tel: +44 (0) 1638 720 500. Fax: +44 (0)1638 724 200
Email: [email protected]
Abstract
Background: Published LC-MS/MS methods are not sensitive enough to quantify
endogenous levels of glucagon. Results: A UHPLC-MS/MS (SRM) method for the
quantitation of endogenous levels glucagon was successfully developed and qualified. A
novel 2D extraction procedure was used to reduce matrix suppression, background noise
and interferences. The method used a surrogate matrix based quantitation approach, which
resulted in good precision and accuracy. Glucagon levels in samples from healthy volunteers
were found to agree well with RIA derived literature values. Bland-Altman analysis shows a
concentration-dependent positive bias of the LC/MS-MS assay versus an RIA, with a mean
bias of +45.06 pg/mL. Both assays produced similar pharmacokinetic profiles, both of which
were feasible considering the nature of the study. Conclusions: Our method is the first peer
reviewed LC-MS/MS method for the quantitation of endogenous levels of glucagon, and
offers a viable alternative to RIA based approaches.
Introduction
Glucagon is a 29 amino acid peptide which is one of multiple hormones that modulates
glucose production or utilisation to regulate blood glucose levels. It is also a biomarker for
pathologies such as diabetes, pancreatic cancer or certain neuroendocrine tumours [1]. It is
known to be degraded by peptidases such as dipeptidyl peptidase IV [2][3] and
consequently blood samples are typically collected in tubes containing protease inhibitors.
1
2
3
4
5
6
7
8
9
10
11
12
13
14
15
16
17
18
19
20
21
22
23
24
25
26
27
28
29
30
31
Endogenous glucagon levels in healthy patients are reported between 25-80 pg/mL, which
may be raised by about 10 pg/mL in pancreatic cancer patients, and can reach up to 160
pg/mL in diabetic patients [1]. Following treatments using glucagon infusion levels can reach
~750 pg/mL. Glucagon concentrations are routinely measured using radioimmunoassay
(RIA) based approaches, however these assays can be time consuming to perform (up to 3
days) and the kits have limited lifetimes (e.g. 2 months). In addition they can suffer from poor
precision and accuracy, as there is potential for cross reactivity with similar compounds or
inactive degradation fragments leading to inaccurate quantitation [4][5][6]. For example,
whilst a comparison between two glucagon immunoassays resulted in a high correlation
(R=0.97), the concentrations between individual samples differed by 2-4 fold [7]. The
radioactive nature of RIAs also necessitates additional health and safety precautions during
set-up, and specialised disposal of radioisotopes.
A LC-MS/MS assay would have the potential to circumvent such problems [8], and may offer
additional benefits such as a reduced sample volume and a higher throughout. However,
published LC-MS/MS methods [9][10] are not sensitive enough to detect endogenous
glucagon levels. As described in a recent review paper [11] the lowest reported LLOQ in the
peer reviewed literature is 250 pg/mL [10], although assays of 100 pg/mL [12] and 10 pg/mL
[13] have been described at recent conferences.
Furthermore, as glucagon is produced endogenously, this presents additional experimental
challenges as an authentic analyte free matrix cannot be obtained to construct calibration
standards. Either a standard addition, surrogate analyte, or a surrogate matrix approach
must therefore be used [14][15].
In the standard addition based approach, analyte is spiked on top of the authentic matrix to
create a calibration line, which is extrapolated to measure concentrations below the matrix’s
endogenous value. However the USA FDA Guidance for Bioanalytical Method Validation
[16] actively discourages the extrapolation of calibration curves beyond their range. The
surrogate analyte based approach uses an analogue to the analyte in place of the analyte
itself in calibration samples. As this will have a Selected Reaction Monitoring (SRM)
transition unique from the authentic analyte these can be prepared in authentic biological
matrix [14] . However, this approach requires the relationship between the authentic and
surrogate analyte to be thoroughly investigated, the approach is not commonly used, and is
not considered in the FDA [16] or EMA guidelines [17]. Alternatively, in the surrogate matrix
approach, calibration lines are constructed by spiking analyte into a surrogate matrix. QCs
can be prepared in actual sample matrix, and the accuracy calculated to demonstrate the
absence of a matrix effect. Surrogate matrices may be the authentic matrix stripped of
Page 2 of 29
32
33
34
35
36
37
38
39
40
41
42
43
44
45
46
47
48
49
50
51
52
53
54
55
56
57
58
59
60
61
62
63
64
65
66
analyte (e.g. by charcoal [15] or immuno-afffinity methods [18]) or an alternative matrix (e.g.
protein buffers, dialysed serum [19]). Although not ideal, the EMA Guideline on bioanalytical
method validation [17] concedes that such an approach may be necessary for endogenous
analyte quantitation, and therefore this is the approach we adopted.
This article outlines the first peer reviewed high throughput UHPLC-MS/MS (SRM) based
approach capable of quantifying endogenous levels of glucagon from human plasma. The
high throughput nature of the assay is due to its ability to relatively quickly analyse large
numbers of samples. This is enabled by an extraction procedure that is relatively quick,
simple, and cheap in comparison to many immunochemistry based approaches [20], and
which can analyse large number of samples (60) within an analytical batch. In addition,
UHPLC is used to minimise sample run times [21].A calibration range of 25–1000 pg/mL is
qualified, making the assay suitable for measuring both endogenous levels of glucagon and
elevated levels following treatments. Consequently the assay can be used for both
biomarker (PD, Pharacodymaic) and Pharmacokinetic (PK) analysis. However, the
calibration range could be easily truncated if only endogenous level analysis (PD) is
required. In addition we present the first comparison of glucagon concentrations determined
by an LC-MS/MS assay and a traditional RIA method using a large number of clinical
samples derived from a physiological study of glucagon’s actions in the body (n=88).
The assay‘s performance has been evaluated using experiments described in the latest
EMA [17] and FDA [16] guidance and in accordance to the principles of GCP [22].
Key Terms
Radioimmunoassay (RIA) - A highly sensitive technique used to measure concentrations of
antigens (e.g. peptides) by use of antibodies. Pre-bound radioactively labelled antigens are
displaced by non-radioactive antigens from a sample. Monitoring the change in radioactivity
allows quantitation.
UHPLC-MS/MS (SRM) – An analytical methodology that combines the use of ultra-high performance liquid chromatographic (UHPLC) separations with sensitive mass spectrometer selected reaction monitoring (SRM). Traditionally used for small molecule quantitation, but increasingly used for the quantitation of biological molecules (e.g. peptides).
Page 3 of 29
67
68
69
70
7172
73
74
75
76
77
78
79
80
81
82
83
84
85
86
87
88
89
90
91
92
93949596
Experimental
Chemicals and materials
Certified human glucagon (HSQGTFTSDYSKYLDSRRAQDFVQWLMNT) was obtained from
EDQM (Strasbourg, France) and the analog internal standard (IS) (des-thr7-glucagon)
(HSQGTFSDYS KYLDSRRAQDFVQWLMNT) from Bachem (Bubendorf, Switzerland). This
internal standard has given suitable performance in LC-MS/MS glucagon assays [12] [13],
and it avoids the expense of synthesising a heavy labelled internal standard. Water was
produced by a Triple Red water purifier (Buckinghamshire, U.K.). BD glass collection tubes
(5 mL) containing K3 EDTA anticoagulant and 250 Kallikrein Inhibitor Units (KIU) of Aprotinin
were obtained from BD (Oxford, UK). Following collection, tubes were placed on ice, then
centrifuged at 2300 x g for 10 minutes to obtain plasma, which was stored at -80C when not
in use. All chemicals and solvents were HPLC or analytical reagent grade and purchased
from commercial vendors.
Instrumentation: LC-MS/MS
The LC-MS/MS system consisted of a Waters Acquity UPLC system (Waters Corporation,
Massachusetts, USA) coupled to an AB SCIEX 5500 QTRAP (Applied Biosystems / MDS
SCIEX, Ontario, Canada) with an electrospray ion source. Data acquisition and processing
were performed using Analyst 1.5.2 (Applied Biosystems/ MDS SCIEX). The majority of the
chromatograms were integrated using fully automated settings. A minority had their
integration settings (peak selection, peak splitting factor, noise percentage) altered to ensure
appropriate and consistent integration. No samples were integrated using manual integration
mode. Glucagon was separated on a Waters UPLC BEH C18 1.7 µm (2.1 x 100 mm)
column maintained at 60 C. The mobile phase consisted of (A) 0.2% formic acid (FA) in
acetonitrile (MeCN) and (B) 0.2% FA (aq). The gradient for separation was 22–32% A over 2
minutes. The column was then cleaned with 95% A for approximately 1 minute then 22% A
for approximately 4 minutes. The flow rate was 0.8 mL/min and the total run time 7.1
minutes.
The mass spectrometer was operated in positive ion mode with an electrospray voltage of
5500 V, an entrance potential of 10 V, and a declustering potential of 70 V. The source
temperature was 600C, the curtain gas 40 Psi, and the desolvation gases, GS1 and GS2,
were set at 60 psi and 40 psi respectively. Quantitation was performed using the selected
reaction monitoring (SRM) transitions 697.5693.8 and 677.2673.8 for glucagon and the
internal standard respectively. The N2 collision gas was set to medium and both transitions
Page 4 of 29
97
98
99
100
101
102
103
104
105
106
107
108
109
110
111
112
113
114
115
116
117
118
119
120
121
122
123
124
125
126
127
128
129
used collision energies of 15 V and collision exit cell potentials of 13 V. The Q1 and Q3
quadruples were both operated at unit resolution.
Preparation of stock, standards and QC MED and HIGH plasma samples
1 mg/mL stock solutions of glucagon and glucagon internal standard were prepared in
borosilicate vials using surrogate matrix [Methanol (MeOH): H2O: Formic acid (FA): Bovine
serum albumin (BSA), (20:80:0.1:0.1, v/v/v/w)]. Glucagon working solutions were prepared
by dilution with this solvent to create nine calibration standard spiking solutions (125, 225,
375, 500, 1000, 2000, 3000, 4500, 5000 pg/mL), and four quality control spiking solutions
(125, 250, 10000, 75000 pg/mL). Additional calibration standard and QC spiking solutions at
75 and 50 pg/mL were also prepared for the assessment of assay performance at the 10
and 15 pg/mL levels. Internal standard working solution (ISWS) was similarly prepared at 20
ng/mL. The stock and working solutions were prepared to a volume of 10 mL and were
stored at -20 C when not in use.QC MED and QC HIGH plasma samples were prepared by
diluting the appropriate spiking solution 100 fold with plasma to create samples at 100 and
750 pg/mL respectively. These were either used immediately, or stored at -80 C prior to
use.
Extraction method development & surrogate matrix quantitation
Additional details of the extraction method development experiments described are provided
in the supplementary information. In summary:
Protein precipitation optimisation The following precipitation solvents were investigated;
Acetonitrile (MeCN), MeCN:H2O (50:50,v/v), and MeCN:H2O (75:25, v/v). Each solvent was
investigated with and without 0.1% formic acid. In addition MeCN: H2O: NH3 (75:25:0.1,
v/v/v) was investigated.
Solid phase extraction optimisation Extraction efficiencies of the MAX, MCX, and WCX
phases from a 96 well Oasis sorbent selection plate (10 mg) (Waters Corporation) and from
a size exclusion hydrophobic (SEH) Bond Elut Plexa 96 round-well (30 mg) plate (Agilent
Technologies, California, USA) were evaluated. The Oasis extraction used generic
conditions for peptide analysis based on those provided by the manufacturer, whilst we used
our in house generic conditions for the Plexa evaluation.
Surrogate matrix quantitation- The calibration standard spiking solutions described above
were diluted 5 fold with surrogate matrix. 400 µL aliquots were then extracted according to
the procedure below. The matrices investigated were H2O, MeOH: H2O:FA:BSA
(20:80:0.1:0.1, v/v/v/w), 6% BSA (aq) and 6% rat plasma (aq).
Page 5 of 29
130
131
132
133
134
135
136
137
138
139
140
141
142
143
144
145
146
147
148
149
150
151
152
153
154
155
156
157
158
159
160
161
162
Extraction method for validation
Plasma sample (aprotinin stabilised, K3 EDTA) (400 µL) was placed into a 5 mL
polypropylene tube and 20 µL of ISWS was added to all non-blank samples. The samples
were briefly vortex mixed, precipitated using 3.2 mL of MeCN:H2O:NH3 (72:25:0.1,v/v/v),
vortex mixed again, and then centrifuged for 10 minutes at 2300 x g. The supernatant was
transferred to a new tube and evaporated to dryness overnight under vacuum. Samples
were reconstituted in 800 µL 2% NH3 (aq) and then vortex mixed. A Bond Elut Plexa 96
round-well solid phase extraction (SPE) plate (30 mg) was conditioned using 1 mL MeOH,
then equilibrated with 1 mL H20. The samples were loaded, washed with 1 mL 5% MeOH
(aq), eluted with 2 x 225 µL MeCN:H2O:FA (75:25:0.1, v/v/v), and then evaporated under
nitrogen at 40C, before being reconstituted in
200 µL 0.2% FA (aq).
Calibration standards, QC LLOQs and QC LOWs were then prepared freshly for each batch
by spiking 80 µL of the appropriate spiking solution into the plate, along with 20 µL of ISWS
and 100 µL surrogate matrix. Taking into account the 2-fold concentration experienced by
plasma samples (400 µL of plasma sample is reconstituted into 200 µL of solvent) this gives
final calibration levels of 25, 45, 75, 100, 200, 400, 600, 900, and 1000 pg/mL, and final QC
levels of 25 and 50 pg/mL. The plate was centrifuged for 10 minutes at 2300 x g, and 50 µL
of sample injected on to the LC-MS/MS system for analysis.
Validation Experiments
The validation experiments chosen were based on those described in the latest EMA
guidance [17]. Calibration standards were analysed in duplicate with each batch. Data was
imported into Watson LIMS 7.2 (Thermo Fisher Scientific Inc, Massachusetts, USA) and
linear regression with 1/x2 weighting was applied to the peak area ratios-concentration plot
for the construction of calibration lines. The precision and accuracy of the method was
determined by analysis of replicate (n=6) QC samples at four different concentrations (25,
50, 100, and 750 pg/mL), and was assessed within a batch (intra-batch, n = 6 replicates)
and between batches (inter-batch, 3 batches). The ability to dilute was assessed by diluting
an over range dilution sample (7500 pg/mL) 10-fold with blank plasma. Carryover effects
were evaluated by injection of blank samples immediately after injection of the highest point
in the calibration range.
Selectivity was assessed by qualitatively examining chromatograms from six independent
control matrix samples for the presence of potentially interfering peaks. It was not feasible to
monitor multiple charge states or SRM transitionsto further ensure selectivity as only the
Page 6 of 29
163
164
165
166
167
168
169
170
171
172
173
174
175
176
177
178
179
180
181
182
183
184
185
186
187
188
189
190
191
192
193
194
195
196
selected transition demonstrated sufficient sensitivity at the endogenous concentration .The
modification of analyte and internal standard responses to the presence of matrix was also
determined in such samples. These were extracted and post spiked at either the medium or
high level, and compared to the mean response from samples in surrogate matrix (minimum
n=6). The effect of haemolysed (3%) plasma and hyperlipidaemic plasma (~4 mmol/L of
triglycerides) upon on quantitation was investigated by preparing QCs in these matrices at
the medium and high level (n=6 replicates). Recovery of the analyte was evaluated by
comparing the analytical results for extracted analyte samples at the medium and high level
with unextracted analyte samples that represent 100% recovery.
The stability of the glucagon in aprotinin stabilised human plasma was evaluated at the
medium and high concentrations in replicate (n=6). Stability was assessed after
6 hr 20 min on ice (4 C), after storage for 11 and 75 days at -20°C, and for 7, 11, 51, and 64
days at -80°C. Similarly stability was assessed after 4 freeze-thaw cycles from -20 C to 4 C
and also 4 freeze cycles from -80 C to 4 C. Stability was similarly assessed in whole blood
following storage on ice for 1 hour. The ability to re-inject sample extracts at medium and
high concentrations was assessed after storage at +4°C for 6 days. The stability of the stock
solution was assessed after storage at -20C for 66 days and that of LLOQ and ULOQ
working solutions after 163 days at -20C.
All results are quoted from batches where the standards and QCs passed our prospectively
defined acceptance criteria, which were based on the EMA and FDA guidelines. These
required that at least 75% of standards in each batch had back calculated accuracy within
15% (20% at the LLOQ) of the nominal concentration, with standards outside these criteria
excluded from the regression. QCs in precision and accuracy batches needed to have mean
intra-batch accuracy within 20% of the nominal concentration, and intra-batch precision that
did not exceed 20%. In other batches at least 2/3 of the individual QCs had accuracy within
20% of the nominal concentration, with at least one QC passing criteria at each level.
Although the guidelines suggest a 15% criteria (20% at the LLOQ) should be applied to QC
performance, they state it can be widened prospectively in special cases. We felt it was
justified to raise the QC acceptance criteria to 20% (CV and RE) due to the surrogate matrix
nature of the assay. The 20% (RE) acceptance criteria was also applied to plasma, blood
and extract stability experiments, as well as to the assessment of the matrix effect in
different individuals (matrix factor ratio) and of the effect of haemolysed or hyperlipidaemic
plasma.
Page 7 of 29
197
198
199
200
201
202
203
204
205
206
207
208
209
210
211
212
213
214
215
216
217
218
219
220
221
222
223
224
225
226
227
228
229
230
231
232
Collection of samples from volunteers to assess endogenous glucagon concentrations
Plasma was collected from 12 healthy males and 12 healthy females using glass collection
tubes containing K3 EDTA and aprotinin, as described above. Glucagon levels were
determined using the qualified LC-MS/MS method. Plasma was collected at the start of the
working day and volunteers were not asked to change their usual eating regime
Collection of physiological study samples
Physiological study samples (n=117) were collected by Imperial College London. The
samples originated from 7 different individuals who were each infused with a glucagon
solution at either 16 or 20 pmol/kg/min for 12 hours subcutaneously. Blood samples at
various time points were collected in 5 mL lithium heparin collection tubes containing 2000
KIU of Aprotinin, spun down in a cold centrifuge within 5 to 10 mins of collection, and then
stored at -20 C.
Analysis of physiological study samples
A selection of the physiological study samples (n=100) were analysed by LGC using the LC-
MS/MS method described above. Additional QCs prepared in aprotinin stabilised plasma
with lithium heparin anticoagulant were analysed to ensure assay performance in the sample
matrix. 38 of the study samples were analysed over the calibration range 25–1000 pg/mL,
whilst the remainder were analysed over the calibration range 10–1000 pg/mL. For these
samples additional calibration points and QCs were included at the 10 and 15 pg/mL levels
to evaluate assay performance. Samples (n=105) were also analysed by Imperial College
using their established radioimmunoassay method over the calibration range 5 -1000 pg/mL,
which is directed against the C-terminal region of glucagon [23][24]. Samples were analysed
upon their first freeze-thaw.
Results and discussion
Method development
Analysis of endogenous levels of glucagon by LC-MS/MS poses a significant technical
challenge. Not only are the low endogenous concentrations difficult to measure, an
endogenous analyte quantitation strategy must be used, and stability issues must be
addressed.
Page 8 of 29
233
234
235
236
237
238
239
240
241
242
243
244
245
246
247
248
249
250
251
252
253
254
255
256
257
258
259
260
261
262
263
Extensive assay optimisation was therefore performed to obtain the low 25 pg/mL LLOQ. A
QTRAP mass spectrometer was used in SRM mode, and parameters were optimised.
UHPLC was chosen for chromatographic separation because it results in greater efficiencies
[25] and/or shorter runtimes [26] than the HPLC commonly used for such separations. The
greater efficiency can lead to lower matrix effects due to improved separation from matrix
suppressants [27] and to higher sensitivities due to sharper peak shapes [21]. The [M+5H+] 5+ ion was found to give the highest intensity during MS method development (Figure 1),
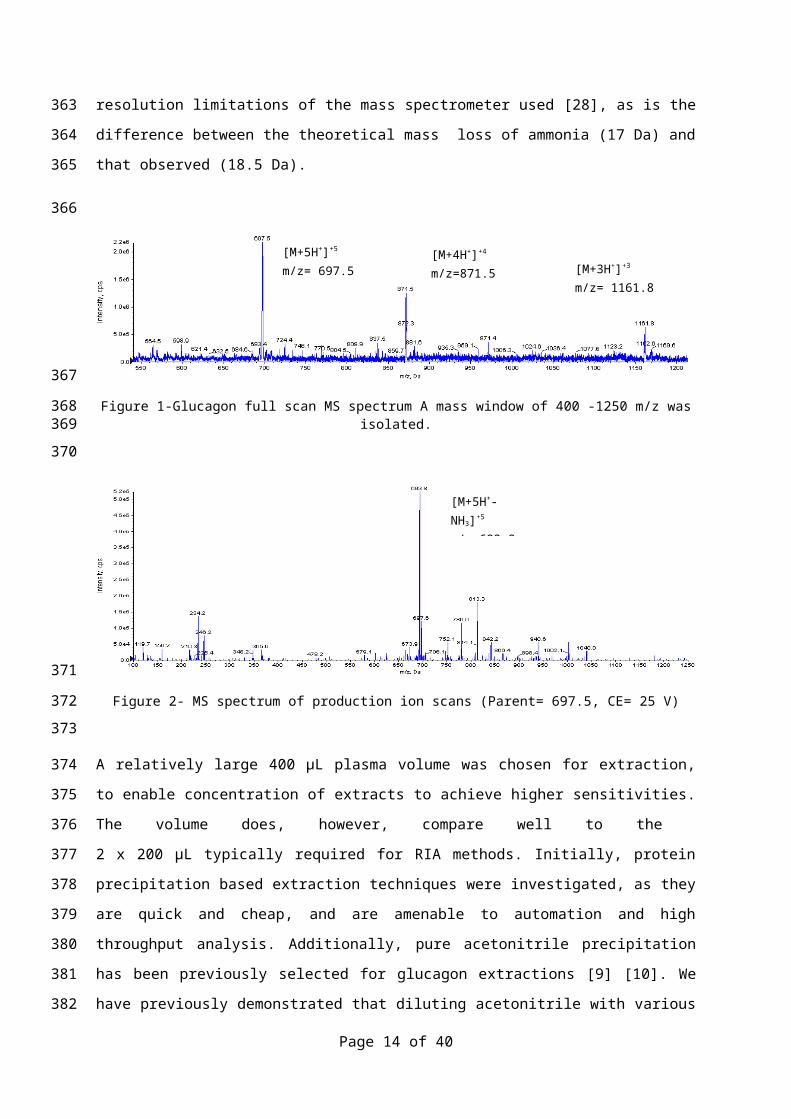
although other studies have found the the [M+4H+]+4 to be optimal [10][9] MS2 experiments
showed that showed that the ionic species generated by ESI of glucagon were able to
absorb substantial collision energy without undergoing major fragmentations, as
demonstrated previously [9] (Figure 2). As also reported [12][11] an SRM transition
corresponding to the loss of ammonia ([M+5H+]+5/[M+5H+-NH3]+5 was found to be optimal. .
Although this is not a particularly specific transition, the intensity was significantly greater
than other transitions and was therefore chosen; selectivity was fully investigated during the
validation. Resolution settings for Q1 and Q3 were optimal at unit-unit, rather than high-high
as reported by others [10]. The optimal ion pairs of the transitions were 697.5/693.8, which
corresponds to a 18.5 Da loss. The small difference between our optimal pair, and that
previously reported (697.6/694.2) [12][11] is attributed to the resolution limitations of the
mass spectrometer used [28], as is the difference between the theoretical mass loss of
ammonia (17 Da) and that observed (18.5 Da).
Figure 1-Glucagon full scan MS spectrum A mass window of 400 -1250 m/z was isolated.
Page 9 of 29
[M+5H+]+5
m/z= 697.5[M+4H+]+4
m/z=871.5 [M+3H+]+3
m/z= 1161.8
264
265
266
267
268
269
270
271
272
273
274
275
276
277
278
279
280
281
282
283
284
285
286
287
Figure 2- MS spectrum of production ion scans (Parent= 697.5, CE= 25 V)
A relatively large 400 µL plasma volume was chosen for extraction, to enable concentration
of extracts to achieve higher sensitivities. The volume does, however, compare well to the
2 x 200 µL typically required for RIA methods. Initially, protein precipitation based extraction
techniques were investigated, as they are quick and cheap, and are amenable to automation
and high throughput analysis. Additionally, pure acetonitrile precipitation has been previously
selected for glucagon extractions [9] [10]. We have previously demonstrated that diluting
acetonitrile with various proportions of water can lead to more specific extractions [29], as
can the addition of acids or bases to due to the differences between the isoelectric points
(pI) of the proteins or peptides of interest and the background proteins [30]. Precipitation
solvents containing various proportions of acetonitrile, water, acid and base were
investigated, with MeCN:H2O:NH3 (75:25:0.1,v/v/v) giving the best response. However, in all
cases background noise and interferences were relatively high, as was matrix suppression.
It was therefore decided to investigate solid phase extraction (SPE) based approaches, as
these should lead to cleaner samples with reduced background noise and interferences.
These studies are described in the supplementary information.
Combining protein precipitation with size exclusion hydrophobic (SEH) SPE was found to
reduce the on column matrix effects, whilst providing adequate recovery. To our knowledge
this is the first time protein precipitation has been combined with SEH SPE for quantitative
peptide analysis, although protein precipitation has been combined with other SPE phases
for this purpose[31]. Due to the satisfactory performance of this extraction methodology,
alternatives such as immunoaffinity enrichment were not investigated [32].
Various UHPLC gradients were investigated to further reduce matrix build-up on the column
and it was found that a 4 minute flush at the starting conditions gave the best performance.
Page 10 of 29
[M+5H+-NH3]+5
m/z=693.8
288
289
290
291
292
293
294
295
296
297
298
299
300
301
302
303
304
305
306
307
308
309
310
311
312
313
314
This gradient combined with the 2D extraction methodology significantly increased the
robustness of the assay.
Glucagon is known to be degraded by the blood enzymes and consequently sample
stabilisation is required [2] . The enzyme inhibitor aprotinin was used to reduce degradation
and samples were extracted on ice. As there have been reports of enzyme inhibitors
interfering with peptide quantitation [33] assay performance was closely monitored during
the validation for any such issues.
Surrogate matrix quantitation
Several mixtures were screened for their suitability as surrogate matrices. A dilute buffer
matrix was evaluated, as such matrices have been shown to be suitable for some assays.
[34] [18]. A buffer solution containing a relatively high percentage of BSA was also evaluated
to minimise any non-specific analyte binding that may occur. In addition a diluted rat plasma
matrix was chosen to investigate whether biological matricies improved assay performance.
The dilute buffer matrix, Water and MeOH: H2O: FA: BSA (20:80:0.1:0.1, v/v/v/w), resulted
in low signals following extraction, which is attributed to non-specific binding of glucagon to
plastic consumables used during the extraction procedure, as has been described previously
[9]. The 6% BSA (aq) matrix, selected to minimise non-specific binding in solvent led to a
very high background noise, whilst the 6% rat plasma (aq) led to poor calibration line
accuracy against prepared concentrations. It was therefore decided to use MeOH: H2O: FA:
BSA (20:80:0.1:0.1, v/v/v/w) as the surrogate matrix, but not to extract samples prepared in
this, in order to prevent large losses by nonspecific binding. Whilst plasma samples require
extraction, their high protein content prevents binding and the use of an internal standard
was expected to take into account recovery differences between the surrogate matrix
calibrants (which will necessarily have recovery of 100% for the analyte and IS) and the
extracted plasma samples. The internal standard was also expected to take in to account the
differences in matrix effect between the two matrices, as well as any small losses that
occurred due to non-specific binding that occurred in the injection plate. Whilst the buffer
solution selected as the surrogate matrix is of quite a different nature to the plasma samples,
assays for small [34] and large molecules [18] have been successfully validated using such
an approach, and the validation experiments described later in this manuscript fully assess
the assay’s performance. It was decided to proceed with this approach rather than
investigate alternative matrices such as charcoal stripped plasma. It has been suggested
that when a surrogate matrix approach is used that aliquots of the authentic matrix
containing the endogenous analyte should be used as QC MED samples and QC HIGH
Page 11 of 29
315
316
317
318
319
320
321
322
323
324
325
326
327
328
329
330
331
332
333
334
335
336
337
338
339
340
341
342
343
344
345
346
347
348
samples should be prepared by spiking analyte in addition to this endogenous level [34].QC
LOW samples are then made by diluting authentic matrix with surrogate matrix, and
QC LLOQ samples prepared in pure surrogate matrix. Unfortunately this strategy cannot be
used for glucagon quantitation due to its relatively low endogenous levels (LLOQ to 3x
LLOQ). It was therefore decided to construct QC LOW using surrogate matrix, and QC MED
and QC HIGH samples were prepared by spiking analyte on top of the endogenous level in
authentic matrix. Due to the low endogenous levels it was decided to limit the LOW level to 2
x LLOQ (rather than the 3x LLOQ typically used [17].
Human plasma (K3 EDTA) from a commercial supplier was analysed using the assay to
determine its suitability as an authentic matrix. As shown in Supplemental Figure 4 such
plasma has a significantly raised background compared to plasma collected from volunteers
in house. This may be a result of the lack of stabiliser upon collection, the age of the plasma
and/or storage conditions. The raised background makes it unsuitable for the construction of
QC samples, and therefore it was decided to use plasma collected in house as the integrity
of these samples could be ensured. Similarly, sample collection and storage regimes for
any clinical samples should be carefully controlled to ensure their integrity.
Validation
The precision and accuracy of the method was determined by analysis of replicate (n=6) QC
samples at four different concentrations (25, 50, 100 and 750 pg/mL). Precision and
accuracy was assessed within a batch (intra-batch, n = 6 replicates) and between batches
(inter-batch, 3 batches). The intra- and inter-assay precision did not exceed 20%, nor did the
intra- and inter-assay accuracy demonstrating the method was performing robustly (Table 1).
No carryover after high calibration standards was observed and no potentially interfering
peaks were observed during the selectivity assessment. The 10-fold dilution of an over
range QC sample (7500 pg/mL) with control plasma was used to demonstrate the absence
of dilution effects (Supplemental Table 1).
Page 12 of 29
349
350
351
352
353
354
355
356
357
358
359
360
361
362
363
364
365
366
367
368
369
370
371
372
373
374
375
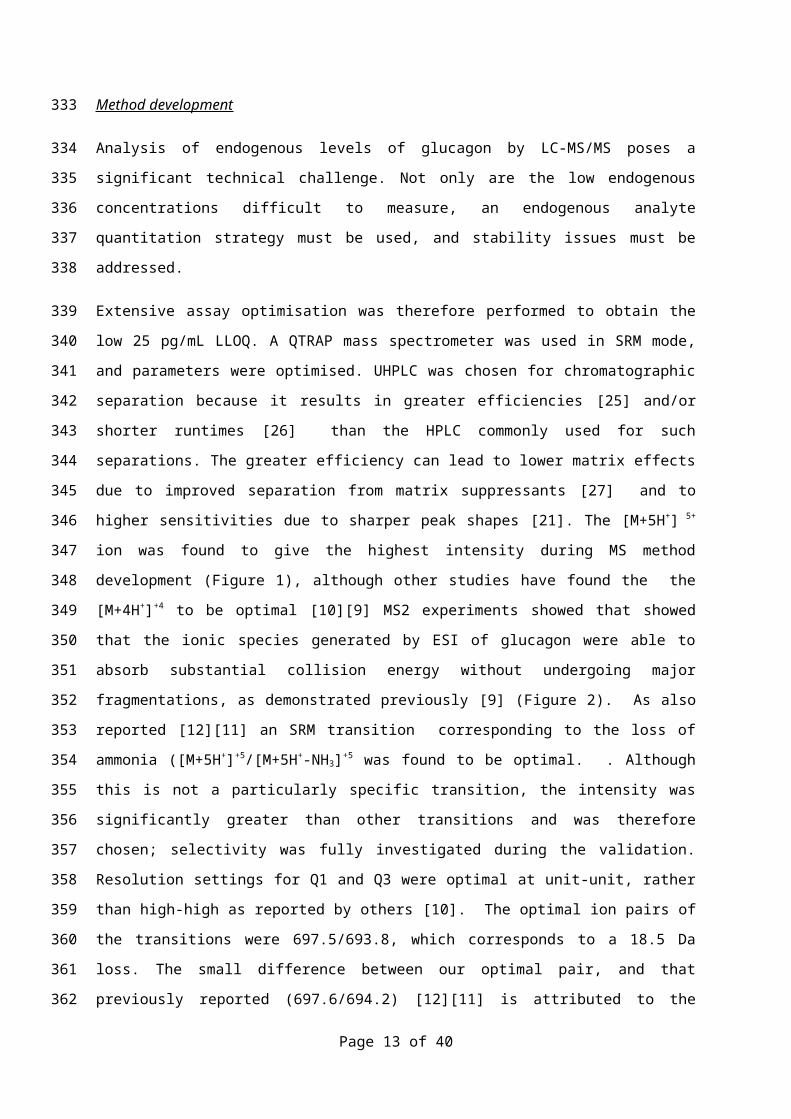
Table 1- Intra and inter-assay precision and accuracy of the LC-MS/MS method for the quantitation of glucagon in human plasma.
P &A Numbe
r
QC LLOQ (25.0 pg/mL)
QC LOW(50.0 pg/mL)
QC MED(100 pg/mL)
QC HIGH(750 pg/mL)
1 Intrarun Mean 28.0 51.4 107 815Intrarun SD 1.84 2.16 9.05 29.0
Intrarun %CV 6.6 4.2 8.5 3.6Intrarun %RE 12.0 2.8 7.0 8.7
n 6 6 6 62 Intrarun Mean 28.1 52.9 105 668
Intrarun SD 3.64 3.74 5.14 31.3Intrarun %CV 13.0 7.1 4.9 4.7Intrarun %RE 12.4 5.8 5.0 -10.9
n 6 6 6 63 Intrarun Mean 29.0 50.9 97.8 670
Intrarun SD 2.33 1.79 3.16 24.9Intrarun %CV 8.0 3.5 3.2 3.7Intrarun %RE 16.0 1.8 -2.2 -10.7
n 6 6 6 6Overall Inter-run mean 28.4 51.7 103 718
Inter-run SD 2.59 2.67 7.09 75.8Inter-run %CV 9.1 5.2 6.9 10.6Inter-run %RE 13.6 3.4 3.0 -4.3
n 18 18 18 18
SD Standard deviation CV Coefficient of variationRE Relative error n Number of replicates
The analogue Internal standard (IS) compensated for differences in suppression observed
by the analyte in different matrices, with mean matrix factor (MF) ratios being 1.08 and 1.05
at the medium and high level; a perfect correction would have a ratio of 1 (Supplemental
Table 2).
Recovery was assessed across three different batches with a minimum of 3 replicates at
each level. In order to investigate whether the nature of the matrix affected recovery it was
assessed from; samples where the analyte was spiked into control matrix then immediately
extracted, samples where the analyte was spiked into 3 freshly acquired matrix pools then
immediately extracted, and finally from samples where the analyte was spiked into matrix
then stored for a week at -80 C before extraction (Supplemental Table 3). No significant
difference between these experiments was observed, which gave an average analyte
recovery of 51.2%
Page 13 of 29
376377
378379380
381382
383
384
385
386
387
388
389
390
391
392
393
394
Page 14 of 29
395
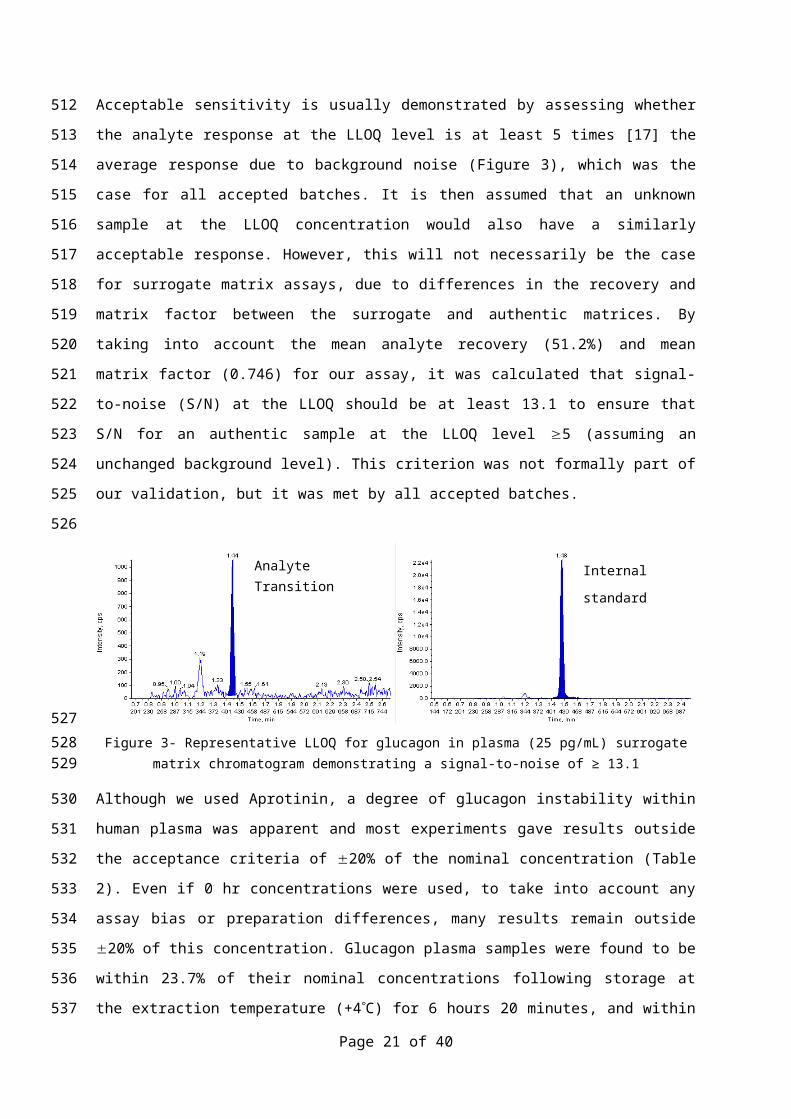
Acceptable sensitivity is usually demonstrated by assessing whether the analyte response at
the LLOQ level is at least 5 times [17] the average response due to background noise
(Figure 3), which was the case for all accepted batches. It is then assumed that an unknown
sample at the LLOQ concentration would also have a similarly acceptable response.
However, this will not necessarily be the case for surrogate matrix assays, due to differences
in the recovery and matrix factor between the surrogate and authentic matrices. By taking
into account the mean analyte recovery (51.2%) and mean matrix factor (0.746) for our
assay, it was calculated that signal-to-noise (S/N) at the LLOQ should be at least 13.1 to
ensure that S/N for an authentic sample at the LLOQ level 5 (assuming an unchanged
background level). This criterion was not formally part of our validation, but it was met by all
accepted batches.
Figure 3- Representative LLOQ for glucagon in plasma (25 pg/mL) surrogate matrix chromatogram demonstrating a signal-to-noise of ≥ 13.1
Although we used Aprotinin, a degree of glucagon instability within human plasma was
apparent and most experiments gave results outside the acceptance criteria of 20% of the
nominal concentration (Table 2). Even if 0 hr concentrations were used, to take into account
any assay bias or preparation differences, many results remain outside 20% of this
concentration. Glucagon plasma samples were found to be within 23.7% of their nominal
concentrations following storage at the extraction temperature (+4C) for 6 hours 20 minutes,
and within 21.4% of their 0 hr concentration following storage for 75 days at -20C, or within
20.2% following storage for 51 days at -80C. Greater instability was observed following
multiple freeze-thaw cycles, and these should therefore be minimised during analysis. The
accuracy of the method is therefore limited by the sub-optimal sample stabilisation
procedure. The effect of such pre-analytical parameters has been described by others [35] ,
and future assay development should include an evaluation of these. For example, stability
would likely be improved if specific DPP-IV inhibitors were used [36], rather than the broad
serine protease inhibitor Aprotinin.
Page 15 of 29
Analyte Transition
S/N= 19
Internal standard
transition
396
397
398
399
400
401
402
403
404
405
406
407
408409410
411
412
413
414
415
416
417
418
419
420
421
422
423
424
425
As stability in Human K3 EDTA plasma with Aprotinin stabilisation did not pass our
acceptance criteria, the method is described as qualified, rather than validated. However, the
instability was moderate, and the data generated is likely to “fit for purpose” for many
applications.
Key Terms
Validated assay –An assay where experiments based on those described in the USA FDA
Guidance for Industry: Bioanalytical Method Validation (2001) and those described in the
EMA Guideline on Bioanalytical Method Validation (2012) meet their prospectively defined
acceptance criteria.
Qualified assay – An assay where not all of the validation experiments described in the
guidance have been assessed or have passed their prospectively defined acceptance
criteria. However the assay may still be considered “fit-for-purpose”.
Fit- for-purpose assay- An assay where its performance characteristics have been assessed
and are reliable for the intended application. For example, a biomarker assay which is used
to assess a sole pharmacodynamic end point requires better performance characteristics
than an assay used as part of a panel of measurements.
Page 16 of 29
426
427
428
429
430
431
432
433
434
435
436
437
438
439
440
441
442
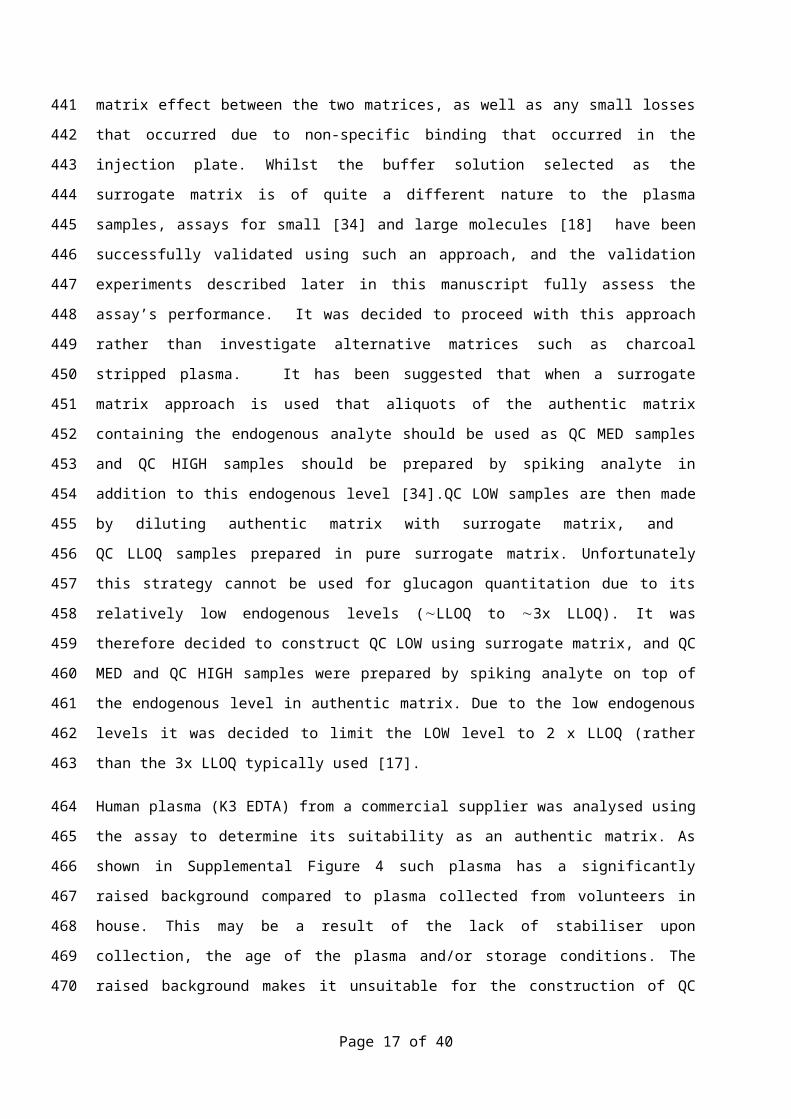
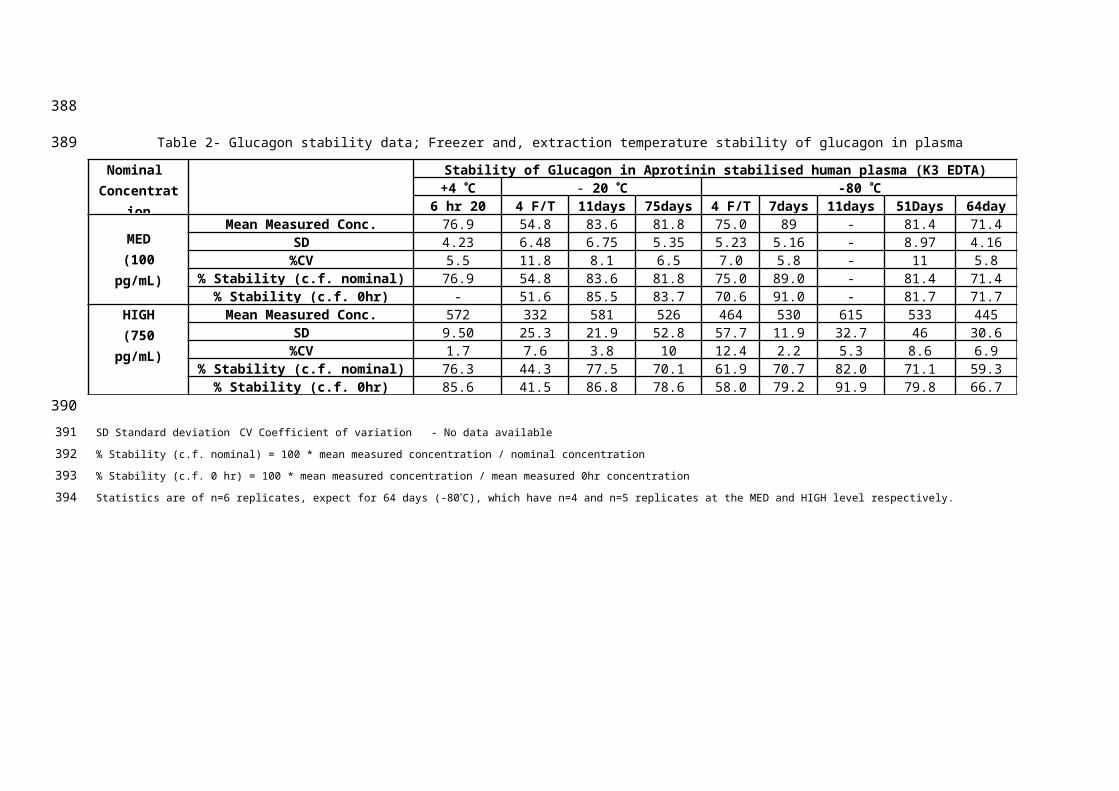
Table 2- Glucagon stability data; Freezer and, extraction temperature stability of glucagon in plasma
Nominal Concentratio
n
Stability of Glucagon in Aprotinin stabilised human plasma (K3 EDTA)+4 C - 20 C -80 C
6 hr 20 min 4 F/T 11days 75days 4 F/T 7days 11days 51Days 64days MED
(100 pg/mL)Mean Measured Conc. (pg/mL) 76.9 54.8 83.6 81.8 75.0 89 - 81.4 71.4
SD 4.23 6.48 6.75 5.35 5.23 5.16 - 8.97 4.16%CV 5.5 11.8 8.1 6.5 7.0 5.8 - 11 5.8
% Stability (c.f. nominal) 76.9 54.8 83.6 81.8 75.0 89.0 - 81.4 71.4% Stability (c.f. 0hr) - 51.6 85.5 83.7 70.6 91.0 - 81.7 71.7
HIGH(750 pg/mL)
Mean Measured Conc. (pg/mL) 572 332 581 526 464 530 615 533 445SD 9.50 25.3 21.9 52.8 57.7 11.9 32.7 46 30.6
%CV 1.7 7.6 3.8 10 12.4 2.2 5.3 8.6 6.9% Stability (c.f. nominal) 76.3 44.3 77.5 70.1 61.9 70.7 82.0 71.1 59.3
% Stability (c.f. 0hr) 85.6 41.5 86.8 78.6 58.0 79.2 91.9 79.8 66.7
SD Standard deviation CV Coefficient of variation - No data available
% Stability (c.f. nominal) = 100 * mean measured concentration / nominal concentration
% Stability (c.f. 0 hr) = 100 * mean measured concentration / mean measured 0hr concentration
Statistics are of n=6 replicates, expect for 64 days (-80C), which have n=4 and n=5 replicates at the MED and HIGH level respectively.
388
389
390391
392
393
394
The ability to re-inject extracts was demonstrated after storage at +4°C for 6 days
(Supplemental Table 4). The stability of stock and working solutions of glucagon, which were
stored at -20 C when not in use, was demonstrated for 67 and 163 days respectively
(Supplemental Table 5).
The stability of glucagon in Aprotinin stabilised whole blood following storage on ice for 1
hour was found to be within acceptance criteria (Supplemental Table 6).
Haemolysed samples (plasma spiked with 3% whole blood) contained a large neighbouring
peak, and did not pass acceptance criteria, demonstrating haemolysed samples cannot be
accurately quantified using this method (Supplemental Figure 5). The presence of
hyperlipidaemic plasma did not significantly affect the quantitation of glucagon
(Supplemental Table 7).
Using the qualified LC-MS/MS method to assess endogenous glucagon concentrations from volunteers
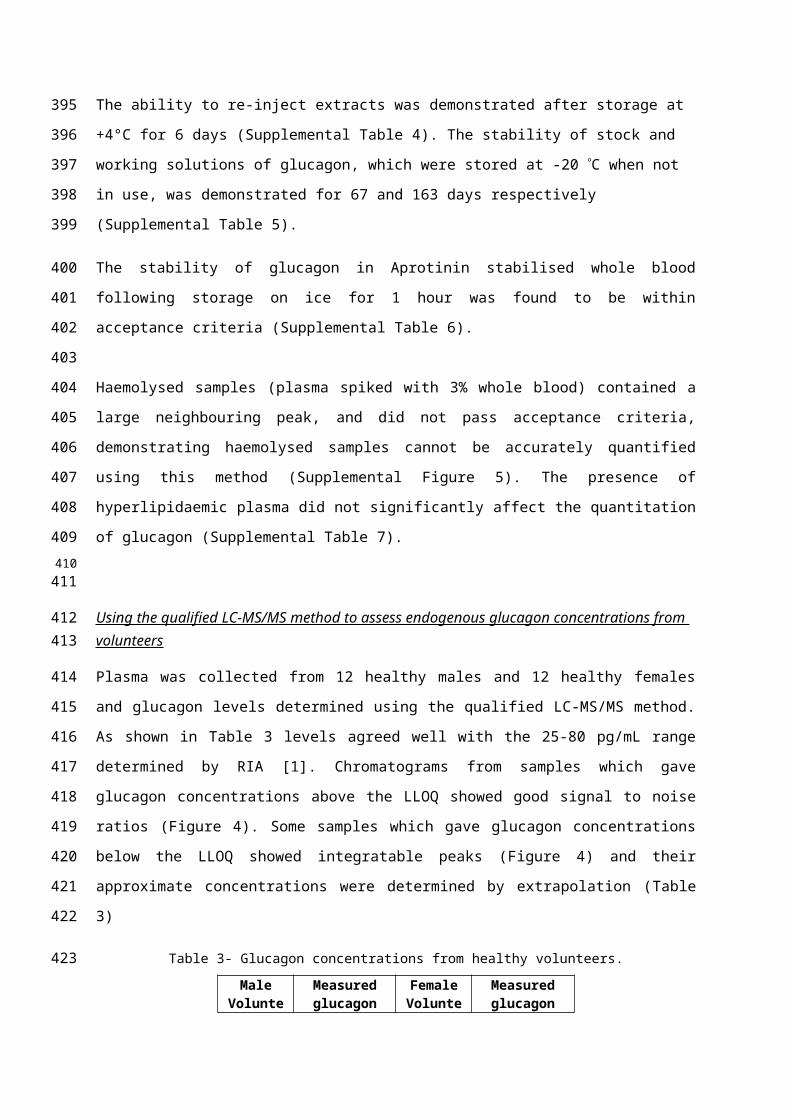
Plasma was collected from 12 healthy males and 12 healthy females and glucagon levels
determined using the qualified LC-MS/MS method. As shown in Table 3 levels agreed well
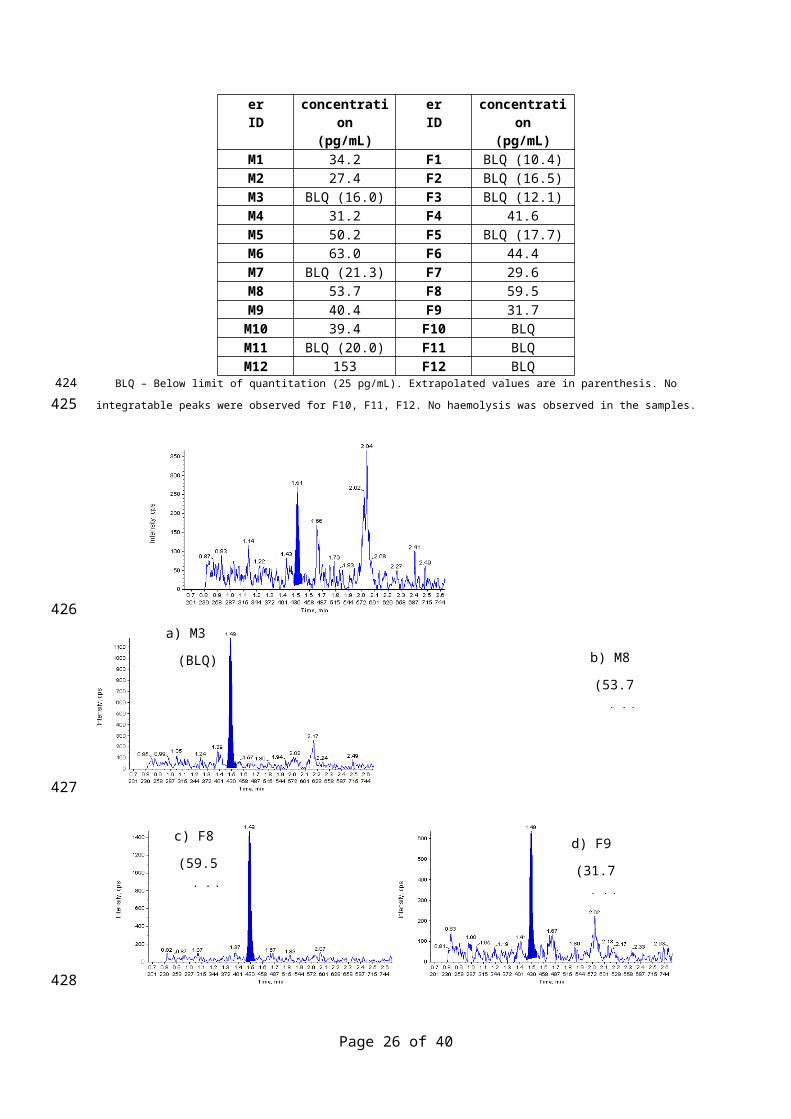
with the 25-80 pg/mL range determined by RIA [1]. Chromatograms from samples which
gave glucagon concentrations above the LLOQ showed good signal to noise ratios (Figure 4).
Some samples which gave glucagon concentrations below the LLOQ showed integratable
peaks (Figure 4) and their approximate concentrations were determined by extrapolation
(Table 3)
Table 3- Glucagon concentrations from healthy volunteers.
MaleVolunteer
ID
Measuredglucagon
concentration(pg/mL)
FemaleVolunteer
ID
Measuredglucagon
concentration(pg/mL)
M1 34.2 F1 BLQ (10.4)M2 27.4 F2 BLQ (16.5)M3 BLQ (16.0) F3 BLQ (12.1)M4 31.2 F4 41.6M5 50.2 F5 BLQ (17.7)M6 63.0 F6 44.4M7 BLQ (21.3) F7 29.6M8 53.7 F8 59.5M9 40.4 F9 31.7
M10 39.4 F10 BLQM11 BLQ (20.0) F11 BLQM12 153 F12 BLQ
BLQ – Below limit of quantitation (25 pg/mL). Extrapolated values are in parenthesis. No integratable peaks were observed for
F10, F11, F12. No haemolysis was observed in the samples.
395
396
397
398
399
400
401
402
403
404
405
406407
408
409410
411
412
413
414
415
416
417
418
419
420
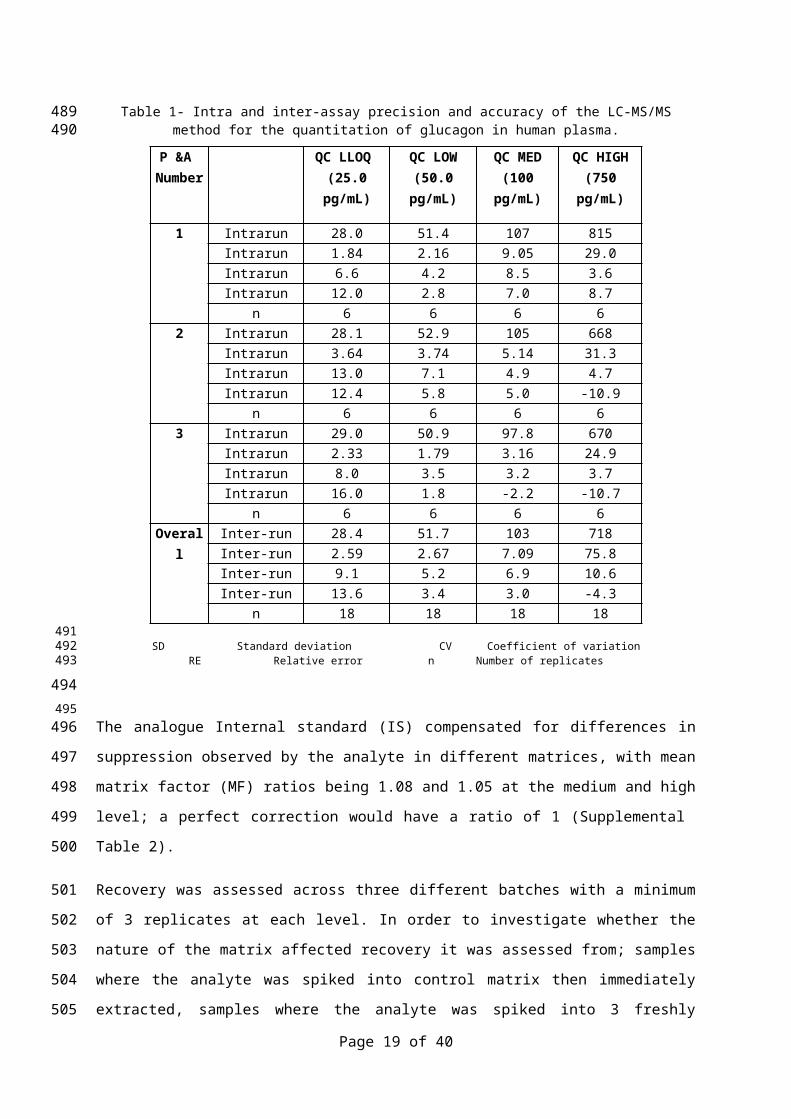
Figure 4 Chromatograms showing endogenous levels of glucagon in plasma samples from healthy
volunteers.M3 (a),M8 (b), F8 (c), and F9 (d)
The majority of samples (58%) gave glucagon concentrations above the 25 pg/mL qualified
LLOQ, demonstrating the assay’s utility for endogenous level analysis. However as glucagon
concentrations in some individual plasmas were very close to, or below, this level , for
subsequent analysis we decided to include additional standards and QCs at the 10 and 15
pg/mL concentrations. These allowed assessment of whether a lower LLOQ could be
achieved on a batch to batch basis.
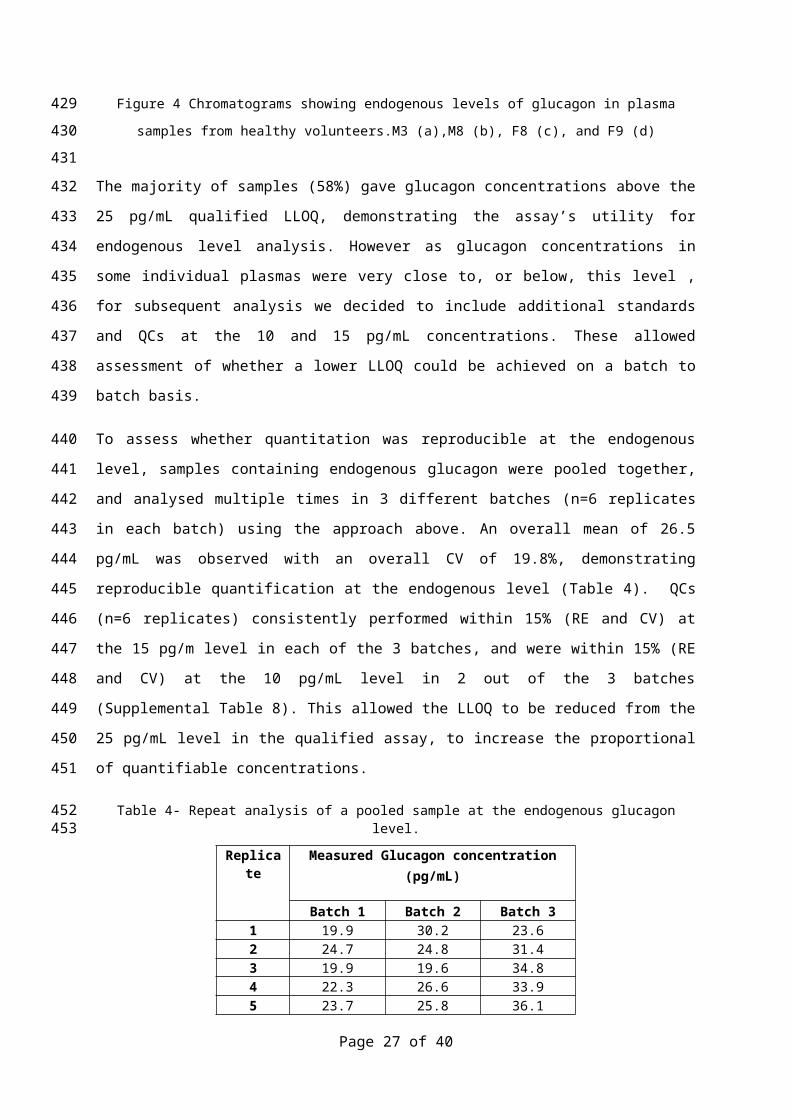
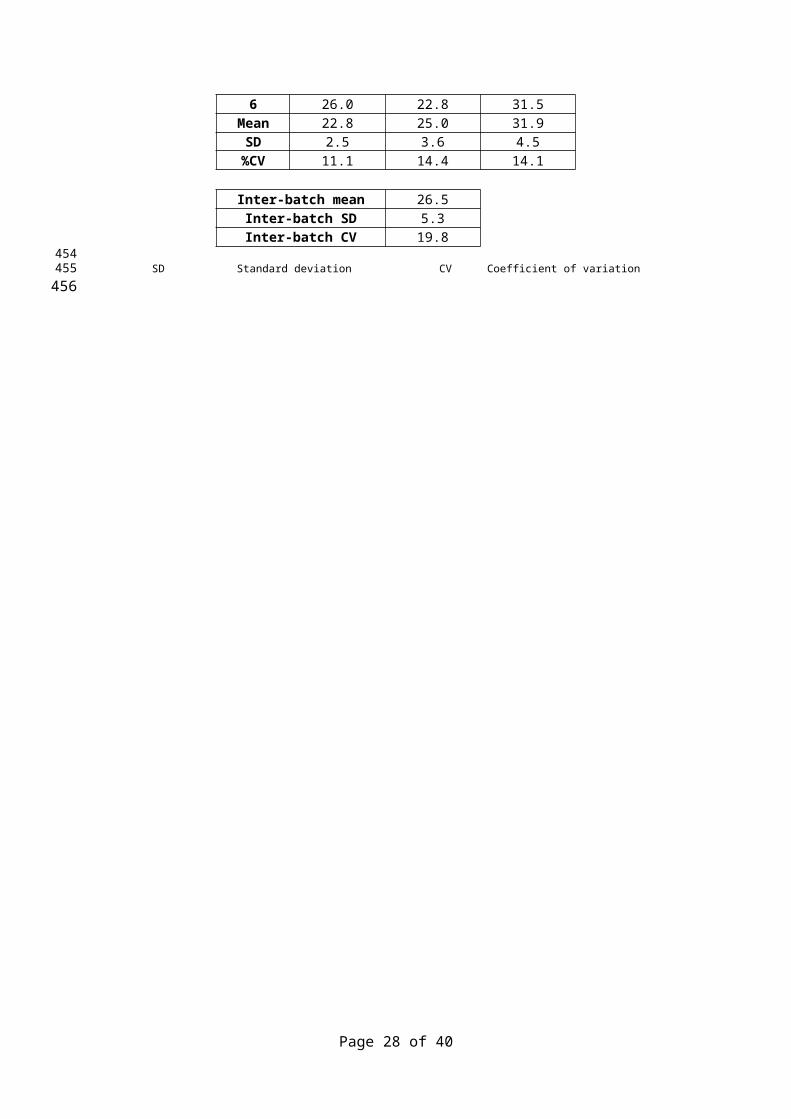
To assess whether quantitation was reproducible at the endogenous level, samples
containing endogenous glucagon were pooled together, and analysed multiple times in 3
different batches (n=6 replicates in each batch) using the approach above. An overall mean
of 26.5 pg/mL was observed with an overall CV of 19.8%, demonstrating reproducible
quantification at the endogenous level (Table 4). QCs (n=6 replicates) consistently performed
Page 19 of 29
a) M3
(BLQ) b) M8
(53.7 pg/mL)
d) F9
(31.7 pg/mL)
c) F8
(59.5
pg/mL)
421
422
423
424425426
427
428
429
430
431
432
433
434
435
436
437
within 15% (RE and CV) at the 15 pg/m level in each of the 3 batches, and were within 15%
(RE and CV) at the 10 pg/mL level in 2 out of the 3 batches (Supplemental Table 8). This
allowed the LLOQ to be reduced from the 25 pg/mL level in the qualified assay, to increase
the proportional of quantifiable concentrations.
Table 4- Repeat analysis of a pooled sample at the endogenous glucagon level.
Replicate Measured Glucagon concentration (pg/mL)
Batch 1 Batch 2 Batch 31 19.9 30.2 23.62 24.7 24.8 31.43 19.9 19.6 34.84 22.3 26.6 33.95 23.7 25.8 36.16 26.0 22.8 31.5
Mean 22.8 25.0 31.9SD 2.5 3.6 4.5
%CV 11.1 14.4 14.1
Inter-batch mean 26.5Inter-batch SD 5.3Inter-batch CV 19.8
SD Standard deviation CV Coefficient of variation
Page 20 of 29
438
439
440
441
442
443444
445
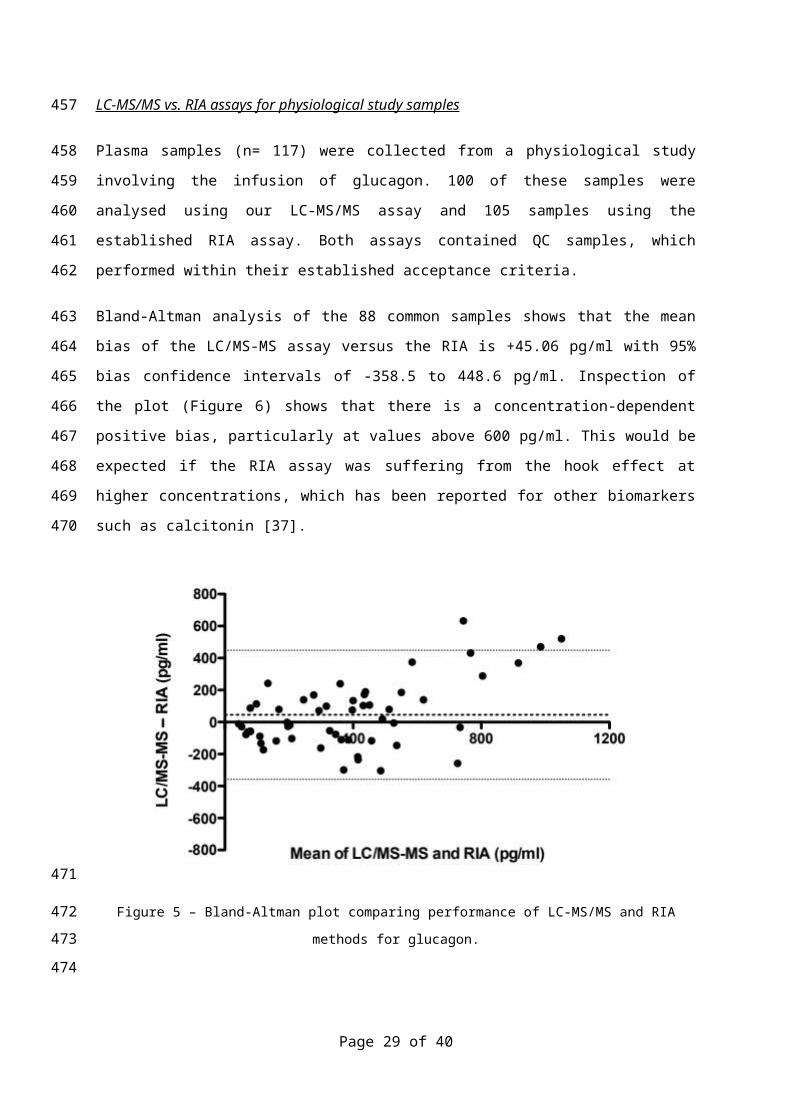
LC-MS/MS vs. RIA assays for physiological study samples
Plasma samples (n= 117) were collected from a physiological study involving the infusion of
glucagon. 100 of these samples were analysed using our LC-MS/MS assay and 105
samples using the established RIA assay. Both assays contained QC samples, which
performed within their established acceptance criteria.
Bland-Altman analysis of the 88 common samples shows that the mean bias of the LC/MS-
MS assay versus the RIA is +45.06 pg/ml with 95% bias confidence intervals of -358.5 to
448.6 pg/ml. Inspection of the plot (Figure 6) shows that there is a concentration-dependent
positive bias, particularly at values above 600 pg/ml. This would be expected if the RIA
assay was suffering from the hook effect at higher concentrations, which has been reported
for other biomarkers such as calcitonin [37].
Figure 5 – Bland-Altman plot comparing performance of LC-MS/MS and RIA methods for glucagon.
RIA and LC-MS/MS assays produced pharmacokinetic (PK) profiles of similar shapes, which
fitted with expectations from the nature of the study (Figure 6). It is therefore not possible to
determine which assay gives the “right” answer, and the approaches should be regarded as
complementary.
Page 21 of 29
446
447
448
449
450
451
452
453
454
455
456
457
458
459
460
461
462
463
0 5 10 15 20 25 30 35 400
100200300400500600700
Volunteer 1
Nominal Time (hr)25 30 35 40 45 50 55 60
0200400600800
100012001400
Volunteer 2
Nominal Time (hr)
0 10 20 30 40 50 600
50100150200250300350400
Volunteer 3
Nominal Time (hr)0 10 20 30 40 50 60
0100200300400500600
Volunteer 4
Nominal Time (hr)
Figure 6- A selection of PK profiles from RIA assay concentrations (red squares) and LC-MS/MS
method concentrations (blue diamonds).Y axis units are pg/mL. See supplemental information Figure
6 for the complete set of 9 profiles
Conclusion
The developed procedure is the first peer reviewed LC-MS/MS method capable of
quantifying endogenous levels of glucagon in human plasma. Glucagon levels from healthy
volunteers agreed well with the range expected from RIA assays. Our method avoids the
radioactivity (and precautions this requires) associated with RIA assays, has a shorter
extraction time and good precision and accuracy.
The 25 pg/mL LLOQ in our qualified assay is a considerable improvement over the lowest
LC-MS/MS LLOQ previously reported (250 pg/mL) in the peer reviewed literature [10]. A 10
pg/mL LLOQ has been reported in a conference presentation [13], using a highly sensitive
QTRAP mass spectrometer. We were on occasion able to see such levels using our
instrument, although we performed the qualification using a a 25 pg/mL LLOQ to improve
assay robustness. Transferring this assay on to a more modern instrument may enable the
LLOQ of 10 pg/mL to be achieved routinely. Our 2D extraction procedure was key to
achieving such sensitivity, by reducing matrix suppression, background noise, and
interferences. To our knowledge this is the first time protein precipitation and size exclusion
SPE have been combined for such a purpose for high throughput peptide analysis. Our
Page 22 of 29
464
465
466467468469
470
471
472
473
474
475
476
477
478
479
480
481
482
483
484
485
surrogate matrix approach, using a mixture of non-extracted surrogate matrix STDs and QCs
and extracted authentic matrix QCs, is also a novel strategy for endogenous peptide
analysis.
Bland-Altman analysis shows a mean positive bias of the LC/MS-MS method versus the RIA
that appears to be a concentration-dependent, as would be expected if the RIA was suffering
from the hook effect at higher concentrations. The PK profiles from both assays were similar
shapes, and both profiles fitted with the nature of the physiological study suggesting the
methods are complementary.
The assay‘s performance has been qualified using experiments described in the latest EMA
[17] and FDA [16] guidance and in accordance to the principles of GCP [22].
Page 23 of 29
486
487
488
489
490
491
492
493
494
495
496
497
Executive Summary
Introduction
Published LC-MS/MS methods are not sensitive enough to quantify endogenous
levels of glucagon.
Endogenous compounds, such as glucagon, can be quantified using either a
standard addition, surrogate analyte, or a surrogate matrix approach.
We favoured the surrogate matrix approach as it avoids extrapolation and is
described in the EMA Guideline on bioanalytical method validation.
Results and Discussion
Method development
Extensive optimisation has generated the most sensitive LC-MS/MS method for
glucagon quantitation in the peer reviewed literature.
A novel 2D extraction technique, combining protein precipitation with size exclusion
hydrophobic (SEH) SPE, was key to achieving such sensitivity, by reducing matrix
suppression, background noise, and interferences.
Quantitation used a mixture of non-extracted surrogate matrix STDs and QCs and
extracted authentic matrix QCs. Such approach is a novel strategy for endogenous
peptide analysis.
Validation
Validation experiments performed were based on those described in the latest EMA
and FDA guidelines.
Most experiments, including the precision and accuracy of the method, were within
the prospectively defined acceptance criteria.
However, a degree of plasma sample instability was apparent, and it fell outside of
our prospectively defined acceptance criteria.
The assay is therefore described as qualified, over the range 25 – 1000 pg/mL,
rather than validated. The assay will however be fit-for-purpose for many
applications.
Page 24 of 29
498
499
500
501
502
503
504
505
506
507
508
509
510
511
512
513
514
515
516
517
518
519
520
521
522
523
524
525
526
527
528
Using the qualified LC-MS/MS method to assess endogenous glucagon concentrations from
volunteers
Glucagon levels in healthy volunteers measured by LC-MS/MS showed good
agreement with literature values determined by RIA.
Assessment of assay performance at the 10 and 15 pg/mL levels allowed the assay
LLOQ to be lowered from 25 pg/mL on a batch to batch basis.
Reproducible quantitation at the endogenous glucagon level was demonstrated.
LC-MS/MS vs. RIA assays for physiological study samples
Bland-Altman analysis shows a concentration-dependent positive bias of the LC/MS-
MS assay versus an RIA, with a mean bias of +45.06 pg/mL
Both assays produced similar PK profiles, both of which were feasible considering
the nature of the study, and the methods should be regarded as complementary.
Future Perspectives
We believe that experimentally demanding or troublesome immunoassays, such as the
glucagon RIA assay, will increasingly become replaced with LC-MS/MS based
methodologies to circumvent issues with cross reactivity, increase sample throughout and
avoid the use of radioactivity. To achieve the low LLOQs often required we also believe that
approaches such as 2D extraction will become more commonly used. For regulated
bioanalytical studies of endogenous compounds, strategies such as surrogate matrix
quantitation, which avoids the need to extrapolate the calibration curve, will become the
favoured approach.
Page 25 of 29
529
530
531
532
533
534
535
536
537
538
539
540
541
542
543
544
545
546
547
548
549
550
551
552
553
Financial & competing interests disclosure
The authors have no relevant affiliations or financial involvement with any organization or
entity with a financial interest in or financial conflict with the subject matter or materials
discussed in the manuscript. This includes employment, consultancies, honoraria, stock
ownership or options, expert testimony, grants or patents received or pending, or royalties.
No writing assistance was utilized in the production of this manuscript.
Ethical conduct of research
The authors state that they have obtained appropriate institutional review board approval
(West London Research Ethics Committee: 11/LO/1782) and have followed the principles
outlined in the Declaration of Helsinki for all human experimental investigations.
References
1. Kolb A, Rieder S, Born D, et al. Glucagon/insulin ratio as a potential biomarker for pancreatic cancer in patients with new-onset diabetes mellitus. Cancer Biol. Ther. 8(16), 1527–1533 (2009).
2. Hinke SA, Pospisilik JA, Demuth HU, et al. Dipeptidyl peptidase IV (DPIV/CD26) degradation of glucagon. Characterization of glucagon degradation products and DPIV-resistant analogs. J. Biol. Chem. 275(6), 3827–34 (2000).
3. Zhu L, Tamvakopoulos C, Xie D, et al. The role of dipeptidyl peptidase IV in the cleavage of glucagon family peptides: in vivo metabolism of pituitary adenylate cyclase activating polypeptide-(1-38). J. Biol. Chem. 278(25), 22418–23 (2003).
4. Taieb J, Mathian B, Millot F, et al. Testosterone measured by 10 immunoassays and by isotope-dilution gas chromatography-mass spectrometry in sera from 116 men, women, and children. Clin. Chem. 49(8), 1381–1395 (2003).
5. FP Alford, SR Bloom J, Nabarro. Glucagon levels in normal and diabetic subjects: Use of a specific immunoabsorbent for glucagon radioimmunoassay. Diabetologia. 13(1), 1–6 (1977).
6. MJ B, Albrechtsen N, Pedersen J, et al. Specificity and sensitivity of commercially available assays for glucagon and oxyntomodulin measurement in humans. Eur J Endocrino. 170(4), 529–38 (2014).
7. Sloan JH, Siegel RW, Ivanova-Cox YT, Watson DE, Deeg M a, Konrad RJ. A novel high-sensitivity electrochemiluminescence (ECL) sandwich immunoassay for the specific quantitative measurement of plasma glucagon. Clin. Biochem. 45(18), 1640–4 (2012).
8. Hoofnagle AN, Wener MH. The Fundamental Flaws of Immunoassays and Potential Solutions Using Tandem Mass Spectrometry. J Immunol Methods. 347((1-2)), 3–11 (2009).
Page 26 of 29
554
555
556
557
558
559
560561
562
563
564
565
566567568
569570571
572573574
575576577
578579580
581582583
584585586587
588589590
9. Delinsky DC, Hill KT, White CA, Bartlett MG. Quantitation of the large polypeptide glucagon by protein precipitation and LC/MS. Biomed. Chromatogr. 18(9), 700–5 (2004).
10. Li YX, Hackman M WC. Quantitation of polypeptides (glucagon and salmon calcitonin) in plasma samples by “high resolution” on a triple quadrupole mass spectrometer. Bioanalysis. 4(6), 685–691 (2012).
11. Veniamin N Lapko , Patrick S Miller , G Paul Brown , Rafiqul Islam , Sarah K Peters , Richard L Sukovaty PFR& CJK. Sensitive glucagon quantification by immunochemical and LC – MS / MS methods. Bioanalysis. 5(23), 2957–2972 (2013).
12. V. Lapko, P. Brown, R. Nachi, C. Kafonek, A. Dzerk, B. Retke CO, Davis CS and I. Exploring quantification of peptides: measurement of glucagon in human plasma by LC–MS/MS. Presented at: In: EBF 3rd Annual Open Symposium: From Challenges to Solutions. Barcelona, Spain, 1 - 3 December 2010.
13. F. Garofolo, J. N. Mess, L. P. Morin, M. Aiello, X. Misonne, G. Impey, J. Cardenas JM. Glucagon bioanalysis by LC–MS: unprecedented level of sensitivity (10 pg/ml) for a novel formulation. Presented at: In: 2013 American Association of Pharmaceutical Scientists National Biotechnology Conference. San Diego, CA, 20-22 May 2013.
14. Jones BR, Schultz G a, Eckstein J a, Ackermann BL. Surrogate matrix and surrogate analyte approaches for definitive quantitation of endogenous biomolecules. Bioanalysis. 4(19), 2343–56 (2012).
15. Bansal SS, Abbate V, Bomford A, et al. Quantitation of hepcidin in serum using ultra-high-pressure liquid chromatography and a linear ion trap mass spectrometer. Rapid Commun. Mass Spectrom. 24(9), 1251–9 (2010).
16. Guidance for industry: Bioanalytical method validation. U.S. Department of Health and Human Services, Food and Drug Administration, Center for Drug Evaluation and Research (CDER), Center for Veterinary Medicine (CVM), May 2001.
17. Guideline on bioanalytical method validation, EMA. (2012).
18. Lee JW. Method validation and application of protein biomarkers: basic similarities and differences from biotherapeutics. Bioanalysis. 1(8), 1461–74 (2009).
19. Lee JW. Method validation and application of protein biomarkers: basic similarities and differences from biotherapeutics. Bioanalysis. 1(8), 1461–74 (2009).
20. Polaskova V, Kapur A, Khan A, Molloy MP, Baker MS. High-abundance protein depletion: comparison of methods for human plasma biomarker discovery. Electrophoresis. 31(3), 471–82 (2010).
21. Howard JW, Kay RG, Pleasance S, Creaser CS. UHPLC for the separation of proteins and peptides. Bioanalysis. 4(24), 2971–88 (2012).
22. International committee on harmonisation (ICH) guideline E6: Triparite guidelines for GCP, EMEA. (1996).
Page 27 of 29
591592593
594595596
597598599
600601602603
604605606607
608609610
611612613
614615616
617
618619
620621
622623624
625626
627628
23. Kreymann B, Williams G, Ghatei MA BS. Glucagon-like peptide-1 7-36: a physiological incretin in man. Lancet. 2(8571), 1300–1304 (1987).
24. Ghatei MA, Uttenthal LO, Bryant MG, Christofides ND, Moody AJ BS. Molecular Forms of Glucagon-Like Immunoreactivity in Porcine Intestine and Pancreas. Endocrinology. (112), 917–923. (1983).
25. Fekete S, Ganzler K, Fekete J. Facts and myths about columns packed with sub-3 microm and sub-2 microm particles. J. Pharm. Biomed. Anal. 51(1), 56–64 (2010).
26. Ruta J, Guillarme D, Rudaz S, Veuthey J-L. Comparison of columns packed with porous sub-2 microm particles and superficially porous sub-3 microm particles for peptide analysis at ambient and high temperature. J. Sep. Sci. 33(16), 2465–2477 (2010).
27. Ismaiel OA, Zhang T, Jenkins R, Karnes HT. Determination of octreotide and assessment of matrix effects in human plasma using ultra high performance liquid chromatography-tandem mass spectrometry. J. Chromatogr. B. Analyt. Technol. Biomed. Life Sci. 879(22), 2081–2088 (2011).
28. Holčapek M, Jirásko R, Lísa M. Recent developments in liquid chromatography-mass spectrometry and related techniques. J. Chromatogr. A. 1259, 3–15 (2012).
29. Kay R, Barton C, Ratcliffe L, et al. Enrichment of low molecular weight serum proteins using acetonitrile precipitation for mass spectrometry based proteomic analysis. Rapid Commun. Mass Spectrom. 22(20), 3255–60 (2008).
30. Halquist MS, Karnes HT. Quantification of Alefacept, an immunosuppressive fusion protein in human plasma using a protein analogue internal standard, trypsin cleaved signature peptides and liquid chromatography tandem mass spectrometry. J. Chromatogr. B. Analyt. Technol. Biomed. Life Sci. 879(11-12), 789–98 (2011).
31. Wang Y, Qu Y, Bellows CL, Ahn J, Burkey JL, Taylor SW. Simultaneous quantification of davalintide, a novel amylin-mimetic peptide, and its active metabolite in beagle and rat plasma by online SPE and LC–MS/MS. Bioanalysis. 4, 2141–2152 (2012).
32. Chappell D, Lee A, Castro-Perez J, et al. An ultrasensitive method for the quantitation of active and inactive GLP-1 in human plasma via immunoaffinity LC-MS/MS. Bioanalysis. 6(1), 33–42 (2014).
33. Omenn GS. THE HUPO Human Plasma Proteome Project. PROTEOMICS – Clin. Appl. 1(8), 769–779 (2007).
34. Houghton R, Horro Pita C, Ward I, Macarthur R. Generic approach to validation of small-molecule LC-MS/MS biomarker assays. Bioanalysis. 1(8), 1365–74 (2009).
35. Rai AJ, Gelfand CA, Haywood BC, et al. HUPO Plasma Proteome Project specimen collection and handling: towards the standardization of parameters for plasma proteome samples. Proteomics. 5(13), 3262–77 (2005).
36. Green BD, Flatt PR, Bailey CJ. Dipeptidyl peptidase IV (DPP IV) inhibitors: A newly emerging drug class for the treatment of type 2 diabetes. Diab. Vasc. Dis. Res. 3(3), 159–65 (2006).
Page 28 of 29
629630
631632633
634635
636637638639
640641642643
644645
646647648
649650651652
653654655
656657658
659660
661662
663664665
666667668
37. Leboeuf R, Langlois M-F, Martin M, Ahnadi CE, Fink GD. “Hook effect” in calcitonin immunoradiometric assay in patients with metastatic medullary thyroid carcinoma: case report and review of the literature. J. Clin. Endocrinol. Metab. 91(2), 361–4 (2006).
Page 29 of 29
669670671672
673
674