Embed Size (px)
Citation preview
Running head: DIFFERENCE-EDUCATION CLOSES ACHIEVEMENT GAP
Empowerment Through Difference: An Individually Administered Difference-Education
Intervention Closes the Social Class Achievement Gap
Sarah S. M. Townsend
Marshall School of Business, University of Southern California
Nicole M. Stephens
Kellogg School of Management, Northwestern University
Stephanie Smallets
Marshall School of Business, University of Southern California
MarYam G. Hamedani
Center for Social Psychological Answers to Real-world Questions (SPARQ),
Stanford University
Author Note
The authors thank Mindy Truong for assistance with data collection and Mindy Truoug
and Brittany Torrez for assistance with manuscript preparation.
Correspondence concerning this article should be addressed to Sarah Townsend, Marshall
School of Business, University of Southern California, 701 Exposition Boulevard, Los Angeles,
CA, 90089. E-mail: [email protected]
Word count = 9,920
1
DIFFERENCE-EDUCATION CLOSES ACHIEVEMENT GAP
Abstract
A growing body of work suggests that understanding how social differences matter is an
effective route toward reducing group disparities. However, research has only demonstrated this
benefit when people learned about difference in group settings. In the present work, we test
whether an individually-administered difference-education intervention can educate students
about how difference matters and improve the academic performance of first-generation students
(i.e., students whose parents do not have 4-year college degrees). Across two studies (N = 270),
first-year students read senior students’ and recent graduates’ stories about how they adjusted to
college. In the difference-education condition, stories linked students’ backgrounds to their
college experiences (i.e., challenges, strengths, and strategies). First, the individually
administered intervention effectively taught students the message about how and why difference
matters (Studies 1 and 2). Second, the intervention closed the social class achievement gap by
increasing first-generation students’ academic empowerment and, thereby, end-of-second-year
grades (Study 2).
Keywords: social class, intervention, difference-education, academic achievement
2
DIFFERENCE-EDUCATION CLOSES ACHIEVEMENT GAP
Empowerment Through Difference: An Individually Administered Difference-Education
Intervention Closes the Social Class Achievement Gap
Social differences (i.e., differences due to people’s backgrounds, identities, and social
group memberships) powerfully shape individuals’ experiences and outcomes in higher
education. For example, on college campuses across the U.S., gaps in academic performance
persist between disadvantaged students (e.g., those who are racial minorities or first-generation)
and their relatively advantaged counterparts (Pascarella, Pierson, Wolniak, & Terenzini, 2004;
Sirin, 2005). Although it can be uncomfortable to acknowledge these social differences,
understanding how they matter is a critical skill in today’s global, multicultural society (Hurtado,
2007). In addition, a growing body of research across disciplines suggests that understanding
how people’s different backgrounds matter is also an effective route toward reducing group
disparities in education (e.g., Gurin, Nagda, & Zúñiga, 2013; Morrison, Robbins, & Rose, 2008).
Students who learn about difference (e.g., in ethnic studies courses) show increased academic
engagement and performance (Dee & Penner, 2016). However, these benefits have only been
demonstrated in group settings (e.g., Gurin et al., 2013; Stephens, Hamedani, & Destin, 2014).
This raises the possibility that group settings are a necessary precondition for reducing
achievement gaps by educating students about difference.
In the current research, we ask whether educating students about difference can also be
effective in improving disadvantaged students’ outcomes when the message is learned
individually. We suggest the answer is yes and propose a new, individually administered
difference-education intervention that gives students the message that their different backgrounds
matter for their experience in college—in terms of challenges, strengths, and strategies for
success. We theorize that it is not the group format, but instead the content of the message that
3
DIFFERENCE-EDUCATION CLOSES ACHIEVEMENT GAP
increases disadvantaged students’ feelings of fit and empowerment, and, ultimately, their
academic performance. We test these predictions in two studies focused on the experiences and
outcomes of first-generation college students (i.e., students whose parents do not have 4-year
college degrees). Study 1 tested whether students can learn the difference-education message in
an individually administered format. Study 2 replicated this finding at a different university and
examined whether the individually administered intervention improves first-generation students’
academic performance and, in particular, does so by increasing their social fit and academic
empowerment.
The Benefits of Teaching about Difference in Group Settings
Highlighting difference is often viewed as detrimental because of its potential to foster
intergroup conflict, as well as make people feel threatened, devalued, or excluded (e.g., Dovidio
& Gaertner, 2000; Steele, 2010). However, it is possible to educate students about how social
differences matter in college in a way that is not threatening, and can close achievement gaps
between groups. Indeed, education research on academic courses, such as courses in ethnic
studies or intergroup dialogue, demonstrates that learning about difference can be beneficial
when done in these group settings (e.g., Cabrera, Milem, Jaquette, & Marx, 2014; Dee & Penner,
2016; Gurin et al., 2013). For example, analyses using administrative data from the Tucson
Unified School District indicated that taking Mexican American Studies classes was positively
associated with both passing Arizona state standardized tests and graduating from high school
(Cabrera et al., 2014). In addition, students participating in intergroup dialogue courses showed
greater perspective-taking ability and intergroup empathy, and viewed diversity and
collaborative action as more valuable (Gurin et al., 2013; Gurin & Nagda, 2006).
4
DIFFERENCE-EDUCATION CLOSES ACHIEVEMENT GAP
Furthermore, social psychological intervention research examining difference-education
also demonstrates the benefits of learning about difference in group settings (Stephens,
Hamedani, & Destin, 2014; Stephens, Townsend, Hamedani, Destin, & Manzo, 2015).
Specifically, in the difference-education intervention, groups of 20 to 30 incoming students
listened to an eight-person panel of their peers share stories of how their social class
backgrounds can affect their college experiences. In this group format, both first-generation and
continuing-generation students learned the difference-education message about how their
backgrounds matter in college—in both good and bad ways—and retained this knowledge
through at least their second year in college (Stephens et al., 2015). Importantly, the group-
format difference-education intervention was effective in closing the achievement gap between
first-generation and continuing-generation students (i.e., students who have at least one parent
with a 4-year degree; Stephens, Hamedani, & Destin, 2014).
Are Group Settings Necessary to Benefit from Teaching about Difference?
The group setting of ethnic studies courses, intergroup dialogues, and the initial
difference-education intervention, where participants learned information about difference along
with other students who were physically present, may be essential to these programs’ success in
two ways. First, the in-person, group format may buffer participants from social identity threat.
Specifically, without the group format, a focus on difference (e.g., making social class salient)
may increase negative intergroup attitudes and, therefore, the experience of social identity threat
(e.g., Croizet & Claire, 1998; Turner, Hogg, Oakes, Reicher, & Wetherell, 1987). The group
settings used in previous research may provide a supportive social environment that fosters
feelings of social connection, which renders the information about difference less threatening,
and, therefore, enables participants to learn about difference.
5
DIFFERENCE-EDUCATION CLOSES ACHIEVEMENT GAP
Second, the in-person, group format may be essential to these programs’ effectiveness
because it fosters high levels of engagement and interest in the topic. Learning the material
individually, rather than in a group setting, may lead participants to attend less to the message
and be less likely to trust it (e.g., Lewin, 1952; Shteynberg, 2015). For example, work on shared
attention suggests that the experience of learning about difference alone may lead participants to
recruit fewer cognitive resources while processing the message than if they were with others
(e.g., Shteynberg, 2015; Shteynberg & Apfelbaum, 2013). Such shared attention is associated
with better memory and stronger motivation compared to individual attention. Likewise,
conveying the message about difference in a group setting may give participants the impression
that they are all “in this together,” and, thereby, lead to high levels of engagement with the
material (e.g., Carr & Walton, 2014). Thus, the group settings used in previous research, which
allow participants to respond to information about difference together with others, may increase
participants’ engagement with, and resulting ability to learn, this information.
Increasing Fit and Empowerment with Individual Difference-Education
Thus, by rendering the information about difference nonthreatening and engaging, the
group setting may be necessary for participants to learn the message about difference and,
therefore, benefit from it. However, we theorize that it is the content of this information (i.e., the
understanding of difference), rather than the intervention format, that is critical for producing
these programs’ positive effects (Stephens, Hamedani, & Townsend, 2017). We propose that
educating students about difference individually can be nonthreatening and can foster interest
and engagement, such that students are able to gain an understanding of difference and benefit
from this understanding. In the current research, we focus on difference-education interventions
and their benefits for first-generation college students.
6
DIFFERENCE-EDUCATION CLOSES ACHIEVEMENT GAP
First-generation students face background-specific obstacles that can undermine their
academic achievement and chances of graduating (Duncan & Murnane, 2011; Fiske & Markus,
2012). This gap in students’ outcomes is called the social class achievement gap. In addition to
financial or skill-based obstacles (Engle, 2007; Pascarella et al., 2004), first-generation students
also face psychological obstacles that often result from the disconnect between the working-class
cultural norms that are common among first-generation students and the largely middle- or
upper-class norms that they encounter in college (Bourdieu & Passeron, 1990; Croizet & Millet,
2011; Goudeau & Croizet, 2017; Stephens, Markus, & Phillips, 2014). This mismatch means that
first-generation students rarely see themselves and their ways of being included in the college
context and, therefore, often have trouble feeling like they fit in (Stephens, Fryberg, Markus,
Johnson, & Covarrubias, 2012). The mismatch also frequently leaves first-generation students
relatively unfamiliar with the “rules of the game” that govern college life and, as a result, lacking
a sense of empowerment, or feeling of preparation, efficacy, and control over their academic
experience (Ostrove & Long, 2007; Reay, Crozier, & Clayton, 2009).
We theorize that an individually administered difference-education intervention can be
nonthreatening, as well as engaging, for students because it communicates that social differences
are contextual and can be an asset. Specifically, in difference-education interventions,
participants gain a contextual understanding of difference as they learn how students’
backgrounds shape their experiences in college (e.g., first-generation students often face the
background-specific obstacle of lacking their parents’ advice when selecting a college major).
This contextual understanding of difference should increase first-generation students’ sense of fit
and comfort on campus by normalizing the experience of difference (cf., Plaut, 2010; Plaut,
Garnett, Buffardi, & Sanchez-Burks, 2011). At the same time, participants gain an asset-based
7
DIFFERENCE-EDUCATION CLOSES ACHIEVEMENT GAP
understanding of difference as they learn how students’ backgrounds inform not only the
obstacles they are likely to face, but also the strengths and strategies they can use to succeed
(e.g., first-generation students can seek out professors for advice in choosing a major). This
asset-based understanding of difference should increase first-generations students’ empowerment
in college by communicating that difference is not only negative but can also be a strength
(Steele, 2010). We propose that, by improving first-generation students’ sense of social fit and
academic empowerment on campus, this understanding of difference will improve their
academic performance.
Current Research: An Individually Administered Difference-Education Intervention
In the present research, we examine the effectiveness of an individually administered
difference-education invention for closing the social class achievement gap. Theoretically, this
research advances understanding of how acknowledging difference can improve students’
experiences and outcomes beyond group settings. Practically, this research provides an easy-to-
scale difference-education intervention that requires less time and fewer resources than the initial
group intervention. In Study 1, we test whether the difference-education message—that social
differences are contextual and can be an asset—can be effectively communicated when presented
to individual students online, in a written format. We predict that both first-generation and
continuing-generation students will be able to learn the critical components of the difference-
education message. In Study 2, we test whether this new difference-education intervention closes
the social class achievement gap and examine the process through which it does so. We also seek
to generalize previous findings to a different, more socioeconomically diverse university. We
predict that the individually administered difference-education intervention will improve first-
generation students’ performance by providing a greater sense of fit and empowerment. Finally,
8
DIFFERENCE-EDUCATION CLOSES ACHIEVEMENT GAP
we examine additional psychological outcomes, predicting that the difference-education
intervention will yield benefits for first-generation students that indicate an improved college
experience.
Study 1
Study 1 examined whether an individually administered difference-education intervention
could teach students a contextual and asset-based understanding of difference. Specifically, we
tested whether the intervention could effectively communicate the key message that students’
backgrounds matter in college (i.e., confer challenges, strengths, and strategies for success). We
tested this directly, by examining whether students learned the message, and indirectly, by
examining whether the message improved first-generation students’ perceptions of their college
experience. We predicted that all students in the difference-education condition would
understand and be able to communicate the key message that students’ social class backgrounds
matter in college. We also predicted that first-generation students in the difference-education
condition would show improved perceptions of their college experience compared to the control
condition.
Participants
Across two consecutive academic years, we recruited 137 students in the final term of
their first year, attending a mid-sized private research university in the Midwestern United
States. We determined our sample size by inviting all first year, first-generation students to
participate, and a sample of first year, continuing-generation students. We conducted the study
during two academic years to recruit enough first-generation students. Given the small
population of first-generation students and our clear a priori hypothesis, our sample size accords
with current recommendations (e.g., Simmons, Nelson, & Simonsohn, 2011). We excluded 13
9
DIFFERENCE-EDUCATION CLOSES ACHIEVEMENT GAP
participants because they previously completed a similar study. Of the remaining 124
participants, 51 were first-generation students (i.e., neither parent had a 4-year college degree),
and 73 were continuing-generation students (i.e., at least one parent had a 4-year college degree).
Based on the primary effect in the group-format intervention (i.e., the improved GPAs of first-
generation students; d = .700), this study is somewhat underpowered (i.e., ~70%).
Using official university records, the majority of first-generation students (56.86%) were
low income (i.e., received Pell grants), compared with a minority of continuing-generation
students (17.81%), 2(1, N = 124)= 20.44, p < .001. To examine racial and ethnic differences
between first-generation and continuing-generation students, we created a dummy variable (0 =
disadvantaged, 1 = advantaged). Given the relationship between race and academic performance
in the United States (e.g., Kao, 1995; Steele, 2010), Whites and Asians or Asian Americans were
classified as academically advantaged, whereas African Americans, Latinos, and Native
Americans were classified as academically disadvantaged. First-generation students were more
likely to be from a disadvantaged racial or ethnic background (35.29%) than continuing-
generation students (17.81%), 2(1, N = 124)= 4.90, p = .027.
Procedure
Participants were recruited via email and provided a link to participate in the online
study. Participants read the materials and responded to the survey items in a location of their
choosing. The manipulation consisted of five short profiles of junior or senior students or recent
graduates. This format mimicked how participants in the group-format intervention listened to
panelists share their stories. Participants were randomly assigned to either the difference-
education (n = 71) or control (n = 53) condition. Across conditions, participants read stories from
the same demographically diverse students. Each profile displayed a picture of the student along
10
DIFFERENCE-EDUCATION CLOSES ACHIEVEMENT GAP
with his/her first name, class, graduation year, and personal story ostensibly written by the
individual. We based the stories on the information presented in the group-format intervention.
The stories were of comparable length across conditions. First-generation and continuing-
generation students were evenly distributed across conditions, 2(1, N = 124)= 0.20, p = .658.
The key difference between conditions was whether the stories provided a contextual,
asset-based understanding of difference by connecting students’ backgrounds to their college
experiences. In the difference-education condition, the contrast in first- and continuing-
generation students’ stories illuminated how their different social class backgrounds (e.g.,
parents’ educational attainment) shaped their college experiences in both bad (i.e., obstacles) and
good (i.e., strengths and strategies) ways. Illustrating the obstacles associated with his social
class background, one first-generation student said: “Since my parents didn’t go to college, they
didn’t feel they had room to tell me how to make my decisions . . . That definitely made things
hard because I would have liked a bit of input from my parents.” Then, illustrating the
background-specific strengths and strategies that could be leveraged to succeed, the student went
on to say: “It’s really about assessing what you have, making the best of the situation, and
moving forward from that instead of looking at what you could’ve done better up to that point.”
Similarly, one continuing-generation student’s story linked her background (i.e., that her parents
have graduate-level degrees and she attended a small private high school) to an obstacle: “. . . it
was definitely a big adjustment going into classes with 150, 300 people. It was hard to stand up
for myself and get the personal attention and help that I needed.” She then went on to describe a
strategy for success: “All it takes is a little ingenuity to email a professor whose class is closed . .
. And nine times out of ten they’ll say sure.”
11
DIFFERENCE-EDUCATION CLOSES ACHIEVEMENT GAP
In the control condition, students’ stories provided general information about students’
challenges in college, as well as strengths and strategies they can leverage to be successful.
However, this content was not connected to students’ social class backgrounds. Therefore,
participants did not gain a contextual, asset-based understanding of difference. For example, one
student described the following obstacle she faced: “One challenge for me in my first year was
learning how to study and figuring out how to be fully prepared by the time exams come at the
end of the quarter.” She then described the strengths and strategies she used to be successful,
saying that she “learned that the most helpful way to study for midterms and final exams was to
re-read material.” See the supplemental material for additional excerpts.
Measures
Difference-education message. To assess whether the individual format effectively
communicated the key difference-education message, participants responded to two open-ended
prompts: “Please list three ways in which the lessons shared in these stories could help you
navigate [university] in the future,” and “Based on the lessons conveyed in the stories, what are
the top three things you would like to share with future incoming students to help them navigate
their transition to [university]?” These items are conceptually identical to those used as a
manipulation check in the group-format intervention (Stephens, Hamedani, & Destin, 2014). To
encourage participants to internalize the message, they also answered the question “How does
your story relate to the stories you just read?” (Yeager & Walton, 2011).
Perceptions of college experiences. To assess whether the individually administered
intervention could improve first-generation students’ perceptions of their college experience, in
the same online survey, participants responded to four measures after reading the student stories.
12
DIFFERENCE-EDUCATION CLOSES ACHIEVEMENT GAP
Participants responded to all items using a scale from 1 (strongly disagree) to 7 (strongly agree).
See the supplemental material for a complete list of items in both studies.
Appreciation of difference. On five items, drawn from a measure of diversity
endorsement (Plaut et al., 2011), participants reported whether they perceived their university to
accept and appreciate students with different backgrounds (e.g., “There are different ways to be
successful at [university]”), = .76, M = 6.03, SD = 0.84.
Social fit. On six items (Walton & Cohen, 2007), participants reported whether they felt
that they belonged or fit in socially at their university (e.g., “I feel like I belong as a student at
[university]”), = .86, M = 5.11, SD = 1.25.
Comfort in interactions. On seven items we created, participants reported whether they
felt comfortable engaging in a variety of interpersonal behaviors in college (e.g., “I feel
comfortable sharing my opinions with other [university] students”), = .82, M = 5.26, SD =
1.01.
Value of working with others. On five items we created, participants reported whether
they perceived seeking help from others as valuable for being a successful student (e.g., “Getting
extra help outside of class is part of being a good student”), = .84, M = 6.09, SD = 0.80.
Demographics. We obtained the following demographic information from the university
registrar: gender, racial and ethnic background, high school grade point average (GPA), whether
they were receiving Pell grants (as a measure of household income), and generation status.1
Results
Difference-education message. Using the coding scheme from Stephens, Hamedani, &
Destin (2014), we assessed whether participants in the difference-education condition learned
1 Since the purpose of this study was to test whether students could learn the difference-education message online, we did not obtain students’ grades.
13
DIFFERENCE-EDUCATION CLOSES ACHIEVEMENT GAP
that students’ diverse backgrounds can shape their college experiences. Specifically, we coded
whether participants mentioned that people have backgrounds “like mine” and people’s different
backgrounds matter. Two coders, unaware of participants’ generation status and condition,
coded the data ( = .622–.838, Landis & Koch, 1977); coding disagreements were resolved
through consensus. Supporting our hypothesis, participants in the difference-education condition
more often mentioned that people have backgrounds like theirs and that people’s different
backgrounds matter than did participants in the control condition. See Table 1 for sample
responses, percentages of responses in each condition and coding category, and results of chi-
square analyses.2
Perceptions of college experiences. We performed a series of 2 (generation status: first-
generation vs. continuing-generation) 2 (condition: difference-education vs. control)
univariate analyses of covariance (ANCOVAs) to examine the effects of generation status,
condition, and their interaction on participants’ perceptions of their college experience (See
Table 2). Given that students’ demographic characteristics and previous academic performance
are likely to influence their college experience, we controlled for race and ethnicity (0 =
disadvantaged, 1 = advantaged), gender (0 = male, 1 = female), high school GPA, and low-
income status (i.e., whether students received Pell grants; 0 = low income, 1 = not low income).
Following Lakens (2013), we report partial eta squared effect sizes with 90% confidence
intervals (CIs; in brackets) for analyses of covariance in both studies.
Contrary to our predictions, we found no significant interactive effects for participants’
perceptions of their university’s appreciation of difference, feelings of social fit, or belief that
2 We also assessed participants’ reactions to the stories (e.g., positivity) and examined whether these were affected by generation status, condition, or their interaction. When we found significant effects, we controlled for those reactions in follow-up analyses of perceptions of college experiences; doing so did not change the significance or direction of our results. See the supplemental material for more information.
14
DIFFERENCE-EDUCATION CLOSES ACHIEVEMENT GAP
working with others is valuable. However, consistent with our predictions, we found a significant
interaction for students’ anticipated comfort in interactions on campus, F(1, 116)= 7.49, p
= .007, p2= .061 [.009, .141], see Figure 1. Although first-generation students reported
significantly lower comfort than continuing-generation students in the control condition, F(1,
116)= 6.84, p = .010, p2= .056 [.007, .134], the two groups reported similar levels of comfort in
the difference-education condition, F(1, 116)= 1.12, p = .291, p2= .010 [0, .058]. Importantly,
this was due to an increase in comfort reported by first-generation students in the difference-
education compared to control condition, F(1, 116)= 10.37, p = .002, p2= .082 [.020, 169].
Continuing-generation students’ comfort did not differ by condition, F(1, 116)= 0.23, p = .634,
p2= .002 [0, .035].
Discussion
Supporting our theorizing, even when students read the difference-education message
individually, we found that they understood and could communicate the key message.
Specifically, compared to the control condition, participants in the difference-education
condition were more likely to mention that other students have backgrounds like theirs and that
students’ different backgrounds matter. We also found some support for our secondary
hypotheses that learning the difference-education message would improve first-generation
students’ perceptions of their college experiences. Although the difference-education compared
to control condition did not change participants’ perceptions that their university appreciates
difference, feelings of social fit, or beliefs that working with others is valuable, it did increase
first-generation students’ anticipated comfort in campus interactions.
Why did first-generation students’ expected comfort in interactions improve, while the
other perceptions remain unchanged? One potential reason may be the relative malleability of
15
DIFFERENCE-EDUCATION CLOSES ACHIEVEMENT GAP
these different constructs given that students completed the study after they had been on campus
for at least 6 months. We speculate that general understandings such as social fit, appreciation of
difference, and value of working with others may accumulate based on one’s experiences and,
therefore, be relatively resistant to change. In contrast, more specific perceptions of concrete
behavior, such as expected feelings of comfort in interactions (e.g., speaking in class), might
remain more malleable and open to change with new information.
Study 2
Building on Study 1, Study 2 had three goals. First, we examined whether our
individually administered difference-education intervention can close the social class
achievement gap by improving first-generation students’ grades. Given that interventions should
be most effective during the college transition (Wilson, 2011; Yeager & Walton, 2011; cf.
Walton & Cohen, 2007), we recruited students at the beginning of their first year, when they
were still learning about who they are in their new environment and adjusting to their new lives.
Second, we examined the process through which the intervention produces its benefits.
Specifically, we tested whether difference-education would increase first-generation students’
social fit and academic empowerment compared to the control condition, and whether these
changes would close the achievement gap. We also examined whether the difference-education
intervention would provide first-generation students with additional psychological benefits,
indicating an improved college experience.
Third, we tested the generalizability of our intervention to a more socioeconomically
diverse university than the one at which Study 1 and the previous difference-education study
were conducted. In this university setting, only 8% of first-year students were first-generation.
Given their small numbers, first-generation students in this context may have had little
16
DIFFERENCE-EDUCATION CLOSES ACHIEVEMENT GAP
understanding of how their different backgrounds matter for their college experiences and may
have been especially likely to benefit from learning the difference-education message. First-
generation students make up a larger proportion of the student body in Study 2’s university
setting (14.2% of first-year students). Therefore, they may have a better understanding of how
difference matters and the intervention could have less impact. Although this is possible, we
theorize that difference-education will benefit first-generation students because they are still in
the minority in this college setting, and are, therefore, likely to experience reduced fit and
empowerment compared to their peers. In Study 2, we anticipated that the difference-education
intervention would improve first-generation students’ grades in this new university context.
Participants
We recruited 133 participants from a large, private research university on the West coast
of the United States. All participants were in the first 5 to 9 weeks of their first year. Our sample
size was determined by recruiting all first-generation students and a targeted group of
continuing-generation students to participate in the “[university] Student Stories Project.” To
ensure that our results are due to generation status, rather than gender, race, or ethnicity, we
created the group of continuing-generation students to roughly match the gender and racial and
ethnic backgrounds of the first-generation students. Again, using the effect size from the group-
format intervention (i.e., for first-generation students’ improved GPA; d = .700), this study is
somewhat underpowered (i.e., ~71%).
Fifty-four participants were first-generation and 79 were continuing-generation. As
indicated by self-report, the majority of first-generation students (77.78%) were low income (i.e.,
received Pell grants), compared with a minority of continuing-generation students (17.95%),
2(1, N = 132)= 46.76, p < .001. One continuing-generation student did not report whether he
17
DIFFERENCE-EDUCATION CLOSES ACHIEVEMENT GAP
received a Pell grant. To maintain greater power, we included this participant in our analyses,
assigning him the modal response for continuing-generation students (i.e., not a Pell grant
recipient). As in Study 1, we created a dummy variable based on participants’ racial and ethnic
backgrounds (0 = disadvantaged, 1 = advantaged). First-generation students were not more likely
to be from disadvantaged backgrounds (44.44%) than continuing-generation students (45.57%),
2(1, N = 133)= 0.02, p = .898.
For GPA analyses, we also included a campus-wide control group of all other first-year
students. By obtaining students’ generation status from the university, we were able to compare
the end-of-year-two cumulative GPAs of study participants with those of (a) 295 first-generation
nonparticipants and (b) 2433 continuing-generation nonparticipants.
Procedure
Individually administered intervention and Time 1 survey. As in Study 1, participants
were recruited via email and completed the intervention materials online in a location of their
choosing. The intervention materials were nearly identical to Study 1. We made small alterations
so that the stories would accurately reflect the new university context (e.g., changed the names of
student groups). Participants were randomly assigned to either the difference-education (n = 68)
or control (n = 65) condition. First-generation and continuing-generation students were evenly
distributed across conditions, 2(1, N = 133)= 0.85, p = .357. Immediately following the
intervention (Time 1), participants completed a series of measures to assess whether they had
learned the key difference-education message and whether the intervention affected their
expectations for their college experiences, including preliminary measures of our potential
mediators: social fit and academic empowerment.
18
DIFFERENCE-EDUCATION CLOSES ACHIEVEMENT GAP
End of first year (Time 2) survey. We also conducted an end-of-first-year (Time 2)
follow-up survey for which participants were recruited via email. Again, participants completed
this survey online, which included measures of the potential mediators of social fit and academic
empowerment and various other measures assessing participants’ college experiences.
Academic performance at end of second year. We obtained participants’ official
cumulative GPAs at the end of their second year. Importantly, the GPAs of participants in the
control condition were statistically equivalent to the GPAs of the nonparticipants in our campus-
wide control group. This was true for first-generation students (control: M = 3.15, SD = 0.38,
campus-wide control: M = 3.17, SD = 0.53), F(1, 305)= 0.03, p = .862, p2< .000 [0, .004], and
continuing-generation students (control: M = 3.42, SD = 0.38, campus-wide control: M = 3.38,
SD = 0.42), F(1, 2344)= 0.32, p = .569 p2<.000 [0, .002].
Measures
Difference-education message (Time 1). Using the same open-ended questions as in
Study 1, we evaluated whether students learned the key difference-education message and also
gave participants the opportunity to internalize the message (Yeager & Walton, 2011). In
addition, we included a closed-ended measure on which participants reported how much the
stories mentioned students’ backgrounds on a scale from 1 (not at all) to 7 (very often).3
Mediators of academic performance (Times 1 and 2). We measured social fit and
academic empowerment on a scale from 1 (strongly disagree) to 7 (strongly agree). We
measured these at Time 1 to obtain preliminary evidence that the intervention affected students
as predicted, and at Time 2 to serve as mediators of academic performance.
3 As in Study 1, we measured participants’ reactions to the stories as well as their perceptions of their college experiences. On reactions to the stories, we found no significant effects of generation status, intervention condition, or their interaction. On several of the measures of perceptions of college experiences, we found significant or marginal generation status × condition interactions, which supported our theorizing. See the supplemental material for more information.
19
DIFFERENCE-EDUCATION CLOSES ACHIEVEMENT GAP
Social fit. On three items, participants reported whether they felt that they belonged or fit
in at their university, Time 1: = .78, M = 5.29, SD = 1.35, Time 2: = .85, M = 5.10, SD =
1.42. Two items were from Walton and Cohen (2007), see Study 1 for example item. We created
the final item, “I expect that I will have to become a different person to fit in at [university
name]” (reverse-coded).
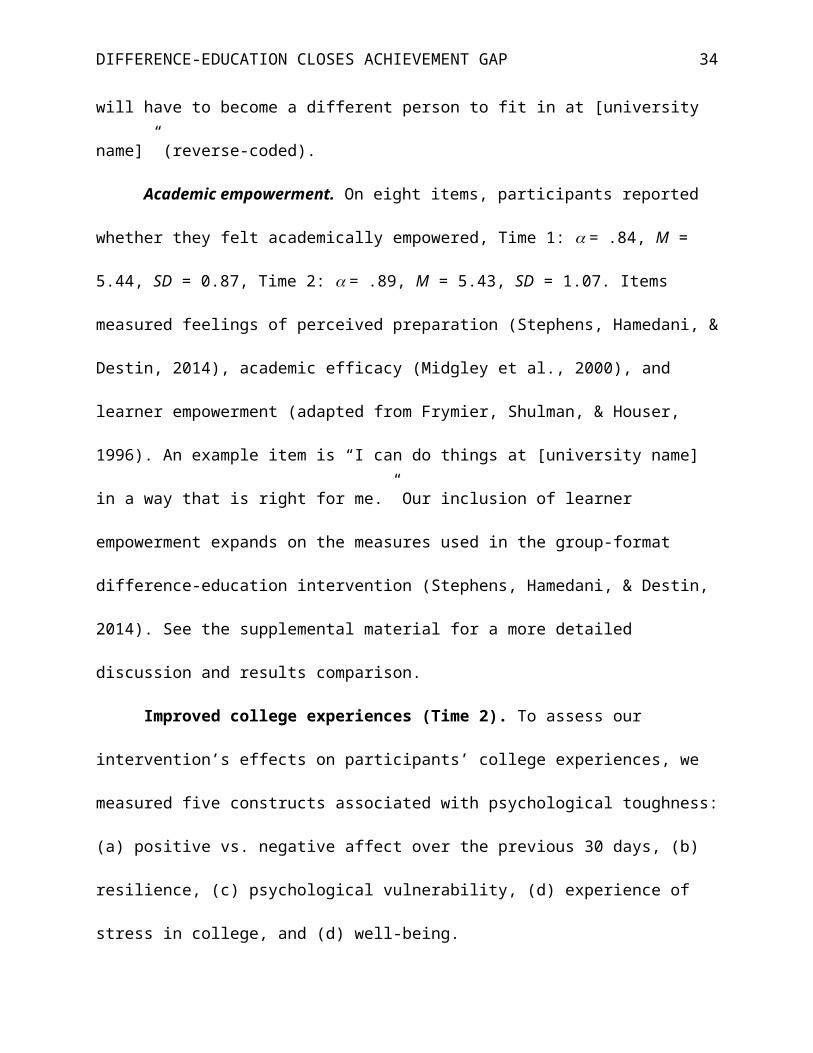
Academic empowerment. On eight items, participants reported whether they felt
academically empowered, Time 1: = .84, M = 5.44, SD = 0.87, Time 2: = .89, M = 5.43, SD
= 1.07. Items measured feelings of perceived preparation (Stephens, Hamedani, & Destin, 2014),
academic efficacy (Midgley et al., 2000), and learner empowerment (adapted from Frymier,
Shulman, & Houser, 1996). An example item is “I can do things at [university name] in a way
that is right for me.” Our inclusion of learner empowerment expands on the measures used in the
group-format difference-education intervention (Stephens, Hamedani, & Destin, 2014). See the
supplemental material for a more detailed discussion and results comparison.
Improved college experiences (Time 2). To assess our intervention’s effects on
participants’ college experiences, we measured five constructs associated with psychological
toughness: (a) positive vs. negative affect over the previous 30 days, (b) resilience, (c)
psychological vulnerability, (d) experience of stress in college, and (d) well-being.
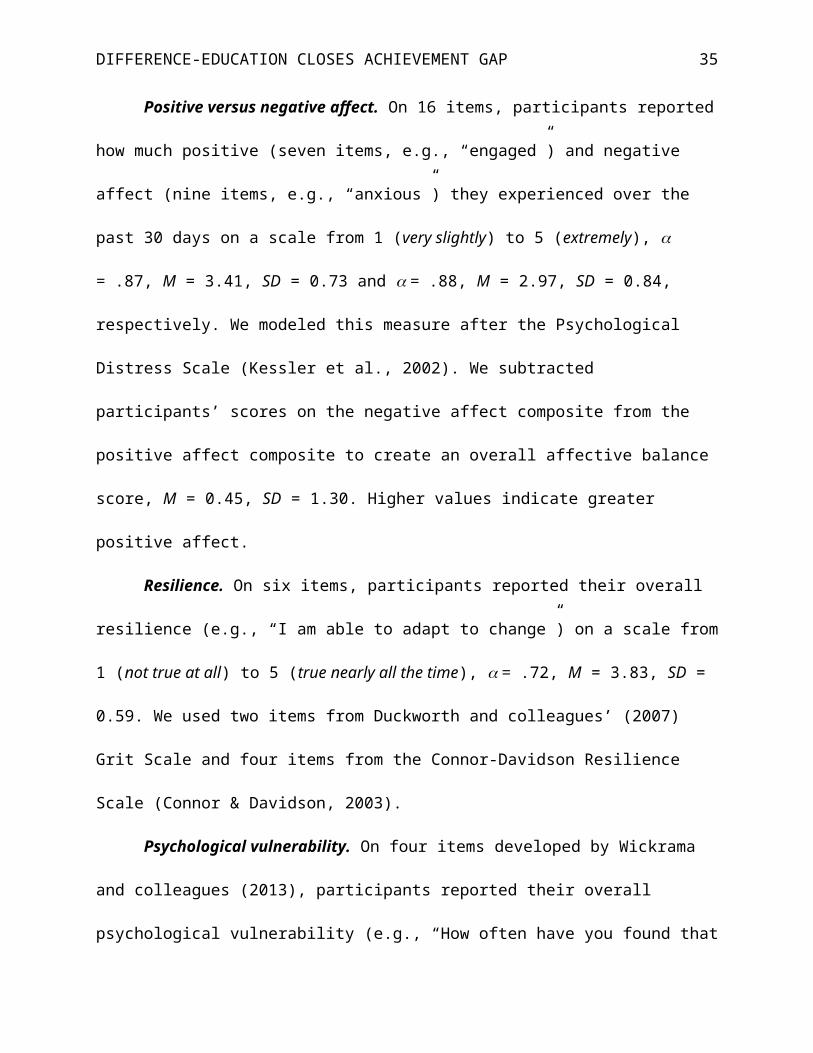
Positive versus negative affect. On 16 items, participants reported how much positive
(seven items, e.g., “engaged”) and negative affect (nine items, e.g., “anxious”) they experienced
over the past 30 days on a scale from 1 (very slightly) to 5 (extremely), = .87, M = 3.41, SD =
0.73 and = .88, M = 2.97, SD = 0.84, respectively. We modeled this measure after the
Psychological Distress Scale (Kessler et al., 2002). We subtracted participants’ scores on the
negative affect composite from the positive affect composite to create an overall affective
20
DIFFERENCE-EDUCATION CLOSES ACHIEVEMENT GAP
balance score, M = 0.45, SD = 1.30. Higher values indicate greater positive affect.
Resilience. On six items, participants reported their overall resilience (e.g., “I am able to
adapt to change”) on a scale from 1 (not true at all) to 5 (true nearly all the time), = .72, M =
3.83, SD = 0.59. We used two items from Duckworth and colleagues’ (2007) Grit Scale and four
items from the Connor-Davidson Resilience Scale (Connor & Davidson, 2003).
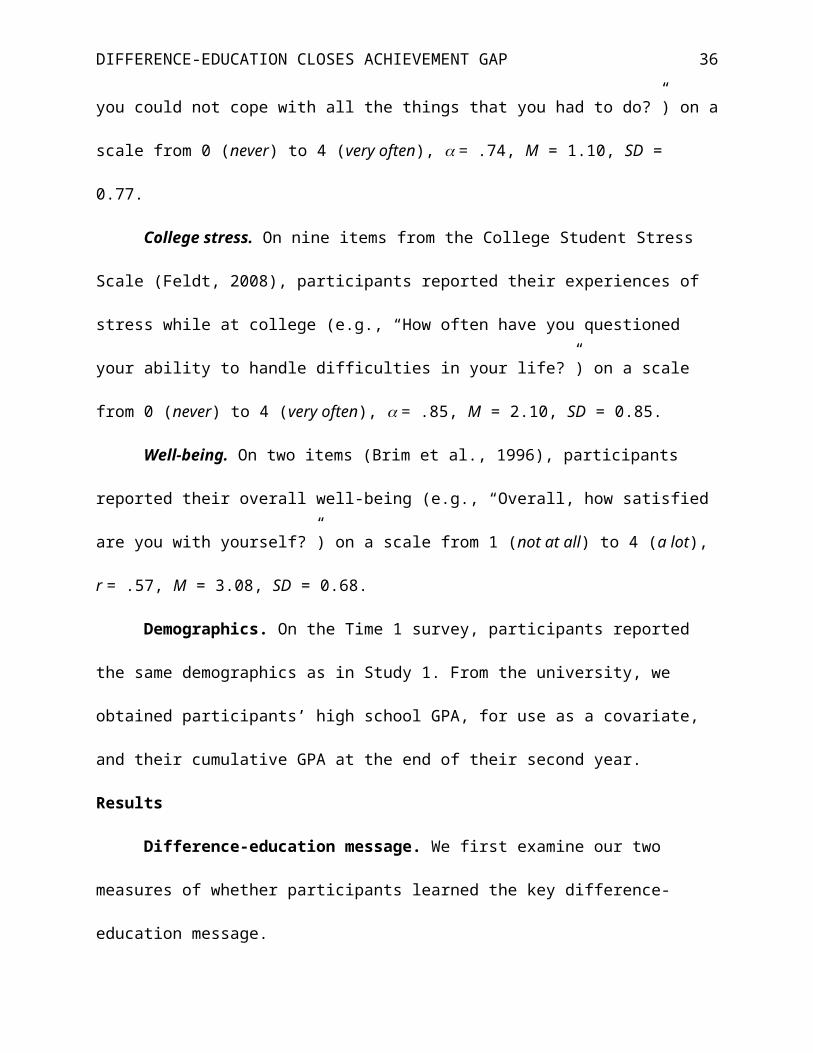
Psychological vulnerability. On four items developed by Wickrama and colleagues
(2013), participants reported their overall psychological vulnerability (e.g., “How often have you
found that you could not cope with all the things that you had to do?”) on a scale from 0 (never)
to 4 (very often), = .74, M = 1.10, SD = 0.77.
College stress. On nine items from the College Student Stress Scale (Feldt, 2008),
participants reported their experiences of stress while at college (e.g., “How often have you
questioned your ability to handle difficulties in your life?”) on a scale from 0 (never) to 4 (very
often), = .85, M = 2.10, SD = 0.85.
Well-being. On two items (Brim et al., 1996), participants reported their overall well-
being (e.g., “Overall, how satisfied are you with yourself?”) on a scale from 1 (not at all) to 4 (a
lot), r = .57, M = 3.08, SD = 0.68.
Demographics. On the Time 1 survey, participants reported the same demographics as in
Study 1. From the university, we obtained participants’ high school GPA, for use as a covariate,
and their cumulative GPA at the end of their second year.
Results
Difference-education message. We first examine our two measures of whether
participants learned the key difference-education message.
21
DIFFERENCE-EDUCATION CLOSES ACHIEVEMENT GAP
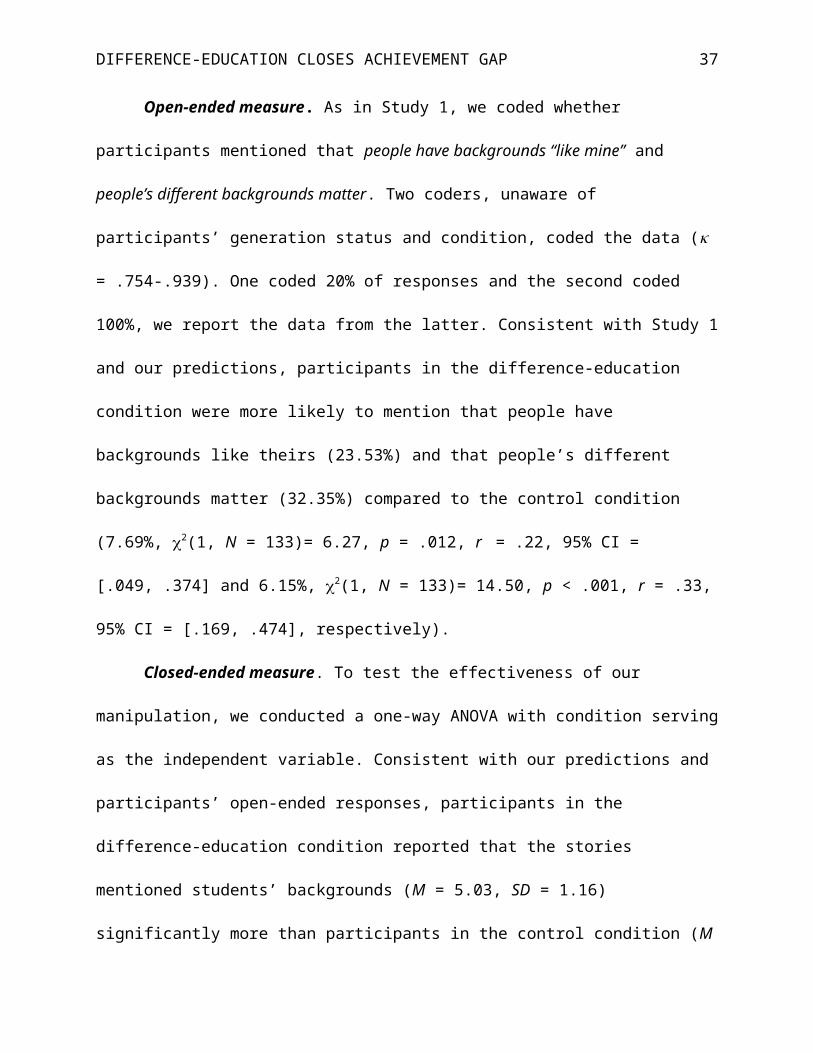
Open-ended measure. As in Study 1, we coded whether participants mentioned that
people have backgrounds “like mine” and people’s different backgrounds matter. Two coders,
unaware of participants’ generation status and condition, coded the data ( = .754-.939). One
coded 20% of responses and the second coded 100%, we report the data from the latter.
Consistent with Study 1 and our predictions, participants in the difference-education condition
were more likely to mention that people have backgrounds like theirs (23.53%) and that people’s
different backgrounds matter (32.35%) compared to the control condition (7.69%, 2(1, N =
133)= 6.27, p = .012, r = .22, 95% CI = [.049, .374] and 6.15%, 2(1, N = 133)= 14.50, p < .001,
r = .33, 95% CI = [.169, .474], respectively).
Closed-ended measure. To test the effectiveness of our manipulation, we conducted a
one-way ANOVA with condition serving as the independent variable. Consistent with our
predictions and participants’ open-ended responses, participants in the difference-education
condition reported that the stories mentioned students’ backgrounds (M = 5.03, SD = 1.16)
significantly more than participants in the control condition (M = 3.06, SD = 1.16; F(1, 131)=
95.96, p < .001, p2 = .423 [.314, .510]).
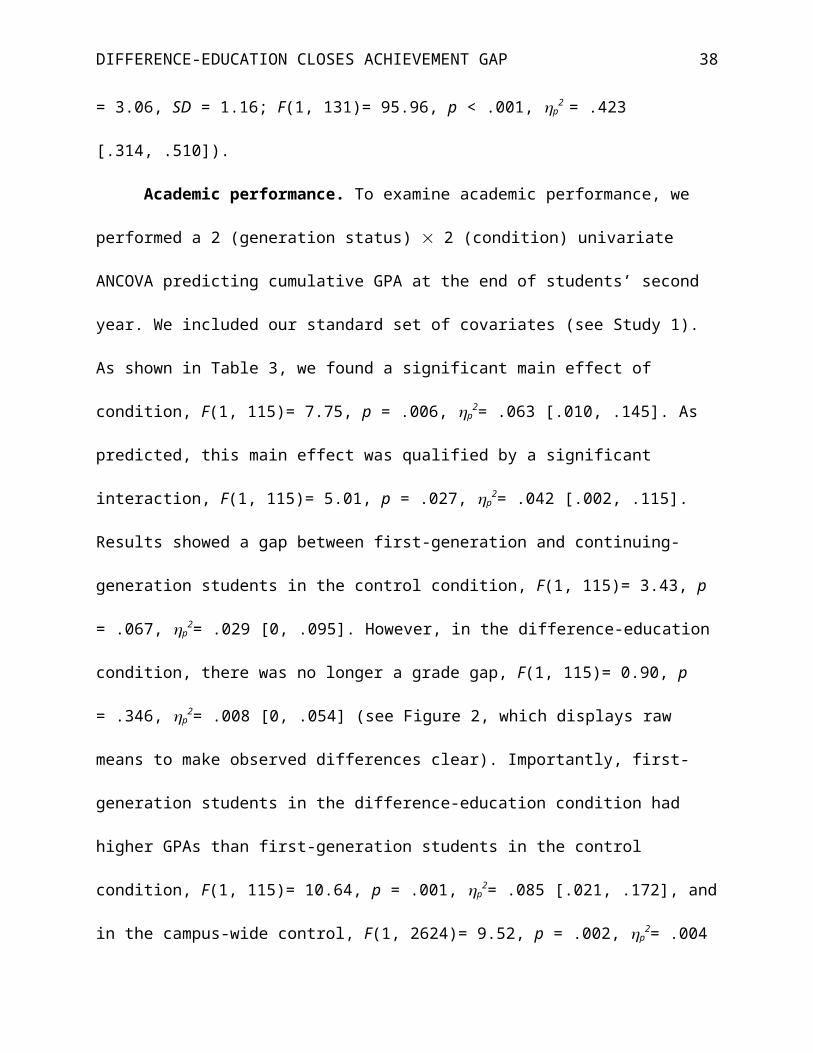
Academic performance. To examine academic performance, we performed a 2
(generation status) 2 (condition) univariate ANCOVA predicting cumulative GPA at the end
of students’ second year. We included our standard set of covariates (see Study 1). As shown in
Table 3, we found a significant main effect of condition, F(1, 115)= 7.75, p = .006, p2= .063
[.010, .145]. As predicted, this main effect was qualified by a significant interaction, F(1, 115)=
5.01, p = .027, p2= .042 [.002, .115]. Results showed a gap between first-generation and
continuing-generation students in the control condition, F(1, 115)= 3.43, p = .067, p2= .029
[0, .095]. However, in the difference-education condition, there was no longer a grade gap, F(1,
22
DIFFERENCE-EDUCATION CLOSES ACHIEVEMENT GAP
115)= 0.90, p = .346, p2= .008 [0, .054] (see Figure 2, which displays raw means to make
observed differences clear). Importantly, first-generation students in the difference-education
condition had higher GPAs than first-generation students in the control condition, F(1, 115)=
10.64, p = .001, p2= .085 [.021, .172], and in the campus-wide control, F(1, 2624)= 9.52, p
= .002, p2= .004 [0, .008]. In contrast, continuing-generation students in the difference-
education condition did not differ from those in the control condition, F(1, 115)= 0.19, p = .661,
p2= .002 [0, .034], nor from those in the campus-wide control group, F(1, 2624)= 1.56, p = .212,
p2= .001 [0, .003].4
Potential mediators. To examine our potential mediators, we performed a series of 2
(generation status) 2 (condition) univariate ANCOVAs for social fit and academic
empowerment (Times 1 and 2; see Table 3), using our standard set of covariates.
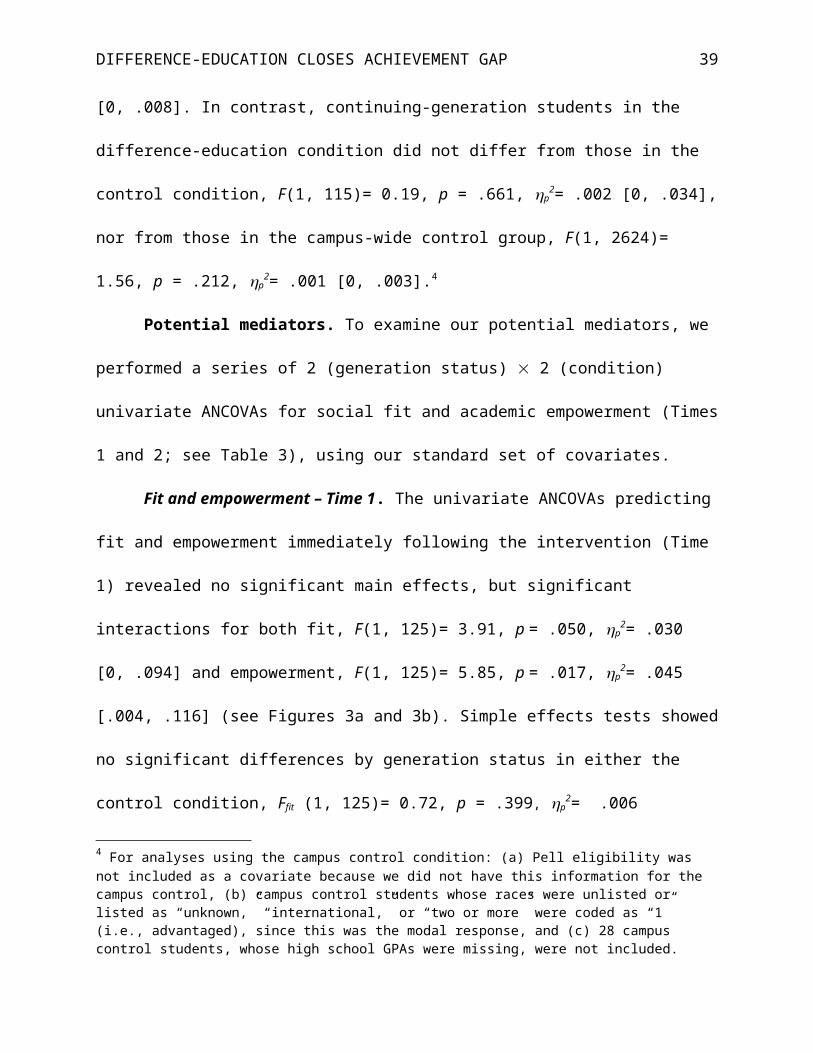
Fit and empowerment – Time 1. The univariate ANCOVAs predicting fit and
empowerment immediately following the intervention (Time 1) revealed no significant main
effects, but significant interactions for both fit, F(1, 125)= 3.91, p = .050, p2= .030 [0, .094] and
empowerment, F(1, 125)= 5.85, p = .017, p2= .045 [.004, .116] (see Figures 3a and 3b). Simple
effects tests showed no significant differences by generation status in either the control
condition, Ffit (1, 125)= 0.72, p = .399, p2= .006 [0, .047] and Fempowerment (1, 125)= 2.09, p
= .151, p2= .016 [0, .070], or the difference-education condition, Ffit (1, 125)= 2.56, p = .112,
p2= .020 [0, .077] and Fempowerment (1, 125)= 2.38, p = .125, p
2= .019 [0, .074]. Nonetheless,
among first-generation students, the difference-education condition, compared to control,
increased fit, F(1, 125)= 5.09, p = .026, p2= .039 [.002, .108], and empowerment (marginally),
4 For analyses using the campus control condition: (a) Pell eligibility was not included as a covariate because we did not have this information for the campus control, (b) campus control students whose races were unlisted or listed as “unknown,” “international,” or “two or more” were coded as “1” (i.e., advantaged), since this was the modal response, and (c) 28 campus control students, whose high school GPAs were missing, were not included.
23
DIFFERENCE-EDUCATION CLOSES ACHIEVEMENT GAP
F(1, 125)= 3.62, p = .060, p2= .028 [0, .091]. In contrast, among continuing-generation students,
neither fit nor empowerment differed by condition, Ffit(1, 125)= 0.14, p = .708, p2= .001
[0, .028] and Fempowerment(1, 125)= 2.23, p = .138, p2= .018 [0, .072].
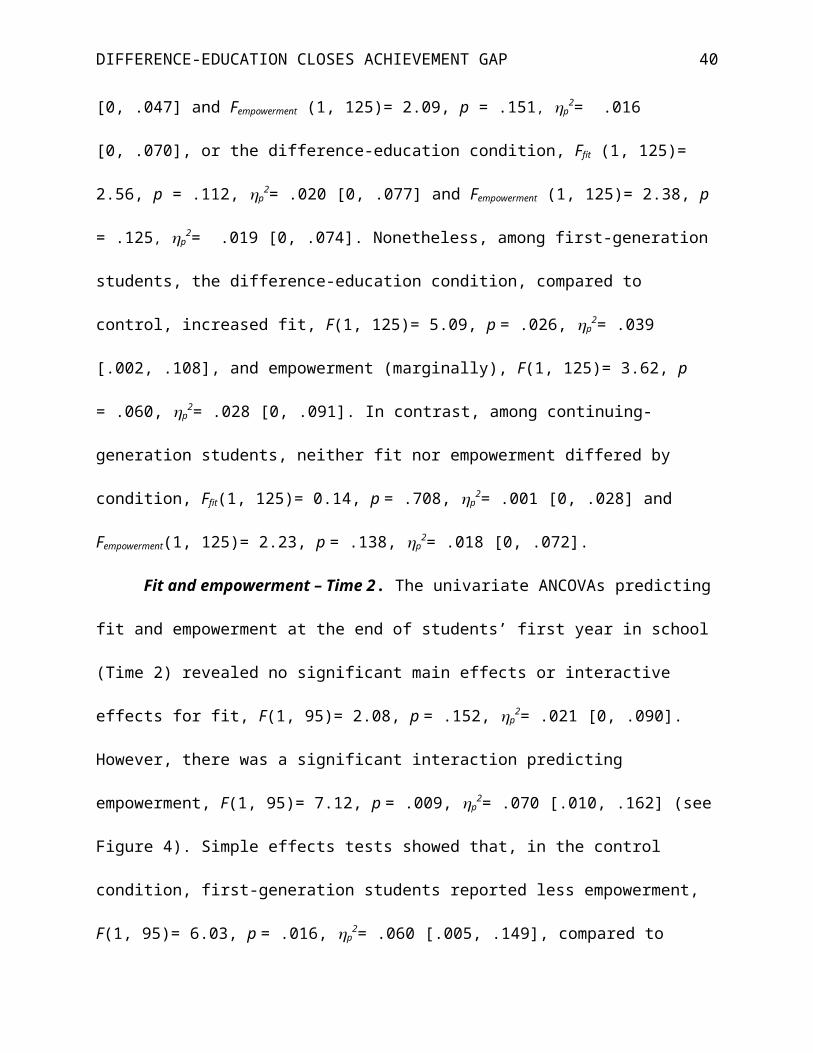
Fit and empowerment – Time 2. The univariate ANCOVAs predicting fit and
empowerment at the end of students’ first year in school (Time 2) revealed no significant main
effects or interactive effects for fit, F(1, 95)= 2.08, p = .152, p2= .021 [0, .090]. However, there
was a significant interaction predicting empowerment, F(1, 95)= 7.12, p = .009, p2= .070
[.010, .162] (see Figure 4). Simple effects tests showed that, in the control condition, first-
generation students reported less empowerment, F(1, 95)= 6.03, p = .016, p2= .060 [.005, .149],
compared to continuing-generation students. In contrast, this social class difference was not
present in the difference-education condition, F(1, 95)= 0.52, p = .473, p2= .005 [0, .054].
Importantly, these changes are due to increased empowerment among first-generation students in
the difference-education compared to control condition, F(1, 95)= 5.81, p = .018, p2= .058
[.005, .146]. Among continuing-generation students, empowerment did not differ across
conditions, F(1, 95)= 1.68, p = .198, p2= .017 [0, .082].
Moderated meditation analyses. Next we examined whether the difference-education
intervention improved first-generation students’ academic performance by increasing their
academic empowerment at Time 2. Specifically, we conducted moderated mediation analyses
with participants’ empowerment as the mediator between intervention condition and academic
performance with generational status as the moderator of both the direct and indirect paths
(Hayes, 2013; PROCESS macro for SPSS 23, Model 8). We conducted the analysis with 20,000
bootstrap resamples, including our standard set of covariates. We did not examine Time 2 social
fit given the condition generation status interaction was not significant.
24
DIFFERENCE-EDUCATION CLOSES ACHIEVEMENT GAP
Results show a mediating role of academic empowerment, b = -0.1545, SEboot = .0745,
95% CI = [-0.3376, -0.0400]. As predicted, the indirect effect was significant among first-
generation students, b = .1051, SEboot = .0620, 95% CI = [0.0100, 0.2584], such that those in the
difference-education, compared to control, condition felt greater academic empowerment, which
led to higher academic performance. In contrast, the indirect effect was not significant among
continuing-generation students, b = -.0494, SEboot = .0314, 95% CI = [-0.1250, 0.0024].
Improved college experiences – Time 2. To examine our predictions regarding
improved college experiences, we conducted 2 (generation status) 2 (condition) MANCOVAs
with our standard set of covariates and the five outcomes associated with psychological
toughness. We found a marginal interaction, F(5, 91)= 2.11, p = .071, p2 = .104 [0, .167].5
Subsequently, we tested our directional predictions with univariate ANCOVAs, which showed
patterns consistent with our predictions on three measures: a marginal interaction for positive vs.
negative affect, F(1, 95)= 3.48, p = .065, p2= .035 [0, .113], a significant interaction for
resilience, F(1, 95)= 5.67, p = .019, p2= .056 [.005, .144], and a marginal interaction for
psychological vulnerability, F(1, 95)= 3.51, p = .064, p2= .036 [0, .114]. Below we report the
results of simple effects tests. Two measures, experience of stress in college and well-being,
showed nonsignificant interactions (see Table 4 for results of these ANCOVAs).6
Positive vs. negative affect. There were no significant differences by generation status in
the control condition, F(1, 95)= 0.03, p = .867, p2< .000 [0, .013]. Among participants in the
difference-education condition, first-generation students exhibited significantly higher positive
versus negative affect compared to continuing-generation students, F(1, 95)= 5.10, p = .026, p2=
5 We included five additional measures related to academic and social engagement, five additional measures related to social fit, and a measure of responses to common college scenarios. See the supplemental material for more information.6 Follow-up moderated mediation analyses suggest that these psychological benefits did not mediate students’ improved academic performance, see the supplemental material.
25
DIFFERENCE-EDUCATION CLOSES ACHIEVEMENT GAP
.051 [.003, .137]. Importantly, as predicted, the difference-education intervention increased first-
generation students’ positive versus negative affect compared to the control condition, F(1, 95)=
4.01, p = .048, p2= .041 [0, .121]. Continuing-generation students did not differ across
conditions, F(1, 95)= 0.28, p = .600, p2= .003 [0, .045].
Resilience. Among participants in the control condition, first-generation students
reported marginally less resilience, F(1, 95)= 3.48, p = .065, p2= .035 [0, .113], compared to
continuing-generation students. However, these differences were not present in our difference-
education intervention, F(1, 95)= 1.03, p = .313, p2= .011 [0, .068]. Importantly, these changes
are due to increased resilience among first-generation students in the difference-education
compared to control condition, F(1, 95)= 3.99, p = .049, p2= .040 [0, .121]. Continuing-
generation students did not differ across conditions, F(1, 95)= 1.80, p = .183, p2= .019 [0, .084].
Psychological vulnerability. Although the pattern matched our predictions, none of the
simple effects for psychological vulnerability approached significance, Fs < 2.29, ps > .133, p2s
< .024.
Discussion
Supporting our theorizing, the individually administered difference-education
intervention closed the social class achievement gap between first-generation and continuing-
generation students at the end of their second year in college. Although a social class GPA gap
was present in both the intervention control and campus-wide control, there was no gap in the
difference-education condition because first-generation students improved their academic
performance. Our moderated mediation analyses revealed that their improved GPA was
explained by an increase in their academic empowerment. Interestingly, our intervention
improved first-generation students’ feelings of social fit immediately following the intervention,
26
DIFFERENCE-EDUCATION CLOSES ACHIEVEMENT GAP
however, the size of this effect was reduced by the end of the first year in college (p2= .032 at
Time 1 vs. p2= .021 at Time 2). In contrast, the interaction effect on students’ academic
empowerment was greater at the end of students’ first year than immediately following the
intervention (p2= .043 at Time 1 vs. p
2= .069 at Time 2). Our results suggest that difference-
education improves grades primarily by increasing empowerment.
Beyond our key theoretical contribution of showing that educating students about
difference can be effective in an individual format, Study 2’s results also extend previous
research in two additional ways. First, we found evidence that difference-education improves
first-generation students’ college experiences by affording psychological benefits not previously
shown. Specifically, we found that difference-education intervention provided first-generation
students with increased psychological toughness (e.g., resilience and positive vs. negative affect),
which were not measured in the group-format intervention. Second, our results extend the
generalizability of difference-education interventions to other universities, providing initial
evidence that they may be effective at closing performance gaps in universities with larger
proportions of first-generation students.
General Discussion
I enjoyed [the stories] because I was able to connect to those that told about their heritage
playing a part in their school choice as well as the fact that college was not a reality for
some parents. Neither of my parents attended college . . . I take comfort in the normality
of the situation and I look forward to what is to come [emphasis added].
– First-generation student in the difference-education condition
As illustrated in the above quote, teaching students about difference individually can be
nonthreatening and empowering. Across both studies, students who read the difference-education
27
DIFFERENCE-EDUCATION CLOSES ACHIEVEMENT GAP
stories more often reported that other students have backgrounds like theirs and that students’
different backgrounds matter. In Study 2, providing students with the difference-education
message closed the social class achievement gap by increasing first-generation students’ sense of
academic empowerment. The intervention also carried additional psychological benefits for first-
generation students, extendign the outcomes potentially improved by difference-education to
include psychological toughness. Specifically, compared to the control condition, first-generation
students in the difference-education intervention reported greater positive relative to negative
affect and greater resilience, suggesting that difference-education can improve disadvantaged
students’ persistence in the face of challenges. This study also increases the generalizability of
the approach as it was conducted in a different university than the group-format intervention.
Theoretically, the present work makes two novel contributions to the literatures on
intergroup relations and social psychological interventions. First, it suggests that an individually
administered intervention that teaches students about social difference need not be threatening,
as proposed by some prominent social psychological theories (e.g., Turner et al., 1987). Indeed,
our findings indicate that the academic performance benefits of teaching disadvantaged students
about how their backgrounds matter do not rely on the in-person, group-settings used in previous
work on diversity courses, intergroup dialogues, or difference-education interventions. Instead,
this work suggests that the contextual, asset-based understanding of difference can be
empowering and improve students’ academic performance nearly two years later.
Second, our work demonstrates one key process though which difference-education
improves academic performance, i.e., by increasing disadvantaged students’ psychological
empowerment. This builds on the previous difference-education intervention, which found that
the group-format improved first-generation students’ grades by increasing their behavioral
28
DIFFERENCE-EDUCATION CLOSES ACHIEVEMENT GAP
empowerment (i.e., tendency to seek campus resources). Our findings offer new insight into the
psychological process underlying why first-generation students may have been more likely to
seek such resources (i.e., psychological empowerment may have increased their behavioral
empowerment).
We do not mean to suggest that any discussion of difference will be beneficial and
nonthreatening to college students. Rather, we theorize that it is critical to present the difference-
education message in a way that renders it nonthreatening and identity-safe. For example, we
theorize that it is important to showcase the stories of both disadvantaged and advantaged
students. In this way, disadvantaged students are not singled out and students’ differences are
portrayed as both normal and relevant to everyone (cf. Plaut et al., 2011).
Social psychological interventions have demonstrated that having individuals complete
relatively short reading and writing tasks can improve the long-term outcomes of disadvantaged
students and close performance gaps (Cohen & Sherman, 2014; Wilson, 2011; Yeager & Walton,
2011). Importantly, these interventions have been effective at scale (Yeager et al., 2016). By
demonstrating that it is possible for disadvantaged students to benefit from learning about
difference in an individual, rather than group, format, our results suggest that difference-
education has potential to be effective at scale, while at the same time, helping students develop
the critical skill of understanding how different backgrounds matter in today’s global,
multicultural society.
Limitations and Future Directions
Results of the current, individually administered intervention replicate the primary
finding from the previous test of difference-education—i.e., it closed the social class
achievement gap by improving first-generation students’ grades. In addition, the mechanism
29
DIFFERENCE-EDUCATION CLOSES ACHIEVEMENT GAP
through which the intervention had this effect was similar. Stephens, Hamedani, and Destin’s
(2014) study improved grades via a measure of behavioral empowerment, and we find evidence
that the intervention improved first-generation students’ grades through an increase in
psychological empowerment. These results converge to suggest that difference-education
improves grades through empowerment.
However, there are two key ways in which the findings differ. In particular, the group-
format difference-education intervention improved a wide range of psychological outcomes, and
did so for both continuing-generation and first-generation students. In contrast, the current study
finds fewer psychological benefits, and those that emerge only do so among first-generation
students (e.g., affect and resilience, also see the supplemental material for additional
information). There are a few reasons why this could have occurred. Fewer psychological
benefits might be a result of attrition and therefore reduced power in our one-year follow-up
survey. This conclusion is consistent with our results showing more psychological benefits
immediately following the intervention (i.e., Time 1; see the supplemental material for additional
information). As for the findings only among first-generation students, this could be a function of
the different university contexts and/or different formats in which the interventions were
delivered. Given that the two studies were conducted at different universities, it is possible that
differences in the university climates (e.g., university selectivity or culture) underlie the differing
results. Alternatively, the group experience in the first intervention study may have made the
information more helpful for continuing-generation students, relative to reading the information
individually and online.
Future research should also investigate the effectiveness of difference-education
interventions in an even broader range of higher education contexts with different climates. Such
30
DIFFERENCE-EDUCATION CLOSES ACHIEVEMENT GAP
research will reveal when both continuing-generation and first-generation students benefit from
difference-education. This work will also advance theory by further illuminating the process
through which difference-education benefits students. For example, will improvements in first-
generation students’ performance be mediated though increased empowerment when institutions
offer fewer of the resources from which empowered students might benefit? It will also be
important to examine less selective colleges and universities, as well as community colleges.
Testing the effectiveness of our intervention approach in such contexts is practically important
because the majority of first-generation students attend these types of institutions (Engle, 2007).
Finally, as is the case with other social psychological interventions, it remains unclear
which specific aspect(s) of our message drive the intervention’s effects. The difference-education
message conveys the contextual and asset-based understanding that students’ backgrounds matter
in college in both good and bad ways. Would the intervention be effective if it only contained
information about students’ strengths and strategies and did not mention obstacles? Future
research should examine which components of the message are necessary and sufficient for
producing the interventions benefits.
Conclusion
Universities bring together students from diverse backgrounds, but they often fail to fully
leverage the benefits of that diversity. One reason is that these institutions themselves are often
set up according to middle-class and European American ideas, values, and practices. As a result,
disadvantaged students, whose backgrounds diverge from this cultural standard, often experience
a lack of fit and empowerment, which can undermine their opportunity to succeed. The present
research suggests that individually educating disadvantaged students about how their different
backgrounds matter in college has potential to empower them and, thereby, improve their
31
DIFFERENCE-EDUCATION CLOSES ACHIEVEMENT GAP
performance. Ultimately, difference-education can enable colleges and universities to create
more inclusive and empowering environments, in which students from diverse backgrounds have
a greater opportunity to succeed.
32
DIFFERENCE-EDUCATION CLOSES ACHIEVEMENT GAP
References
Bourdieu, P., & Passeron, J. C. (1990). Reproduction in education, society and culture. London,
England: Sage.
Brim, O. G., Baltes, P. B., Bumpass, L. L., Cleary, P. D., Featherman, D. L., Hazzard, W. R.,
….Shweder, R. A. (1996). “National survey of midlife development in the United States
(MIDUS)” (Inter-university Consortium for Political and Social Research, Ann Arbor,
MI).
Cabrera, N. L., Milem, J. F., Jaquette, O., & Marx, R. W. (2014). Missing the (student
achievement) forest for all the (political) trees: Empiricism and the Mexican American
studies controversy in Tucson. American Educational Research Journal, 51(6), 1084-
1118. doi:10.3102/0002831214553705
Carr, P. B., & Walton, G. M. (2014). Cues of working together fuel intrinsic motivation. Journal
of Experimental Social Psychology, 53, 169-184. doi:10.1016/j.jesp.2014.03.015
Cohen, G. L., & Sherman, D. K. (2014). The psychology of change: Self-affirmation and social
psychological intervention. Annual Review of Psychology, 65, 333-371.
doi:10.1146/annurev-psych-010213-115137
Connor, K. M., & Davidson, J. R. T. (2003). Development of a new resilience scale: The
Connor-Davidson Resilience Scale (CD-RISC). Depression and Anxiety, 18(2), 76-82.
doi:10.1002/da.10113
Croizet, J. -C., & Claire, T. (1998). Extending the concept of stereotype threat to social class:
The intellectual underperformance of students from low socioeconomic backgrounds.
Personality and Social Psychology Bulletin, 24(6), 588–594.
doi:10.1177/0146167298246003
33
DIFFERENCE-EDUCATION CLOSES ACHIEVEMENT GAP
Croizet, J. -C., & Millet, M. (2011). Social class and test performance: From stereotype threat to
symbolic violence and vice versa. In M. Inzlicht & T. Schmader (Eds.), Stereotype
threat: Theory, process, and application (pp. 188-201). New York, NY: Oxford
University Press.
Dee, T. S., & Penner, E. K. (2016). The causal effects of cultural relevance: Evidence from an
ethnic studies curriculum. American Educational Research Journal, 54(1), 127-166.
doi:10.3102/0002831216677002
Dovidio, J. F., & Gaertner, S. L. (2000). Aversive racism and selection decisions: 1989 and
1999. Psychological Science, 11(4), 315-319. doi:10.1111/1467-9280.00262
Duckworth, A. L., Peterson, C., Matthews, M. D., & Kelly, D. R. (2007). Grit: Perseverance and
passion for long-term goals. Journal of Personality and Social Psychology, 92(6), 1087-
1101. doi:10.1037/0022-3514.92.6.1087
Duncan, G. J., & Murnane, R. J. (2011). Whither opportunity? Rising inequality, schools, and
children's life chances. New York, NY: Russell Sage.
Engle, J. (2007). Postsecondary access and success for first-generation college students.
American Academic, 3(1), 25-48.
Feldt, R. C. (2008). Development of a brief measure of college stress: The College Student
Stress Scale. Psychological Reports, 102(3), 855-860. doi:10.2466/pr0.102.3.855-860
Fiske, S. T., & Markus, H. R. (Eds.). (2012). Facing social class: How societal rank influences
interaction. New York, NY: Russell Sage Foundation.
Frymier, A. B., Shulman, G. M., & Houser, M. (1996). The development of a learner
empowerment measure. Communication Education, 45(3), 181-199.
doi:10.1080/03634529609379048
34
DIFFERENCE-EDUCATION CLOSES ACHIEVEMENT GAP
Goudeau, S., & Croizet, J.-C. (2017). Hidden advantages and disadvantages of social class: How
classroom settings reproduce social inequality by staging unfair comparison.
Psychological Science, 28(2), 162-170. doi:10.1177/0956797616676600
Gurin, P., & Nagda, B. A. (2006). Getting to the what, how, and why of diversity on campus.
Educational Researcher, 35(1), 20-24. doi:10.3102/0013189X035001020
Gurin, P., Nagda, B. A., & Zúñiga, X. (2013). Dialogue across difference: Practice, theory, and
research on intergroup dialogue. New York, NY: Russell Sage Foundation.
Hayes, A. F. (2013). Introduction to Mediation, Moderation, and Conditional Process
Analysis: A Regression-Based Approach. New York, NY: The Guilford Press.
Hurtado, S. (2007). Linking diversity with the educational and civic missions of higher
education. The Review of Higher Education, 30(2), 185-196. doi:10.1353/rhe.2006.0070
Kao, G. (1995). Asian Americans as model minorities? A look at their academic
performance. American Journal of Education, 103(2), 121-159. doi:10.1086/444094
Kessler, R. C., Andrews, G., Colpe, L. J., Hiripi, E., Mroczek, D. K., Normand, S. L. T.,…
Zaslavsky, A. M. (2002). Short screening scales to monitor population prevalences and
trends in nonspecific psychological distress. Psychological Medicine, 32(6), 959-976.
Lakens, D. (2013). Calculating and reporting effect sizes to facilitate cumulative science: A
practical primer for t-tests and ANOVAs. Frontiers in Psychology, 4(863), 1-12.
doi:10.3389/fpsyg.2013.00863
Lewin, K. (1952). Group decision and social change. In G. E. Swanson, T. M. Newcomb, & E.
L. Hartley (Eds.), Readings in social psychology (2nd ed., pp. 330– 344). New York, NY:
Henry Holt.
35
DIFFERENCE-EDUCATION CLOSES ACHIEVEMENT GAP
Landis, J. R., & Koch, G. G. (1977). An application of hierarchical kappa-type statistics in the
assessment of majority agreement among multiple observers. Biometrics, 33, 363-374.
doi:10.2307/2529786
Midgley, C., Maehr, M. L., Hruda, L. Z., Anderman, E., Anderman, L.,
Freeman, K. E.,…Urdan, T. (2000). Manual for the Patterns of Adaptive
Learning Scale. Ann Arbor: University of Michigan.
Morrison, K. A., Robbins, H. H., & Rose, D. G. (2008). Operationalizing culturally relevant
pedagogy: A synthesis of classroom-based research. Equity & Excellence in
Education, 41(4), 433-452. doi:10.1080/10665680802400006
Ostrove, J. M., & Long, S. M. (2007). Social class and belonging: Implications for college
adjustment. The Review of Higher Education, 30(4), 363-389. doi:10.1353/rhe.2007.0028
Pascarella, E. T., Pierson, C. T., Wolniak, G. C., & Terenzini, P. T. (2004). First-generation
college students: Additional evidence on college experiences and outcomes. Journal of
Higher Education, 75(3), 249-284.
Plaut, V. C. (2010). Diversity science: Why and how difference makes a difference.
Psychological Inquiry, 21(2), 77-99. doi:10.1080/10478401003676501
Plaut, V. C., Garnett, F. G., Buffardi, L. E., & Sanchez-Burks, J. (2011). “What about me?”
Perceptions of exclusion and Whites' reactions to multiculturalism. Journal of
Personality and Social Psychology, 101(2), 337-353. doi:10.1037/a0022832
Reay, D., Crozier, G., & Clayton, J. (2009). ‘Strangers in paradise’? Working-class students in
elite universities. Sociology, 43(6), 1103-1121. doi:10.1177/0038038509345700
Shteynberg, G. (2015). Shared attention. Perspectives on Psychological Science, 10(5), 579-590.
doi:10.1177/1745691615589104
36
DIFFERENCE-EDUCATION CLOSES ACHIEVEMENT GAP
Shteynberg, G., & Apfelbaum, E. P. (2013). The power of shared experience: simultaneous
observation with similar others facilitates social learning. Social Psychological and
Personality Science, 4(6), 738-744. doi:10.1177/1948550613479807
Simmons, J. P., Nelson, L. D., & Simonsohn, U. (2011). False-positive psychology: Undisclosed
flexibility in data collection and analysis allows presenting anything as significant.
Psychological Science, 22(11), 1359-1366. doi:10.1177/0956797611417632
Sirin, S. R. (2005). Socioeconomic status and academic achievement: A meta-analytic review of
research. Review of Educational Research, 75(3), 417-453.
doi:10.3102/00346543075003417
Steele, C. M. (2010). Whistling Vivaldi and other clues to how stereotypes affect us. New York,
NY: W.W. Norton & Company.
Stephens, N. M., Fryberg, S. A., Markus, H. R., Johnson, C. S., & Covarrubias, R. (2012).
Unseen disadvantage: How American universities' focus on independence undermines the
academic performance of first-generation college students. Journal of Personality and
Social Psychology, 102(6), 1178-1197. doi:10.1037/a0027143
Stephens, N. M., Hamedani, M. G., & Destin, M. (2014). Closing the social-class achievement
gap: A difference-education intervention improves first-generation students’ academic
performance and all students’ college transition. Psychological Science, 25(4), 943-953.
doi:10.1177/0956797613518349
Stephens, N. M., Hamedani, M. G., & Townsend, S. S. (2017). Leveraging a pride perspective
on difference to foster student achievement and success. Manuscript submitted for
publication.
37
DIFFERENCE-EDUCATION CLOSES ACHIEVEMENT GAP
Stephens, N. M., Markus, H. R., & Phillips, L. T. (2014). Social class culture cycles: How three
gateway contexts shape selves and fuel inequality. Annual Review of Psychology, 65,
611-634. doi:10.1146/annurev-psych-010213-115143
Stephens, N. M., Townsend, S. S., Hamedani, M. G., Destin, M., & Manzo, V. (2015). A
difference-education intervention equips first-generation college students to thrive in the
face of stressful college situations. Psychological Science, 26(10), 1556-1566.
doi:10.1177/0956797615593501
Turner, J. C., Hogg, M. A., Oakes, P. J., Reicher, S.D., & Wetherell, M. S. (1987). Rediscovering
the social group: A self-categorization theory. Cambridge, MA: Basil Blackwell.
Walton, G. M., & Cohen, G. L. (2007). A question of belonging: Race, social fit, and
achievement. Journal of Personality and Social Psychology, 92(1), 82-96.
doi:10.1037/0022-3514.92.1.82
Wickrama, K. A., Ralston, P. A., O’Neal, C. W., Illich, J. Z., Harris, C. M., Coccia, C.,…
Lemacks, J. (2013). Linking life dissatisfaction to health behaviors of older African
Americans through psychological competency and vulnerability. Research on Aging,
35(5), 591-611. doi:10.1177/0164027512449473
Wilson, T. D. (2011). Redirect: The surprising new science of psychological change. New York,
NY: Little, Brown.
Yeager, D. S., & Walton, G. M. (2011). Social-psychological interventions in education: They’re
not magic. Review of Educational Research, 81(2), 267–301.
doi:10.3102/0034654311405999
Yeager, D. S., Walton, G. M., Brady, S. T., Akcinar, E. N., Paunesku, D., Keane, L.,…Dweck,
C. S. (2016). Teaching a lay theory before college narrows achievement gaps at scale.
38
DIFFERENCE-EDUCATION CLOSES ACHIEVEMENT GAP
Proceedings of the National Academy of Sciences, 113(24), E3341-E3348.
doi:10.1073/pnas.1524360113
39
DIFFERENCE-EDUCATION CLOSES ACHIEVEMENT GAP
Table 1Between-condition Comparison of the Percentage of Responses Coded Within Each Coding Category
Chi-Square Analysis
Sample Response
Difference-education condition
Control condition
2
r [95% CI]
Coding Category
People have backgrounds “like mine”
It’s important to understand the different scenarios and backgrounds people are coming from, and to realize that 1) you’re not the only one, and 2) people are not all like you either.
I should acknowledge that there are people coming from similar backgrounds as me and not feel embarrassed about my financial situation.
30.98 9.43 8.28**.26 [.086, .415]
People’s different backgrounds matter
Everyone comes from such a different background and has different motives for doing well.
It is okay to be a first-generation college student. You will just have to figure more things out on your own which can enhance the college experience.
39.44 3.77 21.04***.41 [.254, .548]
Note. N = 124. Effect size is Pearson’s r followed by 95% confidence interval (CI).** p < .01, *** p < .001.
40
DIFFERENCE-EDUCATION CLOSES ACHIEVEMENT GAP
Table 2Univariate Analyses of Covariance Results for Perceptions of College Experiences in Study 1
Dependent Variable
Comfort in Interactions
Appreciation of Difference
Social Fit
Value of Working
with OthersF F F F
CovariateHigh School GPA 0.56 0.28 0.02 0.08Race and Ethnicity 0.06 0.02 0.48 0.04Gender 2.51 0.66 4.58* 1.15Low-income Status 0.90 0.65 0.07 2.92+
Main and Interactive EffectCondition 4.55* 0.45 1.00 0.06Generation 1.47 0.001 1.18 0.01Condition Generation 7.49** 0.14 0.74 0.95
Note. Degrees of freedom (df) for all dependent variables = 1, 116. GPA = grade point average, race and ethnicity (0 = disadvantaged, 1 = advantaged), gender (0 = male, 1 = female), low-income status (0 = low income, 1 = not low income), condition (0 = control, 1 = difference-education) and generation (0 = first-generation, 1 = continuing-generation). + p < .10, * p < .05, ** p < .01.
41
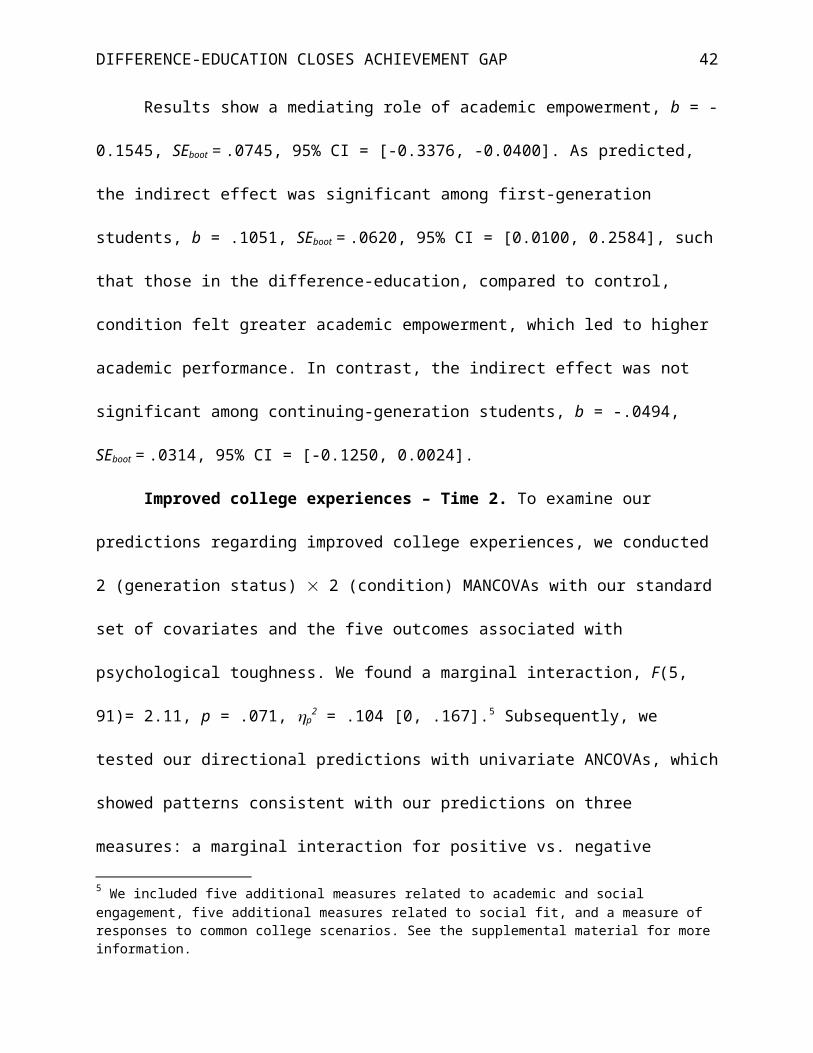
DIFFERENCE-EDUCATION CLOSES ACHIEVEMENT GAP
Table 3 Univariate Analysis of Covariance Results for Grade Point Average (GPA) and Potential Mediators in Study 2
VariableAcademic
Performance Academic Performance Mediators
GPASocial Fit Time 1
Academic Empowerment
Time 1Social Fit Time 2
Academic Empowerment
Time 2F F F F F
CovariateHigh School GPA 18.52*** 1.01 1.01 0.27 0.17Race and Ethnicity 0.38 0.46 0.13 0.58 0.01Gender 0.12 0.11 1.28 0.32 1.65Low-income Status 1.88 3.90+ 0.72 1.91 0.24
Main and Interactive EffectCondition 7.75** 2.24 0.26 0.26 1.06Generation 0.36 0.23 0.003 0.04 1.49Condition Generation 5.01* 3.91* 5.85* 2.08 7.12**
Note. Degrees of freedom (df) for GPA = 1, 115, df for both Time 1 academic performance mediators = 1, 125, df for both Time 2 academic performance mediators = 1, 95. GPA = grade point average, race and ethnicity (0 = disadvantaged, 1 = advantaged), gender (0 = male, 1 = female), low-income status (0 = low income, 1 = not low income), condition (0 = control, 1 = difference-education) and generation (0 = first-generation, 1 = continuing-generation). + p < .10, * p < .05, ** p < .01, *** p < .001.
42
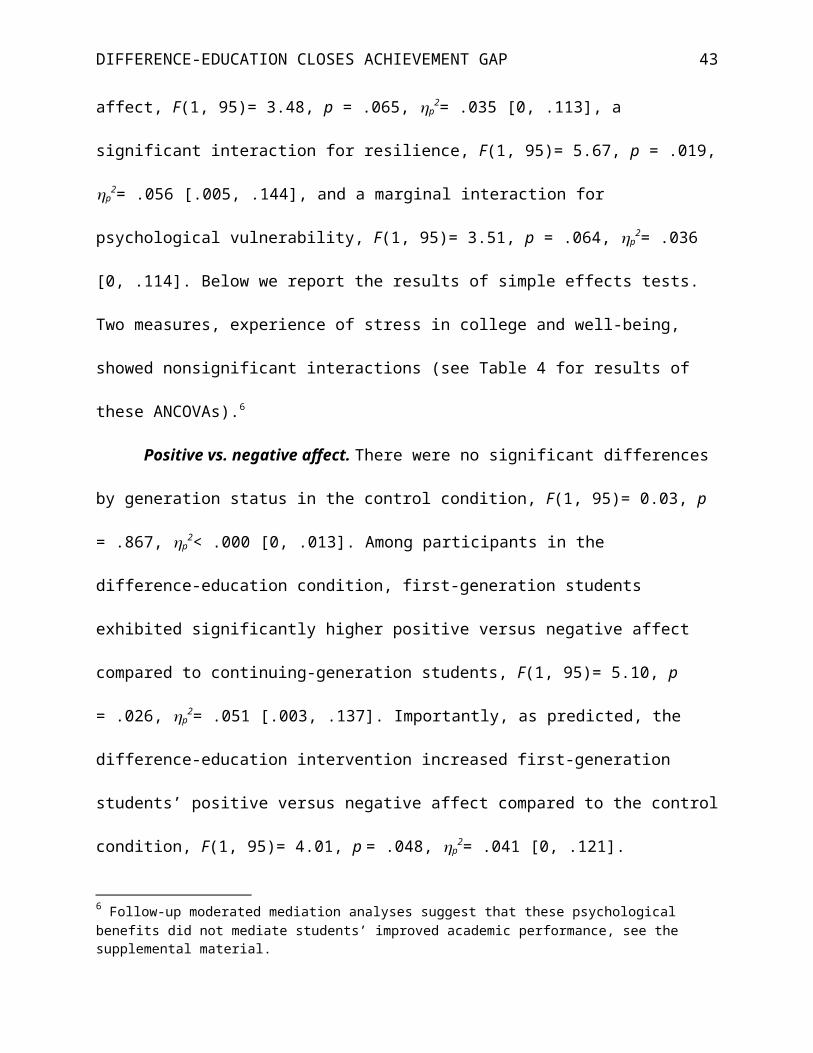
DIFFERENCE-EDUCATION CLOSES ACHIEVEMENT GAP
Table 4Univariate Analysis of Covariance Results for Indicators of Improved College Experiences in Study 2 (Time 2)
Positive vs. Negative
Affect ResiliencePsychological Vulnerability
College Stress Well-being
F F F F FCovariate
High School GPA 0.002 0.82 0.18 0.82 3.26+
Race and Ethnicity 0.95 0.16 0.60 0.03 2.44Gender 3.41+ 0.39 0.13 4.39* 0.06Low-income Status 5.76* 0.78 0.73 2.47 1.70
Main and Interactive EffectCondition 1.46 0.46 0.20 0.58 0.09Generation 1.51 0.42 0.03 0.20 0.11Condition Generation 3.48+ 5.67* 3.51+
0.09 2.03
Note. Degrees of freedom (df) for all dependent variables = 1, 95. GPA = grade point average, race and ethnicity (0 = disadvantaged, 1 = advantaged), gender (0 = male, 1 = female), low-income status (0 = low income, 1 = not low income), condition (0 = control, 1 = difference-education) and generation (0 = first-generation, 1 = continuing-generation). + p < .10, * p < .05.
43
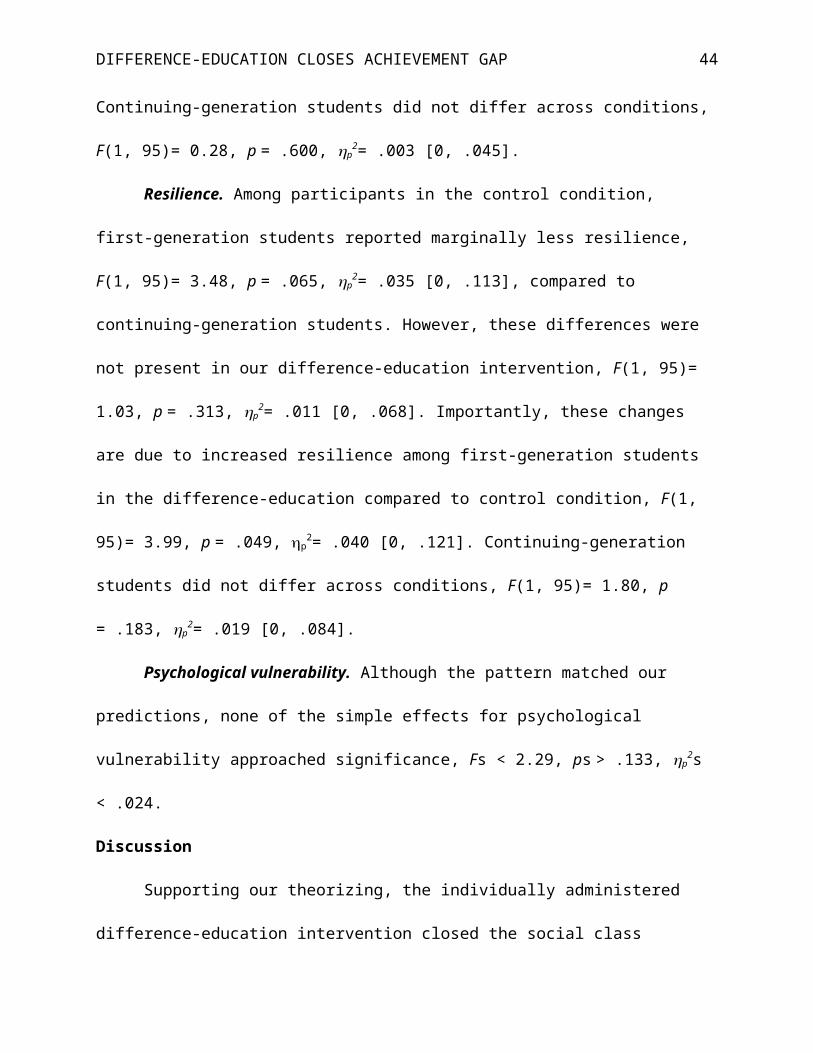
DIFFERENCE-EDUCATION CLOSES ACHIEVEMENT GAP
First-generation Continuing-generation3
3.5
4
4.5
5
5.5
6
6.5
7
Control Difference-educationC
omfo
rt in
Inte
ract
ions
*
**
Figure 1. Mean comfort in interactions as a function of generation status and intervention condition (Study 1). Error bars show standard errors of the mean. ** p < .01, * p < .05
44
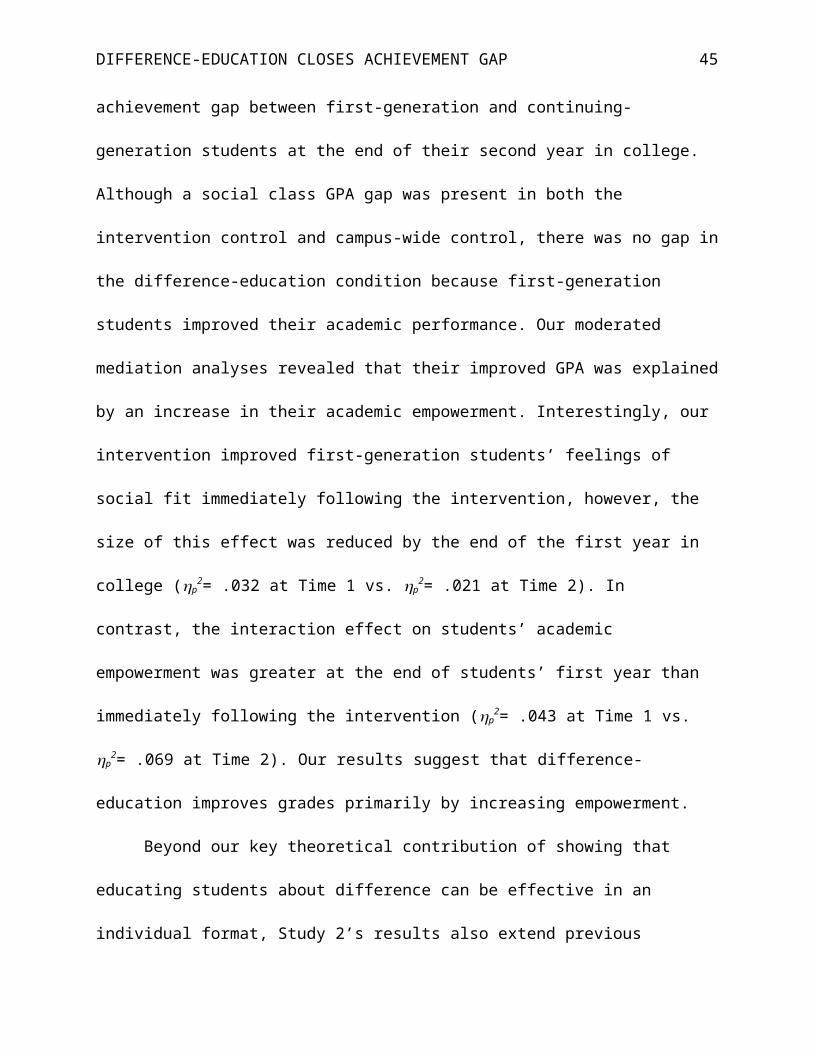
DIFFERENCE-EDUCATION CLOSES ACHIEVEMENT GAP
First-generation Continuing-generation2.2
2.4
2.6
2.8
3
3.2
3.4
3.6
3.8
4 Control Difference-educationA
cade
mic
Per
form
ance
(GP
A)
+
**
Figure 2. Mean cumulative grade point average (GPA) at the end of students’ second year as a function of generation status and intervention condition (Study 2). Error bars show standard errors of the mean. ** p < .01, + p < .10
45
DIFFERENCE-EDUCATION CLOSES ACHIEVEMENT GAP
First-generation Continuing-generation3
3.5
4
4.5
5
5.5
6
6.5
7
Control Difference-educationS
ocia
l Fit
**
First-generation Continuing-generation3
3.5
4
4.5
5
5.5
6
6.5
7
Control Difference-education
Aca
dem
ic E
mpo
wer
men
t
+
Figures 3a and 3b. Mean social fit and academic empowerment at Time 1 as a function of generation status and intervention condition (Study 2). Error bars show standard errors of the mean. ** p < .01, + p < .10
46
DIFFERENCE-EDUCATION CLOSES ACHIEVEMENT GAP
First-generation Continuing-generation3
3.5
4
4.5
5
5.5
6
6.5
7
Control Difference-educationA
cade
mic
Em
pow
erm
ent
*
*
Figure 4. Mean academic empowerment at Time 2 as a function of generation status and intervention condition (Study 2). Error bars show standard errors of the mean. * p < .05
47