Embed Size (px)
Citation preview

IMPORTANT TERMS demand demand schedule law of demand diminishing marginal utility income effect substitution effect demand curve determinants of demandnormal goods inferior goods substitute good complementary good change in demand change in quantity demanded supply supply schedule law of supply supply curve determinants of supply change in supply change in quantity supplied equilibrium price equilibrium quantity surplus shortage productive efficiency allocative efficiency price ceiling price floor
Demand, Supply, and Market Equilibrium
Chapter 3 introduces you to the most fundamental tools of economic analysis: demand and supply. Demand and supply are simply “boxes” or categories into which all the forces and factors that affect the price and the quantity of a good bought and sold in a competitive market are placed. Demand and supply determine price and quantity exchanged. It is necessary to understand why and how they do this.
Many students never learn to define demand and supply. They never learn (1) what an increase or decrease in demand or supply means, (2) the important distinctions between “demand” and “quantity demanded” and between “supply” and “quantity supplied,” and (3) the equally important distinctions between a change in demand and a change in quantity demanded and between a change in supply and a change in quantity supplied. Having learned these, however, it is no great trick to comprehend the so-called laws of demand and supply. The equilibrium price—that is, the price that will tend to prevail in the market as long as demand and supply do not change—is simply the price at which quantity demanded and quantity supplied are equal. The quantity bought and sold in the market (the equilibrium quantity) is the quantity demanded and supplied at the equilibrium price. If you can determine the equilibrium price and quantity under one set of demand and supply conditions, you can determine them under any other set.
This chapter includes a brief examination of the factors that determine demand and supply and the ways in which changes in these determinants will affect and cause changes in demand and supply. A graphic method is used in this analysis to illustrate demand and supply, equilibrium price and quantity, changes in demand and supply, and the resulting changes in equilibrium price and quantity. The demand curve and the supply curve are graphic representations of the same data contained in the schedules of demand and supply. The application section at the end of the chapter explains government-set prices. When the government sets a legal price in a competitive market, it creates a price ceiling or price floor. This prevents supply and demand from determining the equilibrium price and quantity of a product that will be provided by a competitive market. As you will learn, the economic consequence of a price ceiling is that it will result in a persistent shortage of the product. An example of a price ceiling would be price controls on apartment rents. A price floor will result in a persistent surplus of a product, and the example given is price supports for an agricultural product. You will use demand and supply over and over. It will turn out to be as important to you in economics as jet propulsion is to the pilot of an airplane: You can’t get off the ground without it.

CHECKLIST When you have studied this chapter you should be able to Explain the economic meaning of markets. Define demand and state the law of demand. Give three explanations for the inverse relationship between price and quantity demanded. Graph the demand curve when you are given a demand schedule. Explain the difference between individual demand and market demand. List the five major determinants of demand and explain how each one shifts the demand curve. Explain how changes in income affect the demand for normal goods and inferior goods. Explain how changes in the prices of a substitute good or a complementary good affect the demand for a product. Distinguish between change in demand and change in the quantity demanded. Define supply and state the law of supply. Graph the supply curve when given a supply schedule. Explain the difference between individual supply and market supply. List the major determinants of supply and explain how each shifts the supply curve. Distinguish between changes in supply and changes in the quantity supplied. Describe how the equilibrium price and quantity are determined in a competitive market. Define surplus and shortage. Determine when you are given the demand for and the supply of a good, the equilibrium price and the equilibrium quantity. Explain the meaning of the rationing function of prices. Distinguish between productive efficiency and allocative efficiency. Predict the effects of changes in demand on equilibrium price and quantity. Predict the effects of changes in supply on equilibrium price and quantity. Predict the effects of changes in both demand and supply on equilibrium price and quantity.
Explain the economic effects of a government-set price ceiling on product price and quantity in a competitive market. Describe the economic consequences of a government-set price floor on product price and quantity.
CHAPTER OUTLINE
1. A market is any institution or mechanism that brings together buyers (“demanders”) and sellers (“suppliers”) of a particular good or service. This chapter assumes that markets are highly competitive.
2. Demand is a schedule of prices and the quantities that buyers would purchase at each of these prices during a selected period of time. a. The law of demand states that there is an inverse or negative relationship between price and quantity
demanded. Other things equal, as price increases, buyers will purchase fewer quantities, and as price decreases they will purchase more quantities. There are three explanations for the law of demand:
(1) Diminishing marginal utility: After a point, consumers get less satisfaction or benefit from consuming more and more units.
(2) Income effect: A higher price for a good decreases the purchasing power of consumers’ incomes so they can’t buy as much of the good.
(3) Substitution effect: A higher price for a good encourages consumers to search for cheaper substitutes and thus buy less of it. b. The demand curve has a downward slope and is a graphic representation of the law of demand. c. Market demand for a good is a sum of all the demands of all consumers of that good at each price. Although
price has the most important influence on quantity demanded, other factors can influence demand. The factors, called determinants of demand, are consumer tastes (preferences), the number of buyers in the market, consumers’ income, the prices of related goods, and consumer expectations.
d. An increase or decrease in the entire demand schedule and the demand curve (a change in demand) results from a change in one or more of the determinants of demand. For a particular good,
(1) an increase in consumer tastes or preferences increases its demand; (2) an increase in the number of buyers increases its demand; (3) consumers’ income increases its demand if it is a normal good (one where income and demand are positively
related), but an increase in consumers’ income decreases its demand if it is an inferior good (one where income and demand are negatively related);
(4) an increase in the price of a related good will increase its demand if the related good is a substitute good (one that can be used in place of another) but an increase in the price of a related good will decrease its demand if the related good is a complementary good (one that is used with another good).
(5) an increase in consumer expectations of a future price increase or a future rise in income increases its current demand. e. A change in demand means that the entire demand curve or schedule has changed because of a change in one
of the above determinants of demand, but a change in the quantity demanded means that there has been a movement along an existing demand curve or schedule because of a change in price.
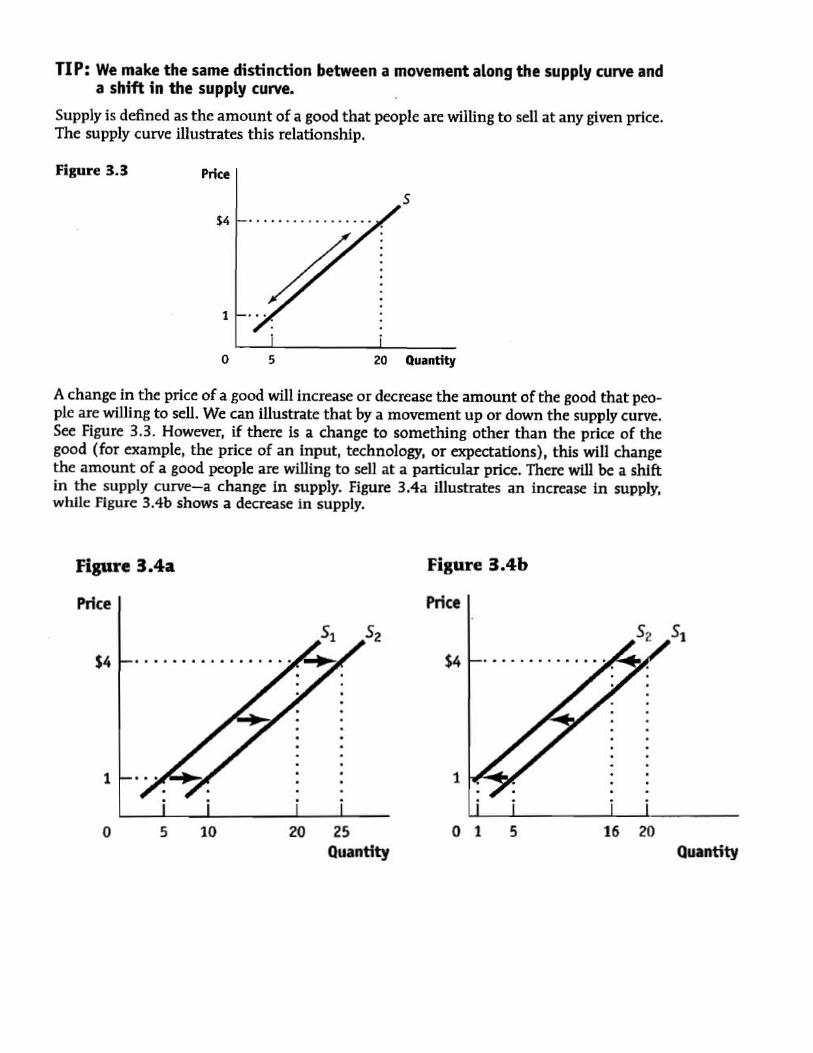
3. Supply is a schedule of prices and the quantities that sellers will sell at each of these prices during some period of time. a. The law of supply shows a positive relationship between price and quantity supplied. Other things equal, as the
price of the good increases, more quantities will be offered for sale, and as the price of the good decreases, fewer quantities will be offered for sale.
b. The supply curve is a graphic representation of supply and the law of supply; it has an upward slope indicating the positive relationship between price and quantity supplied.
c. The market supply of a good is the sum of the supplies of all sellers or producers of the good at each price. d. Although price has the most important influence on the quantity supplied, other factors can also influence
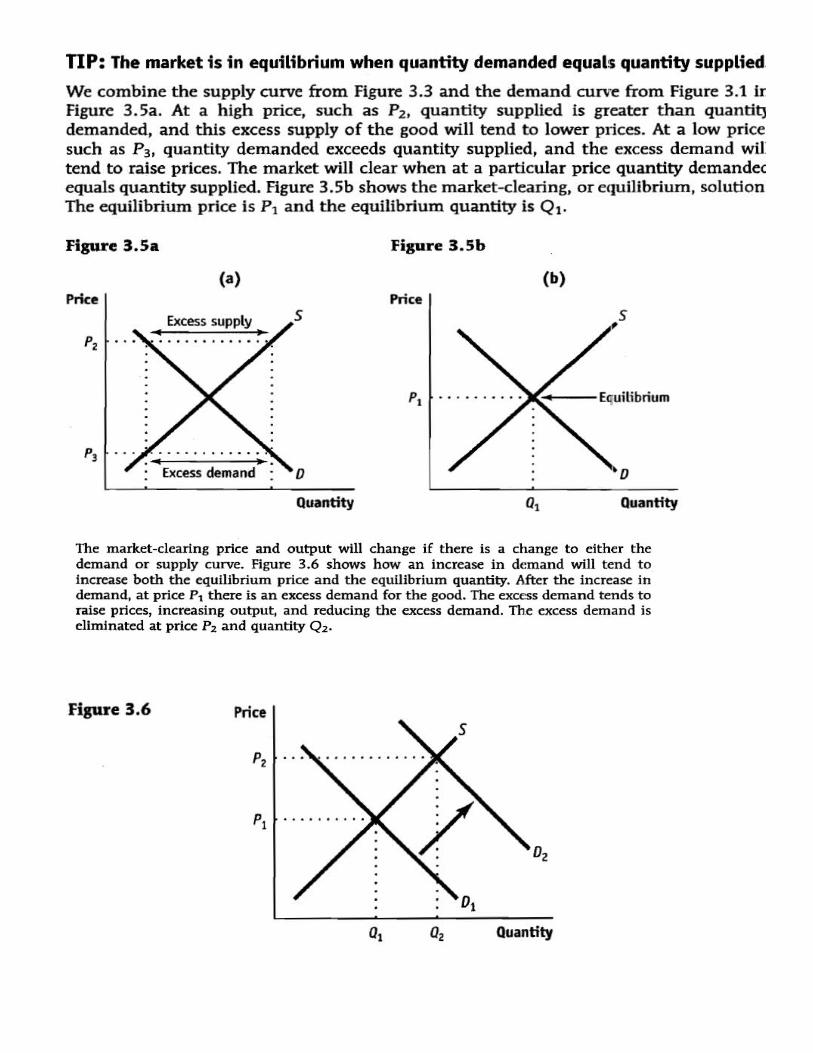
supply. The factors, called determinants of supply, are changes in (1) resource prices; (2) technology; (3) taxes and subsidies;(4) prices of other good; (5) price expectation; and (6) the number of sellers in a market. e. A change in supply is an increase or decrease in the entire supply schedule and the supply curve. It is the result
of a change in one or more of the determinants of supply that affect the cost of production. For a particular product,
(1) a decrease in resource prices increases its supply;

(2) an improvement in technology increases its supply; (3) a decrease in taxes or an increase in subsidies increases its supply; (4) a decrease in the price of another good that could be produced leads to an increase in its supply; (5) an increase in producer expectations of higher prices for the good may increase or decrease its supply. (6) an increase in the number of sellers or suppliers is likely to increase its supply.
f. A change in supply means that the entire supply curve or schedule has changed because of a change in one of the above determinants of supply, but a change in the quantity supplied means that there has been a movement along an existing supply curve or schedule because of a change in price.
4. The equilibrium price (or market-clearing price ) of a product is that price at which quantity demanded and quantity supplied are equal. The quantity exchanged in the market (the equilibrium quantity) is equal to the quantity demanded and supplied at the equilibrium price.a. If the price of a product is above the market equilibrium price, there will be a surplus or excess supply . In this
case, the quantity demanded is less than the quantity supplied at that price.5. ( Last Word ). The supply and demand analysis can be used to understand the shortage of organ transplants. The
demand curve for such organs is down-sloping and the supply is fixed (vertical) and left of the zero price on the demand curve. Transplanted organs have a zero price. At that price the quantity demanded is much greater than the quantity supplied, creating a shortage that is rationed with a waiting list. A competitive market for organs would increase the price of organs and then make them more available for transplant (make the supply curve up-sloping), but there are moral and cost objections to this change.