Embed Size (px)
Citation preview

CORAL REEF MAPPING USING REMOTE SENSING AND GIS OF RAMESWARAM COAST
P.C.Rishi Nandan Yoga 1 and C.Lakshumanan2
1B.Tech IVth Year, 2Assistant Professor, Centre For Remote Sensing,
Bharathidasan University, Trichy.
ABSTRACT
Coral reefs are highly sensitive and productive marine ecosystem. The increasing human
population and their activities and other natural factors have caused the degradation of coral
reefs. Different approaches to the classification of remotely sensed data of coral reef are mapped,
and Landsat satellite data of coral reefs from the Rameswaram coast have been classified using
different methodologies. The LANDSAT 7 and 8 satellite data with GIS and ERDAS software
were used for mapping coral reef and change detection. Digital and visual techniques were used
to map the coral reefs. Visual classification shows that about 20 km2 of coral reef area in the
study area has been lost over a period of fourteen years. Digital classification of LANDSAT data
using Cluster Analysis was found to be more suitable for coral reef Mapping. K.Means
(unsupervised learning algorithms that solve the well known clustering problem) classification of
LANDSAT data failed to differentiate between different species of coral reef and other
associated features. MLC (Maximum Likelihood Classification) and PCA (Principal Component
Analysis) of satellite data was found to be most suitable to identify different types of coral reefs
and other associated features
Coral reef communities are classified into Dead Reef, Reef Vegetation, Mixed Reef and Massive
Reef using Digital and Visual image Interpretation. Areal distributions of Coral reefs are
identified for period of 2000, 2004, 2010 and 2014. Due to wave action, sediment deposition,
erosion and anthropogenic activities, the coral reefs are experience degradation. Reef vegetation
has decreased from 22.1 Sq.km (2000) to 1.9 Sq.km (2014) respectively. Reef area has decreased
from 16.6 Sq.km (2000) to 12.5 Sq.km (2014).
Keywords: Coral Reefs, Rameswaram, Visual Interpretation, K-Means, Satellite Imagery
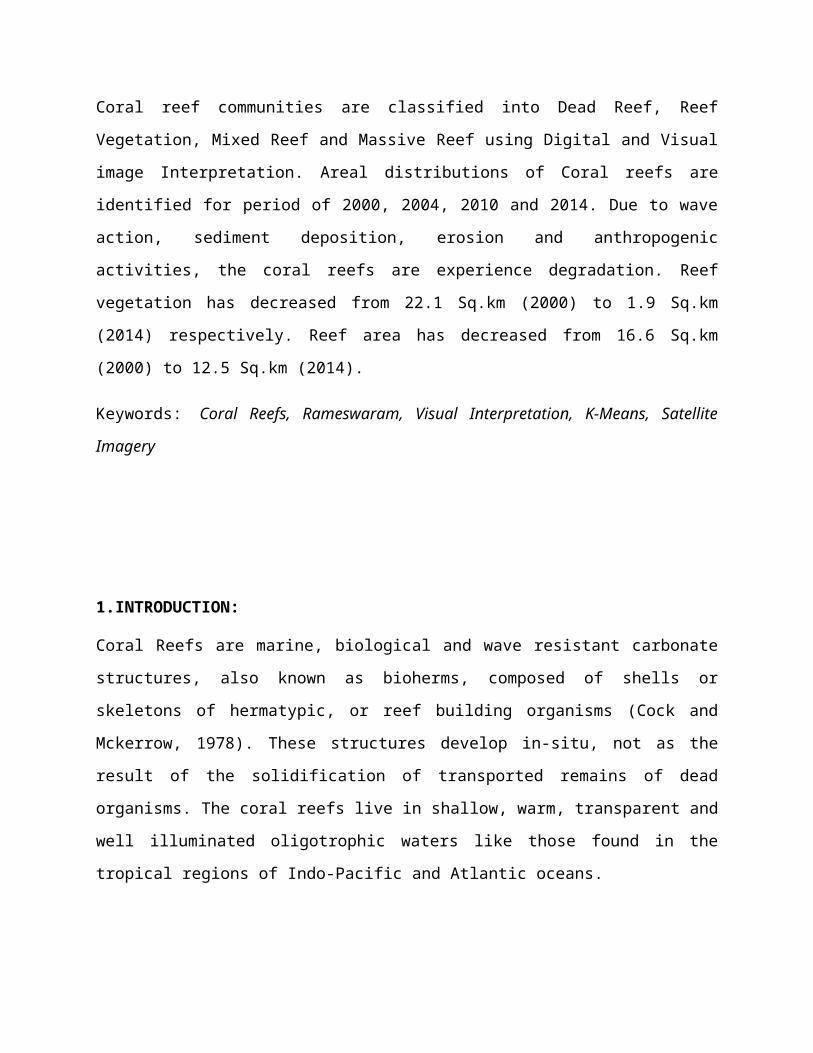
1.INTRODUCTION:
Coral Reefs are marine, biological and wave resistant carbonate structures, also known as
bioherms, composed of shells or skeletons of hermatypic, or reef building organisms (Cock and
Mckerrow, 1978). These structures develop in-situ, not as the result of the solidification of
transported remains of dead organisms. The coral reefs live in shallow, warm, transparent and
well illuminated oligotrophic waters like those found in the tropical regions of Indo-Pacific and
Atlantic oceans.
The extent of the area of the coral reefs in India is estimated at about 2341.8 km2 (Anjali
Bahuguna and Nayak 1994 and 1998). Large reserves of coral reefs in the subcontinent are found
in the Andaman and Nicobar group of islands. It covers an area of about 959.3 km2. The reefs in
this area exhibit narrow and extensively well developed fringing reefs and coral pinnacles. The
coral reefs of the Lakshadweep group of islands in the Arabian Sea cover an area of about 828
km2. Coral reefs of these islands are mainly of the atoll type. The Gulf of Kutch on the West
Coast of India consists of some present day corals comprising mainly of the patchy type. It
covers an area of about 460.2 km2. In Tamilnadu, coral reefs are found to occur in the area
around Gulf of Mannar and Palk Bay.
Coral reefs act as a barrier against wave action along coastal areas thus preventing coastal
erosion. As a result of the increasing human population along the coastal area, anthropogenic
impacts on the coastal zone have become severe over the past few decades. Coral ecosystem also
face many threats, of which some are of natural origin like storms and waves particularly tropical
storms and cyclones that cause major intermittent damage to reefs. In India, the coral reefs have
been used as a source of calcium carbonate, building blocks and rubble for construction of roads.
Hence, protection and conservation of these valuable marine resources are of prime importance.

2.STUDY AREA:
The study area is the region along Ramanthapuram-Rameswaram coast located on the east coast
of India, at 93°8’ N Latitude 78°83’ E Longitude .There are many islands, situated at an average
distance of about 8km from the coast and running almost parallel to the coastline.
Major part of the district is a gently sloping plain except for remnant hills in the western area.
Most of the area is covered by the unconsolidated sediments of Quaternary age except in the
northwestern part, where isolated patches of Archaen Crystallines and Tertiary sandstone are
exposed.
FIG 1.1 STUDY AREA LOCATION MAP

3.METHODOLOGY:
Satellite imagery of Landsat ETM for the years of 2000 to 2014, GIS and Image processing software have been used in this study. Three kinds of approaches have been attempted in analysing the satellite data for coral reef mapping. Digital analysis involves various digital classification techniques such as maximum likelihood classification (MLC), K-Means classification and principal component analysis (PCA). In this approach, Landsat image has been classified using all the above mentioned techniques through ERDAS Imagine software. Visual interpretation of multidate optical remote sensing data for mapping and change detection in coral reefs. The result of this approach is expected to provide information on areal distribution of coral reefs and identification of coral reefs. Major portion of the work was carried out using ARCINFO GIS software.
4.RESULTS AND DISCUSSION:
4.1 DIGITAL IMAGE PROCESSING FOR CORAL REEF STUDY

4.1.1K-Means clustering classification:
This is an unsupervised classifier, which does not need any supervision during
classification steps and does natural grouping of the spectral data. The
fundamentals and the algorithm used in this method can be easily traced, as there is
enormous literature available. This classification accepts the number of classes
(clusters) from the analyst to be located in the data. This classification technique is
suitable for obtaining the reef extent and is not suitable for detailed coral study.
Coral reef classification using K-Means clustering method from LANDSAT 8
satellite data for Pumurichan, Kovi, Kursadi and Shingle Islands.
4.1.2 Maximum Likelihood classification:

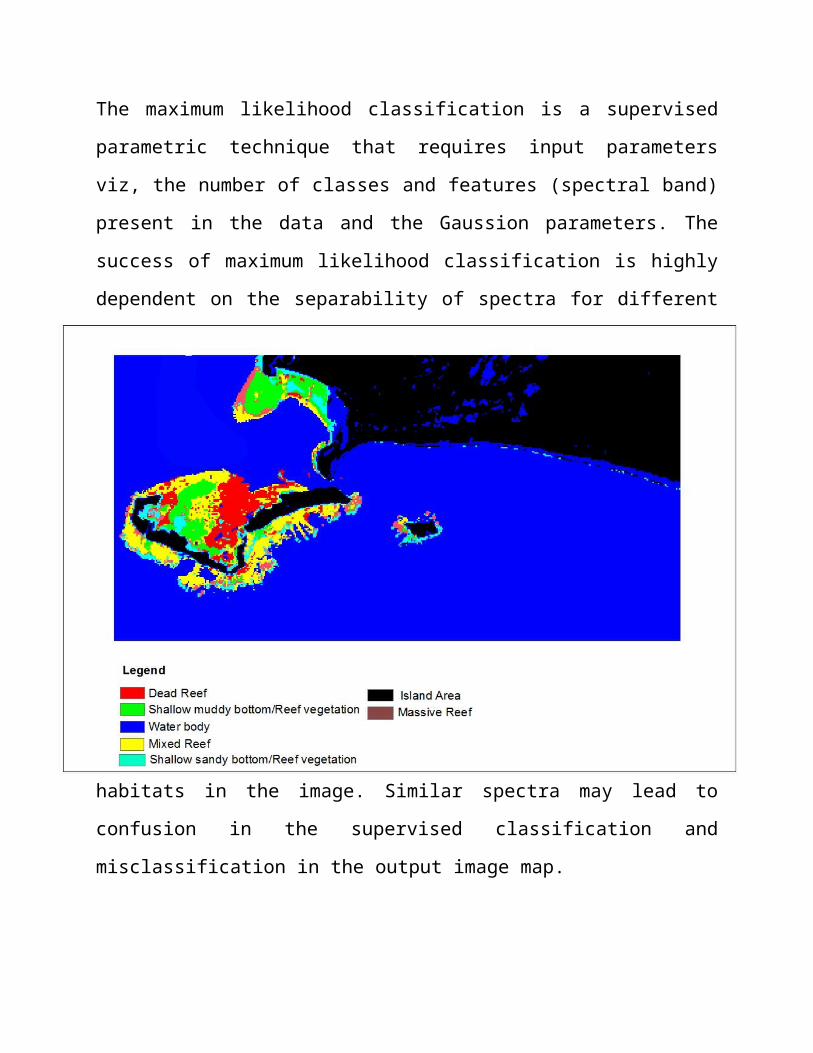
The maximum likelihood classification is a supervised parametric technique that
requires input parameters viz, the number of classes and features (spectral band)
present in the data and the Gaussion parameters. The success of maximum
likelihood classification is highly dependent on the separability of spectra for
different habitats in the image. Similar spectra may lead to confusion in the
supervised classification and misclassification in the output image map.
Coral reef classification using MLC classification method from LANDSAT 8 satellite data for
Pumurichan, Kovi, Kursadi and Shingle Islands.
4.1.3 Principal Component Analysis:

The present study has been attempted to identify the coral reefs, various species of
coral reefs, reef vegetation etc., within the imagery. The IRS LISSIII data has been
used for Principal Component Analysis. For this analysis, the ERDAS Imagine
image processing software was used. In this study, PC 2 & 3 shows similar
variation between Shallow water and Coralreefs so it is not preferable for
interpretation. In case of PC1(4,3,2) result shows major Coral reef discriminations.
Fig 4.4 shows the PC1 image of LISS III satellite imagery. PC 1,2,3 also shows
considerable amount of classes.
Coral reef classification using PCA method from IRS LISSIII satellite data for Pumurichan, Kovi, Kursadi and Shingle Islands.

4.2 Visual interpretation of satellite data:
Landsat (2000 to 2014) imageries on 1:50,000 scale were used for visual
interpretation to prepare coral reef maps. Based on visual interpretation techniques,
a coral reef map was prepared using the image interpretation key elements. The
accurate discrimination between reef,degraded reef, reef vegetation and non-reef
area were possible using visual techniques. The mapping accuracy was high
for visual techniques (84.82%). This technique is suitable for estimating the
extent of coral reef area but is not useful for detailed identification of different
coral species, dead/live coral and other associated habitats.
Coral reef map derived from Landsat (2000) data
Coral reef map derived from Landsat (2014) data

Arial distribution of coral reefs from period from 2000 to 2014:
Changes observed during period of 2000-2014

5. Conclusion:
Visual interpretation of LANDSAT imageries aids in demarcating various coral
features like reef area, reef vegetation and mixed coral reef and their areal extents.
The present study reveals that remote sensing and GIS techniques have a unique
capability to detect the changes that have occurred in the coral reef over a period of
time (2000-2014). It also helps in identifying the status of coral reef on a particular
time. It is observed from this study that coral reef area has been reduced by about
25 km2 over a period of Fourteen years. Areal distribution of coral reefs shows
major variations and extinction of coral reef, it is due threats like cyclones, storms
particularly Tropical storms and direct anthropogenic stress.
Apart from sensor characteristic features, different enhancement techniques also
prove to be useful for coral reef mapping. The classification techniques like K-
Means classification, Maximum likelihood classification and Principal Component
Analysis (PCA) have been used. For the classification of coral reef, Maximum
Likelihood classification shows higher classification accuracy in the digital
classification of LANDSAT data than K-Means and Other Techniques. Principal
component analysis is very useful in the identification of different coral species
like mixed reef, sea grass, seaweed bed, dead reef, exposed dead reef, shallow
sandy bottom and muddy bottom and for coral reef studies.