Embed Size (px)
Citation preview

APPENDIX K
ADDITIONAL EVIDENCE
SAN ANTONIO EAC REGION ATTAINMENT DEMONSTRATION
MARCH 2004
Appendix K
Table of Contents Page
Alternative Fuel Survey…………………………………………………………………... K-3
Transportation Demand Management…………………………………………….……. K-11
Voluntary Air Quality Control Strategies………………….……………………….……. K-19
Transportation Emission Reduction Measures……………..…………………….…… K-33
Emission Reduction Estimates from Traffic Signalization………………………….. K-45
Energy Efficiency / Renewable Energy Projects…………...………………………….. K-68
Public Education…………………………………………………………………….…….. K-70
Lawnmower Recycling Program……………………………..………………………….. K-74
Truck stop Anti-Idling Program……………………………..…………………………. K-77
Lower Reid Vapor Pressure…………………………………..…………………………. K-79
Energy Generated from Wind…………………………………………………………… K-80
The Texas Emissions Reduction Plan………………………………………………….. K-81
K-2
Alternative Fuel Survey
IntroductionLocal alternative fuel surveys have been conducted in 2001, 2003, and 2004 by staff of AACOG, which inventoried the AFV fleet in the four SAER counties. These surveys provided information on the number of AFVs, specific fuel type, the percentage of time that they operate on alternative fuel, the number of days per week they typically operate, and an estimate on how many vehicle miles traveled (VMT) were accumulated by each vehicle for 2007.
The results indicated that there will be 2,533 potential AFVs by 2007, however some of AFVs will never use any alternative fuel. As a result, only 2,131AFVs were included in the final modeling. Once the survey showed a 0% usage rate of alternative fuels for any AFV, the vehicle was removed from the calculations. The survey results were used to assess the effectiveness of the 2007 AFV fleet at reducing ozone precursor emissions by applying the EPA’s MOBILE6 model to generated AFVs emission factors. A total of 28,456,349 VMT per year was determined for the AFV fleet in 2007. Final analysis of operation of the 2007 AFV fleet indicates that this fleet is responsible for emissions reductions of 193 lbs./day of VOC and 172 lbs./day of NOx.
While these estimated reductions are not overly sizeable, they do illustrate that a switch to alternative fuel vehicles will result in the reduction of ozone precursors in addition to reducing our nation’s dependence on foreign oil. As alternative fuel technology advances, refueling infrastructure expands, and the use of alternative fuels becomes more acceptable, the emissions reductions resulting from the utilization of an AFV fleet in the four SAER counties should become more significant.
The first step in the analysis process was to determine what alternative fuel types are being used in the San Antonio region. The alternative fuels considered in this study were liquefied petroleum gas (LPG), compressed natural gas (CNG), biodiesel, ethanol, and electricity. A questionnaire was distributed to both public and private entities seeking information on how many AFVs are in operation, what types of fuel they are using, and how many vehicle miles traveled (VMT) were accumulated by using each vehicle throughout the year.
The results 2004 survey were supplemented by information gathered from the 2000 Alternative Fuel Survey and the 2001 Clean Cities Report for organizations that did not respond to the 2004 Alternative Fuel Survey. The following pages provide an example of the survey materials distributed in 2004. The survey information is followed by the results.
K-3
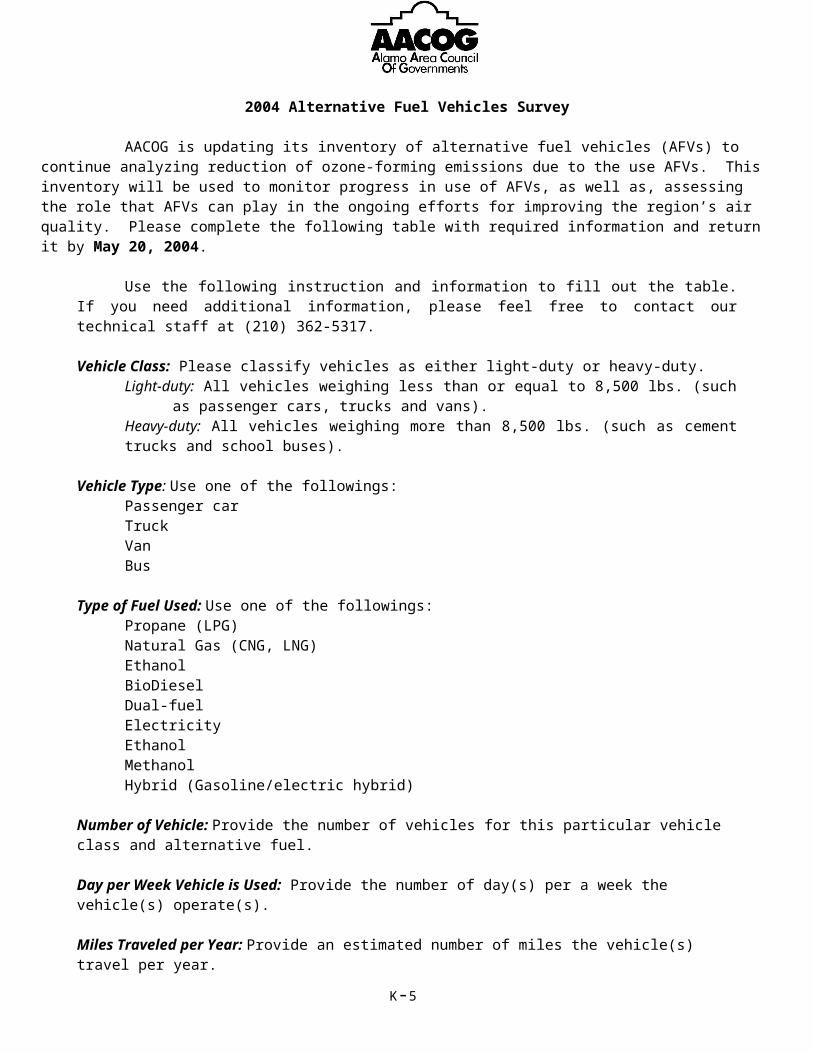
2004 Alternative Fuel Vehicles Survey
AACOG is updating its inventory of alternative fuel vehicles (AFVs) to continue analyzing reduction of ozone-forming emissions due to the use AFVs. This inventory will be used to monitor progress in use of AFVs, as well as, assessing the role that AFVs can play in the ongoing efforts for improving the region’s air quality. Please complete the following table with required information and return it by May 20, 2004.
Use the following instruction and information to fill out the table. If you need additional information, please feel free to contact our technical staff at (210) 362-5317.
Vehicle Class: Please classify vehicles as either light-duty or heavy-duty. Light-duty: All vehicles weighing less than or equal to 8,500 lbs. (such as passenger cars,
trucks and vans).Heavy-duty: All vehicles weighing more than 8,500 lbs. (such as cement trucks and school buses).
Vehicle Type: Use one of the followings: Passenger carTruckVanBus
Type of Fuel Used: Use one of the followings:Propane (LPG)Natural Gas (CNG, LNG)EthanolBioDieselDual-fuelElectricityEthanolMethanolHybrid (Gasoline/electric hybrid)
Number of Vehicle: Provide the number of vehicles for this particular vehicle class and alternative fuel.
Day per Week Vehicle is Used: Provide the number of day(s) per a week the vehicle(s) operate(s).
Miles Traveled per Year: Provide an estimated number of miles the vehicle(s) travel per year.
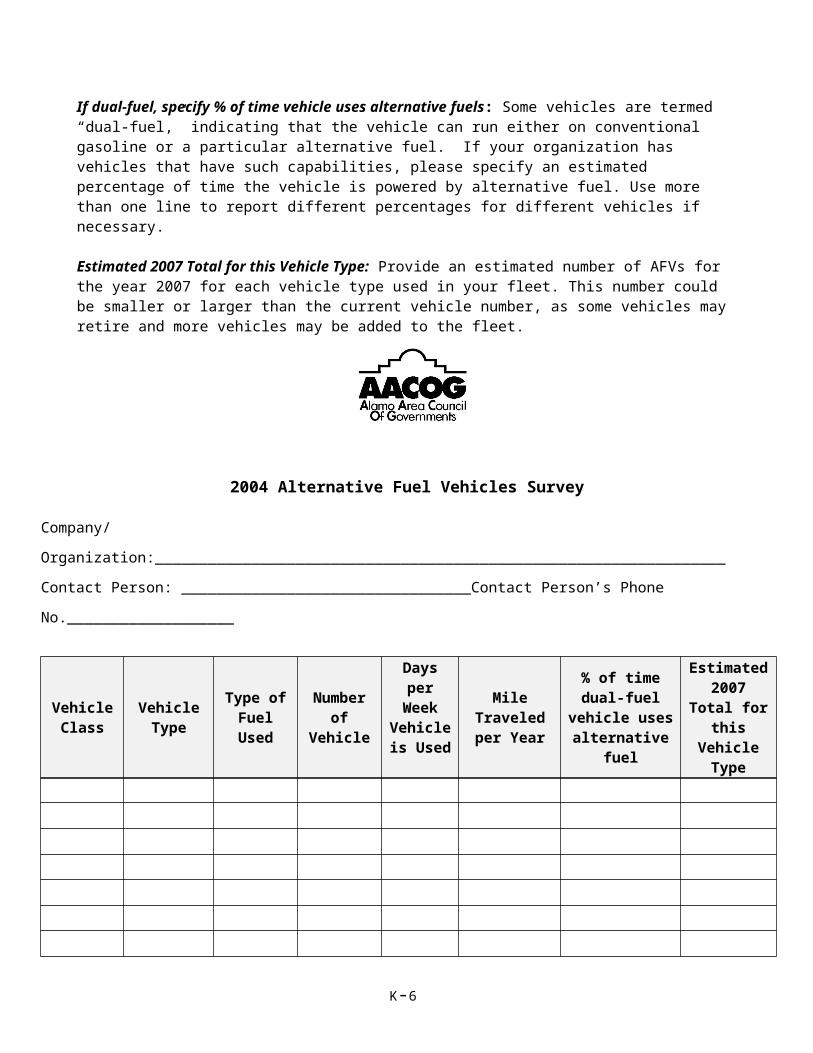
If dual-fuel, specify % of time vehicle uses alternative fuels: Some vehicles are termed “dual-fuel,” indicating that the vehicle can run either on conventional gasoline or a particular alternative fuel. If your organization has vehicles that have such capabilities, please specify an estimated percentage of time the vehicle is powered by alternative fuel. Use more than one line to report different percentages for different vehicles if necessary.
Estimated 2007 Total for this Vehicle Type: Provide an estimated number of AFVs for the year 2007 for each vehicle type used in your fleet. This number could be smaller or larger than the current vehicle number, as some vehicles may retire and more vehicles may be added to the fleet.
K-4
2004 Alternative Fuel Vehicles Survey
Company/Organization:_________________________________________________________________
Contact Person: _________________________________Contact Person’s Phone No.___________________
Vehicle Class
Vehicle Type
Type of Fuel Used
Number of Vehicle
Days per Week
Vehicle is Used
Mile Traveled per
Year
% of time dual-fuel vehicle
uses alternative fuel
Estimated 2007 Total
for this Vehicle
Type
K-5
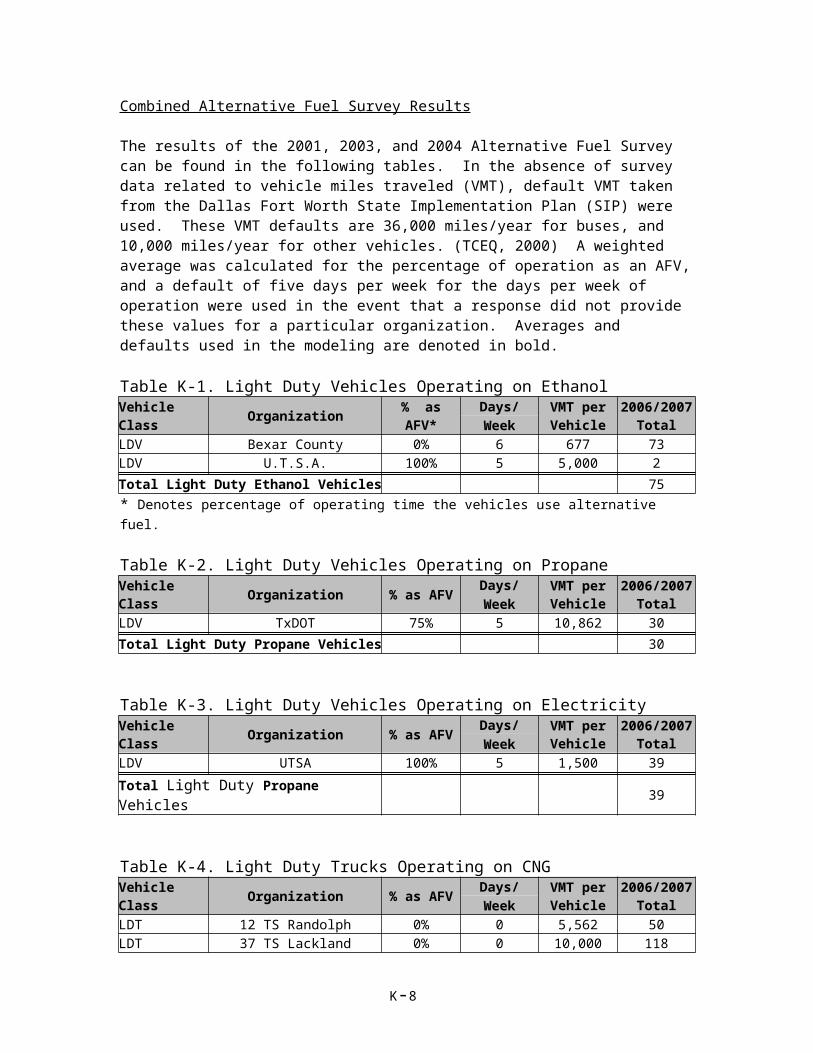
Combined Alternative Fuel Survey Results
The results of the 2001, 2003, and 2004 Alternative Fuel Survey can be found in the following tables. In the absence of survey data related to vehicle miles traveled (VMT), default VMT taken from the Dallas Fort Worth State Implementation Plan (SIP) were used. These VMT defaults are 36,000 miles/year for buses, and 10,000 miles/year for other vehicles. (TCEQ, 2000) A weighted average was calculated for the percentage of operation as an AFV, and a default of five days per week for the days per week of operation were used in the event that a response did not provide these values for a particular organization. Averages and defaults used in the modeling are denoted in bold.
Table K-1. Light Duty Vehicles Operating on EthanolVehicle Class Organization % as AFV* Days/ VMT per
Vehicle2006/2007
TotalWeekLDV Bexar County 0% 6 677 73LDV U.T.S.A. 100% 5 5,000 2Total Light Duty Ethanol Vehicles 75* Denotes percentage of operating time the vehicles use alternative fuel.
Table K-2. Light Duty Vehicles Operating on PropaneVehicle Class Organization % as AFV Days/ VMT per
Vehicle2006/2007
TotalWeekLDV TxDOT 75% 5 10,862 30Total Light Duty Propane Vehicles 30
Table K-3. Light Duty Vehicles Operating on Electricity
Vehicle Class Organization % as AFV Days/ VMT per Vehicle
2006/2007 TotalWeek
LDV UTSA 100% 5 1,500 39Total Light Duty Propane Vehicles 39
Table K-4. Light Duty Trucks Operating on CNGVehicle Class Organization % as AFV Days/ VMT per
Vehicle2006/2007
TotalWeekLDT 12 TS Randolph 0% 0 5,562 50LDT 37 TS Lackland 0% 0 10,000 118LDT BexarMet Water 29% 5 10,000 34LDT CPS 100% 4 5,003 2LDT SA Parks 100% 7 10,000 22LDT USPS 0% 0 10,000 4LDT Yanaguana Cruise 100% 7 10,000 40LDT UTSA 50% 5 2,000 4LDT UTSA 50% 5 5,000 1LDT UTSA 50% 5 1,350 13LDT USPS 29% 5 10,000 80Total LD CNG Trucks 368Table K-5. Light Duty Trucks Operating on Propane
K-6

Vehicle Class Organization % as AFV Days/ VMT per Vehicle
2006/2007 TotalWeek
LDT AmeriGas 100% 5 10,000 7LDT Beldon Roofing 85% 5 10,000 74LDT Bell Hydrogas 100% 5 10,000 16LDT Bexar County 50% 5 3,795 60LDT BexarMET Water 85% 5 10,000 6LDT City of San Antonio 50% 5 13,514 37LDT City of San Antonio 100% 5 13,514 198LDT Mission Gas 100% 5 10,000 14LDT Northside ISD 100% 5 10,000 8LDT SA Inter. Airport 100% 5 10,000 20LDT San Antonio Water System 14% 5 10,000 43LDT SA Trans 100% 7 10,000 18LDT Schwan’s Enterprise 100% 5 10,000 25LDT Texas State Hospital 85% 5 10,000 52LDT VIA Transit 100% 6 32,019 184LDT Roberts Grain & Supply Inc, 98% 6 20,000 4
LDT U. S. Dept. of Interior, National Park Service 100% 5 7,817 1
LDT Thad Ziegler Glass Ltd. 100% 5 15,000 15LDT Bexar County 100% 5 177 27LDT Bexar County 85% 5 535 54LDT TxDot 84% 5 8,317 42LDT TxDot 80% 5 8,113 173LDT TxDot 77% 5 5,277 15LDT TxDot 76% 5 7,536 10LDT TxDot 76% 5 733 15LDT TxDot 76% 5 6,817 7Total LD Propane Truck 1125
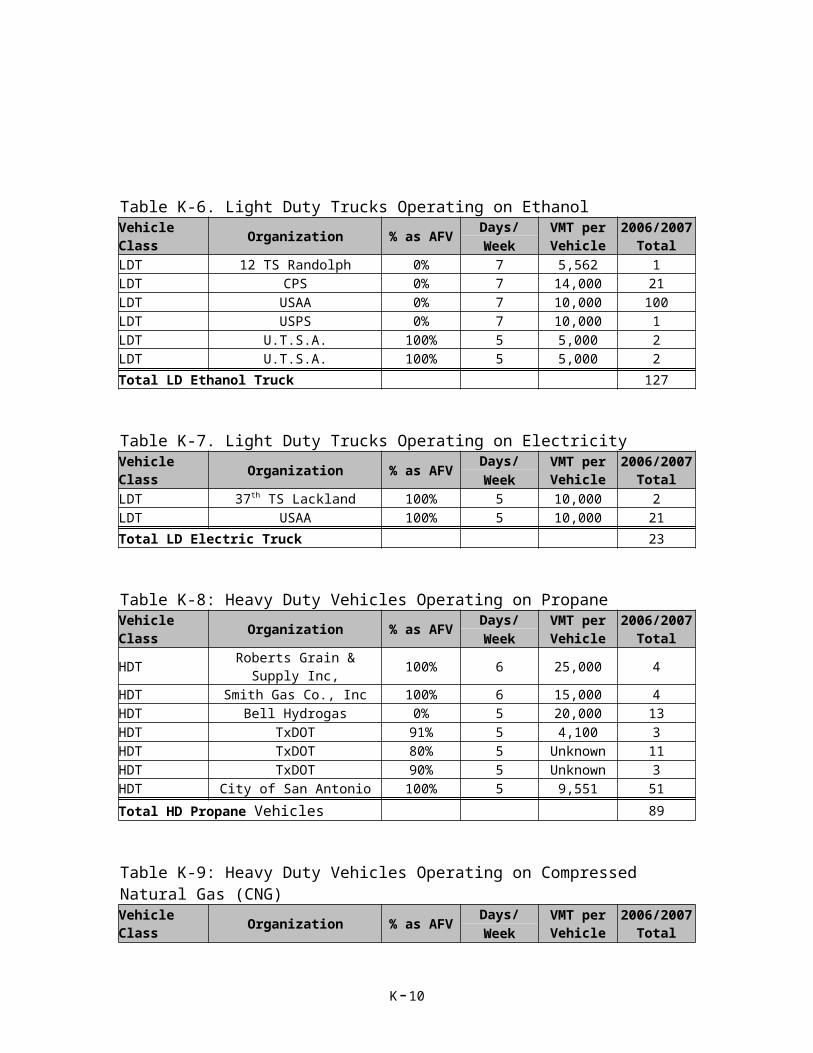
Table K-6. Light Duty Trucks Operating on Ethanol
Vehicle Class Organization % as AFV Days/ VMT per Vehicle
2006/2007 TotalWeek
LDT 12 TS Randolph 0% 7 5,562 1LDT CPS 0% 7 14,000 21LDT USAA 0% 7 10,000 100LDT USPS 0% 7 10,000 1LDT U.T.S.A. 100% 5 5,000 2LDT U.T.S.A. 100% 5 5,000 2Total LD Ethanol Truck 127
Table K-7. Light Duty Trucks Operating on Electricity
Vehicle Class Organization % as AFV Days/ VMT per Vehicle
2006/2007 TotalWeek
K-7
LDT 37th TS Lackland 100% 5 10,000 2LDT USAA 100% 5 10,000 21Total LD Electric Truck 23
Table K-8: Heavy Duty Vehicles Operating on Propane
Vehicle Class Organization % as AFV Days/ VMT per Vehicle
2006/2007 TotalWeek
HDT Roberts Grain & Supply Inc, 100% 6 25,000 4HDT Smith Gas Co., Inc 100% 6 15,000 4HDT Bell Hydrogas 0% 5 20,000 13HDT TxDOT 91% 5 4,100 3HDT TxDOT 80% 5 Unknown 11HDT TxDOT 90% 5 Unknown 3HDT City of San Antonio 100% 5 9,551 51Total HD Propane Vehicles 89
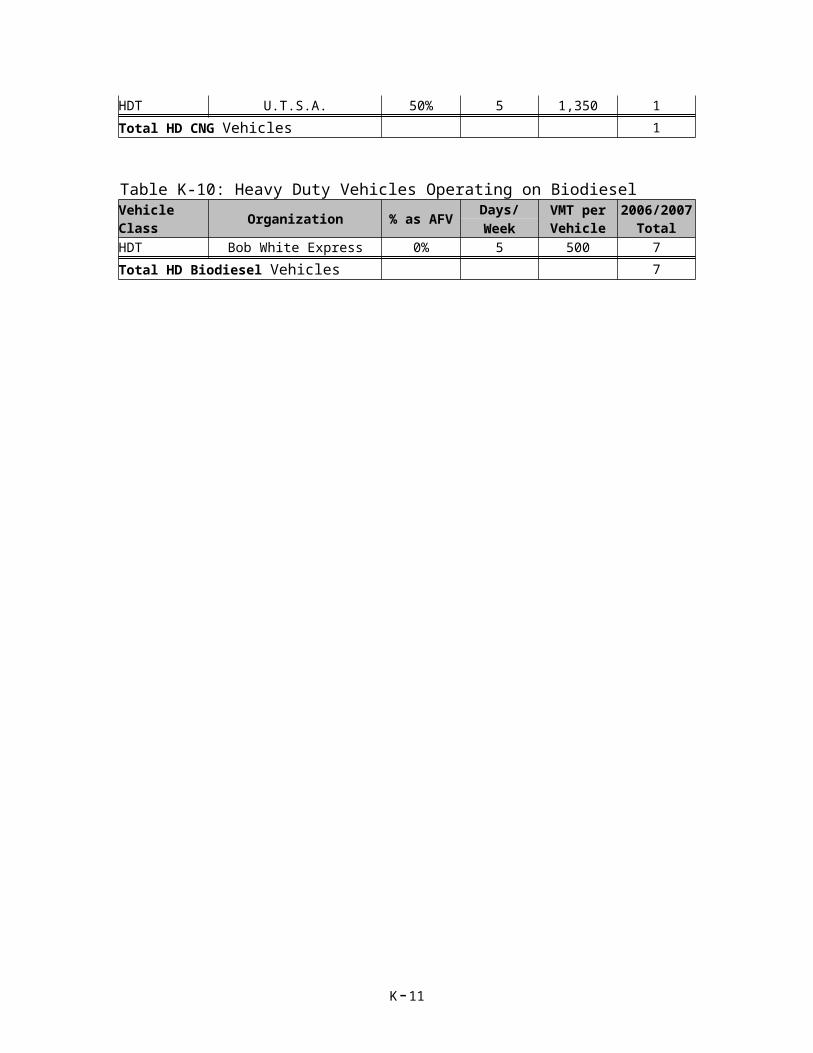
Table K-9: Heavy Duty Vehicles Operating on Compressed Natural Gas (CNG)Vehicle Class Organization % as AFV Days/ VMT per
Vehicle2006/2007
TotalWeekHDT U.T.S.A. 50% 5 1,350 1Total HD CNG Vehicles 1
Table K-10: Heavy Duty Vehicles Operating on Biodiesel
Vehicle Class Organization % as AFV Days/ VMT per Vehicle
2006/2007 TotalWeek
HDT Bob White Express 0% 5 500 7Total HD Biodiesel Vehicles 7
K-8
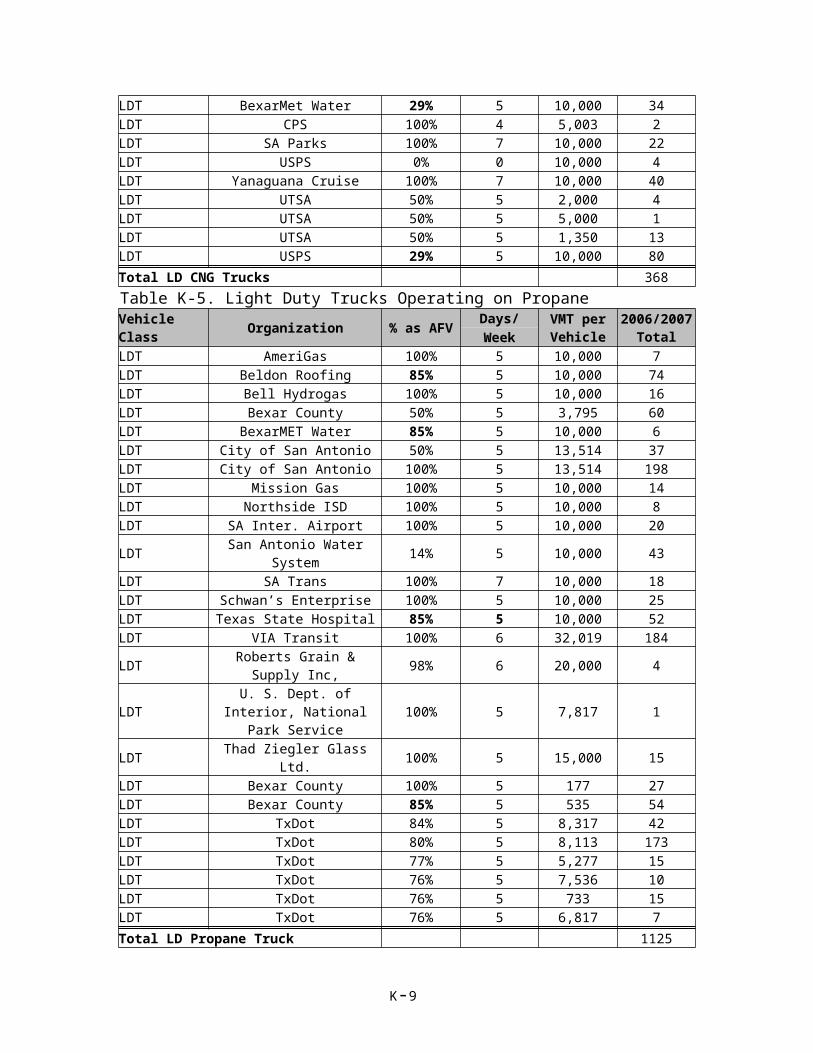
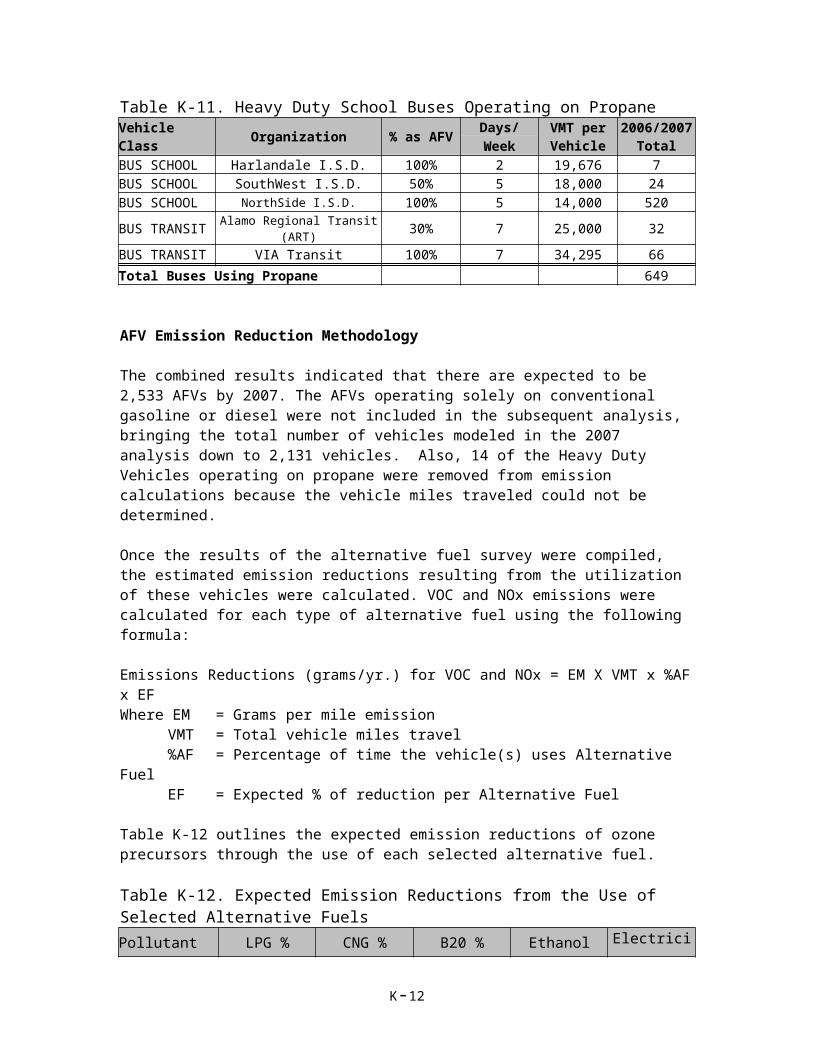
Table K-11. Heavy Duty School Buses Operating on Propane
Vehicle Class Organization % as AFV Days/ VMT per Vehicle
2006/2007 TotalWeek
BUS SCHOOL Harlandale I.S.D. 100% 2 19,676 7BUS SCHOOL SouthWest I.S.D. 50% 5 18,000 24BUS SCHOOL NorthSide I.S.D. 100% 5 14,000 520BUS TRANSIT Alamo Regional Transit (ART) 30% 7 25,000 32BUS TRANSIT VIA Transit 100% 7 34,295 66Total Buses Using Propane 649
AFV Emission Reduction Methodology
The combined results indicated that there are expected to be 2,533 AFVs by 2007. The AFVs operating solely on conventional gasoline or diesel were not included in the subsequent analysis, bringing the total number of vehicles modeled in the 2007 analysis down to 2,131 vehicles. Also, 14 of the Heavy Duty Vehicles operating on propane were removed from emission calculations because the vehicle miles traveled could not be determined.
Once the results of the alternative fuel survey were compiled, the estimated emission reductions resulting from the utilization of these vehicles were calculated. VOC and NOx emissions were calculated for each type of alternative fuel using the following formula:
Emissions Reductions (grams/yr.) for VOC and NOx = EM X VMT x %AF x EFWhere EM = Grams per mile emission
VMT = Total vehicle miles travel%AF = Percentage of time the vehicle(s) uses Alternative FuelEF = Expected % of reduction per Alternative Fuel
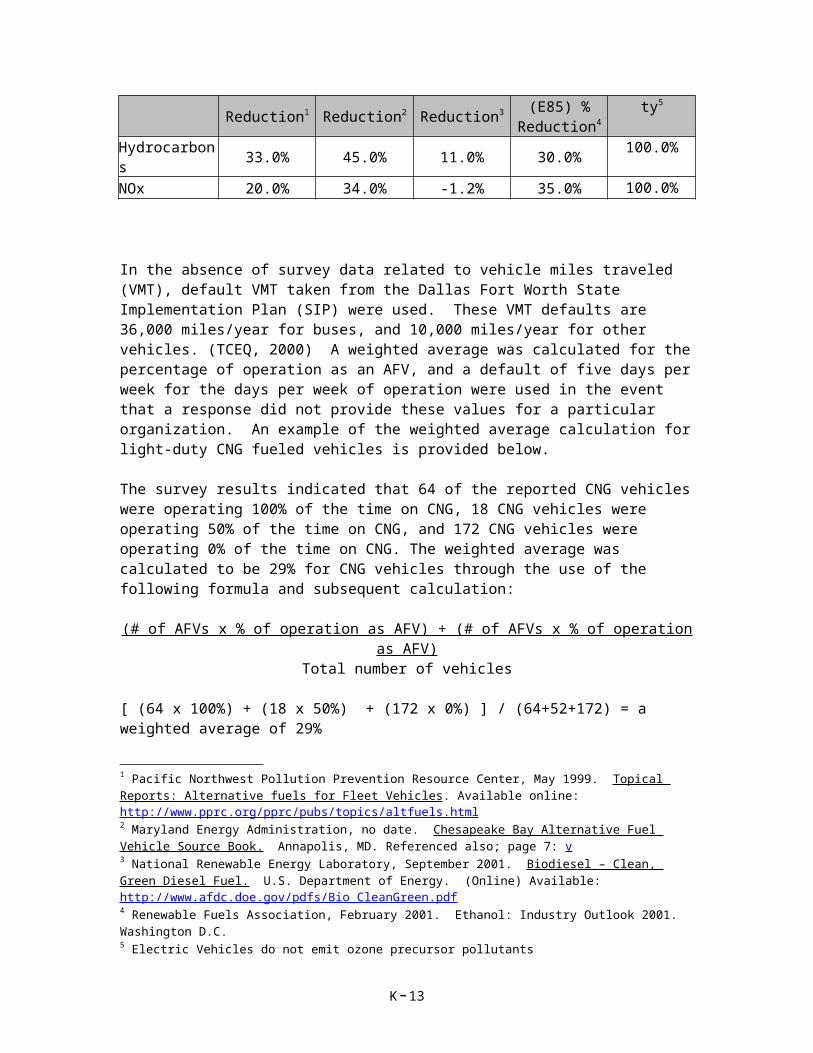
Table K-12 outlines the expected emission reductions of ozone precursors through the use of each selected alternative fuel.
Table K-12. Expected Emission Reductions from the Use of Selected Alternative Fuels
Pollutant LPG % Reduction1
CNG % Reduction2
B20 % Reduction3
Ethanol (E85) % Reduction4
Electricity5
Hydrocarbons 33.0% 45.0% 11.0% 30.0% 100.0%
NOx 20.0% 34.0% -1.2% 35.0% 100.0%
1 Pacific Northwest Pollution Prevention Resource Center, May 1999. Topical Reports: Alternative fuels for Fleet Vehicles. Available online: http://www.pprc.org/pprc/pubs/topics/altfuels.html2 Maryland Energy Administration, no date. Chesapeake Bay Alternative Fuel Vehicle Source Book. Annapolis, MD. Referenced also; page 7: v3 National Renewable Energy Laboratory, September 2001. Biodiesel – Clean, Green Diesel Fuel. U.S. Department of Energy. (Online) Available: http://www.afdc.doe.gov/pdfs/Bio_CleanGreen.pdf4 Renewable Fuels Association, February 2001. Ethanol: Industry Outlook 2001. Washington D.C.5 Electric Vehicles do not emit ozone precursor pollutants
K-9
In the absence of survey data related to vehicle miles traveled (VMT), default VMT taken from the Dallas Fort Worth State Implementation Plan (SIP) were used. These VMT defaults are 36,000 miles/year for buses, and 10,000 miles/year for other vehicles. (TCEQ, 2000) A weighted average was calculated for the percentage of operation as an AFV, and a default of five days per week for the days per week of operation were used in the event that a response did not provide these values for a particular organization. An example of the weighted average calculation for light-duty CNG fueled vehicles is provided below.
The survey results indicated that 64 of the reported CNG vehicles were operating 100% of the time on CNG, 18 CNG vehicles were operating 50% of the time on CNG, and 172 CNG vehicles were operating 0% of the time on CNG. The weighted average was calculated to be 29% for CNG vehicles through the use of the following formula and subsequent calculation:
(# of AFVs x % of operation as AFV) + (# of AFVs x % of operation as AFV)Total number of vehicles
[ (64 x 100%) + (18 x 50%) + (172 x 0%) ] / (64+52+172) = a weighted average of 29%
The resulting emission reductions from each of the 11 groups of vehicles were summed to obtain an emission reduction estimate for the entire fleet.
For the projected 2007 fleet it was assumed that the current fleet sizes were maintained at the current level unless otherwise noted. In addition, any projected increases in fleet sizes for 2006 in the selected survey, were assumed to carry over into 2007. The projected 2007 AFV fleet size makes up only a very small percentage of all of the on-road vehicles within the region. If the AFV fleet size were to increase significantly, sizeable emission reductions should result.
While these estimated reductions are not overly sizeable, they do illustrate that a switch to alternative fuel vehicles will result in the reduction of ozone precursors in addition to reducing our nation’s dependence on foreign oil. As alternative fuel technology advances, refueling infrastructure expands, and the use of alternative fuels becomes more acceptable, the emissions reductions resulting from the utilization of an AFV fleet in the SA MSA should become more significant.
K-10
Transportation Demand Management
IntroductionTDMs are transportation projects and related activities that are designed to achieve on-road mobile source emission reductions and are included as control measures in the SIP. These measures target the users (demand) of transportation facilities (supply) rather than the facilities.
Successful implementation of TDMs can contribute to the reduction in frequency of traffic congestion, and by smoothing the traffic flow they can particularly reduce emission of VOCs and CO2, which occur at lower traveling speed.
The following pages contain materials that AACOG staff has used for conducting two local surveys on use of TDMs in 2001 and 2004. The 2001 survey database was used to supplement the 2004 survey. The overall impacts of TDMs on reduction of ozone precursors are also discussed at the end of this section.
Cover Letter & Alternative Work Schedule Survey Questionnaire:
April 22, 2004
NameMailing address
Dear :
As part of our on-going efforts in regards to the San Antonio region air quality planning, the Alamo Area Council of Governments (AACOG) is conducting this survey to collect information on employees flexible work schedule, and ride sharing programs. Employers practice these programs in order to mitigate air pollution and traffic congestion during the weekday rush hours, also to make more efficient use of our transportation resources. We would like to include the information about your organization’s programs in our study.
The elected officials in the San Antonio region have made a commitment to promote locally favorable air quality control strategies to keep San Antonio’s air quality within the national standards. The information that you give us will be used to determine the effectiveness of such air quality control strategies in reducing and controlling emission of air pollutants in the region. Your input is very vital to the success of our efforts.
Please take a moment and provide your responses on the attached questionnaire and return it by the indicated date.
Thank you for your time and participation. If you have any questions or comments please contact Parviz Nazem of our technical staff, at (210) 362-5317.
Regionally yours,
Al J. Notzon IIIExecutive Director
Enclosure: Questionnaire
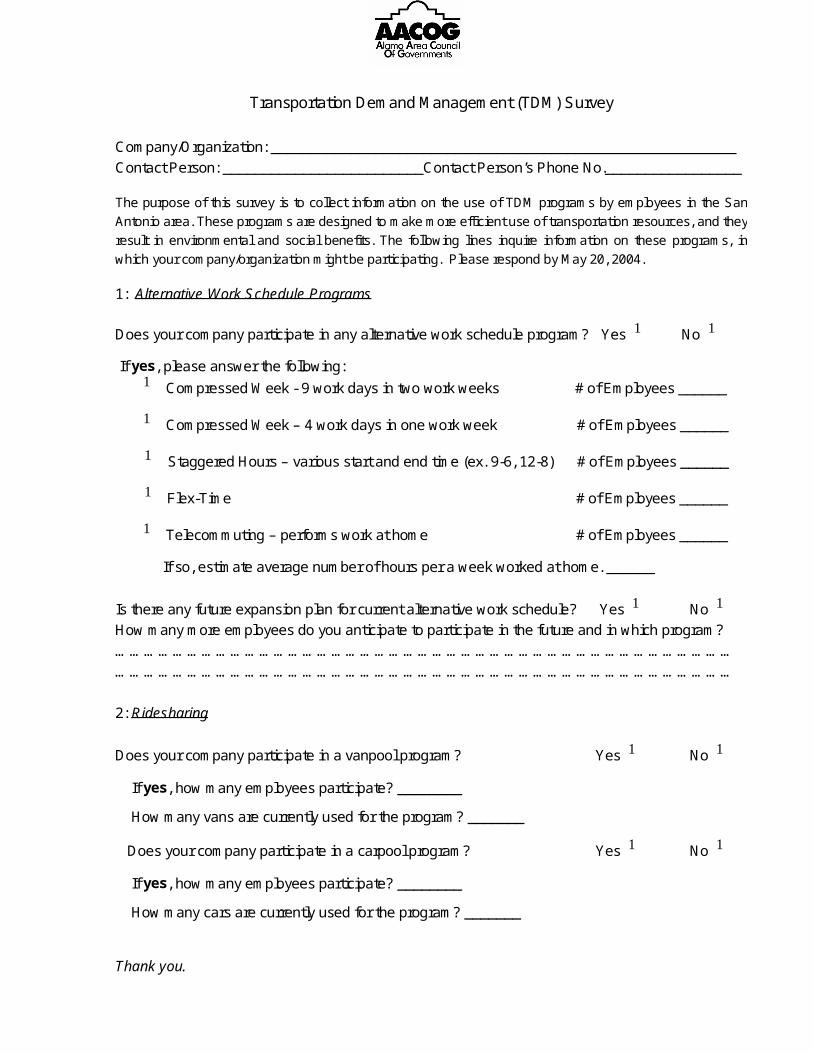
Transportation Demand Management (TDM) Survey
Company/Organization: __________________________________________________________Contact Person: _________________________Contact Person’s Phone No._________________
The purpose of this survey is to collect information on the use of TDM programs by employees in the SanAntonio area. These programs are designed to make more efficient use of transportation resources, and theyresult in environmental and social benefits. The following lines inquire information on these programs, inwhich your company/organization might be participating. Please respond by May 20, 2004.
1: Alternative Work Schedule Programs
Does your company participate in any alternative work schedule program? Yes No
If yes, please answer the following: Compressed Week - 9 work days in two work weeks # of Employees ______
Compressed Week – 4 work days in one work week # of Employees ______
Staggered Hours – various start and end time (ex. 9-6, 12-8) # of Employees ______
Flex-Time # of Employees ______
Telecommuting – performs work at home # of Employees ______
If so, estimate average number of hours per a week worked at home. ______
Is there any future expansion plan for current alternative work schedule? Yes No
How many more employees do you anticipate to participate in the future and in which program?……………………………………………………………………………………………………………………………………………………………………………………………………………………………………
2: Ridesharing
Does your company participate in a vanpool program? Yes No
If yes, how many employees participate? ________
How many vans are currently used for the program? _______
Does your company participate in a carpool program? Yes No
If yes, how many employees participate? ________
How many cars are currently used for the program? _______
Thank you.
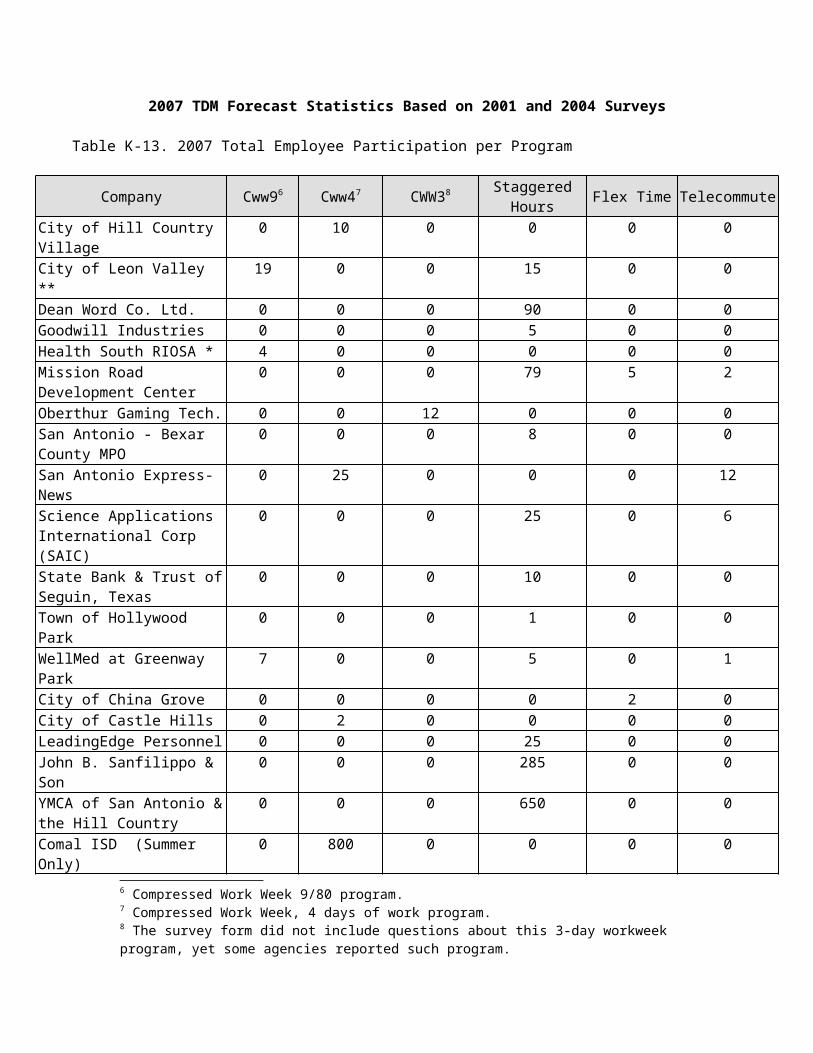
2007 TDM Forecast Statistics Based on 2001 and 2004 Surveys
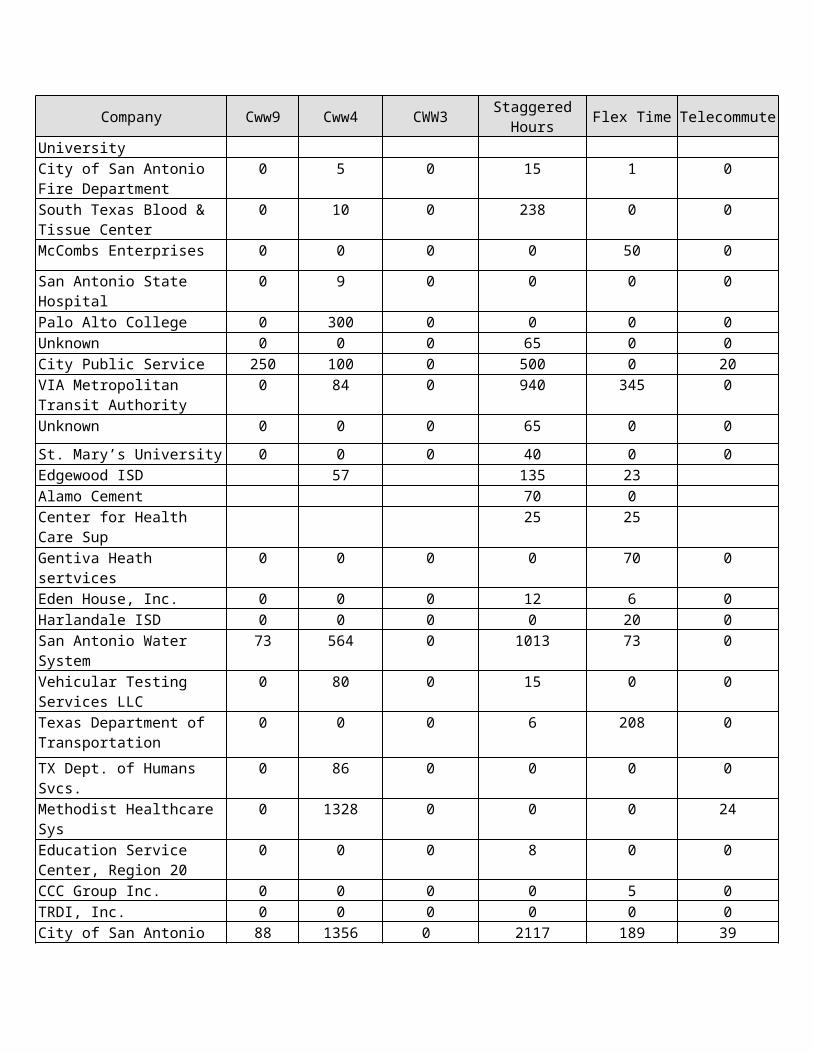
Table K-13. 2007 Total Employee Participation per Program
Company Cww96 Cww47 CWW38 Staggered Hours Flex Time Telecommute
City of Hill Country Village 0 10 0 0 0 0City of Leon Valley ** 19 0 0 15 0 0Dean Word Co. Ltd. 0 0 0 90 0 0Goodwill Industries 0 0 0 5 0 0Health South RIOSA * 4 0 0 0 0 0Mission Road Development Center
0 0 0 79 5 2
Oberthur Gaming Tech. 0 0 12 0 0 0San Antonio - Bexar County MPO
0 0 0 8 0 0
San Antonio Express-News 0 25 0 0 0 12Science Applications International Corp (SAIC)
0 0 0 25 0 6
State Bank & Trust of Seguin, Texas
0 0 0 10 0 0
Town of Hollywood Park 0 0 0 1 0 0WellMed at Greenway Park 7 0 0 5 0 1City of China Grove 0 0 0 0 2 0City of Castle Hills 0 2 0 0 0 0LeadingEdge Personnel 0 0 0 25 0 0John B. Sanfilippo & Son 0 0 0 285 0 0YMCA of San Antonio & the Hill Country
0 0 0 650 0 0
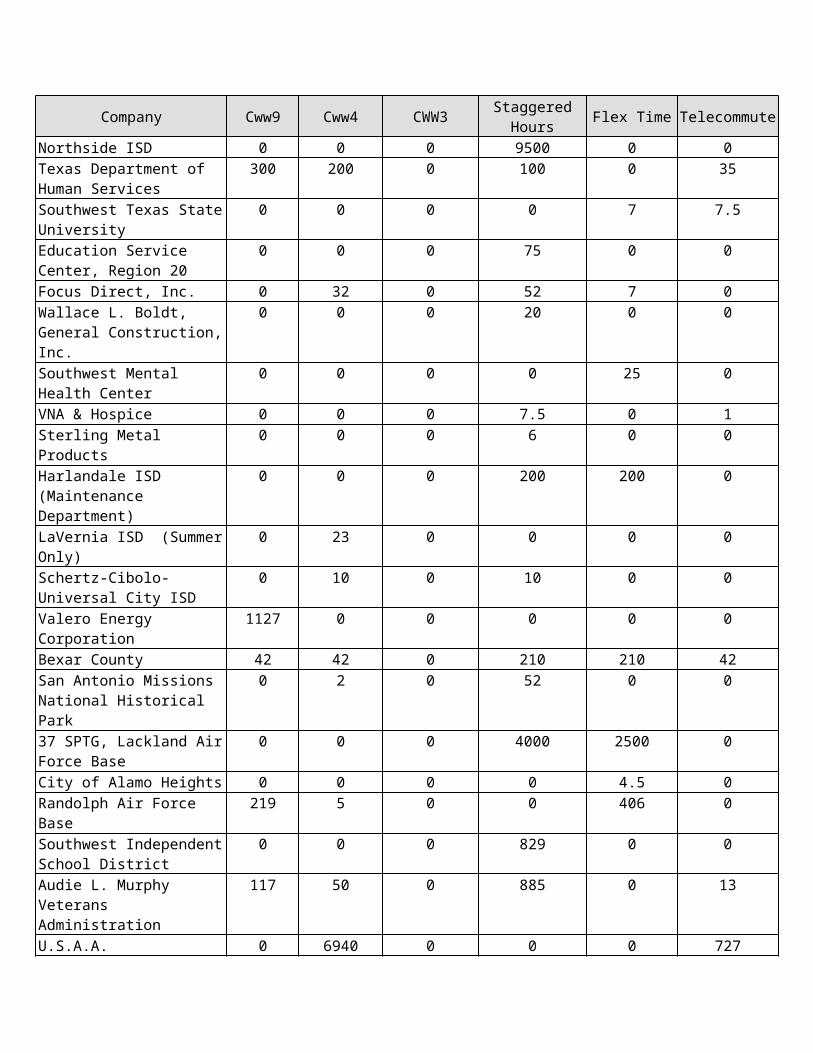
Comal ISD (Summer Only) 0 800 0 0 0 0Northside ISD 0 0 0 9500 0 0Texas Department of Human Services
300 200 0 100 0 35
Southwest Texas State University
0 0 0 0 7 7.5
Education Service Center, Region 20
0 0 0 75 0 0
Focus Direct, Inc. 0 32 0 52 7 0Wallace L. Boldt, General Construction, Inc.
0 0 0 20 0 0
Southwest Mental Health Center
0 0 0 0 25 0
VNA & Hospice 0 0 0 7.5 0 1Sterling Metal Products 0 0 0 6 0 0
6 Compressed Work Week 9/80 program.7 Compressed Work Week, 4 days of work program.8 The survey form did not include questions about this 3-day workweek program, yet some agencies reported such program.
Company Cww9 Cww4 CWW3 Staggered Hours Flex Time Telecommute
Harlandale ISD (Maintenance Department)
0 0 0 200 200 0
LaVernia ISD (Summer Only)
0 23 0 0 0 0
Schertz-Cibolo-Universal City ISD
0 10 0 10 0 0
Valero Energy Corporation 1127 0 0 0 0 0Bexar County 42 42 0 210 210 42San Antonio Missions National Historical Park
0 2 0 52 0 0
37 SPTG, Lackland Air Force Base
0 0 0 4000 2500 0
City of Alamo Heights 0 0 0 0 4.5 0Randolph Air Force Base 219 5 0 0 406 0Southwest Independent School District
0 0 0 829 0 0
Audie L. Murphy Veterans Administration
117 50 0 885 0 13
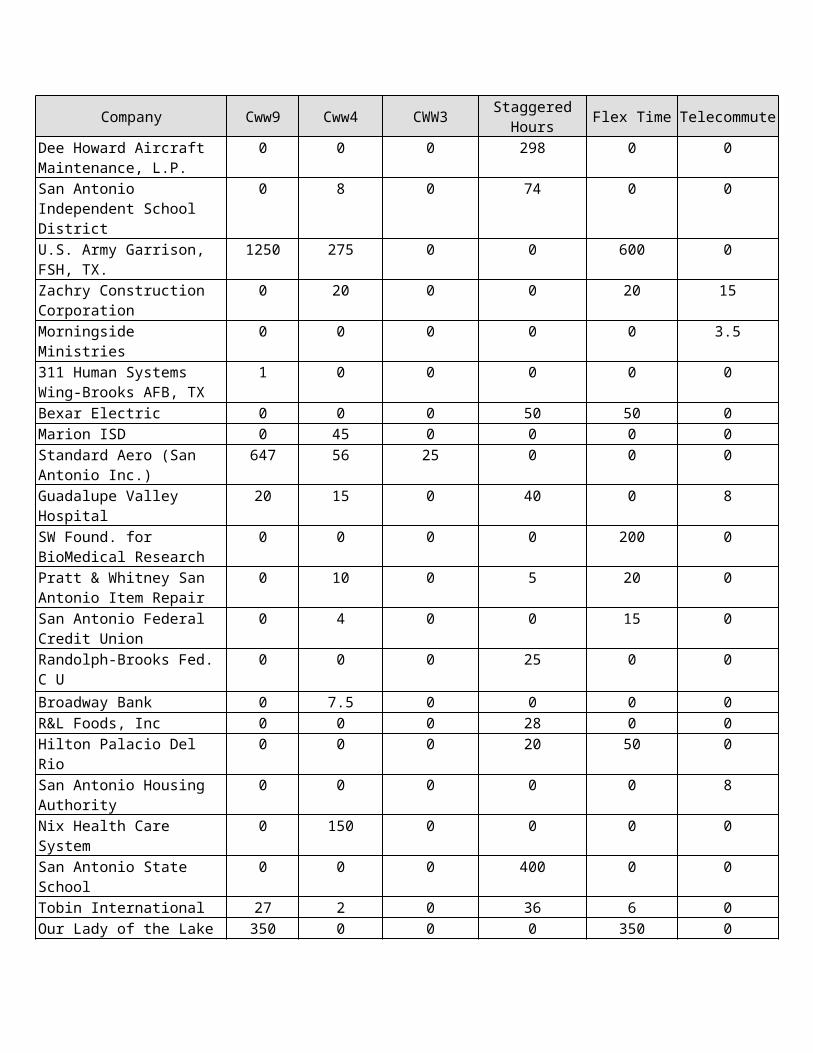
U.S.A.A. 0 6940 0 0 0 727Dee Howard Aircraft Maintenance, L.P.
0 0 0 298 0 0
San Antonio Independent School District
0 8 0 74 0 0
U.S. Army Garrison, FSH, TX.
1250 275 0 0 600 0
Zachry Construction Corporation
0 20 0 0 20 15
Morningside Ministries 0 0 0 0 0 3.5311 Human Systems Wing-Brooks AFB, TX
1 0 0 0 0 0
Bexar Electric 0 0 0 50 50 0Marion ISD 0 45 0 0 0 0Standard Aero (San Antonio Inc.)
647 56 25 0 0 0
Guadalupe Valley Hospital 20 15 0 40 0 8SW Found. for BioMedical Research
0 0 0 0 200 0
Pratt & Whitney San Antonio Item Repair
0 10 0 5 20 0
San Antonio Federal Credit Union
0 4 0 0 15 0
Randolph-Brooks Fed. C U 0 0 0 25 0 0
Broadway Bank 0 7.5 0 0 0 0R&L Foods, Inc 0 0 0 28 0 0Hilton Palacio Del Rio 0 0 0 20 50 0
Company Cww9 Cww4 CWW3 Staggered Hours Flex Time Telecommute
San Antonio Housing Authority
0 0 0 0 0 8
Nix Health Care System 0 150 0 0 0 0San Antonio State School 0 0 0 400 0 0Tobin International 27 2 0 36 6 0Our Lady of the Lake University
350 0 0 0 350 0
City of San Antonio Fire Department
0 5 0 15 1 0
South Texas Blood & Tissue Center
0 10 0 238 0 0
McCombs Enterprises 0 0 0 0 50 0
San Antonio State Hospital 0 9 0 0 0 0Palo Alto College 0 300 0 0 0 0Unknown 0 0 0 65 0 0City Public Service 250 100 0 500 0 20VIA Metropolitan Transit Authority
0 84 0 940 345 0
Unknown 0 0 0 65 0 0
St. Mary’s University 0 0 0 40 0 0Edgewood ISD 57 135 23Alamo Cement 70 0Center for Health Care Sup 25 25Gentiva Heath sertvices 0 0 0 0 70 0Eden House, Inc. 0 0 0 12 6 0Harlandale ISD 0 0 0 0 20 0San Antonio Water System 73 564 0 1013 73 0Vehicular Testing Services LLC
0 80 0 15 0 0
Texas Department of Transportation
0 0 0 6 208 0
TX Dept. of Humans Svcs. 0 86 0 0 0 0
Methodist Healthcare Sys 0 1328 0 0 0 24
Education Service Center, Region 20
0 0 0 8 0 0
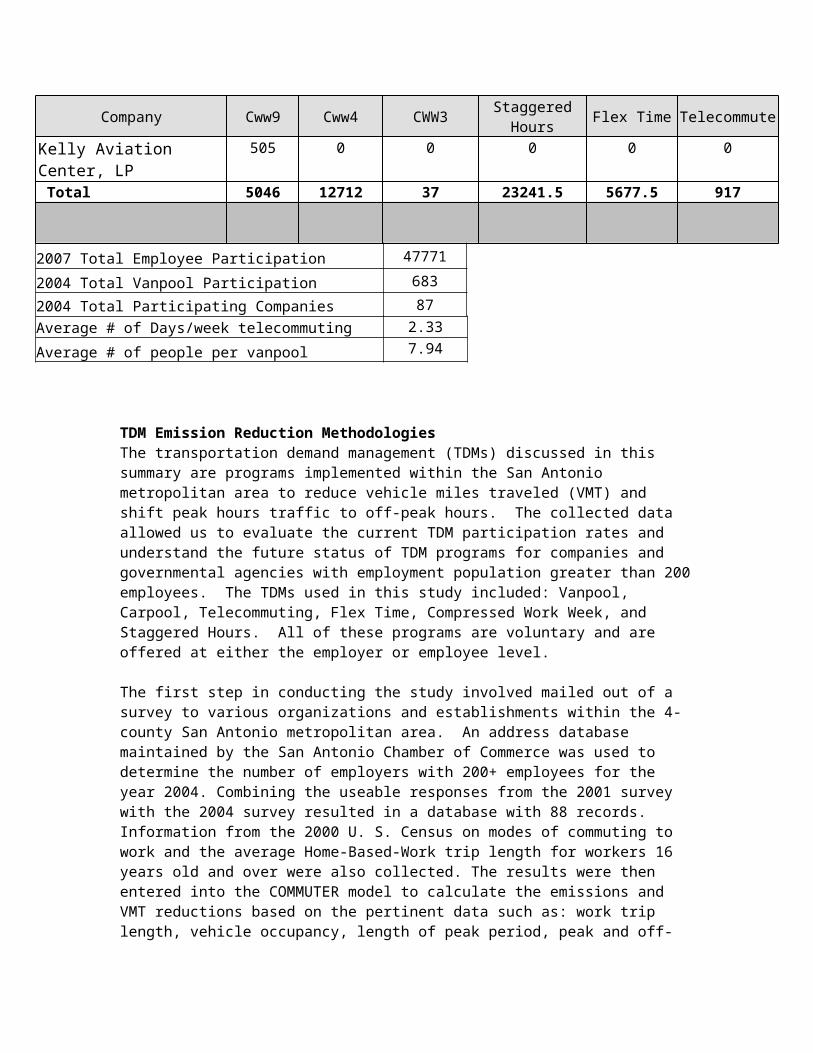
CCC Group Inc. 0 0 0 0 5 0TRDI, Inc. 0 0 0 0 0 0City of San Antonio 88 1356 0 2117 189 39Kelly Aviation Center, LP 505 0 0 0 0 0 Total 5046 12712 37 23241.5 5677.5 917

Company Cww9 Cww4 CWW3 Staggered Hours Flex Time Telecommute
2007 Total Employee Participation 47771
2004 Total Vanpool Participation 683
2004 Total Participating Companies 87
Average # of Days/week telecommuting 2.33
Average # of people per vanpool 7.94
TDM Emission Reduction MethodologiesThe transportation demand management (TDMs) discussed in this summary are programs implemented within the San Antonio metropolitan area to reduce vehicle miles traveled (VMT) and shift peak hours traffic to off-peak hours. The collected data allowed us to evaluate the current TDM participation rates and understand the future status of TDM programs for companies and governmental agencies with employment population greater than 200 employees. The TDMs used in this study included: Vanpool, Carpool, Telecommuting, Flex Time, Compressed Work Week, and Staggered Hours. All of these programs are voluntary and are offered at either the employer or employee level.
The first step in conducting the study involved mailed out of a survey to various organizations and establishments within the 4-county San Antonio metropolitan area. An address database maintained by the San Antonio Chamber of Commerce was used to determine the number of employers with 200+ employees for the year 2004. Combining the useable responses from the 2001 survey with the 2004 survey resulted in a database with 88 records. Information from the 2000 U. S. Census on modes of commuting to work and the average Home-Based-Work trip length for workers 16 years old and over were also collected. The results were then entered into the COMMUTER model to calculate the emissions and VMT reductions based on the pertinent data such as: work trip length, vehicle occupancy, length of peak period, peak and off-peak speeds, office and non-office employee population, 2007 MOBILE5 generated emission factors, and VMT mix by vehicle type.The survey conducted on TDM participation showed that Staggered Hours was the most widely used TDM in this region, followed by Compressed Work Weeks, Flex Time, and Telecommuting. Overall, based on this 2004 survey and other local input data, these TDMs are expected to reduce VOC’s by 60 pounds per day; the NOx emissions will be reduced by 52 pounds per day.
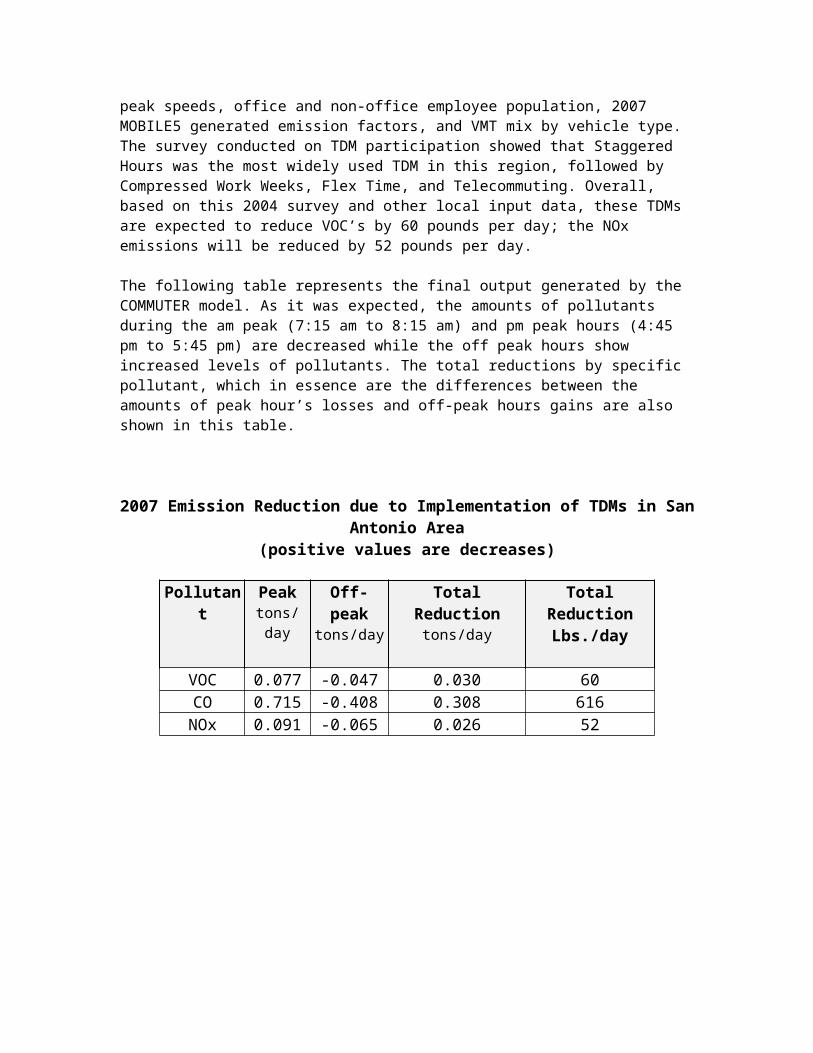
The following table represents the final output generated by the COMMUTER model. As it was expected, the amounts of pollutants during the am peak (7:15 am to 8:15 am) and pm peak hours (4:45 pm to 5:45 pm) are decreased while the off peak hours show increased levels of pollutants. The total reductions by specific pollutant, which in essence are the differences between the amounts of peak hour’s losses and off-peak hours gains are also shown in this table.
2007 Emission Reduction due to Implementation of TDMs in San Antonio Area
(positive values are decreases)
Pollutant Peaktons/day
Off-peaktons/day
Total Reductiontons/day
Total Reduction Lbs./day
VOC 0.077 -0.047 0.030 60CO 0.715 -0.408 0.308 616NOx 0.091 -0.065 0.026 52
Voluntary Air Quality Control StrategiesAn integral part of air quality planning for the San Antonio EAC Region is the involvement of area leaders in business and industry, local school district officials, and other agencies in the adoption of voluntary measures. As part of the Clean Air Plan, AACOG compiled a special list of participating businesses and agencies within the area that have begun to adopt voluntary measures which will help clean the air. Responding companies and agencies categorized their actions as “Commitment Measures” or “Voluntary Measures” for incorporation into the plan.
Commitment Measures - These commitments are provided to the Texas Commission on Environmental Quality (TCEQ) and the US Environmental Protection Agency (EPA) as part of the Clean Air Plan and the State Implementation Plan (SIP). The commitments are evidence of an ongoing commitment by local leaders in support of clean air policy.
Voluntary Measures - These commitments will be done on a voluntary basis to minimize emissions to the best of a company's ability.
It is important to understand that the following commitments were obtained from the agencies, and authorized by signature. The authorization consent form signed contains the following specific language, followed by the signature block:
Authorization - I authorize the Air Improvement Resources Committee to include our actions and commitments, as described and classified above (referring to the "Commitment" and "Voluntary" definitions above), in the Clean Air Plan that will be submitted to EPA and TCEQ. I understand that copies of our letters describing our commitment may be included in the Clean Air Plan.
A copy of one of the signed commitment letters (from the San Antonio Water System) is attached to the end of this appendix as an example of this process and the form mailed out to each agency.
The following pages contain strategy descriptions of companies, agencies, and school districts that have volunteered to practice these air-cleaning strategies.
Bexar CountyCommitment Measures: Commitment letter signed by Renee D. Greene, P.E. – Director of Environmental Service, Bexar County, February 4, 2004Converted eighty percent of its eligible fleet to propane. Alternative fuels with low Reid Vapor Pressure (RVP) are purchased for gasoline powered vehicles. Providing bus pass subsidies to all employeesA public outreach program has been developed and information is posted on the county’s website.On Air Quality Health Alert Days, the county suspends activities such as refueling, paving, mowing and painting. Air Quality Health Alert flags are flown at all county offices.Low RVP gasoline is used in all Bexar County sheriff patrol vehicles. The County continues to replace fleet vehicles with low emission vehicles (LEV).Texas Ultra Low Sulfur Diesel Fuel is used in Bexar County diesel fleet vehicles.
Voluntary MeasuresEncourage employees to use general energy conservation measures (i.e., turn off lights and equipment when they are not in use, at home and at work.Maintain fleet vehicles and buses according to manufacturer’s tune-up and emissions control standard.Post signs at facilities promoting ozone reduction measures.Commit to using cleaner burning fuelAchieve code compliance in the International Energy Conservation Code (IECC).
City of ConverseCommitment Measures: Commitment letter signed by Sam Hughes – City Manager, City of Converse, March 16, 2004Encourage employees to use general energy conservation measures (i.e., turn off lights and equipment to reduce power load when not in use, both at work and home). Maintain fleet vehicles and buses according to manufacturer’s tune-up and emissions standards. Refuel fleet vehicles and buses carefully and in the cooler evening hours during an AQHA. Instruct employees and fleet drivers to practice efficient driving such as avoiding excessive idling, minimizing cold starts by combining trips, avoiding jackrabbit acceleration, and driving 55 mph maximum.
Voluntary MeasuresGive incentives to those employees who are participating in a carpool or vanpool. Encourage employees to bring lunch to work or walk to avoid car travel during lunchtime.
City of Leon ValleyCommitment Measures: Commitment letter signed by the Honorable Marcy Meffert, Mayor of the City of Leon Valley, March 11, 2004Encourage employees to use general energy conservation measures (i.e., turn off all lights and equipment to reduce power load, both at work and home). Maintain all 55 fleet vehicles and buses according to manufacturer’s tune-up and emissions control standards. Refuel all fleet vehicles and buses during cooler evening hours during an AQHA. Will limit the use of oil-based paints, varnishes and degreasers to days that are not AQHA days. Instruct all employees and fleet drivers to practice efficient driving, such as avoiding excessive idling, minimizing cold starts by combining trips, avoiding jackrabbit acceleration and driving 55mph maximum.Post signs at facilities promoting ozone reduction measures at 3 city-owned locations.Achieve code compliance in the International Energy Conservation Code (IECC).
Voluntary MeasuresConsider alternative fuels for vehicle fleets (10 or more vehicles per fleet). Participate in voluntary vehicle emissions testing and maintenance programs. Encourage approximately 30% of city employees to bring a lunch or walk to avoid car travel during lunchtime.Commit to using cleaner burning fuel when financially feasible.
City of San Antonio (COSA)
Commitment Measures: Commitment letter (subject to further City Council action) signed by David E. Newman – Environmental Services Manager, City of San Antonio, March 5, 2004Allow flextime or telecommuting for approximately 3000 city employees.Maintain fleet vehicles according to manufacturers tune-up and emission control standard. The City performs inspection/maintenance on approximately 3000 city fleet vehicles.Consider alternative fuels for small vehicle fleets. Approximately 900 city fleet vehicles are currently alternative fuel vehicles.Post signs at facilities promoting ozone reduction measures for 12,000 city employees.Commit to using cleaner burning fuel.Delay construction operations, such as pothole repair, street striping, and mowing activities, to days that are not Air Quality Health Alert days.Stage II VRS are in place on gasoline dispenser pumps at four service centers and police/fire substations.Use thermoplastics for highway markingsCOSA's Landscape and Tree Preservation Ordinance attempts to preserve existing trees, encourage the planting of new trees, and encourage responsible development.Prohibit use of approximately 20 motorpool vehicles on AQHA days.
Voluntary StrategiesRequested and obtained a lower RVP level for all gasoline shipped into the San Antonio metropolitan region for the ozone season of 1999. Stage I Vapor Recovery Systems (VRS) are in place on UST's at all city fueling facilities.The Purchasing Department implements a modified I/M program using a four-gas emission analyzer. All vehicles are tested by the I/M Program during the annual safety inspection.To encourage employee bus ridership, the City has a bus pass subsidy program for its employees. The City offers approximately 1500 bus pass subsidies at $5 off.Synchronization of stoplights by COSA.Public Outreach Participation.Sponsorship of Public Vehicles Emissions Testing & Media Events.Creation of a COSA-wide Air Quality Health Alert Program.Creation of Intelligent Transportation System (TransGuide).Encourage approximately 12,000 employees to use general energy conservation measures (ie. Turn off lights and equipment to reduce power load when not in use, both at work and home).Instruct employees and fleet drivers to practice efficient driving such as avoiding excessive idling, minimizing cold starts by combining trips, avoiding jackrabbit acceleration, and driving 55 mph maximum.Successfully apply for emissions reductions grants available through theTexas Emission Reduction Program (TERP).Expedited permitting for mixed use, transit oriented or in-fill developmentUse low VOC striping material.Open burning restrictions.Renewable energy program.Low emission vehicles.Offer direct deposit to employees.Fuel city-owned vehicles during the cooler, evening hours.Promote limiting the idling of city-owned vehicles.Transit-Oriented Development.
Encourage approximately 12,000 employees to carpool by giving incentives for carpooling activities. Encourage approximately 12,000 employees to bring a lunch or walk to avoid car travel during lunchtime.Achieve code compliance in the International Energy Conservation Code (IECC).Limit use of oil-based paints, varnishes, and degreasers in the city’s sign shop during an AQHA.
City of StockdaleVoluntary Measures: Letter signed by the Honorable Tony Malik, Mayor of the City of Stockdale, February 20, 2004Encourage employees to use general energy conservation measures (i.e., turn off all lights and equipment to reduce power load, both at work and home). Maintain fleet vehicles according to manufacturer’s tune-up and emissions control standards. Post signs at facilities promoting ozone reduction measures. Refuel fleet vehicles carefully and in the cooler evening hours during an AQHA. Will limit the use of oil-based paints, varnishes and degreasers to days that are not AQHA days. Instruct employees to practice efficient driving, such as avoiding excessive idling, minimizing cold starts by combining trips, avoiding jackrabbit acceleration and driving 55mph maximum.
City Public Service (CPS)Commitment Measures: Commitment letter signed by Joe Fulton – Director, Research and Environmental Management, City Public Service, March 19, 2004Renewable Energy Program – Windtricity program launched in April 2000Emission Reduction Program CPS has reduced NOx at gas and coal units to 50% of 1997 levels and will “net out” of NOx emissions when the new coal unit is scheduled to come on line in 2009.CPS’ program includes combustion tuning and installation of advanced technology.CPS has state and federal air permits for all gas and coal units.New combined cycle gas turbine and simple cycle gas turbines have add-on NOx controls.New coal unit will have BACT controls of NOx, sulfur dioxide and particulate matter.An additional monitoring station will be operated on the southeast side of San Antonio monitoring NOx, SO2, CO, PM-10 and PM 2.5. This will be in addition to the current operating station. Also, four PM-10 monitors will be located on all four sides of the coal plant property.Two compressed natural gas (CNG) trucks are operated and a CNG station is used to fuel the vehicles.Fleet Vehicle Emission ReductionsCPS uses ethanol (E-85) in approximately 136 flex-fueled vehicles.Two hybrid vehicles (Super Ultra Low Emission Vehicles) purchasedTwo compressed natural gas (CNG) trucks used. Night fueling service – approximately 300 fleet vehicles or equipment are fueled at nightVehicles periodically checked with 2-gas analyzer and opacity meter.Texas Emissions Reduction Program (TERP) grant successfully obtained for diesel engine bulldozerPurchase of five propane forklifts
Removal of older vehicles and equipment that have been replaced by vehicles and equipment that meet today’s more stringent emissions standards.
Voluntary MeasuresGive incentives to CPS employees that are interested and participating in a carpool.Give incentives to CPS employees that are interested and use buses for their daily trip to work.Encourage approximately 2500 CPS employees to bring a lunch or walk to avoid car travel during lunchtime via email notices.All flextime or telecommuting for CPS employees for which this option is feasible and allowed by the management of that area.Encourage approximately 2500 CPS employees to use general energy conservation measures (i.e., turn off lights and equipment when they are not in use, at home and at work.)Maintain CPS fleet vehicles according to manufacturer’s tune-up and emissions control standard.Instruct approximately 2500 CPS employees and fleet drivers to practice efficient driving, such as, avoiding excessive idling, minimizing cold starts by combining trips, avoiding jackrabbit acceleration, driving 55 mph maximum.Limit use of oil-based paints, varnishes, and degreasers during an AQHA.
Fort Sam Houston Independent School DistrictCommitment Measures: Commitment Letter signed by Gail E. Siller – Superintendent, Fort Sam Houston ISD, February 25, 2004Instruct employees and fleet drivers to practice efficient driving such as avoiding excessive idling, minimizing cold starts by combining trips, avoiding jackrabbit acceleration and driving 55 mph maximum.Encourage 225 district employees to use general energy conservation measures (i.e., turn off lights and equipment when they are not in use, at home and at work).Maintain 10 district buses according to manufacturer’s tune-up and emissions control standard.Will not mow the lawn or use gas powered lawn equipment during an AQHA on the two district campuses.
Guadalupe CountyVoluntary Measures: Letter signed by Stan Burrier – County Engineer, Guadalupe County, March 17, 2004Employees are encouraged to participate in voluntary programs, such as carpooling whenever possible.Encourage employees to bring a lunch of walk to avoid car travel during lunchtime.Encourage employees to use general energy conservation measures (i.e., turn off lights and equipment when they are not in use, at home and at work).Maintain fleet vehicles and buses according to manufacturer’s tune-up and emissions control standard.Instruct employees and fleet drivers to practice efficient driving, such a, avoiding excessive idling, minimizing cold starts by combining trips, avoiding jackrabbit acceleration, driving 55 mph maximum.
Harlandale ISDCommitment Measures: Commitment letter signed by Henry Galindo - Director of Transportation and Maintenance Support, Harlandale ISD, February 10, 2004
Uses nine alternative fuel buses and will continue to consider alternative fuels for all vehicle purchases.Maintain 150 maintenance vehicles and 59 buses according to manufacturer's tune-up and emissions control standard.Consider alternative fuels for vehicle fleets (10 or more vehicles per fleet).Will not mow lawns or use gas powered lawn equipment during an AQHA at all 25 district facilities.Will limit the use of oil-based paints, varnishes, and degreasers to days that are not designated as AQHA days at all 25 district facilities.Instruct employees and fleet drivers to practice efficient driving, such as, avoiding excessive idling, minimizing cold starts by combining trips, avoiding jackrabbit acceleration, driving 55 mph maximum.
Voluntary MeasuresEncourage all 2,100 employees to use general energy conservation measures (i.e., turn off lights and equipment when they are not in use to reduce power load, both at home and at work).
Lackland Independent School DistrictCommitment Measures: Commitment letter signed by David F. Splitek – Superintendent, Lackland ISD, February 9, 2004Encourage employees to use general energy conservation measures (i.e., turn off lights and equipment to reduce power load when not in use, both at work and home).Maintain fleet vehicles and buses according to manufacturer’s tune-up and emissions control standard. Will not use oil-based paints, varnishes or degreasers on days that are AQHA’s. Encourage employees to bring lunch to work or walk to lunch to avoid car travel during lunchtime. Instruct employees and fleet drivers to practice efficient driving such as avoiding excessive idling, minimizing cold starts by combining trips, avoiding jackrabbit acceleration and driving 55 mph maximum.Post signs at facilities promoting ozone reduction measures Investigate the possibility in applying for emission reduction grants through the Texas Emissions Reductions Plan (TERP).Will comply to a feasible extent the delay of construction operations (using gasoline or diesel equipment) to days that are not Air Quality Health Alert days.During an AQHA, fleet vehicles and buses will be refueled in the cooler evening hours when possible.Gas powered lawn equipment will not be used during an AQHA. Rather, grounds personnel will be assigned alternative tasks.
Voluntary MeasuresConsider alternative fuels for vehicle fleets (10 or more vehicles per fleet). Participate in voluntary vehicle emissions testing and maintenance programs. Give incentives to those employees who are participating in a carpoolGive incentives to those employees who use buses for their daily trip to workCheck availability of fuel stations that dispense cleaner burning fuel.Will explore International Energy Conservation Code (IECC) compliance.
Our Lady of the Lake UniversityVoluntary Measures: Letter signed by Darrell Glasscock – Director of Physical Plant, Our Lady of the Lake University, February 13, 2004Encourage employees to use general energy conservation measures (i.e., turn off lights and equipment to reduce power load when not in use, both at work and home). Maintain fleet vehicles and buses according to manufacturer’s tune-up and emissions standards. Post signs at facilities promoting ozone reduction measures.On Air Quality Health Alert Days, the University will not mow the lawn or use gas powered lawn equipment.
Randolph Air Force BaseCommitment Measures: Commitment letter signed by Colonel Mark W. Graper – USAF, Commander, 12th Flying Training Wing, February 25, 2004Converted from higher volatility fuel (JP-4) to a more environmentally friendly JP-8 fuel.Encourage RAFB populace of 17,000 to use general energy conservation measures (ie. Turn off lights and equipment to reduce power load when not in use, both at work and home).Consider alternative fuels for vehicle fleets. Currently, over 60 vehicles have been converted to alternative fuel capability.Post signs at facilities promoting ozone reduction measures.Encourage RAFB populace of over 17,000 people to bring a lunch or walk to avoid car travel during lunchtime.Maintain approximately 280 fleet vehicles and buses according to manufacturer’s tune-up and emissions control standard.Instruct the base populace of over 17,000 people to practice efficient driving, such as avoiding excessive idling, minimizing cold starts by combining trips, avoiding jackrabbit acceleration, driving 55 mph maximum.
Voluntary MeasuresElevated research on development of sources for fuel alternatives. Review new technologies to ensure that they comply and that law does not hinder the use of new technologies.During AQHA days, refuel fleet vehicles and buses carefully and in cooler evening hours and on days that are not AQHA days.On AQHA days, will not use oil-based paints, varnishes, or degreasers on days that are AQHA’s.
San Antonio / Bexar County Metropolitan Planning OrganizationCommitment Measures: Commitment letter signed by Jeanne Geiger – Deputy Director, San Antonio-Bexar County MPO, March 9, 2004Provides funding for the Rideshare ProgramParticipating in an ongoing public outreach program that encourages commuters to consider alternatives to driving alone.Allow employees to use flex time program to encourage travel outside of the peak periods. Eight of eight employees use this program.The MPO flies the AQHA flag on appropriate days to help create awareness of the AQ situation.
Voluntary Measures
Encourage employees to bring lunch or walk and/or carpool to lunch to reduce cold starts and emissions.Encourage employees to use general energy conservation measures (i.e., turn off lights and equipment when they are not in use at home and at work.)Instruct employees to practice efficient driving, such as avoiding excessive idling, minimizing cold starts by combining trips, avoiding jackrabbit acceleration, driving 55 mph maximum.
San Antonio Water SystemCommitment Measures: Commitment letter signed by Eugene E. Habiger – President/Chief Executive Officer, San Antonio Water Systems, March 2, 2004SAWS has an internal Air Quality Committee that meets as needed to update or address air quality issues that affect SAWS operations. Once a year SAWS distributes information to 280,000 customers, encouraging them to practice emission reduction measures during the ozone season. Encourage employees to use general energy conservation measures. At SAWS, demand side management is practiced. A lighting erplancement program to high efficiency T8 lighting with electronic ballasts is in place at the SAWS Service Centers and will be implemented at all other SAWS owned facilties. An energy database is being created to determine pump efficiencies.Building heating and cooling leaks will be determined using thermal imaging, as well as, preventative maintenance for pumps by setting thermal baselines. Evaluating all existing HVAC systems.Evaluating new roofing.Central Heating & Cooling retrofits.Maintain fleet vehicles according to manufacturer’s tune-up and emissions control standards. Considers alternative fuels for vehicle fleets.Have 5 propane trucks and 5 propane forklifts.Have 69 bi-fuel (unlead/propane) vehicles and 4 electric forklifts.Working with AACOG, Ford, and CleanFuels on a LPG Fueling Station at the new Northwest Service Center. Looking into testing hydrogen fuel cell powered vehicles. Continue to post AQHA signs at SAWS facilities when an AQHA is issued.Flags and signs will be posted at the following Water Recycling Centers: Dos Rios, Leon Creek, Salado Creek, and Medio Creek. Flags and signs will be posted on the following Service Centers: Eastside, Mission Road, Northeast, Northwest, and Van Dyke. Will institute contract language to preclude mowing lawns or using gas-powered lawn equipment during an AQHA. Encourage employees to bring lunch to work to avoid car travel during lunchtime. Instruct employees and fleet drivers to practice efficient driving, such as avoiding excessive idling, minimizing cold starts by combining trips, avoiding jackrabbit acceleration.Stage I and II Vapor Recovery Systems at fleet fuel sites. Fleet fuel sites:Dos RiosEastside Service CenterNortheast Service CenterNorthwest Service CenterMission Road
Van DykenSAWS is currently complying with SECO reporting requirements in achieving code compliance in the International Energy Conservation Code (IECC).Once a year, SAWS distributes information to approximately 340,000 accounts about encouraging them to practice emission reduction measures during the ozone season.
Voluntary MeasuresAllows flextime, compressed workweek, and / or telecommuting for employees. To encourage bus ridership, SAWS has a bus pass subsidy program for its employees.Consider posting signs and flags at SAWS facilities promoting ozone reduction measures.The Kelly Service Center is considering posting a flag and sign.The following Heating & Cooling Facilities are considering posting flags and signs: Central, Alamodome, Brooks, and Kelly.Commit to using cleaner burning fuel.Successfully apply for emissions reductions grants available through the TeXas Emissions Reductions Plan (TERP).Refuel fleet vehicles in the cooler evening hours during an AQHA.Limit use of oil-based paints, varnishes, and degreasers during an AQHA in parts-washers procedures.
Seguin Independent School DistrictCommitment Measures: Commitment document signed by Rene Ramos, Chief Operations Officer, Seguin ISD, February 13, 2004The district does not use oil-based paints. A district-wide energy conservation program has been implemented. Energy conservation measures are included in district procedure manual.Maintain fleet vehicles (26) and buses (54) according to manufacturer’s tune-up and emissions control standards. Encourage employees (1,068) to use general energy conservation measures (i.e., turn off lights and equipment to reduce power load when not in use, both at work and home). Post signs at facilities promoting ozone reduction measures. Do not mow lawns or use gas-powered lawn equipment during an AQHA. Grounds personnel will be given alternative duties.Refuel district’s 26 maintenance vehicles and 54 buses during cooler evening hours during an AQHA. Limit use of oil-based paints, varnishes and degreasers to days that are not designated AQHA days. Painters will be instructed on measures during an AQHA.Instruct employees and fleet drivers to practice efficient driving, such as avoiding excessive idling, minimizing cold starts by combining trips, avoiding jackrabbit acceleration, driving 55 mph maximum during employee training sessions.Post signs at facilities promoting ozone reduction measures in a district-wide email forum.
Voluntary MeasuresEncourage employees to bring lunch to work or walk to lunch to avoid car travel during lunchtime by providing a break area and opportunities to by lunch in office.
South San Antonio ISDCommitment Measures: Commitment letter signed by Ruben G. Flores – Administrator, South San Antonio ISD, February 26, 2004Encourage employees to use general energy conservation measures (i.e., turn off lights and equipment to reduce power load when not in use, both at home and work) during staff/faculty meetings. Maintain fleet vehicles and buses according to manufacturer’s tune-up and emission control standard. Participate in voluntary vehicle emissions testing and maintenance programs. Refuel fleet vehicles and buses carefully and in the cooler evening hours during an AQHA. All maintenance personnel will be informed about limiting use of oil-based paints, varnishes, and degreasers to days that are not AQHA days. Encourage employees to bring lunch or walk to avoid car travel during lunchtime. Instruct employees and fleet drivers to practice efficient driving such as avoiding excessive idling, minimizing cold starts by combining trips, avoiding jackrabbit acceleration and driving 55mph, maximum.Post signs at facilities promoting ozone reduction measures at district schools and administrative offices.All maintenance personnel will be informed to not mow lawns or use gas powered lawn equipment during an AQHA.
Voluntary MeasuresSouth San Antonio ISD will research and evaluate the consideration of alternative fuels for district vehicle fleet.
Texas Department of Transportation (TxDOT)Commitment Measures: Commitment letter signed by Ken Zigrang – District Planner, TxDOT, March 19, 2004TxDOT allows VIA to operate and maintain 4 VIA Park and Ride public parking facilities for the public to access VIA buses on state highway right-of way through Multiple Use Agreements.TxDOT maintains 25 carpool public parking facilities in San Antonio and the surrounding area counties on state highway right-of-way for citizens to use for carpooling.TxDOT allows the City of San Antonio to operate and maintain 16 general public parking areas on state highway right-of-way through Multiple Use Agreements.Courtesy Patrol Crews assist stranded motorists on Bexar County freeways 24 hours per day thus helping minimize obstructions and traffic congestions.For highway maintenance in Bexar County, postpone highway mowing on the right-of-way until after 12:00 noon on Air Quality Health Alert (AQHA) days.For highway construction and maintenance, postpone of delay highway work activities that require lane closures and would result in significant traffic congestion.Propane fueling facilities were installed at all 16 maintenance offices in San Antonio District in FY 2002.Use of TransGuide changeable message signs to inform motorists of vehicle accidents ahead, estimated travel times, lanes closed, detours etc. and thereby help reduce congestion and minimize the time required to open lanes after accidents and other highway incidents. Maintain state vehicles according to manufacturer’s tune-up and emissions control standards. Continue to purchase alternative fueled sedans and pick-ups for the state fleet.
TxDOT has in place several strategies to allow flexibility on Air Quality Health Alert Days. These include but are not limited to:Notifying all employees of pending Air Quality Health Alert Days by electronic mail the day before; allowing employees to better plan their travel.Refueling of TxDOT vehicles is restricted until the cooler evening hours.TransGuide messages to travelers to limit driving due to ozone levels.Postpone lawn mowing or use of gas powered lawn equipment at office grounds and for landscape maintenance contracts on AQHA days.In highway construction, contractors may not close any lanes during rush hours.Use alternative fuels in state vehicles.Agency diesel vehicles are fueled with Tx-LED
Voluntary MeasuresUtilizing flextime by employees, staggering staff arrival to avoid rush hour during the ozone season.During AQHAs, ask outlying offices to restrict travel to the main complex.Use of propane fuel in state vehicles in strongly encouraged.Encourage employees to use energy conservation measures (ie., turn off vehicle engines when not in use at home and at work).Instruct employees to practice efficient driving practices such as avoiding excessive idling, minimizing cold starts by combining trips, and avoiding jackrabbit acceleration.Ask outlying offices to postpone or minimize travel to the district headquarters complex.
UT Health Science Center at San AntonioCommitment Measures: Commitment letter signed by Michael A. Charlton, Ph.D. – Director of Environmental Health and Safety, UTHSCSA, February 27, 2004An on-site vehicle preventive maintenance program to reduce fleet vehicle emissions. The University has a lighting retrofit project in place, which will decrease energy consumption. Maintain fleet vehicles and buses according to manufacturer's tune-up and emissions control standard on all UTHSCSA vehicles.All grounds keeping staff will not mow lawns or use gas-powered lawn equipment during an AQHA. Refuel vehicles and buses carefully and in the cooler evening hours during an AQHA. All Paint Shop employees will limit use of oil-based paints, varnishes, and degreasers to days that are not an AQHA. Have reduced the number of University Police vehicles and have officers on bike patrol.
Voluntary MeasuresParticipate in voluntary vehicle emissions testing and maintenance programs. Allow flextime, compressed workweek, and/or telecommuting to employees. The University has policies in place for flextime and telecommuting, with a 20 % employee participation rate. Encourage employees to use general energy conservation measures (i.e., turn off lights and equipment to reduce power load when not in use, both at home and work). Instruct employees and fleet drivers to practice efficient driving, such as avoiding successive idling, minimizing cold starts by combining trips, avoiding jackrabbit acceleration, driving 55 mph.Consider alternative fuels for vehicle fleets (10 or more vehicles per fleet). Encourage employees to bring lunch to work or walk to avoid car travel during lunchtime.
Further Ozone Reduction MeasuresUTHSCSA has entered into a contract to upgrade boiler controls and reduce emissions from the main campus central energy plant. Upgrades will be done by July 31, 2005 and include emissions controls, burner management system, combustion controls, and emissions testing and verification. NOx emissions will be reduced by greater than 75%; CO will be reduced by 25%.
Valero Energy CorporationVoluntary Measures: Letter signed by Julie Klumpyan, Government Affairs, Valero Energy Corporation, March 12, 2004Valero provided lower RVP gasoline during the ozone season of 1998.All area refineries voluntarily provided lower RVP (7.8) during ozone season of 1999.Valero Energy Corporation has provided fuel with a lower average sulfur level (150 ppm or less) in their gasoline over the past three years.Valero now produces Texas Low Emission Diesel.Valero’s Three River’s Refinery averaged 80 ppm sulfur in 2003.Encourage employees to bring a lunch or walk to avoid car travel during lunchtime. Valero Energy Corporation has a company cafeteria which reduces car travel during lunch.
VIA Metropolitan TransitCommitment Measures: Commitment letter signed by Priscilla Ingle – Vice President Public Affairs, VIA Metropolitan Transit, February 26, 2004Diesel Fleet Emissions ReductionsVoluntarily retrofitted all pre 19998 EPA emissions certified, Heavy-Duty (HD), diesel powered buses with exhaust catalysts (catalytic converters).Since 1999, 345 early model, HD diesel buses have been replaced with late model propane and clean burning, diesel engine HD buses for a minimum 67% reduction in NOx emissions.61 HD buses better CFFV ULEV emissions standards.Streetcars:5-each, diesel powered streetcars replaced with LPG (CFFV LEV) streetcars for a 71% reduction in NOx emissions on a per vehicle basis.4-each, diesel powered streetcars repowered with LPG (CFFV LEV) engines for a 56% reduction in NOx emissions on a per vehicle basis.Bus Garage Improvements Currently expanding LPG fuel dispensing capacityReplacing solvent based parts cleaners with water/steam type cleanersOn-Street Improvements Bike racks on all HD busesInstruct employees and fleet drivers to practice efficient driving, such as, avoiding excessive idling, minimizing cold starts by combining trips, avoiding jackrabbit acceleration, driving 55 mph maximum. These practices are taught and monitored.Electricity ConsumptionCommitted to include International Energy Conservation Codes on new construction projects.
Voluntary MeasuresPropane (LPG) Fleet Emissions ReductionsOperates alternatively fueled (LPG) vehicles
92-each, dedicated and bi-fuel, transit patrol cars and support vehicles105-each, dedicated LPG, paratransit vehicles67-each, dedicated LPG, 30-ft passenger buses certified to CFFV LEV standards9-each, dedicated LPG, streetcars. Certified to CFFV LEV standardsA TERP grant application is being prepared to repower/retrofit 67 each CFFV LEV propane engines to achieve a 28% reduction in NOx emissions on a per vehicle basis, bettering CFFV ULEV standards.Preparations are underway to replace the current paratransit fleet vehicles with new vehicles that are expected to better CFFV ULEV standards and provide a minimum, 70% reduction in NOx emissions on a per vehicle basis.Supports efforts to expand the use of propane as an automotive fuelProvides propane related technical support to other fleetsActively participates in propane engine and motor fuel R&DDiesel Fleet Emissions Reductions281 HD buses operate on Diesel #1 versus Diesel #2 for reduced levels of NOx and PM emissions.61 HD buses operated on Texas Low Emissions Diesel (ULSD).Preliminary grant approval has been received to retrofit 217 diesel powered HD buses with EGR and PM filters. One retrofitted the NOx emissions, on a per vehicle basis, will be reduced at least 40% and will better CFFV ULEV standards.Preliminary grant approval has been received to fund the pull-ahead use of Texas Low Emission Diesel in all pre-2004 emissions certified HD diesel buses for a 7% reduction in NOx.Scheduled to replace, within 2 years, 1998 and 1992 year model HD buses to achieve a 77% and 50% (respectively) reductions in NOx emissions on a per vehicle basis.Within 2-years, following the approval and implementation of retrofit and replacement programs, all diesel operated HD buses are expected to operate at emissions levels that are better CFFV ULEV standards. This reduction will provide an overall 46% reduction in diesel fleet NOx emission compared to current (early 2004) levles and a 77% reduction in HD diesel fleet NOx emissions since 1999.Bus Garage Improvements Recovers paint solventsPlanned CARB compliant booth replacement61-buses equipped with dry-break fuel nozzlesOn-Street Improvements Tree planting at bus stops programEmployee IncentivesProvides fee fares to employee bus ridersAllows flextime reducing utility peaksProvides reserved parking spaces for employees who carpoolEducation and Cooperation:BusinessOperates a business pass program (over 100 companies currently provide bus passes to their employees on site, at cost or reduced price).PublicProvides advertising to encourage transit ridership Encourages employers to provide discounts as incentives to transit ridersSponsors a yearly Environmental Symposium (3 years)Educates students about transit (Classroom on Wheels Project)Promotes AACOG’s Guaranteed Ride Home ProgramElectricity Consumption
Since 2001, VIA has reduced electricity consumption by 8%VIA continues its efforts to reduce electricity consumption Lighting retrofits Employee awareness Garage facility retrofitsVIA is an active member of the Metropolitan Partnership for Energy working to increase energy efficiency and reduce pollution in the San Antonio area.Encourage employees to bring a lunch or walk to avoid car travel during lunchtime.Maintain fleet vehicles and buses according to manufacturer’s tune-up and emissions control standard. Signs are posted throughout the VIA facility that promote ozone reduction measures.Ninety percent of all vehicles are refueled after 8:00 p.m. during an AQHA.Will not mow the lawn or use gas powered lawn equipment during an AQHA as much as possible.Will limit the use of oil-based paints, varnishes, and degreasers during an AQHA as much as possible.
Transportation Emission Reduction Measures
IntroductionTransportation Emission Reduction Measures (TERMs) are strategies or actions that can be employed to offset increases in nitrogen oxide (NOx) and volatile organic compound (VOC) emissions from mobile sources. All TERMs are intended to reduce either the number of vehicle trips, vehicle miles traveled, or both. These strategies may include ridesharing and telecommuting programs, clean fuel vehicle programs, which were all described in previous sections, and improved transit/ bicycling facilities, or other possible actions such as intersection improvement and signalization.
Many of the transit and highway projects included in the MPO’s Transportation Improvement Programs (TIP), as well as, the non-federally funded roadway projects sponsored by the local governments in the San Antonio region qualify as TERMs projects. This is because they aim at reducing congestion and the number of trips made by vehicles, and ultimately, improving the air quality. Table-K14, below, includes eligible TERMs projects that were or are scheduled to be completed between 1999 and 2007.
It is important to note that TERMs can be quantified as creditable reductions. While the reductions have not been included in the attainment demonstration of the San Antonio proposed revisions to the State Implementation Plan, local air quality planners are now researching measures to make the TERMs enforceable. The region is intent on making them enforceable and calculating credit for them in coordination with the state and the local San Antonio / Bexar County Metropolitan Planning Organization. Even if credit is not taken here for the implemented TERMs projects in the region, the benefits of the reductions accrue as “Additional Evidence” that the San Antonio region will reach attainment.
Table K-14: Transportation Emission Reduction Measures San Antonio 4-County EAC Region2007 Emissions Reductions (lbs/day)
PROJECTTYPE AGENCY PROJECT
NAME FROM TO LETDATE
VOCLbs/day
NOxLbs/day
Sidewalk TxDOT Acme Road Old Highway 90 1999 0.069 0.058Sidewalk TXDOT Gevers St IH 10 Southcross 2000 0.242 0.204Sidewalk TXDOT Henderson Pass Thousand Oaks Gold Canyon 2000 0.202 0.170Sidewalk TXDOT IH 410 Bertetti Marbach 2000 0.050 0.042Bike/Ped TXDOT Mission Trails (Phase 3) E. Southcross Mitchell St. 2000 0.712 0.600Bike/Ped TxDOT Mitchell St. Probandt to Roosevelt 2000 0.104 0.088Bike/Ped TxDOT Nogalitos (LP 353) Zarzamora / New
Laredo HwySurrey 2000 0.235 0.198
Bike/Ped TXDOT Probandt St. US 90 Mitchell 2000 0.014 0.012Bike/Ped TXDOT Prue Rd Laureate Fredericksburg 2000 0.065 0.054Bike/Ped TXDOT Rittiman Austin Hwy (LP
368)Harry Wurzbach 2000 0.124 0.105
Bike/Ped TXDOT Timber Path Bikeway Les Harrison Grissom Rd. 2000 0.166 0.140Bike/Ped TXDOT Bitters Rd Broadway Nacogdoches Rd. 2001 0.282 0.237Bike/Ped TxDOT Callaghan Hemphill Culebra 2001 0.266 0.225Bike/Ped TXDOT Coliseum Rd. East Houston St. Gembler Rd. 2001 0.123 0.104
PROJECTTYPE AGENCY PROJECT
NAME FROM TO LETDATE
VOCLbs/day
NOxLbs/day
Bike/Ped TxDOT East Houston St. Walters Onslow 2001 0.054 0.045Bike/Ped TXDOT East Houston St. Onslow St. Salado Creek 2001 0.084 0.071Bike/Ped TXDOT Pearsall Rd (FM 2536) Loop 13 (Military
Drive)IH 410 2001 2.630 2.216
Bike/Ped TXDOT Pecan Valley Dr J St. to IH 10 2001 0.049 0.041Bike/Ped TXDOT Pleasanton Moursund Gillette 2001 0.027 0.023Bike/Ped TXDOT Southcross WW White (LP 13) Loop 410 2001 0.209 0.176Bike/Ped TXDOT Uhr Lane Higgins Thousand Oaks 2001 0.210 0.177Bike/Ped TXDOT New World Crestway Montgomery 2004 0.050 0.042Sidewalk TXDOT New World Montgomery Dr Walzem Rd ( FM
1976)2004 0.050 0.042
Sidewalk Federal Alamo Cedar San Antonio River 2003 0.031 0.026Sidewalk TXDOT W.W. White Rd. (Loop 13) Seale Road IH-10 2004 0.336 0.283Sidewalk TXDOT Grissom/Culebra (FM 471) SH 16 Loop 1604 2003 2.040 1.719Sidewalk TxDOT Southcross Blvd. S. New Braunfels
to S. Presa St.S. Presa St. 2005 0.107 0.090
Sidewalk TxDOT Hunt Lane Marbach to US 90 us 90 2004 0.273 0.230Sidewalk Federal Isom Ramsey US 281 2004 0.084 0.071Sidewalk COSA Roland (US 87) IH 10 Rigsby Avenue 2004 0.100 0.084Sidewalk COSA SH 218 (Pat Booker Road) Loop 1604 FM 78 2004 0.998 0.841Sidewalk COSA Sunset Jones Maltsberger Teak 2004 0.135 0.114Sidewalk Bexar Kitty Hawk Rd Miller Rd. Converse City
Limits2004 0.070 0.059
Bikeway COSA UTSA to OLLU Corridor Houston St. 24th St. 2004 0.507 0.427Bikeway COSA Cincinnati St. Mary's
UniversityNavidad 2004 0.189 0.159
Bikeway COSA Cincinnati / Ashby Navidad North St. Mary's St. 2004 0.189 0.159Bikeway COSA Alamo / Broadway Corridor Josephine The Alamo 2004 0.297 0.251Bikeway Bexar Crestway Miller Road New World 2004 0.070 0.059Sidewalk Bexar New World Crestway Miller Road 2004 0.026 0.022Bike racks COSA Various Locations 2004 0.000 0.000Sidewalk COSA Clark Southcross Hot Wells 2004 0.073 0.062Sidewalk Bexar Crestway Drive New World Windcrest City
Limits2004 0.060 0.051
Sidewalk COSA Hot Wells IH 37 New Braunfels 2004 0.016 0.013Sidewalk COSA E. Houston Pine Walters 2004 0.060 0.050Bike lane COSA Ingram Callaghan Benrus 2004 0.215 0.181Sidewalk COSA Blanco Road (FM 2696) Lockhill Selma West Avenue 2004 0.421 0.355Bike lane Univ City SH 218 Loop 1604 FM 78 2004 0.928 0.782Sidewalk COSA Flores, S 0.6 Mi N of Malone Octavia 2005 0.191 0.161Sidewalk COSA Mayfield Commercial Zarzamora 2005 0.024 0.020Sidewalk COSA McCullough Basse RR Tracks 2005 0.087 0.073Sidewalk COSA Nakoma @ US 281 4C 2005 0.256 0.216Sidewalk COSA Woodlawn Bandera Maiden 4C 2005 0.104 0.087Sidewalk COSA Sunset Teak Broadway 4C 2005 0.103 0.086Sidewalk/bike COSA Callaghan Bandera Horseshoe Bend 2007 0.414 0.349Bike lane COSA SAC to CBD Howard 4th 2001 0.082 0.069Bike lane COSA Montana/Nevada Cherry Meerscheidt 2001 0.040 0.034
PROJECTTYPE AGENCY PROJECT
NAME FROM TO LETDATE
VOCLbs/day
NOxLbs/day
Bike lane COSA N.Zarzamora Nogalitos Theo 2001 0.158 0.133Bike lane COSA N. St. Mary's Lexinton Huisache 2001 0.199 0.168Bike lane COSA Callaghan Old Highway 90 New HWY 90 2001 0.128 0.108Bike lane COSA S. Zarzamora SW Loop 410 IH 35 2001 0.338 0.285Bike lane COSA Caliza Encino Rio Evans Rd. 2001 0.061 0.052Bike lane COSA UTSA to SAC Buena Vista San Pedro 1999 0.299 0.252Bike lane COSA Les Harrison Culebra Dover Ridge 2000 0.313 0.264Bike lane COSA Josephine Grayson Broadway New Braunfels 2000 0.085 0.072Bike lane COSA Walters Fair Ave. Rigsby Avenue 2000 0.235 0.198Bike lane COSA Villaret Zarzamora Hwy 16 2000 0.074 0.062Sidewalk COSA RICE RECONSTRUCTION W. W. WHITE TO SEMLINGER 2004 0.033 0.028Sidewalk Comal New Braunfels LP 337 0.8 KM N of Walnut
Ave.2004 0.197 0.166
Bike path CoSa Malone / Theo Quintana Concepcion Park 2004 0.655 0.552Side walk COSA GEN MCMULLEN ' ROSELAWN TO COMMERCE 1999 0.664 0.560Bike path COSA AVENUE B (BICYCLE
LANES)MULBERRY TO
BRACKENRIDGE2000 0.095 0.080
Bike path COSA MONTANA STREET BIKE LANE:
ALAMODOME TO WALTERS 6/15/2001 0.018 0.016
Bike path COSA VILLARET BICYCLE TRANSPORTATION
W. Villaret E. Villaret 6/15/2001 0.107 0.090
Bike path COSA ZARZAMORA BIKE LANE IH 35 TO LOOP 410 6/15/2001 0.000 0.000Bike path COSA EAGLELAND/RIVERWALK
LINKEagleland Drive Guenther Street
Bridge4/15/2006 0.021 0.018
Side walk COSA MCKAY (400 Block) 500 BLKS 2/15/2001 0.008 0.006Side walk COSA HARVARD TERRACE YALE TO UNIVERSITY 2/15/2001 0.001 0.001Side walk COSA DELL PLACE DRAINAGE
PROJECTNorth Freeman Dead end 3/15/2001 0.0001 0.0001
Side walk COSA HARDEMAN ST SIDEWALKS
MESQUITE TO HACKBERRY 3/15/2001 0.002 0.002
Side walk COSA GEVERS-IH 10 GEVERS SOUTHCROSS 10/15/2001 0.131 0.110Side walk COSA NEW BRAUNFELS RIGSBY SOUTHCROSS/IH
3710/15/2001 0.278 0.234
Side walk COSA HENDERSON PASS SIDEWALKS
Thousand Oaks to Gold Canyon. 2001 0.818 0.689
Side walk COSA DANBURY SIDEWALKS: NACOGDOCHES TO BROADWAY 1/15/2002 0.021 0.018Side walk COSA RAY BON DRIVE
SIDEWALKSEisenhauer to Village Haven 1/15/2002 0.031 0.026
Side walk COSA NEW BRAUNFELS IH 35 TO GRAYSON 2/15/2002 0.068 0.057Side walk COSA PEDESTRIAN BRIDGE War Horse Trading Post 7/15/2002 0.0005 0.0004Side walk COSA HOOVER STREET NOGALITOS CHARLOTTE 12/15/2003 0.003 0.002Side walk COSA 2003 NAMP SIDEWALK McCullough Mulberry 6/15/2004 0.595 0.502Side walk COSA NAVAJO AREA STREETS (NAVAJO/
HUTCHINS/BARLITE)
(NAVAJO/HUTCHINS/BARLITE)
7/15/2004 0.159 0.134
Side walk COSA MC CARTY SIDEWALKS & CURBS:
LORENE BLANCO 7/15/2004 0.031 0.026
Side walk COSA HARRIS STORM DRAINAGE
ALVAREZ (GLASS/CASS/HALSTEAD)
11/15/2004 0.038 0.032
PROJECTTYPE AGENCY PROJECT
NAME FROM TO LETDATE
VOCLbs/day
NOxLbs/day
Side walk COSA KONO: GEMBLER BELGIUM 4/15/2005 0.026 0.022Side walk COSA OCTAVIA #63 PHASE II PART B 6/15/2005 0.103 0.087Side walk COSA LA MANDA - WEST AVENUE BUCKEYE 3/15/2006 0.006 0.005Side walk COSA ROSABELL STREET CULEBRA INEZ 5/15/2006 0.006 0.005Side walk COSA CINCINNATI FREDERICKSBUR
GIH 10 5/15/2007 0.019 0.016
Side walk COSA CORNELL BRAZOS COLORADO 5/15/2007 0.009 0.007Signal Improvement
TxDOT US 281 At Borgfeld, Bulverde, Wilderness Oaks,
and Stone Oak Roads
2003 3.797 2.327
Signal Improvement
Bexar Foster Road at Candlemeadow 4C 2005 0.253 0.155
Signal Improvement
Bexar Foster Road at Summer Fest 4C 2005 0.059 0.036
Signal Improvement
Comal SH46 HEB driveway . 2001 0.052 0.041
Signal Improvement
Comal FM 725 At County line road . 2001 1.003 0.788
Signal Improvement
Comal FM 3009 At FM 2252 in Garden Ridge 2001 0.575 0.452
Signal Improvement
City of New Braunfels Union Common 2004 0.075 0.059
Signal Improvement
Guadalupe
FM 3009 Savana/Verde Dr. 2001 2.097 1.488
Signal Improvement
Guadalupe
SH46 At US 90 . 2004 1.165 0.827
Signal Improvement
Guadalupe
SH46 At US 90 . 2004 0.272 0.193
Signal Improvement
Guadalupe
FM 3009 IH 35E 0.21 Mi SE of IH 35 2004 1.010 0.717
Intersection Improvement
TxDOT Hunt Lane Marbach to US 90 2004 2.790 1.674
Intersection TxDOT Bitters East of West Ave (W.of US 281) 2005 5.529 3.317Intersection Improvement
TxDOT Wurzbach Ironside to IH 10 2004 6.251 3.751
Intersection Improvement
TxDOT IH 10 @ Callaghan Road 2004 4.664 2.798
Intersection Improvement
TxDOT IH 10 IH 10 West at Huebner Road
2004 4.664 2.798
Intersection Improvement
TxDOT Loop 1604 SH 16 to FM 1937 2004 0.173 0.104
Intersection TxDOT Loop 1604 IH 35 to SH 16 2004 3.731 2.239Intersection TxDOT IH 10 @ DeZavala Road 2004 4.961 2.977Intersections COSA JAMES PARK
DEVELOPMENT Rittiman and Holbrook.
2005 2.292 1.375
Intersections COSA WEST AVE @ Larkspur Silver Sands, Rhapsody and Nakoma
2000 15.325 9.195
Intersections COSA TEZEL Tezel Timber Path 2000 3.168 1.901Intersections COSA Broadway BROADWAY AT WETMORE
ROAD2001 2.044 1.227
PROJECTTYPE AGENCY PROJECT
NAME FROM TO LETDATE
VOCLbs/day
NOxLbs/day
Intersections COSA SOUTHWEST CRAFT CNTR
NAVARO AND AUGUSTA 2004 0.842 0.505
Park & Ride VIA CROSSROADS IH-10W & Loop 410
- 1988 2.0388 1.7181
Park & Ride VIA ELLIS ALLEY Chestnut & Center Street
- 1998 4.1661 3.5108
Park & Ride TXDOT UNIVERSITY IH 10 W & Loop 1604
- 1993 15.150 12.767
Park & Ride TXDOT ELMENDORF US 181 S.& Loop 1604
- 1981 2.5730 2.1682
Park & Ride Privately Owned
ST. HEDWIG FM 1346 & Pittman Rd.
- 1988 0.5293 0.4460
Park & Ride TXDOT RANDOLPH BLVD IH 35 N & Crestway
- 1980 3.0382 2.5602
Transit CT. VIA INGRAM Ingram Road & Northwestern
- 1988 0.5465 0.4606
Transit CT. TxDOT KEL-LAC US 90 W. & Military Dr.
- 2004 1.5582 1.3131
Grade Sep TxDOT Loop 1604 0.52 KM N of FM 471 (Culebra Rd.)
0.98 KM S of FM 471 (Culebra Rd.)
2001 17.896 10.738
Grade Sep TxDOT IH 410 SH 16 UPRR 2004 3.722 2.233Grade Sep TxDOT US 281 Borgfeld Dr 2006 17.896 10.738Traffic Flow Improvements
TxDOT Acme Road Old Highway 90 1999 0.622 0.207
Traffic Flow Improvements
TxDOT Evers Rd. N. of Glen Ridge to Daughtry Dr. 1999 1.335 0.445
Traffic Flow Improvements
TxDOT FM 2522 (Perrin Beitel) @ IH 410 1999 0.526 0.175
Traffic Flow Improvements
TxDOT FM 78 Bexar Co. Ln. to FM 3009 1999 2.653 0.884
Traffic Flow TxDOT Houston (FM 1346) Pop Gunn 1999 2.002 0.667Traffic Flow Improvements
TxDOT IH 10 0.2 mile South of Callaghan Road
0.2 mile South of N. Crossroads Blvd.
1999 27.854 9.285
Traffic Flow Improvements
TxDOT IH 410 Interchange at US 281 Fr: US 281
To: Nacogdoches 1999 6.472 2.157
Traffic Flow Improvements
TxDOT SH 151 At Callaghan Rd 1999 0.335 0.112
Traffic Flow Improvements
TxDOT Tezel at Timber Path 1999 0.609 0.203
Traffic Flow Improvements
TxDOT US 281 0.590 KM N of LP 1604
0.746 KM N of LP 1604
1999 6.398 2.133
Traffic Flow Improvements
TxDOT West Avenue FM 1535 (NW Military Hwy)
IH 410 1999 2.646 0.882
Traffic Flow Improvements
TxDOT Wurzbach Parkway Lockhill-Selma to FM 1535 (NW Military Hwy)
1999 0.460 0.153
Traffic Flow Improvements
TxDOT 24th Commerce to Culebra 2000 2.353 0.784
Traffic Flow Improvements
TxDOT Ackerman Rd. IH 10 Dietrich 2000 0.190 0.063
Traffic Flow Improvements
TxDOT Hildebrand IH-10 Breeden 2000 2.767 0.922
PROJECTTYPE AGENCY PROJECT
NAME FROM TO LETDATE
VOCLbs/day
NOxLbs/day
Traffic Flow Improvements
TxDOT Hildebrand @ Hwy. 281 2000 0.454 0.151
Traffic Flow Improvements
TxDOT Huebner Road Evers Road East of City Limit (Redbird Lane)
2000 1.288 0.429
Traffic Flow Improvements
TxDOT Lockhill Selma George Road Whisper Path 2000 0.846 0.282
Traffic Flow Improvements
TxDOT O'Connor Rd Crosswinds IH 35 2000 3.418 1.139
Traffic Flow Improvements
TxDOT Wetmore At Broadway 2000 0.203 0.068
Traffic Flow Improvements
TxDOT Wurzbach Rd 0.6 Mi East of Ingram Rd
Leon Valley WCL 2000 1.945 0.648
Traffic Flow Improvements
TxDOT Coliseum Rd. Belgium Rd. IH 35 2001 0.712 0.237
Traffic Flow Improvements
TxDOT Culebra Rd (FM 471) At Loop 1604 2001 4.097 1.366
Traffic Flow Improvements
TxDOT IH 410 Jackson-Keller Road
Honeysuckle Lane 2001 42.811 14.270
Traffic Flow Improvements
TxDOT IH 410 Honeysuckle Lane Blanco Rd 2001 25.183 8.394
Traffic Flow Improvements
TxDOT Loop 1604 0.6 KM North of Military Dr
US 90 2001 10.960 3.653
Traffic Flow Improvements
TxDOT Loop 1604 1.6 KM N. of FM 471 (Culebra Rd)
0.6 KM North of Military Dr.
2001 10.818 3.606
Traffic Flow Improvements
TxDOT Loop 345 At Cinnamon Creek &
USAA Bvld 2001 0.136 0.045
Traffic Flow TxDOT Wurzbach Road Crystall Hill Crystall Hill 2001 1.361 0.454Traffic Flow Improvements
TxDOT IH 35 At Coliseum & Walters
2002 0.053 0.018
Traffic Flow TxDOT IH 410 At SH 151 2002 0.009 0.003Traffic Flow Improvements
TxDOT Pleasanton Southcross Mayfield 2002 0.981 0.327
Traffic Flow Improvements
TxDOT Ralph Fair Rd. (FM 3351) Fawn Mountain, Pimlico, Dietz-Elkhorn
Fair Oaks Parkway
2002 4.243 1.414
Traffic Flow Improvements
TxDOT SH 151 0.22 Miles West of Callaghan Rd.
0.3 Miles East of IH 410
2004 17.904 5.968
Traffic Flow Improvements
TxDOT SH 151 0.3 Miles East of IH 410
1.00 Miles East of Loop 1604
2004 19.142 6.381
Traffic Flow Improvements
TxDOT Ironside at Wurzbach 2004 0.326 0.109
Traffic Flow Improvements
Bexar Mission Rd. N. of San Antonio River Mission Parkway
2004 0.070 0.023
Traffic Flow Improvements
CoSA Thousand Oaks At Broken Oak, Ledge View, Turkey Point,
Pebble Forest & Oak View
2004 2.118 0.706
Traffic Flow TxDOT Zarzamora IH 410 Applewhite Road 2004 1.999 0.666Traffic Flow Improvements
TxDOT Applewhite Road Zarzamora Watson Road 2004 1.999 0.666
Traffic Flow Improvements
TxDOT Loop 1605 FM 1937 IH 37 2004 1.243 0.414
Traffic Flow TxDOT Military Dr., S.E. (LP 13) Padre Mission Rd 4C 2005 0.486 0.162
PROJECTTYPE AGENCY PROJECT
NAME FROM TO LETDATE
VOCLbs/day
NOxLbs/day
ImprovementsTraffic Flow Improvements
Comal LP 337 0.16 KM N of BI 35-H
.48 KM N of UPRR 2001 3.446 1.378
Traffic Flow Improvements
Guadalupe
SH 46 2.2 s of FM 758 New Braunfels
0.2 Mi s of FM 758 Camp Willow Rd.
2002 5.878 2.177
Traffic Flow Improvements
Guadalupe
FM 78 Bexar Co. Ln. FM 3009 2002 4.299 1.592
Traffic Flow Improvements
Wilson FM 1346 US 87 w of Lavernia
FM 775 2001 1.400 0.560
Traffic Flow Improvements
Guadalupe
SH 46 0.2 Mi S of FM 758 Comal Co line 2004 4.219 1.562
Traffic Flow Improvements
Guadalupe
SH 123 Fr US 90 Kingsbury St
IH 10 2004 1.193 0.442
Traffic Flow Improvements
COSA 36th ST. US90 Growdon 2007 2.792 0.931
Traffic Flow COSA BLANCO ROAD BLANCO ROAD - HILDEBRAND
SUMMIT PHASE 1 2006 3.602 1.201
Traffic Flow COSA WURZBACH PARKWAY PHASE IV
Military Highway Blanco Road 2002 17.353 5.784
Traffic Flow COSA WURZBACH RD: INGRAM RD LEON VALLEY 2002 4.649 1.550Traffic Flow COSA HAMILTON GUADALUPE LAREDO 1999 0.582 0.194Traffic Flow COSA WURZBACH RD @
VANCE JACKSON PROBANDT PRESA 1999 2.227 0.742
Traffic Flow COSA MITCHELL STREET IH 410 RAY ELLISON 1999 0.336 0.112Traffic Flow COSA VALLEY HI DRIVE 1999 0.412 0.137Traffic Flow COSA CHIPINQUE DRAINAGE General McMullen Escuela 1999 1.297 0.432Traffic Flow COSA ZARZAMORA - CULEBRA
TO COMMERCE CULEBRA COMMERCE 1999 2.705 0.902
Traffic Flow COSA CALAVERAS - SAUNDERS GUADALUPE 1999 0.568 0.189Traffic Flow COSA COURTLAND STREET MCCULLOUGH ST. MARY'S 1999 0.424 0.141Traffic Flow COSA GUADALUPE GARDENS
PHASE II1999 1.241 0.414
Traffic Flow COSA CHICO/KNOX/MARGIL 1999 0.024 0.008Traffic Flow COSA FOLYN/JERSEY/
CUSTER/ORANGE1999 0.280 0.093
Traffic Flow COSA TRAVIS ZARZAMORA HAMILTON 1999 0.566 0.189Traffic Flow COSA VILLA CORONADO STREETS, PHASE III A 1999 0.097 0.032Traffic Flow COSA MAYFIELD SOMERSET LAREDO HWY 1999 0.122 0.041Traffic Flow COSA HAZEL DRAINAGE - ZARZAMORA BRAZOS 1999 0.751 0.250Traffic Flow COSA LILLITA GEN. MCMULLEN LAS PALMAS 1999 0.108 0.036Traffic Flow COSA ADVANCE & BRICE 1999 0.045 0.015Traffic Flow COSA calle morelia drainage 1999 0.095 0.032Traffic Flow COSA EMORY / KENTUCKY 1999 0.120 0.040Traffic Flow COSA 26TH STREET TRAVIS CULEBRA 1999 0.147 0.049Traffic Flow COSA WURZBACH PARKWAY
PHASE II1999 11.623 3.874
Traffic Flow COSA KEITHA AREA STREETS PHASE II
1999 0.645 0.215
Traffic Flow COSA MUSKOGEE - ACME 40TH 1999 0.080 0.027Traffic Flow COSA BOEHMER - BURBANK LOOP S. FLORES 1999 0.014 0.005Traffic Flow COSA DEWITT - IH 10 FAIRMONT 1999 0.028 0.009
PROJECTTYPE AGENCY PROJECT
NAME FROM TO LETDATE
VOCLbs/day
NOxLbs/day
Traffic Flow COSA CLAREMONT/ELEANOR/NATALEN,PH I&MAHNCKE PH IV
1999 0.234 0.078
Traffic Flow COSA LAKE BLVD/WOODLAWN/STREETS
AROUND WOODLAWN LAKE
1999 2.077 0.692
Traffic Flow COSA S. FLORES DRN #70-70A, PH. II--PART 2 2000 0.000 0.000Traffic Flow COSA 34TH STREET HWY 90 CASTROVILLE 2000 0.064 0.021Traffic Flow COSA 27TH - CULEBRA RIVAS 2000 0.052 0.017Traffic Flow COSA 21ST STREET SALINAS POPLAR 2000 0.268 0.089Traffic Flow COSA EASTLAWN NEIGHBORHOOD STREETS
PHASE II2000 0.435 0.145
Traffic Flow COSA SOUTHLAWN- MERIDA CASTROVILLE 2000 0.089 0.030Traffic Flow COSA MADRID- MERIDA CASTROVILLE RD 2000 0.025 0.008Traffic Flow COSA GRANDVIEW NEIGHBORHOOD STREETS
PH. IIIA (K STREET) 2000 0.047 0.016
Traffic Flow COSA WURZBACH PARKWAY PHASE III
2000 0.391 0.130
Traffic Flow COSA GLENMORE KENTUCKY 2000 0.047 0.016Traffic Flow COSA VILLA CORONADO STREETS PHASE IIIB 2000 0.043 0.014Traffic Flow COSA ARBOR TRINITY SAN MARCOS 2000 0.083 0.028Traffic Flow COSA FAIRDALE - RITTIMAN BLOOMDALE 2000 0.323 0.108Traffic Flow COSA STAHL RD. #1038 PHASE
I - FAIRWAY OAKS BULVERDE 2000 0.273 0.091
Traffic Flow COSA BABCOCK & HILLCREST INTERSECTION 2000 1.364 0.455Traffic Flow COSA APPLE VALLEY: HAVEN VALLEY - RAY
ELLISON2000 0.141 0.047
Traffic Flow COSA LAS PALMAS - CHARBEN 26TH 2000 0.129 0.043Traffic Flow COSA CONTOUR DR / EL MONTE ST
IMPROVEMENTS2000 1.697 0.566
Traffic Flow COSA EVERS RD - GLENRIDGE DAUGHTRY 2000 1.424 0.475Traffic Flow COSA BAYLOR ST - SAN PEDRO CK. FLORES ST. 2000 0.010 0.003Traffic Flow COSA CULEBRA AREA STREETS PHASE II 2000 0.901 0.300Traffic Flow COSA HILDEBRAND @ 281 2000 1.040 0.347Traffic Flow COSA LONE OAK/LATIMER: F ST BRICE 2001 0.020 0.007Traffic Flow COSA RIP RAP 69-PHIIC PART 3 2001 0.105 0.035Traffic Flow COSA ACKERMAN- IH 10 DIETRICH 2001 0.216 0.072Traffic Flow COSA CARSON STREET - WALTERS FRANK 2001 0.077 0.026Traffic Flow COSA STARCREST - STUNTMAN jones maltsberger 2001 0.081 0.027Traffic Flow COSA BOBOLINK 96A STOREYWOOD DENEICE 2001 1.828 0.609Traffic Flow COSA MAHNCKE AREA STREETS, PHASE II 2001 0.752 0.251Traffic Flow COSA CRESWELL - HOUSTON DEADEND 2001 0.024 0.008Traffic Flow COSA THORAIN: BUCKEYE S.P. RAILROAD 2001 0.039 0.013Traffic Flow COSA FRED. RD SANDOVAL WOODLAWN 2001 1.472 0.491Traffic Flow COSA HOBART STREET - ACME RD 40TH ST 2001 0.023 0.008Traffic Flow COSA LAWTON / SW 41ST
STREET2001 0.019 0.006
Traffic Flow COSA ORR/SUZETTE/ WINKLE 2001 0.019 0.006Traffic Flow COSA FLEMING MAYFIELD PEABODY 2001 0.016 0.005Traffic Flow COSA EVERS RD @ WURZBACH RD
INTERSECTION2001 0.102 0.034
Traffic Flow COSA CAPITOL: BASSE SAN ANGELO 2001 0.010 0.003
PROJECTTYPE AGENCY PROJECT
NAME FROM TO LETDATE
VOCLbs/day
NOxLbs/day
Traffic Flow COSA GRANDVIEW NEIGHBORHOOD STS PH IIIB
PECAN VALLEY AMANDA 2001 0.020 0.007
Traffic Flow COSA PACE - ELMENDORF BRAZOS 2001 0.139 0.046Traffic Flow COSA TEXAS / WAVERLY
STREETS2001 0.527 0.176
Traffic Flow COSA BASSE ROAD & SAN PEDRO INTERSECTION
2001 1.625 0.542
Traffic Flow COSA MONTERREY - 36TH SAN JOAQUIN 2001 0.467 0.156Traffic Flow COSA BLUERIDGE GEN MCMULLEN 27TH 2001 0.143 0.048Traffic Flow COSA RIP RAP 69 - PH IIC PART
3A2001 0.166 0.055
Traffic Flow COSA CALLAGHAN: OLD HWY 90 COMMERCE 2001 1.021 0.340Traffic Flow COSA DUVAL/SEGUIN: PIERCE WALTERS 2001 0.223 0.074Traffic Flow COSA 24TH ST: COMMERCE CULEBRA 2001 0.236 0.079Traffic Flow COSA CLAREMONT/ELEANOR/NATALEN, PH II 2001 0.175 0.058Traffic Flow COSA STRECH CHAVANEAUX MALLEY BLVD 2001 0.128 0.043Traffic Flow COSA INDIANOLA: GARFIELD CAMARGO 2001 0.008 0.003Traffic Flow COSA ELSMERE: MICHIGAN CAPITOL 2002 0.021 0.007Traffic Flow COSA ARBOR: TRINITY SAN MARCOS PH
II2002 0.029 0.010
Traffic Flow COSA ESCALON ST. #1008 2002 0.051 0.017Traffic Flow COSA S. FLORES DRN #70-70A, PH. II--PART 3 2002 11.316 3.772Traffic Flow COSA OCTAVIA #63 PHASE 1 2002 0.678 0.226Traffic Flow COSA LEONHARDT ROAD @ LOW WATER
CROSSING2002 0.299 0.100
Traffic Flow COSA ST. MARYS STREET - PEREIDA ROOSEVELT 2002 0.841 0.280Traffic Flow COSA LOCKHILL-SELMA: GEORGE WHISPER PATH 2003 0.731 0.244Traffic Flow COSA 39TH STREET #58M,
PHASE IIA2003 0.871 0.290
Traffic Flow COSA QUINTANA ROAD DRAINAGE #64 EXTENSION
2003 0.648 0.216
Traffic Flow COSA S. FLORES: DURANGO FRANCISCAN 2003 1.269 0.423Traffic Flow COSA MONTICELLO: S. GEVERS HILLJE 2003 0.095 0.032Traffic Flow COSA HIGGINS ROAD: NACOGDOCHES STAHL 2003 1.551 0.517Traffic Flow COSA HI LIONS 80 MOD PIII & V 2004 11.176 3.725Traffic Flow COSA BEE STREET: WALTERS FRANK 2004 0.030 0.010Traffic Flow COSA ARANSAS: MEERSCHEIDT WALTERS 2004 0.077 0.026Traffic Flow COSA FLORES/BREEDEN/BEACON, PHASE II 2004 0.417 0.139Traffic Flow COSA MOCKERT STREET AREA MOCKERT,
FOREST,( W. LAMBERT, KLINE, CASS)
2004 0.435 0.145
Traffic Flow COSA PLEASANTON ROAD: GILLETTE LOOP 410 2004 0.000 0.000Traffic Flow COSA NORTHINGTON: S.W. 36TH S.W. 35TH 2004 0.075 0.025Traffic Flow COSA FAY STREET / ST
JOSEPH: CREIGHTON NEW LAREDO
HWY, PART 12005 0.264 0.088
Traffic Flow COSA FAY STREET / ST. JOSEPH:
CREIGHTON NEW LAREDO HWY, PART 2
2005 0.000 0.000
Traffic Flow COSA BELGIUM: PICARDE SBC PARKWAY 2005 0.137 0.046Traffic Flow COSA EL MONTE: BLANCO SAN PEDRO,
PHASE II2005 0.045 0.015
Traffic Flow COSA LANARK DRAINAGE #92A, PHASE 1 2005 0.383 0.128
PROJECTTYPE AGENCY PROJECT
NAME FROM TO LETDATE
VOCLbs/day
NOxLbs/day
Traffic Flow COSA LARKSPUR: WEST AVE BALTIC 2005 0.260 0.087Traffic Flow COSA SUNSET PH I: JONES
MALTSBERGER TEAK 2005 1.014 0.338
Traffic Flow COSA ALAMO: DURANGO CEDAR 2005 0.328 0.109Traffic Flow COSA WURZBACH RD @ IH 10 INTERSECTION 2005 2.128 0.709Traffic Flow COSA ST. MARYS STREET: ALAMO PEREIDA 2005 0.202 0.067Traffic Flow COSA ANSLEY BLVD
DRAINAGE #10912006 0.139 0.046
Traffic Flow COSA DUKE AREA STREETS, PHASE I
2006 0.275 0.092
Traffic Flow COSA CULEBRA AREA STREETS PHASE IV 2006 0.288 0.096Traffic Flow COSA HOWARD DRAINAGE: WILDWOOD EL MONTE 2006 0.018 0.006Traffic Flow COSA AVE MARIA DRAINAGE 2006 0.056 0.019Traffic Flow COSA GOLIAD RD: PECAN VALLEY MILITARY DRIVE 2006 0.329 0.110Traffic Flow COSA W. CRAIG: ELMENDORF JOSEPHINE TOBIN 2006 0.027 0.009Traffic Flow COSA WOODLAWN AVE: SAN ANTONIO LAKE 2006 0.199 0.066Traffic Flow COSA OZARK - ERSKINE WILLIAMSBURG 2006 0.064 0.021Traffic Flow COSA FLORIDA: IH 37 ST MARYS 2006 0.380 0.127Traffic Flow COSA SUNSET PH II: TEAK BROADWAY 2006 0.538 0.179Traffic Flow COSA WOODLAWN: BANDERA MAIDEN 2006 0.114 0.038Traffic Flow COSA SEMLINGER ROAD - LORD RIGSBY 2006 0.434 0.145Traffic Flow COSA STAHL ROAD - O'CONNOR JUDSON 2007 1.147 0.382Traffic Flow COSA MARBACH PHASE I - MILITARY PINN 2007 0.654 0.218Traffic Flow COSA REDLAND ROAD
IMPROVEMENTS - REDLAND WOODS
JONES MALTSBERGER
2007 2.516 0.839
Traffic Flow Bexar Shaenfield Road Loop 1604 FM 1560 2006 0.18 0.06Traffic Flow Bexar Braun Road Loop 1604 FM 1560 2004 1.60 0.53Traffic Flow Bexar Borgfeld Road Hwy 281 Timberline 2004 2.75 0.92Traffic Flow Bexar Bulverde Road Smithson Valley Hwy 281 2006 0.30 0.10Traffic Flow Bexar Foster Road I-10 Binz-Engleman 2004 2.16 0.72Traffic Flow Bexar Kriewald Road Hwy 90 Pue Road 2006 0.14 0.05Traffic Flow Bexar Lakeview Drive Woodlake Parkway Foster Road 2006 0.46 0.15Traffic Flow Bexar Pue Road Kriewald Road Sunset Place 2006 0.66 0.22Traffic Flow Bexar Smith Road Hwy 16 2006 0.90 0.30Traffic Flow Bexar Wiseman Road Loop 1604 west Talley Road. 2004 5.35 1.78Traffic Flow Bexar Woodlake Parkway Binz-Engleman FM 78 2006 1.58 0.53Traffic Flow Bexar Applewhite Road Watson Road Loop 1604. 2004 9.473 3.158TMS TxDOT US 90 0.8 Mi W. of IH 410 Loop 353 Nogalitos 1999 89.898 29.966TMS TxDOT IH 35 Guadalupe County
Line NE 1.77 KM N of FM 1976 (Frat Interchange)
2000 41.339 13.780
TMS TxDOT IH 36 1.77 KM N. of FM 1976 (Fratt int.)
FM 1976 (Walzem) 2000 30.396 10.132
TMS TxDOT IH 37 Loop 13 1.3 Mi S of US 181 2000 9.089 3.030TMS TxDOT IH 410 Callaghan Road Fredericksburg
Road2000 37.141 12.380
TMS TxDOT Loop 1604 0.8 KM W of Babcock Road
SH 16(N) 2000 14.741 4.914
PROJECTTYPE AGENCY PROJECT
NAME FROM TO LETDATE
VOCLbs/day
NOxLbs/day
ITS TxDOT Loop 1604 On N and S frontage roads FM 1535, E
Bitters Rd 2001 6.079 2.026
ITS TxDOT Loop 1604 3.21 KM E. of US 281 N.
1.61 KMN of FM 2252
1999 52.434 17.478
ITS TxDOT US 281 0.6 Mi N of Loop 1604
2.5 Mi N of Loop 1604
2004 26.445 8.815
TMS TxDOT Upgrade to 10 lane freeway and TMS
Ingram Road Callaghan Road 2006 103.35 34.449
ITS COSA houston - walters to onslow Onslow New Braunfels 2003 2.085 0.695
Process and Methodology for Calculation of TERMs’ Emission Benefits
To calculate emissions reductions due to the implementation of TERMs:
1. A list of state and federally funded roadway projects was compiled. The VIA’s Park & Ride facilities were also included in this list. This list is the principal source of eligible TERMs projects.
2. A list of non-federally funded roadway projects sponsored by local governments in the region was compiled.
3. Accepted methodologies for calculating emissions reductions from mobile source control strategies published in March 2002 by TxDOT in a report entitled “The Texas Guide to Accepted Mobile Source Emission Reduction Strategies” were applied to calculate attributable emission benefits for each TERMs project for the year 2007.
4. The TERMs were divided into groups or categories and the total emissions reductions for each group/category were calculated. The following table shows creditable amount of reductions due to implementation of TERMs in the 4-county EAC region. The emissions reductions from the traffic signalization category, which are discussed in the next section, are also included in this table.
Table K-15. 2007 Emission Reduction due to the Implemented TERMs in EAC region
CATEGORY Number of 2007 Emission Reduction, lbs/dayprojects VOC NOx
Intersection Improvement 13 56.44 33.86Traffic Signalization 18* 758.54 237.44
Bike and Pedestrian Paths 97 20.57 17.34Park & Ride Facilities 8 27.49 23.17
Grade Separation 3 39.52 23.71Traffic Flow Improvement 188 374.32 125.67
ITS 12 564.37 188.12
Total 339 1839.16 649.31
* Includes traffic signalization projects evaluated in the next section, 7 projects in all.
Area of ApplicationThe TERMs are in various locations in the 4-county EAC region. See the project list for specific locations.
Program ParticipantsParticipants in the TERMs program are local jurisdictions and implementing agencies in the 4-county EAC region and the San Antonio-Bexar County MPO.
Expected ReductionsThe expected 2007 emission reductions are 0.92 ton per day of VOC and 0.33 ton per day of NOx.
Emission Reduction Estimates from Traffic Signalization
BackgroundAside from traffic signalization projects shown in the TERMs project list in the previous pages, certain traffic signals for various intersections in the Bexar County have been separately evaluated for their impacts on the air quality. The bases for this evaluation are the findings that “Pape-Dawson Engineering, Inc”, a consultant for the San Antonio MPO, has presented in its 2001 report on 7 traffic signal re-timing projects. The emissions reductions due to traffic signal re-timing, which are calculated in this evaluation and included in the Table K-15 amounted to 748.18 lbs/day of VOC and 230.36 lbs/day of NOx. These reductions would provide additional evidence indicating future lower ozone levels for the San Antonio area. In the following pages, the studied intersections are identified and this evaluation is described.
IntroductionTraffic flow improvements have been used for air quality planning due to their ability to reduce traffic congestion, reducing congestion-related emissions, and are also a cost-effective method of reducing congestion and emissions.9 Arterial management systems manage traffic by employing various detection and control devices along arterial roadways. Traffic signalization is one of the most common traffic management techniques utilized in the United States. Signal control systems are methods of arterial roadway management is practiced because such control systems improve traffic flow as well as simplify system maintenance.10 Some improvements can include:Updating traffic signal hardware to utilize more modern technology, allowing for more sophisticated traffic flow strategies to be planned;Timing traffic signals to correspond with current traffic flows, reducing unnecessary delays;Coordinating and interconnecting signals to better interface pre-timed and traffic actuated signals, actively managed timing plans, and master controllers to minimize the number and frequency of stops necessary at intersections; andRemoving signals at intersections no longer requiring signalized stop control to reduce vehicle delays and unwarranted stops on the major street.Error: Reference source not found
The use of flexible traffic signal systems has been used since the early 1960’s when computerized systems began to come into existence. Signalization projects can reduce carbon monoxide (CO) and hydrocarbon (HC) by reducing the number of vehicular stops and idling, which would reduce travel times and traffic delays. Reductions in fuel consumption have also been observed through traffic signal re-timing. Traffic flow at intersections can be improved in interconnection and coordination of signals.
Resignalization in Bexar CountyThe prospect of traffic signal retiming has been evaluated for various intersections in Bexar County in order to efficiently deal with the existing levels of traffic volumes. A program was recently conducted for Bexar County, as it is recommended that traffic
9 MOSERS Handbook, June 2003. Texas Department of Transportation10 Miretek Systems, “Intelligent Transportation Systems Benefits: 2001 Update.” Federal Highway Administration, June 2001.

signal timing patterns be checked and updated every 5 to 7 years. Such programs focus on three factors: 1) public benefit from improved traffic operation, 2) the inherent cost-effectiveness of operations improvements, and 3) establishing a baseline for measuring effectiveness in future re-timing projects. Approximately seven traffic signal systems were assessed as to their benefit and functionality in handling traffic volume within the San Antonio area. The following table lists the systems that were analyzed during the months of May 2001 to November 2001.
Table K-16. Traffic Signal Systems EvaluatedTraffic Signal Systems
Wetmore System Bandera SystemJones Maltsberger System Rittiman SystemBitters/West System Nacogdoches/Perrin Beitel SystemEisenhauer System
Traffic Signal EvaluationThe evaluation of the selected traffic signal systems involved several steps. Traffic light systems in the San Antonio area were evaluated bv Pape-Dawson Engineers, Inc. The evaluation involved collection of data, design improvements, optimal timing plan development and implementation, and simulation of before and after conditions. Several models were used in the evaluation and assessment of the traffic signal systems. These models included TRANSYT-7F, Synchro 3.2, and PASSER II. Information on arterial data, “before” signal timing data, saturation flow rates, and speed/travel time data were gathered through various sources. Traffic volumes, which are the numbers of vehicles that pass a specific point during a given period of time, were collected at the intersections.11 Lane configuration, link speed data, and link distance information were provided by the City of San Antonio. The data gathered for model input was first run through Synchro 3.2 to produce a simulation file. The file was calibrated to reflect specific “before” conditions and then converted to a TRANSYT-7F file. The TRANSYT-7F analyzed the traffic system and produced a “before” traffic flow simulation.
The simulation data originally provided by Synchro 3.2 was then modified to reflect optimal time cycles for improved efficiency. PASSER II analyzed alternative phasing arrangements and cycle lengths. The cycle lengths that generated the least amount of delay were deemed most efficient and thus recommended. The following sections describe the arterial intersections that were analyzed and the recommended timing plans.
Wetmore SystemThe Wetmore System is located on Wetmore Road, which is classified as a primary arterial, Type A. In evaluating this system, three timing plans were developed for the A.M Peak, Midday/Off Peak, and P.M. Peak periods. Four intersections were analyzed on the Wetmore System and their operation is detailed in the following table.12
11 “Detection Technology: For IVHS-Volume 1: Final Report Addendum.” July 1995. http://ntl.bts.gov/DOCS/96100/ch02/body_ch02_03.html
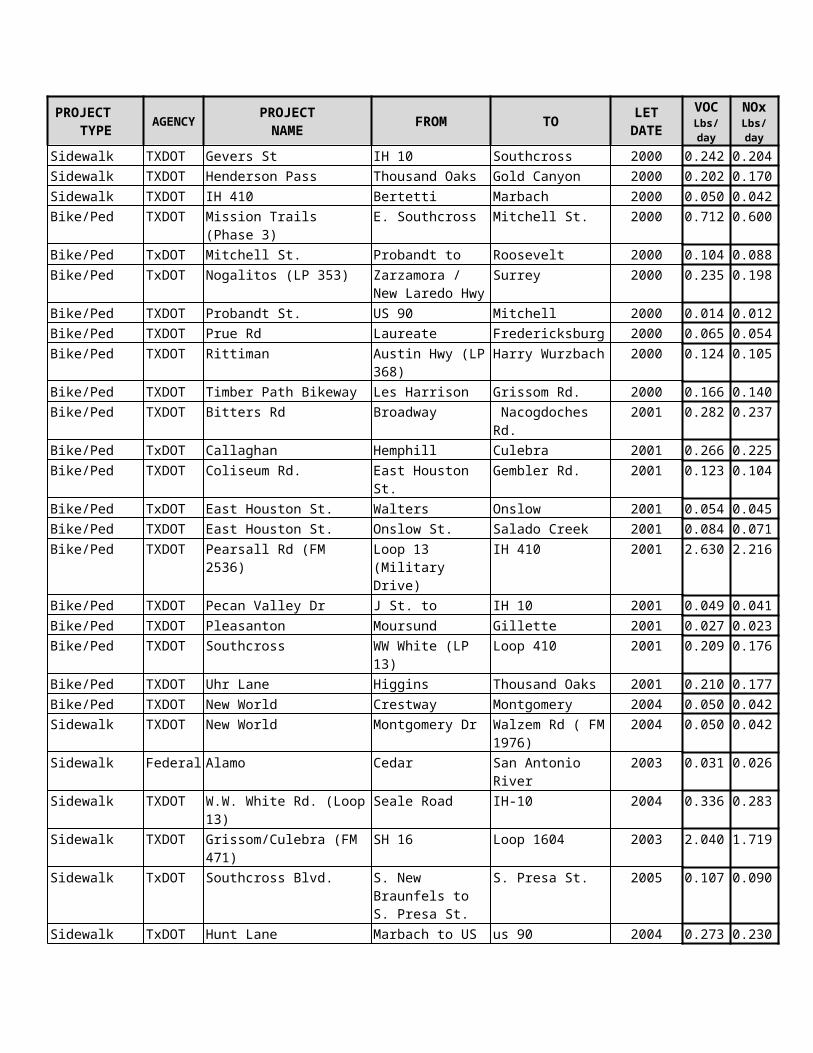
Table K-17. Intersections Evaluated for Traffic Signal Re-Timing on Wetmore Rd.Signalization Details
Before ConditionsIntersection Name Operation No. of PhasesWetmore Rd. & Ridge Country Coordinated 4Wetmore Rd. & Gunn Sports Park Coordinated 4Wetmore Rd. & Wurzbach Pkwy West Coordinated 4Wetmore Rd. & Wurzbach Pkwy East Coordinated 4After ConditionsIntersection Name Operation No. of PhasesWetmore Rd. & Ridge Country Coordinated 4Wetmore Rd. & Gunn Sports Park Coordinated 4Wetmore Rd. & Wurzbach Pkwy West Coordinated 4Wetmore Rd. & Wurzbach Pkwy East Coordinated 4
The Wetmore System was evaluated as described in Traffic Signal Evaluation. Analysis of the evaluation provided cycles that would improve efficiency in a number of areas. These areas include bandwidth efficiency, vehicle delay, and fuel consumption.
The 115 second cycle for the AM peak hour was selected since it provided the best bandwidth efficiency, largest bands for northbound and southbound traffic, and had a lower delay value. The 75 second cycle for off peak hours is the lowest delay for the arterial. The 80 second cycle for the PM peak hour had a high bandwidth efficiency, lowest delay, and the lowest fuel consumption. Eisenhauer SystemThe Eisenhauer System is located on Eisenhauer Road and is designated as a secondary arterial, Type A, east of Interstate 35 and Type B, west of Interstate 35. Three timing plans were developed for the A.M. Peak, Midday/Off Peak, and P.M. Peak periods. Nine intersections were evaluated, as listed in the following table.13
Table K-18. Evaluated Intersections on Eisenhauer RdSignalization DetailsBefore Conditions
Intersection Name Operation No. of PhasesEisenhauer and Corrine Uncoordinated 2Eisenhauer and Holbrook Uncoordinated 2Eisenhauer and Harlow Uncoordinated 2Eisenhauer and Kingston Uncoordinated 2Eisenhauer and Molokai Uncoordinated 2Eisenhauer and Interstate 35 Diamond Uncoordinated TTI 4 PhaseEisenhauer and Fratt Uncoordinated 5
12 Traffic Signal Re-Timing Study, “Wetmore System Technical Memorandum.” Pape Dawsom Engineers, May 2001.13 Traffic Signal Re-Timing Study, “Eisenhauer System Technical Memorandum.” Pape Dawsom Engineers, November 2001.
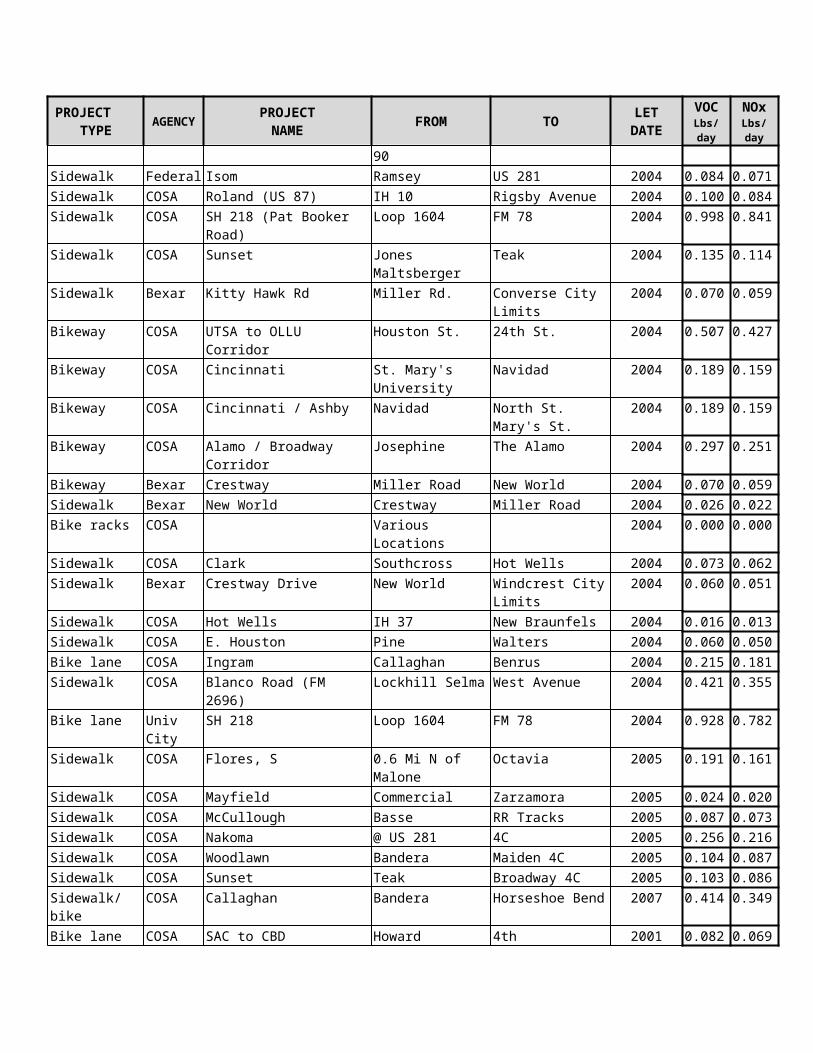
Eisenhauer and Ray Bon Uncoordinated 8Eisenhauer and Mid Crown Uncoordinated 6
After ConditionsIntersection Name Operation No. of PhasesEisenhauer and Corrine Coordinated 2Eisenhauer and Holbrook Coordinated 2Eisenhauer and Harlow Coordinated 2Eisenhauer and Kingston Coordinated 2Eisenhauer and Molokai Coordinated 2Eisenhauer and Interstate 35 Diamond Coordinated TTI 4 PhaseEisenhauer and Fratt Coordinated 5/2Eisenhauer and Ray Bon Coordinated 8/2Eisenhauer and Mid Crown Coordinated 6/2
The Eisenhauer System was evaluated as described in Traffic Signal Evaluation. Analysis of the evaluation provided cycles that would improve efficiency in a number of areas. These areas include bandwidth efficiency, vehicle delay, and fuel consumption.The AM peak hour’s cycle was chosen to be 120 seconds since it provided the best bandwidth efficiency and largest bands for northbound and southbound traffic. The cycle also coincided with low values of delay and low fuel consumption. The 90 second cycle was recommended for the system during off peak hours. This cycle provided the lowest delay at the I-35 diamond interchange.
Bitters/West SystemThe Bitters/West System is located on Bitters Road and West Avenue. Bitters Road is a Type A secondary arterial. West Avenue is a Type A arterial and meets Bitters. Three timing plans were developed for the A.M. Peak, Midday/Off Peak, and P.M. Peak periods. Six intersections were evaluated, as listed in the following table.14
Table K-19. Intersections Evaluated for Traffic Signal Re-Timing on Bitters/WestSignalization Details
Before ConditionsIntersection Name Operation No. of PhasesBitters Road and Heimer Road Uncoordinated 7Bitters Road and US 281 Uncoordinated TTI 4 PhaseBitters Road and Embassy Row Uncoordinated 4Bitters Road and West Avenue Uncoordinated 5West Avenue and Embassy Oaks Uncoordinated 2West Avenue and Interpark Blvd Uncoordinated 4After ConditionsIntersection Name Operation No. of PhasesBitters Road and Heimer Road Uncoordinated 7Bitters Road and US 281 Uncoordinated TTI 4 PhaseBitters Road and Embassy Row Uncoordinated 4
14 Traffic Signal Re-Timing Study, “Bitters/West System Technical Memorandum.” Pape Dawsom Engineers, October 2001.
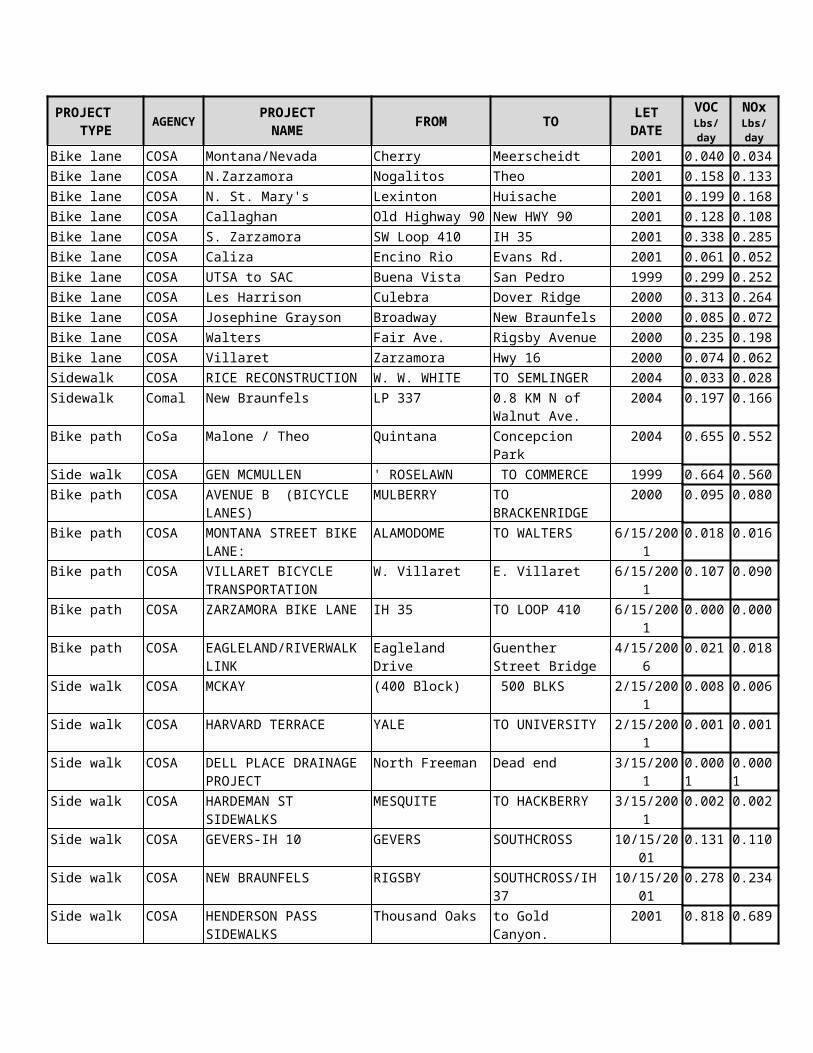
Bitters Road and West Avenue Uncoordinated 5West Avenue and Embassy Oaks Uncoordinated 2West Avenue and Interpark Blvd Uncoordinated 4
The Bitters/West System was evaluated as described in Traffic Signal Evaluation. Analysis of the evaluation provided cycles that would improve efficiency in a number of areas. These areas include bandwidth efficiency, vehicle delay, and fuel consumption.
The best cycle for the A.M. peak hour was 108 seconds. It provided the best bandwidth efficiency and low delay. A cycle length of 90 seconds for off peak hours yielded low delay but were the lowest in effectiveness of all categories. For P.M. peak hours, the 120 second cycle length provided high bandwidth efficiency, low fuel consumption, and low delay values.
Bandera SystemThe Bandera System is on Bandera Road, which is designated as a primary arterial, Type A. The lanes on Bandera Road vary from six-lanes with exclusive left turn lanes to a four-lane roadway with exclusive right and left turn lanes. Three timing plans were developed for the A.M. Peak, Midday/Off peak, and P.M. Peak periods. Eight intersections were evaluated on Bandera Road, as listed in the following table.15
Table K-20: Intersections Evaluated for Traffic Signal Re-Timing on Bandera RdSignalization Details
Before ConditionsIntersection Name Operation No. of Phases
Bandera and Prue/Tezel Coordinated 6Bandera and Old Prue/Camino Villa Coordinated 6Bandera and Braun Coordinated 5Bandera and Mystic Park/Bresnahan Coordinated 6Bandera and Guilbeau/Bristle Cone Coordinated 6Bandera and Mainland Coordinated 6Bandera and Eckhert Coordinated 6Gilbeau and Mystic Park Free/Coordinated 3
After ConditionsIntersection Name Operation No. of PhasesBandera and Prue/Tezel Coordinated 6Bandera and Old Prue/Camino Villa Coordinated 6Bandera and Braun Coordinated 5Bandera and Mystic Park/Bresnahan Coordinated 6Bandera and Guilbeau/Bristle Cone Coordinated 6Bandera and Mainland Coordinated 6Bandera and Eckhert Coordinated 6Gilbeau and Mystic Park Coordinated 3
15 Traffic Signal Re-Timing Study, “Bandera System Technical Memorandum.” Pape Dawsom Engineers, June 2001.
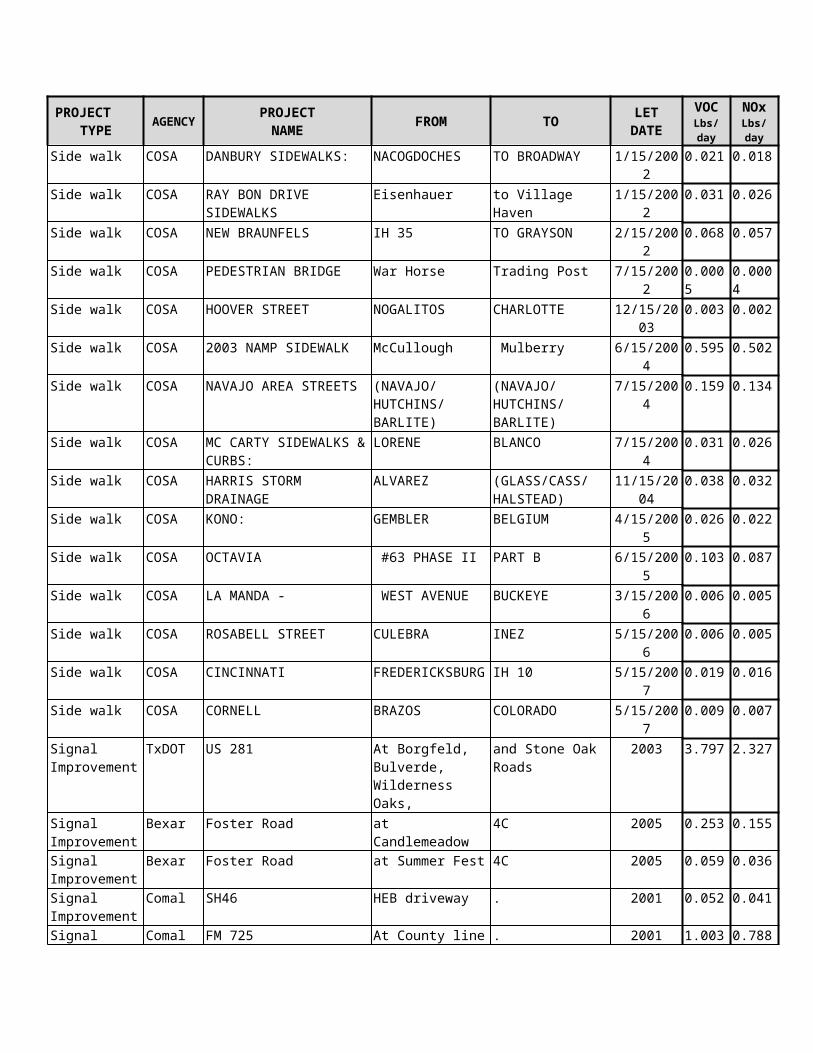
The Bandera System was evaluated as described in Traffic Signal Evaluation. Analysis of the evaluation provided cycles that would improve efficiency in a number of areas. These areas include bandwidth efficiency, vehicle delay, and fuel consumption.
For the A.M. peak hour, a cycle of 130 seconds was chosen due to good bandwidth efficiencies. The 90 second cycle was recommended for off peak hours since it provided a low delay time. The P.M. peak hour was recommended the 130 second cycle length due to high bandwidth efficiency, low delay, and low fuel consumption.
Rittiman SystemRittiman Road is designated a secondary arterial, Type A east of I-35 and Type B, west of I-35. Rittiman road is a four lane roadway with a diamond interchange at the intersection with Interstate 35. Three timing plans were developed for the A.M. Peak, Midday/Off peak, and P.M. Peak periods. Table K-21 lists the five intersections that were evaluated on this system.16
Table K-21. Intersections Evaluated for Traffic Signal Re-Timing on RittimanSignalization Details
Before ConditionsIntersection Name Operation No. of PhasesRittiman Rd and Rittiman Plaza Uncoordinated 2Rittiman Rd and Fairdale Uncoordinated 2Rittiman Rd and IH 35 Diamond Uncoordinated TTI 4 PhaseRittiman Rd and Goldfield Uncoordinated 2Rittiman Rd and Fratt/Business Park Uncoordinated 8
After ConditionsIntersection Name Operation No. of PhasesRittiman Rd and Rittiman Plaza Coordinated 2Rittiman Rd and Fairdale Coordinated 2Rittiman Rd and IH 35 Diamond Coordinated TTI 4 PhaseRittiman Rd and Goldfield Coordinated 2Rittiman Rd and Fratt/Business Park Coordinated 8
The Rittiman System was evaluated as described in Traffic Signal Evaluation. Analysis of the evaluation provided cycles that would improve efficiency in a number of areas. These areas include bandwidth efficiency, vehicle delay, and fuel consumption.
For the A.M. peak hour, the 120 second cycle was bandwidth efficient and had the lowest delay values. The 90 second cycle for the off peak period allows low delay at the diamond interchange as well as along the arterial. The 120 second cycle was also recommended for the PM peak hour due to it high bandwidth efficiency, low delay, and low fuel consumption.
Jones-Maltsberger System
16 Traffic Signal Re-Timing Study, “Rittiman System Technical Memorandum.” Pape Dawsom Engineers, November 2001.
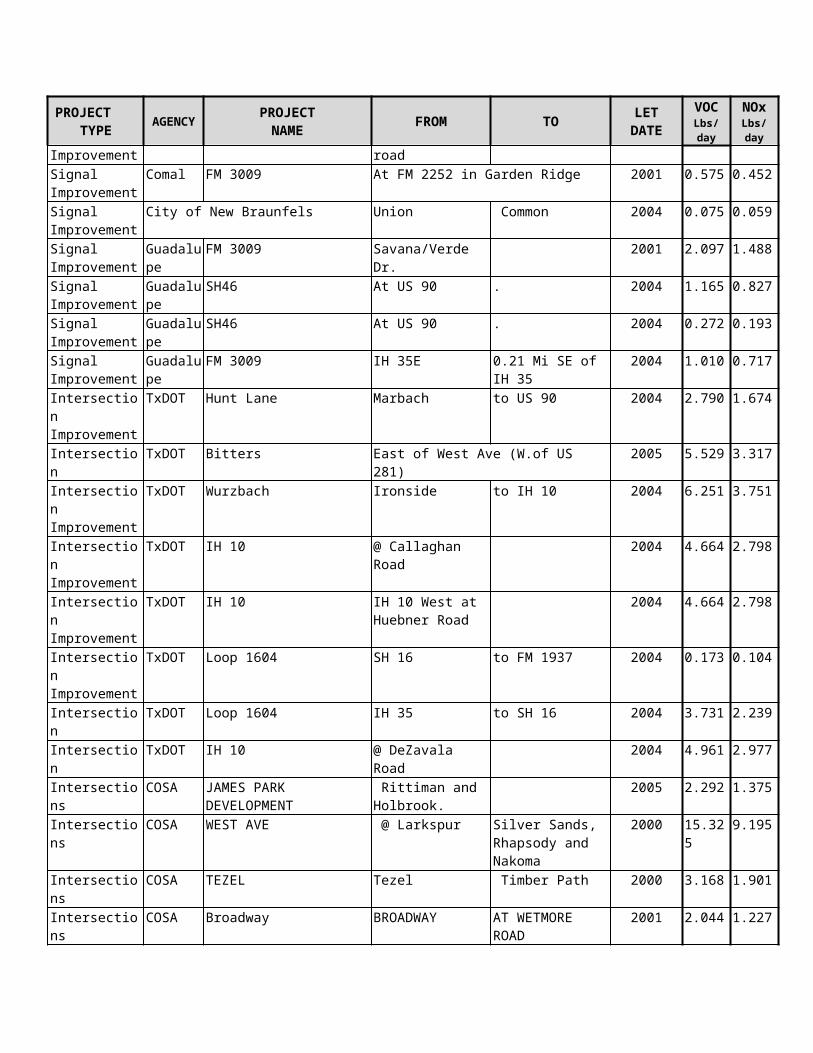
Jones-Maltsberger is a secondary arterial, Type A and has four lanes. Three timing plans were developed for the A.M. Peak, Off Peak, and P.M. Peak periods. Five intersections were evaluated on Jones-Maltsberger, which are listed on Table K-22.17
Table K-22. Intersections Evaluated for Traffic Signal Re-Timing on Jones-MaltsbergerSignalization Details
Before ConditionsIntersection Name Operation No. of PhasesJones Maltsberger and Starcrest Free 8Jones Maltsberger and Perennial/Budding Free 6Jones Maltsberger and Money Tree Free 5Jones Maltsberger and Burning Trail Free 5Jones Maltsberger and Thousand Oaks Free 8After ConditionsIntersection Name Operation No. of PhasesJones Maltsberger and Starcrest Coordinated 8Jones Maltsberger and Perennial/Budding Coordinated 6Jones Maltsberger and Money Tree Coordinated 5Jones Maltsberger and Burning Trail Coordinated 5Jones Maltsberger and Thousand Oaks Coordinated 8
The Jones-Maltsberger System was evaluated as described in Traffic Signal Evaluation. Analysis of the evaluation provided cycles that would improve efficiency in a number of areas. These areas include bandwidth efficiency, vehicle delay, and fuel consumption.
The best cycle for the A.M. peak period was one that consisted of 90 seconds since it had the best bandwidth efficiency and low delay. A cycle of 120 seconds was optimal for off peak. A good candidate for the P.M. peak period would be a cycle of 115 seconds since it had good bandwidth efficiency, low fuel consumption, and low delay values.
Nacogdoches/Perrin Beitel SystemBoth Nacogdoches and Perrin Beitel are Type A secondary arterial, each being a four-lane roadway. Twenty intersections were evaluated on the Nacogdoches/Perrin Beitel system, as detailed on Table K-23. Three timing plans were developed for the A.M. Peak, Off Peak, and P.M. Peak periods.18
Table K-23: Intersections Evaluated for Traffic Signal Re-Timing on Nacogdoches/Perrin Beitel
Signalization DetailsBefore Conditions
Intersection Name Operation No. of PhasesNacogdoches and Topperwien Coordinated 4
17 Traffic Signal Re-Timing Study, “Jones-Maltsberger System Technical Memorandum.” Pape Dawsom Engineers, May 2001.18 Traffic Signal Re-Timing Study, “Nacogdoches/Perrin Beitel System Technical Memorandum.” Pape Dawsom Engineers, November 2001.

Nacogdoches and Judson Coordinated 8Nacogdoches and Dreamwood Coordinated 3Nacogdoches and O’Connor Coordinated 8Nacogdoches and El Charro Coordinated 2/3*Nacogdoches and Higgins Coordinated 3Nacogdoches and El Sendero Coordinated 4Nacogdoches and Bell Coordinated 3Nacogdoches and Leonhardt Coordinated 5Nacogdoches and Thousand Oaks Coordinated 8Perrin Beitel and Naco-Perrin Coordinated 6Perrin Bietel and El Sendero Coordinated 3Perrin Beitel and Wurzbach Parkway Coordinated TTI 4 PhasePerrin Beitel and Perrin Central Coordinated 5Perrin Beitel and Post Office Coordinated 3Perrin Beitel and Clear Spring Coordinated 3Perrin Beitel and Comstock Coordinated 5Perrin Beitel and Center Gate Coordinated 3Thousand Oaks and Bulverde Coordinated 5Thousand Oaks and Uhr Coordinated 2
After ConditionsIntersection Name Operation No. of PhasesNacogdoches and Topperwien Coordinated 4Nacogdoches and Judson Coordinated 8Nacogdoches and Dreamwood Coordinated 3Nacogdoches and O’Connor Coordinated 8Nacogdoches and El Charro Coordinated 2/3*Nacogdoches and Higgins Coordinated 3Nacogdoches and El Sendero Coordinated 4Nacogdoches and Bell Coordinated 3Nacogdoches and Leonhardt Coordinated 5Nacogdoches and Thousand Oaks Coordinated 8Perrin Beitel and Naco-Perrin Coordinated 6Perrin Beitel and El Sendero Coordinated 3Perrin Beitel and Wurzbach Parkway Coordinated TTI 4 PhasePerrin Beitel and Perrin Central Coordinated 5Perrin Beitel and Post Office Coordinated 3Perrin Bietel and Clear Spring Coordinated 3Perrin Beitel and Comstock Coordinated 5Perrin Beitel and Center Gate Coordinated 3Thousand Oaks and Bulverde Coordinated 5Thousand Oaks and Uhr Coordinated 2
The Nacogdoches/Perrin Beitel System was evaluated as described in Traffic Signal Evaluation. Analysis of the evaluation provided cycles that would improve efficiency in a number of areas. These areas include bandwidth efficiency, vehicle delay, and fuel consumption.
The 90 second cycle for the AM peak hour was selected since it provided the one of the best bandwidth efficiencies, large bands for northbound and southbound traffic, and
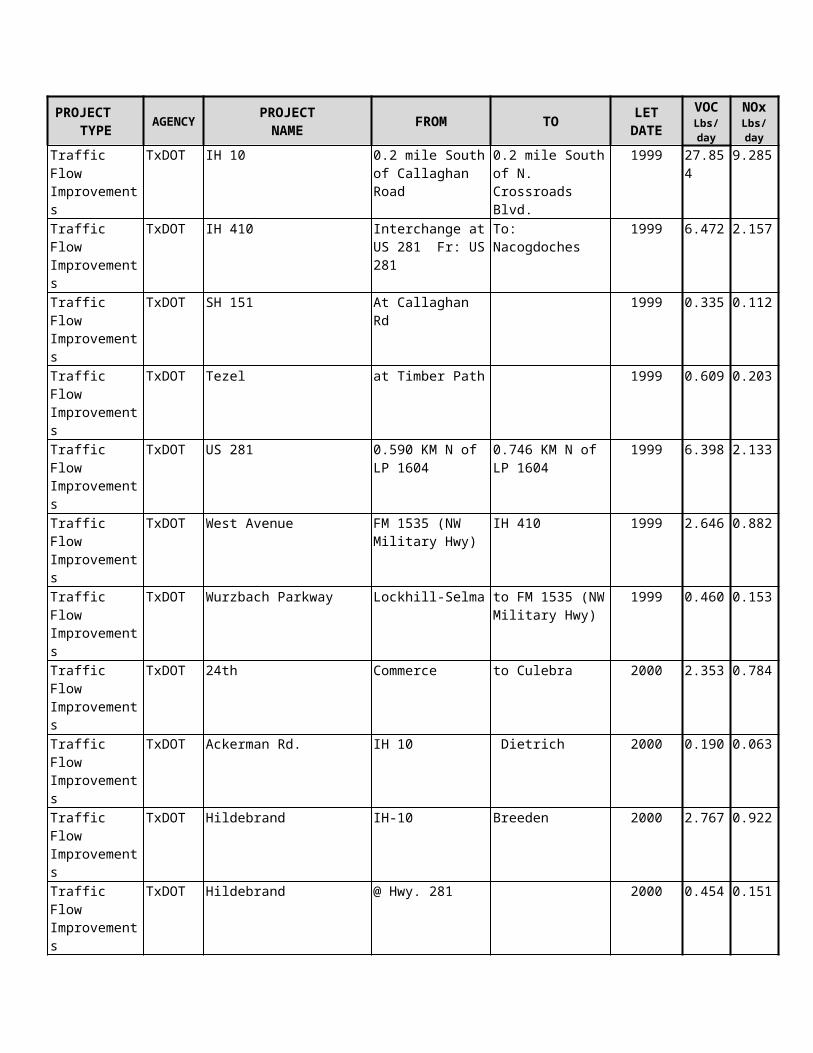
lowest combination of delay values. Off peak period was recommended the 90 second cycle. It presented the lowest delay and low fuel consumption. The 130 second cycle length for PM peak hour had high bandwidth efficiency, low delay, and low fuel consumption.
In summary, the traffic signal systems included in this study were recommended to have cycle lengths reduced while maintaining efficient bandwidth, reduced vehicle delays, and reduced fuel consumption. The following table details the various traffic signal systems included in the study as well as data on vehicle stop frequency, vehicle delay, and fuel consumption.
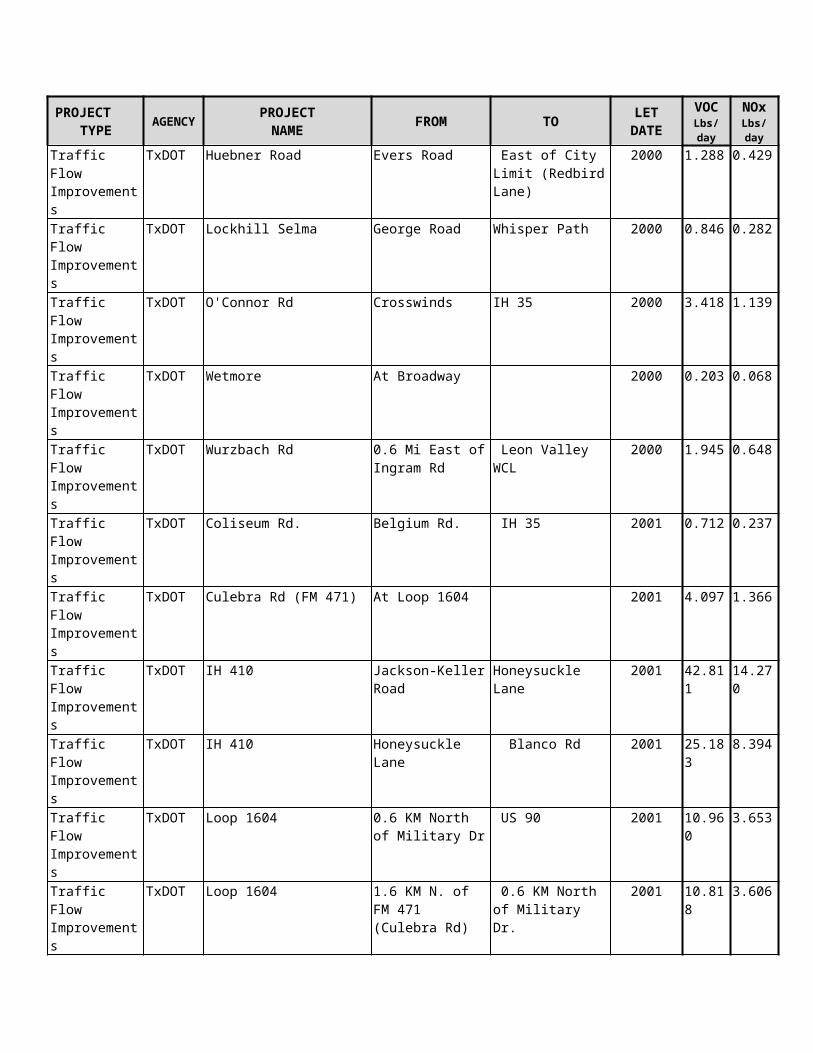
Table K-24. Traffic Signal System Statistics before & with Recommended Improvements
Traffic Signal System Number of Hours
Stops Total System Delay
Fuel Consumption
Before After Before After Before After
WetmoreAM 2.33 7814 6244 61 37 221 190Off Peak 7.5 3040 2550 20 14 105 94PM 2 4471 4510 32 26 166 160
EisenhauerAM 2 17195 14734 677 525 773 655Off Peak 7 13207 2787 112 24 331 81
PM 2 18224 14552 543 384 725 585
Bitters/WestAM 2 16464 12664 329 281 454 431Off Peak 7 14761 15872 613 472 620 600PM 2 40344 22853 2463 868 2065 979
BanderaAM 1.25 31743 24221 834 724 1474 1300
Off Peak 6.5 17108 14290 132 110 732 624
PM 3.75 60293 29076 3640 738 3625 1406
RittimanAM 2 19116 11822 702 412 1192 552Off Peak 7 7048 5270 55 40 222 203PM 2 17651 15939 1380 663 1295 759
Jones-Maltsberger
AM 2 8356 8069 82 66 381 334Off Peak 7 6697 6168 71 64 314 283PM 2 14926 11797 246 175 596 487
Nacogdoches/Perrin Beitel
AM 1.5 25721 22211 201 179 834 783Off Peak 7 23273 21934 163 157 801 785PM 3 47198 37977 793 760 1626 1513
On-Road Emission ReductionAccording to the 1999 AACOG Emission Inventory, on-road source provides substantial amounts of VOC and NOx emissions to Bexar County. The 2007 projection of the September photochemical modeling episode accounts for the updated MOBILE6 on road emissions and it is against these emissions that the proposed traffic signal timing cycle improvements were performance evaluated. Average weekday (Monday-Friday) emissions for on-road source in Bexar County are 61 tons/day of NOx and 49 tons/day of VOC19.
The “Traffic Signal Re-Timing Study”20 reports describing the evaluations and timing cycle recommendations of the traffic signal systems were not consistent in detailing correct delay values and provided confusing details. The purpose of this report was to evaluate the proposed signal timing improvements for the areas under study as well as their potential emission reduction. It was concluded after much analysis that analyzing
19 See Chapter 4 for the methodology to calculate on-road emissions in 2007 projection and Table k- 4.3 and 4.4 for complete on-road emission data.20 “Traffic Signal Re-Timing Study,” Pape Dawson Engineers Inc. May 2001-November 2001.
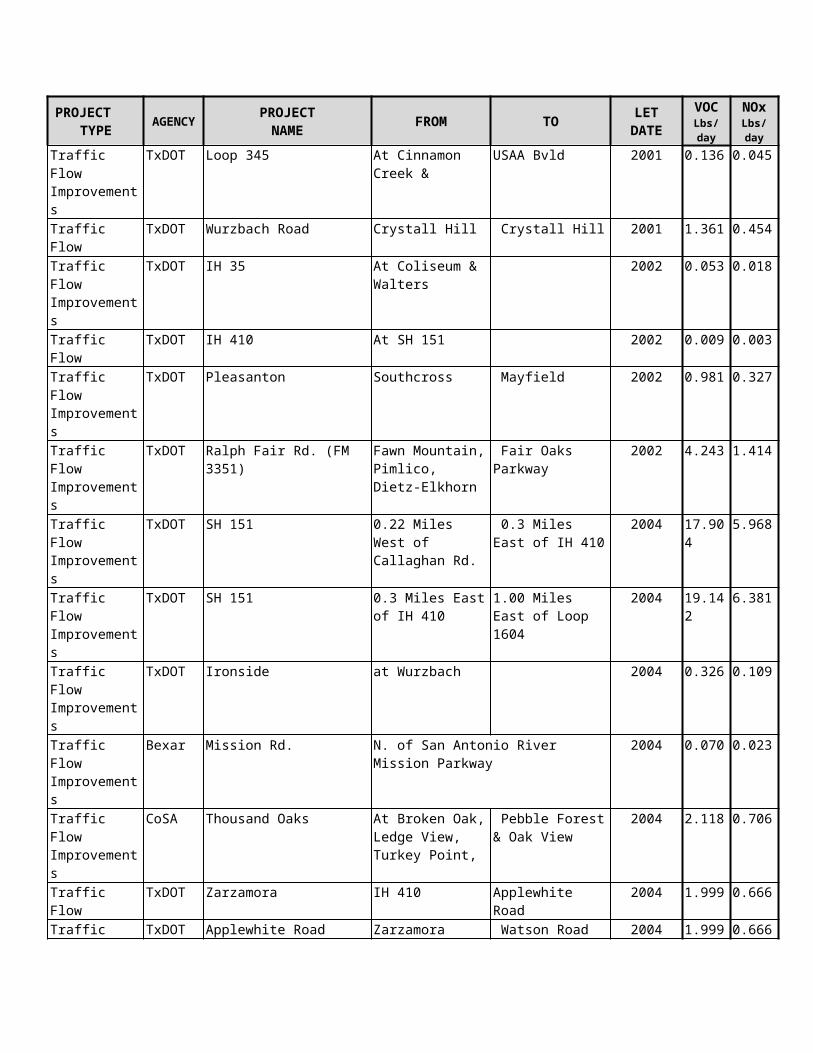
the increase or decrease of total delay time the vehicles experienced during the before and after traffic flow simulations would be the more suitable approach. The difference of the total delay times was multiplied by an emission factor for idling vehicles. The idling emission factor was utilized since vehicles idle while being delayed at traffic light stops. MOBILE6 provided the emission factor for a vehicle speed of 2.5 miles per hour. A speed of 2.5 miles per hour was used because it was the slowest speed for which the mobile6 model can calculate emission factors. For all the other factors for the mobile6 model (temperature, RVP and Sulfur levels, VMT Mix, etc.) the local data were used as input21. The idling emission factor for VOC was 7.03 grams/mile and for NOx it was 2.17 grams/mile.Once the idling emission factors were estimated, the result was applied to each intersection. The equation for calculating emissions reductions per hour is:
(Total Delay Time Before per hour – Total Delay Time After per hour) x Mobile6 Idling Emission Factor = Emission Reductions per hour
The delay times were evaluated for 3 time periods: AM Peak, PM Peak, and Off Peak. The AM peak, PM peak, and Off Peak hours varied for each traffic signal system. For example, AM peak periods varied between 1.25 hours and 3.75 hours. These time frames are listed in Table K-24 for each intersection involved in the study. The emissions (grams/hr) were multiplied by the number of hours in the respective time period to result in the total emission reduction per time period. The total emissions in grams/day were then converted to pounds/day.
(Total Emissions grams/day x 2.205) /1000 = Total Emissions lbs/day
The following tables and figures illustrate the emission reductions for the traffic signal systems with the implementation of recommended timing cycles.
Wetmore System Emission ReductionsAM peak period reductions were significant on a per hour scale than the off peak period reductions for the Wetmore system. An average reduction of 1.1 lbs/hr was observed in the AM peak hours compared to an average of 0.2 lbs/hr of VOC idling emissions was reduced in the off peak hours by the recommended timing plans. PM peak only had an emissions reduction of approximately 0.24 lbs/hr. The PM period for idling NOx emissions had the most significant emission reduction of the periods included in the study, based per hour. The PM peak period had a reduction of 0.72 lbs/hr while the AM peak period had a reduction of 0.33 lbs/hr and the off peak period had a reduction of 0.08 lbs/hr. The following tables list the emissions reductions by time period, while figures K-1 and K-2 graphically compare the before and after case. Overall VOC emissions decrease 4 lbs/day and NOx emissions decreased 1.3 lbs/day. This system had the smallest reduction in VOC and NOx emissions among the seven systems analyzed.
Table K-25. Idling VOC and NOx Emission for the Wetmore Traffic System, lbs/day
21 See UPWP 3.8, 2003 “Analysis of On-Road Control Strategies and Alternative Fuels for San Antonio Metropolitan Statistical Area September 13-20, 1999 Modeling Episode” (unpublished report) for a complete description of the Moble6 model and the data inputs used.
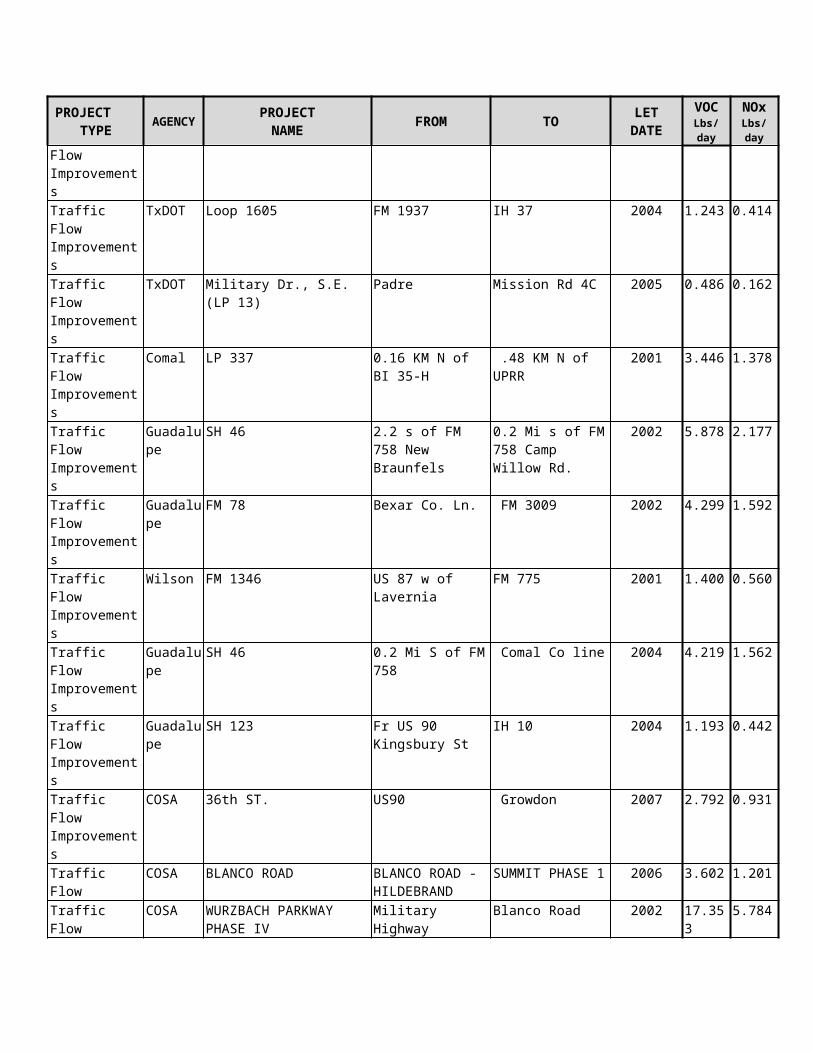
Time PeriodVOC NOx Percent
Change (VOC&NOx)Before After Before After
AM Peak 5.51 3.34 1.70 1.03 -39.33%Off Peak 5.81 4.07 1.79 1.25 -30.00%PM Peak 2.48 2.02 0.76 0.62 -18.72%Total 13.80 9.43 4.25 2.90 -31.69%
Figure K-1. Idling VOC Emissions before and after New Timing Cycle Implementation on the Wetmore System
0
1
2
3
4
5
6
7
8
9
10
AM Peak Off Peak PM Peak
Lbs/
Day
Before
After
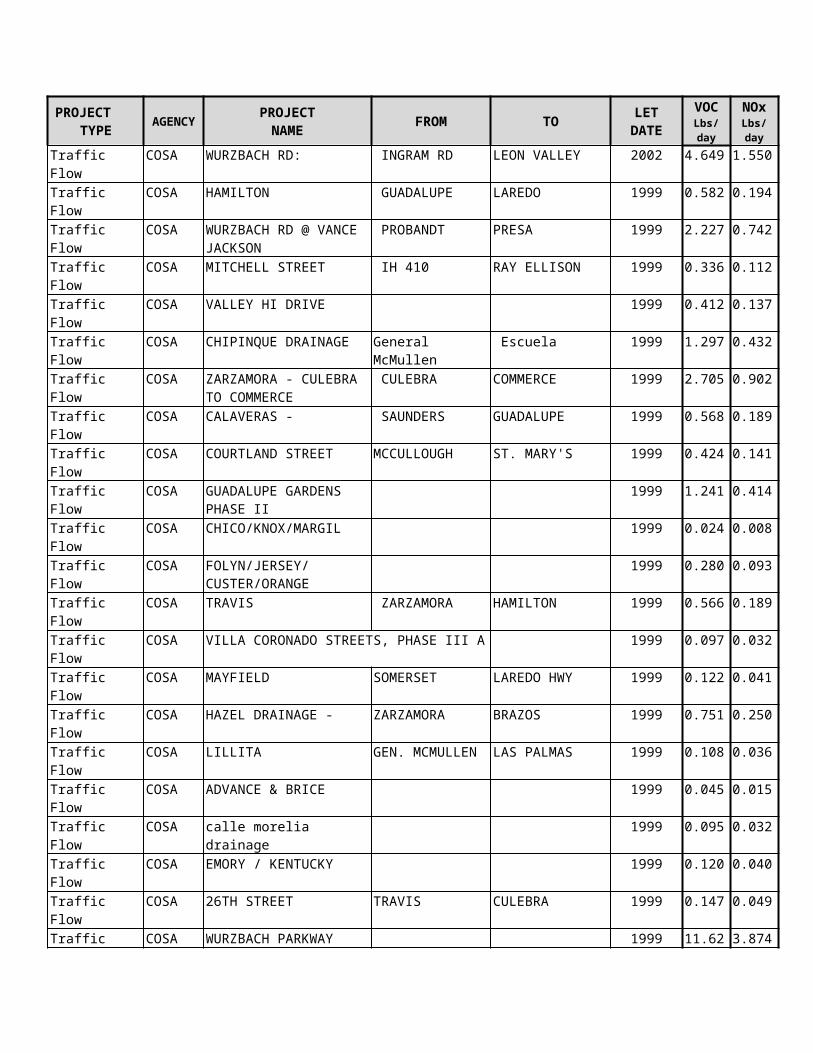
Figure K-2. Idling NOx Emissions before and after New Timing Cycle Implementation on the Wetmore System
0.00.20.40.60.81.01.21.41.61.82.0
AM Peak Off Peak PM Peak
Lbs/
Day
Before
After
Eisenhauer System Emissions ReductionsThe recommended timing cycles for the Eisenhauer traffic signal system provided a constant reduction in idling VOC emissions. The AM peak, off peak, and PM peak idling VOC emission reduction on a per hour basis is about 6 lbs/hr. The cycles reduced idling NOx emissions at almost the same constancy as the idling VOC reductions, reducing AM peak and PM peak idling NOx emission reductions by about 2 lbs/hr and off peak idling NOx emission reduction by 1 lb/hr. Figures K-3 and K-4 provide VOC and NOx bar charts of the before and after the traffic re-signalization. Compared to the Off-Peak time of the other traffic light systems, this system had the greatest percentage reductions for the off peak period.
Table K-26. Idling VOC and NOx Emissions for the Eisenhauer Traffic Signal System, lbs/day
Time PeriodVOC NOx Percent
Change (VOC&NOx)Before After Before After
AM Peak 52.48 40.70 16.16 12.53 -22.45%Off Peak 30.39 6.51 9.36 2.01 -78.57%PM Peak 42.09 29.77 12.96 9.17 -29.28%Total 124.96 76.98 38.47 23.70 -38.40%
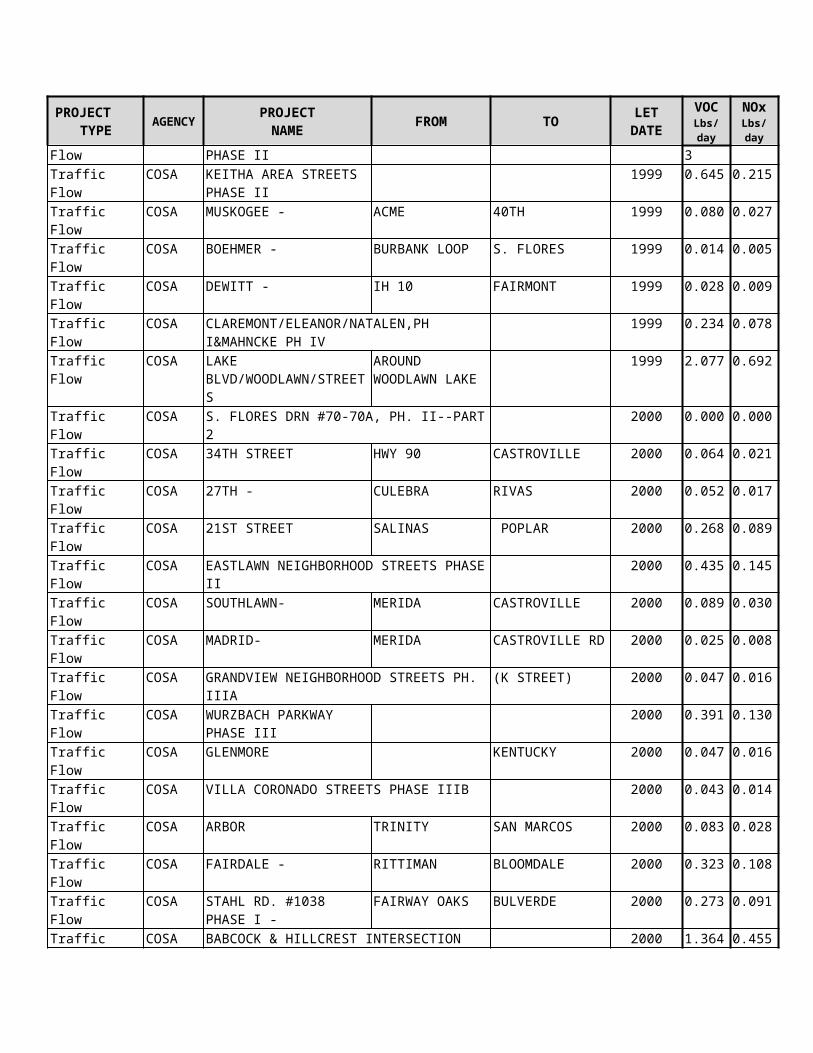
Figure K-3. Idling VOC Emissions before and after New Timing Cycle Implementation on the Eisenhauer System
Figure K-4. Idling NOx Emissions before and after New Timing Cycle Implementation on the Eisenhauer System
Bitters/West Emission ReductionThe recommended timing cycles for the Bitters/West system reduced emissions during the time periods under study, with some reductions being more than others. Idling VOC emissions during the AM peak period were reduced on average by 2 lbs/hr. Off peak idling VOC emissions were reduced by 6 lbs/hr and PM peak idling VOC emissions were
05
1015202530354045505560
AM Peak Off Peak PM Peak
Lbs/
Day
Before
After
02468
101214161820
AM Peak Off Peak PM Peak
Lbs/
Day
Before
After
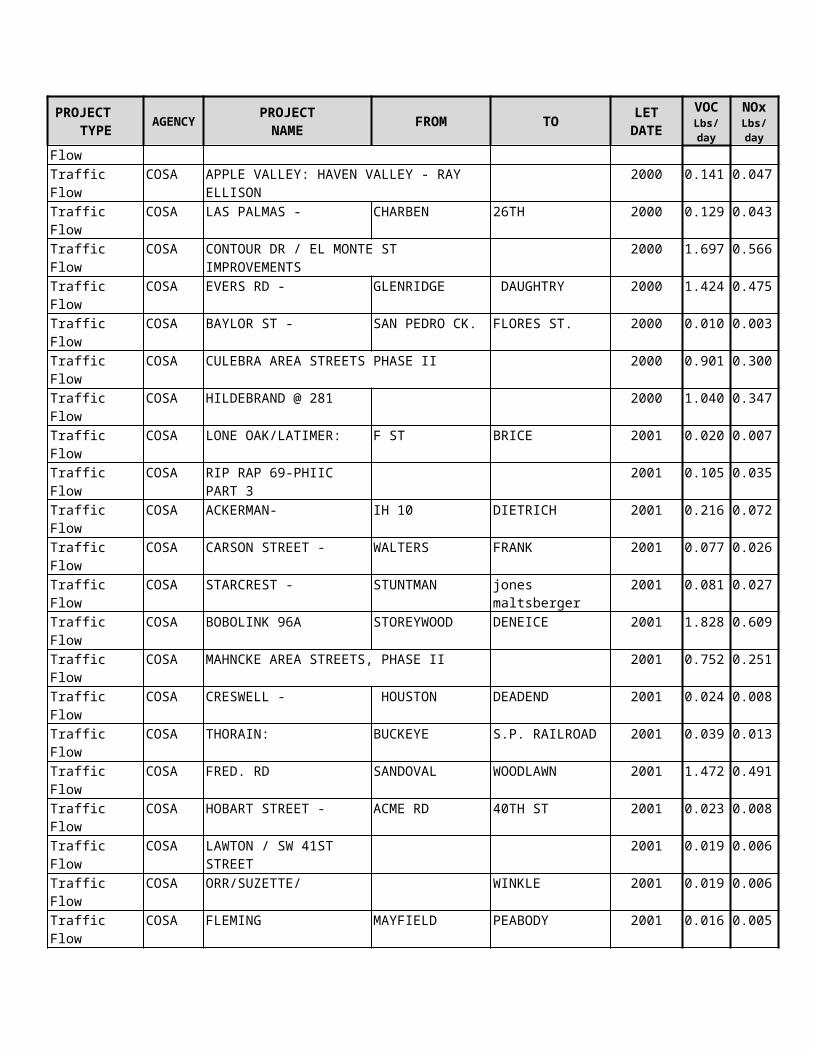
reduced by approximately 60 lbs/hr. Regarding reductions in idling NOx emissions, emissions were reduced in all three time periods with PM reductions being more significant than the other two periods. Idling NOx emissions were reduced by about 0.5 lbs/hr during the AM peak period and 2 lbs/hr during the off peak period. The idling NOx emission reduction during the PM peak period was observed at 19 lbs/hr. As listed in Table K-27, overall VOC emissions were reduced by 166 lbs/day and NOx emissions were reduced 51 lbs/day. This represents the second greatest total reduction of all the single systems studied. The results are graphically display in Figures K-5 and K-6.
Table K-27. Idling VOC and NOx Emission for the Bitters/West Traffic Signal System, lbs/day
Time PeriodVOC NOx Percent
Change (VOC&NOx)Before After Before After
AM Peak 25.50 21.78 7.85 6.71 -14.58%Off Peak 166.32 128.06 51.21 39.43 -23.00%PM Peak 190.93 67.29 58.79 20.72 -64.76%Total 382.76 217.14 117.85 66.85 -43.27%
Figure K-5. Idling VOC Emissions before and after New Timing Cycle Implementation on the Bitters/West System
020406080
100120140160180200
AM Peak Off Peak PM Peak
Lbs/
Day
Before
After
Figure K-6. Idling NOx Emissions before and after New Timing Cycle Implementation on the Bitters/West System
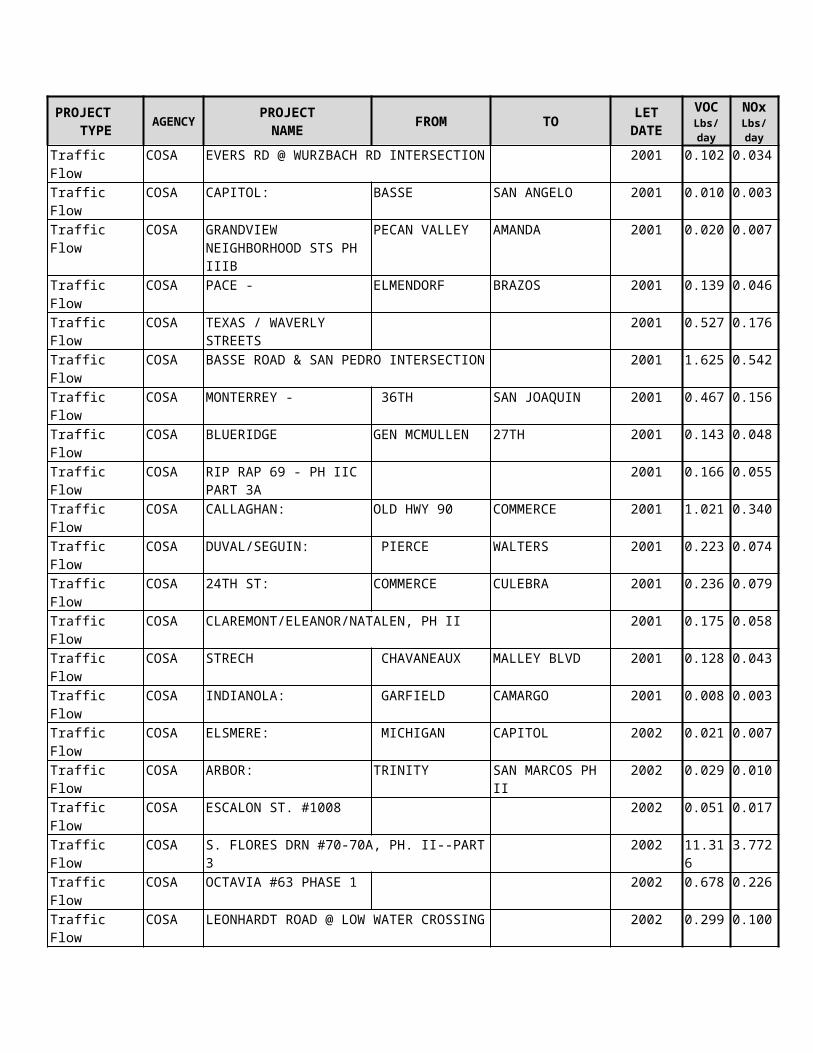
0
6
12
18
24
30
36
42
48
54
60
AM Peak Off Peak PM Peak
Lbs/
Day
Before
After
Bandera Emission ReductionThe timing cycle implemented on the Bandera traffic system reduced idling emissions. The emission reduction of idling VOC precursors was 1 lb/hr and 2 lbs/hr during the off peak period and AM peak period, respectively. The idling emission reduction for the PM peak period is significantly higher with a reduction of 200 lbs/hr.
Listed in Table K-28 are the VOC and NOx emissions reductions for each other the three time periods for this system. As expected, this intersection had the greatest reduction in VOC (433lbs) and NOx (133lbs) emissions. This system also had the highest percentage reduction in emissions too. The dramatic drops in emissions are shown in figures K-7 and K-8.
Table K-28. Idling VOC and NOx Emissions for the Bandera Traffic Signal System, lbs/day
Time PeriodVOC NOx Percent
Change (VOC&NOx)Before After Before After
AM Peak 40.41 35.08 12.44 10.80 -13.19%Off Peak 33.26 27.71 10.24 8.53 -16.66%PM Peak 529.08 107.27 162.90 33.03 -79.73%Total 602.74 170.06 185.58 52.36 -71.79%
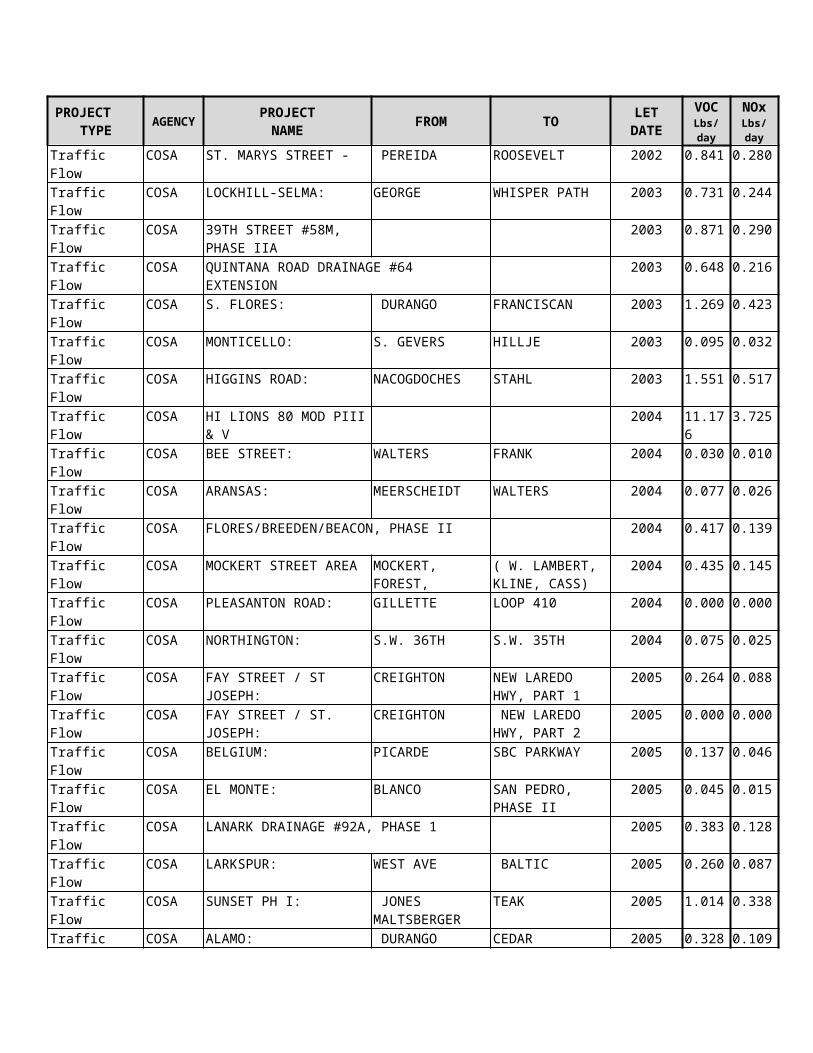
Figure K-7. Idling VOC Emissions before and after New Timing Cycle Implementation on the Bandera System
Figure K-8. Idling NOx Emissions before and after New Timing Cycle Implementation for the Bandera System
Rittiman Emission ReductionFor the Rittiman traffic signal system, VOC and NOx emission reductions are significant during the PM peak hour periods than the AM peak periods or the off peak periods. The VOC reduction for the PM peak period was 27 pounds per hour. The AM peak had a VOC reduction of 11 pounds per hour and off peak had a reduction of 0.5 pound per hour. NOx emissions were reduced by 8 pounds per hour during the PM peak period. The AM peak period had a reduction of 3.5 pounds per hour and the off peak period had a reduction of 0.2 pound per hour.
050
100150200250300350400450500
AM Peak Off Peak PM Peak
Lbs/
Day
Before
After
0
20
40
60
80
100
120
140
160
180
AM Peak Off Peak PM Peak
Lbs/
Day
Before
After
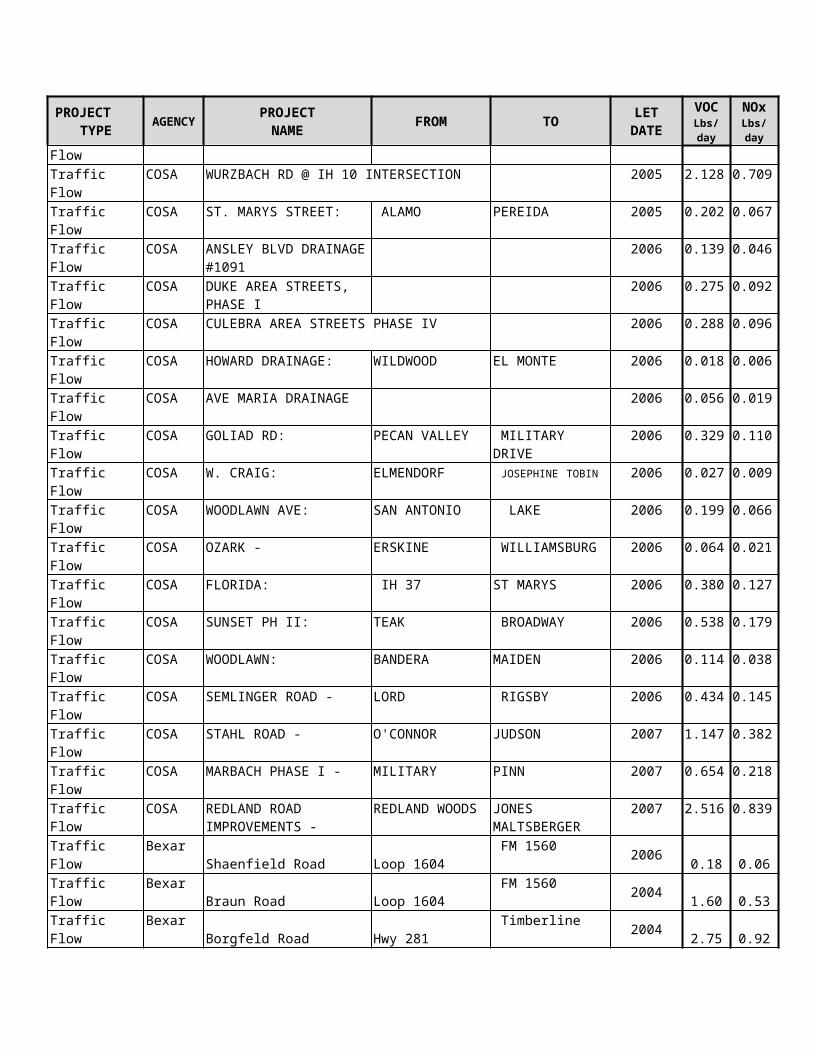
Overall, there were reductions of 82 lbs of VOC and 25 lbs of NOx (Table K-29). This represented the second highest overall percentage reduction at 47%. Figures K-9 and K-10 graphically display the results for VOC and NOx reductions.
Table K-29. Idling VOC and NOx Emission Reductions for the Rittiman Traffic Signal System, lbs/day
Time PeriodVOC NOx Percent
Change (VOC&NOx)Before After Before After
AM Peak 54.42 31.94 16.76 9.83 -41.31%Off Peak 14.92 10.85 4.60 3.34 -27.29%PM Peak 106.98 51.40 32.94 15.82 -51.96%Total 176.32 94.19 54.29 29.00 -46.58%
Figure K-9. Idling VOC Emissions before and after New Timing Cycle Implementation on the Rittiman System
0102030405060708090
100110
AM Peak Off Peak PM Peak
Lbs/
Day
Before
After
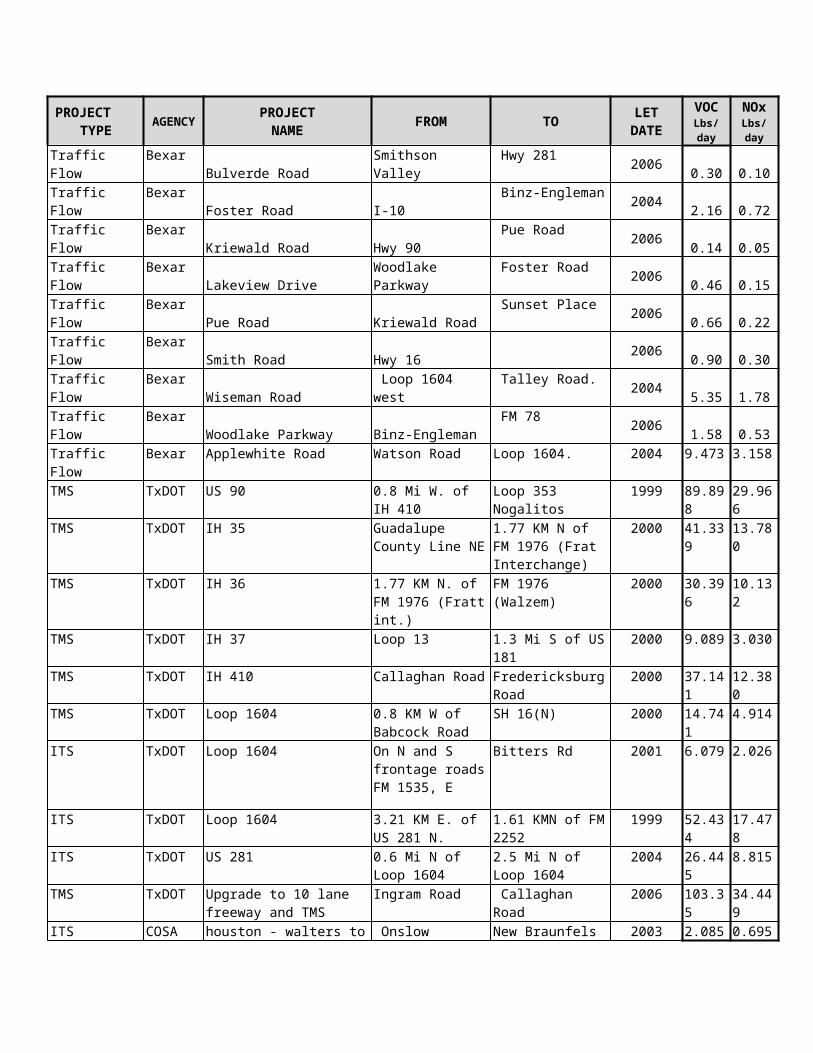
Figure K-10. Idling NOx Emissions before and after New Timing Cycle Implementation for the Rittiman System
Jones-Maltsberger Emission ReductionMinimal emission reduction was evident once the recommended timing cycles were modeled for the Jones Maltsberger traffic signal system (Table K-30). The AM peak period had a VOC emission reduction of 0.6 pounds per hour and a NOx emission reduction of 0.2 pound per hour. An emission reduction of 3 pounds per hour in VOC emissions and 0.8 pound per hour in NOx emissions was noted for their PM peak period. The off peak period had an emission reduction of 0.3 pound per hour of VOC emissions and 0.1 pound per hour of NOx emissions. Figures K-11 and K-12 shows the emissions reductions by time period in bar graph format.
Table K-30. Idling VOC and NOx Emissions for the Jones Maltsberger Traffic Signal System, lbs/day
Time PeriodVOC NOx Percent
Change (VOC&NOx)Before After Before After
AM Peak 6.36 5.12 1.96 1.58 -19.52%Off Peak 19.26 17.37 5.93 5.35 -9.86%PM Peak 19.07 13.57 5.87 4.18 -28.85%Total 44.69 36.05 13.76 11.10 -19.34%
0
5
10
15
20
25
30
35
AM Peak Off Peak PM Peak
Lbs/
Day
Before
After
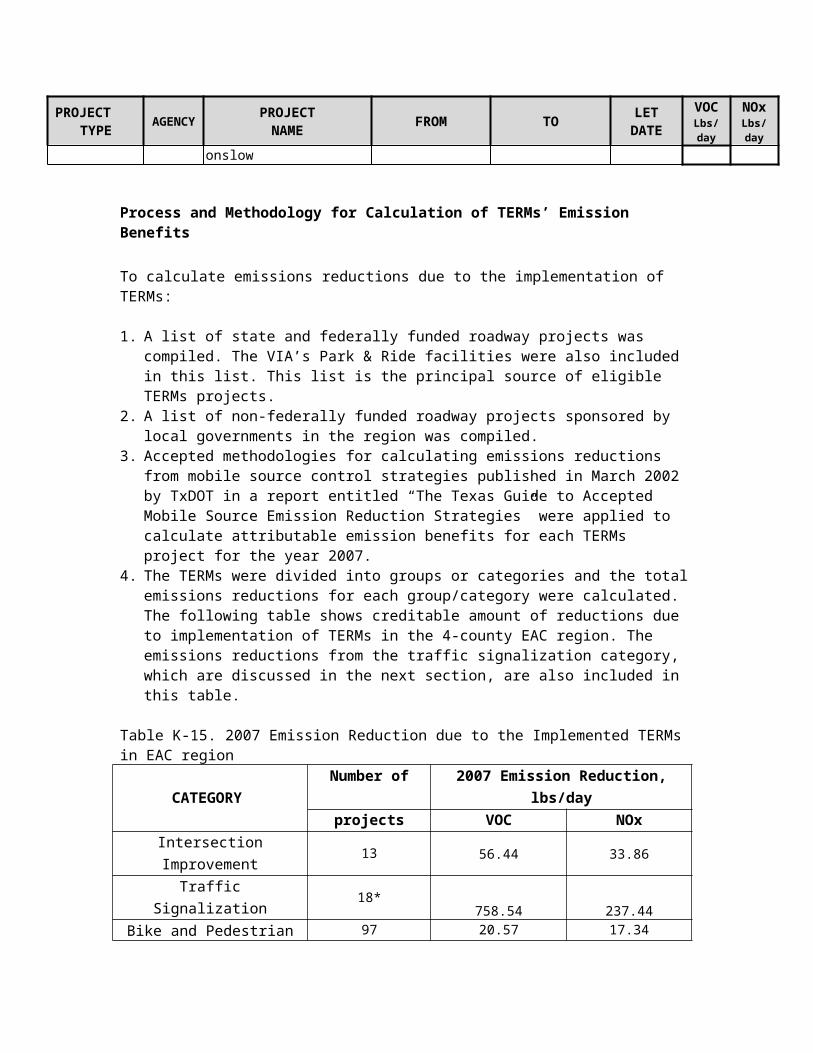
Figure K-11. Idling VOC Emissions before and after New Timing Cycle Implementation on the Jones Maltsberger System
Figure K-12. Idling NOx Emissions before and after New Timing Cycle Implementation on the Jones Maltsberger System
Nacogdoches/Perrin Beitel Emission ReductionThe new timing cycles for the Nacogdoches/Perrin Beitel traffic signal system provided small emission reductions as well. The most emission reduction was noted in VOC emissions during the PM peak period, which amounted to two pounds per hour. The AM peak had an emission reduction of 0.6 pound per hour and the off peak period had an emission reduction of 0.3 pound per hour. Reductions in NOx emissions were small in all three periods, the AM peak period having a reduction of 0.15 pound per hour, off
02468
10121416182022
AM Peak Off Peak PM Peak
Lbs/
Day
Before
After
0
1
2
3
4
5
6
7
8
9
10
AM Peak Off Peak PM Peak
Lbs/
Day
Before
After
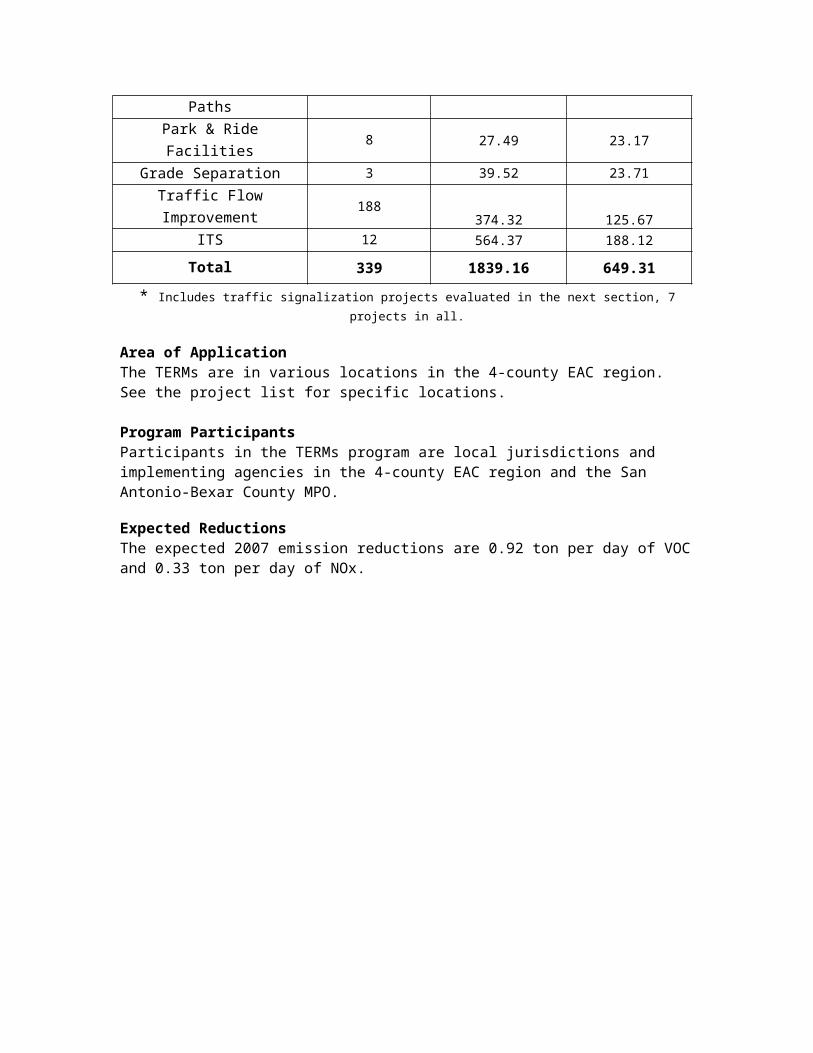
peak had a reduction of 0.09 pound per hour and the PM peak had a reduction of 0.5 pound per hour.
This system had the lowest percentage reduction in emissions with only an overall reduction on 5 percent. Also, table K-31 show that this intersection had the second lowest reduction in overall emissions with (7 lbs for NOx and 2 lbs for VOC). The results are also displayed in figures K-13 and K-14.
Table K-31. Idling VOC and NOx Emissions for the Nacogdoches/Perrin Beitel Traffic Signal System, lbs/day
Time PeriodVOC NOx Percent
Change (VOC&NOx)Before After Before After
AM Peak 11.69 10.41 3.60 3.20 -10.95%Off Peak 44.23 42.57 13.62 13.12 -3.68%PM Peak 92.21 88.37 28.39 27.21 -4.16%Total 148.12 141.35 45.61 43.53 -4.55%
Figure K-13. Idling VOC Emissions before and after New Timing Cycle Implementation on the Nacogdoches/Perrin Beitel System
0102030405060708090
100
AM Peak Off Peak PM Peak
Lbs/
Day
Before
After
Figure K-14. Idling NOx Emissions before and after New Timing Signal Implementation for the Nacogdoches/Perrin Beitel System
The overall reduction of emissions over the selected time frame is illustrated in above Figure. There was a higher incidence of reduction in VOC emissions than in NOx emissions, however, for both precursors the highest reduction was noted in the PM peak hours followed by the AM peak hours. The figure graphically depicts the first modeling day for an example of the time curve. The graph shows that the PM peak emissions reductions were significant, while morning peak hour reductions were not as high as expected. The same trend was noted during all the days analyzed in the photochemical model.
ConclusionSeveral steps were utilized to analyze selected traffic signal systems to estimate the emissions reductions due to the improved timing cycles. Preliminary evaluation of the traffic signal systems by Pape-Dawson Engineers, Inc involved data collection, design improvements, optimal timing plan development and implementation, and simulation of before and after conditions. Models, such as the TRANSYT-7F, Synchro 3.2, and PASSER II, were used in the evaluation and assessment of the traffic signal systems. These models provided simulation files, “before” traffic flow simulations, and optimal timing cycles for the traffic signal systems. Analysis of the recommended timing cycles for the various traffic signal systems indicated reduction of ozone precursors if the cycles were implemented. The highest reduction was noted in the PM peak hours, followed by the AM peak hours, and then off peak had a consistent yet small reduction in VOC and NOx emissions. The amount of the emission reduction is not a substantial amount to cause a notable and significant reduction in ozone levels. This could be due to the fact that few intersections were involved in the study rather than several hundred. If more systems had been involved with the study, then it would have been safe to assume that a great amount of reduced emissions could equivocate to a greater reduction in ozone levels.
Also, since most of the reductions occurred during the PM Peak Hours, the reductions had minimal impact on ozone levels. For the San Antonio area, on-road emissions
0
3
6
9
12
15
18
21
24
27
30
AM Peak Off Peak PM Peak
Lbs/
Day
Before
After
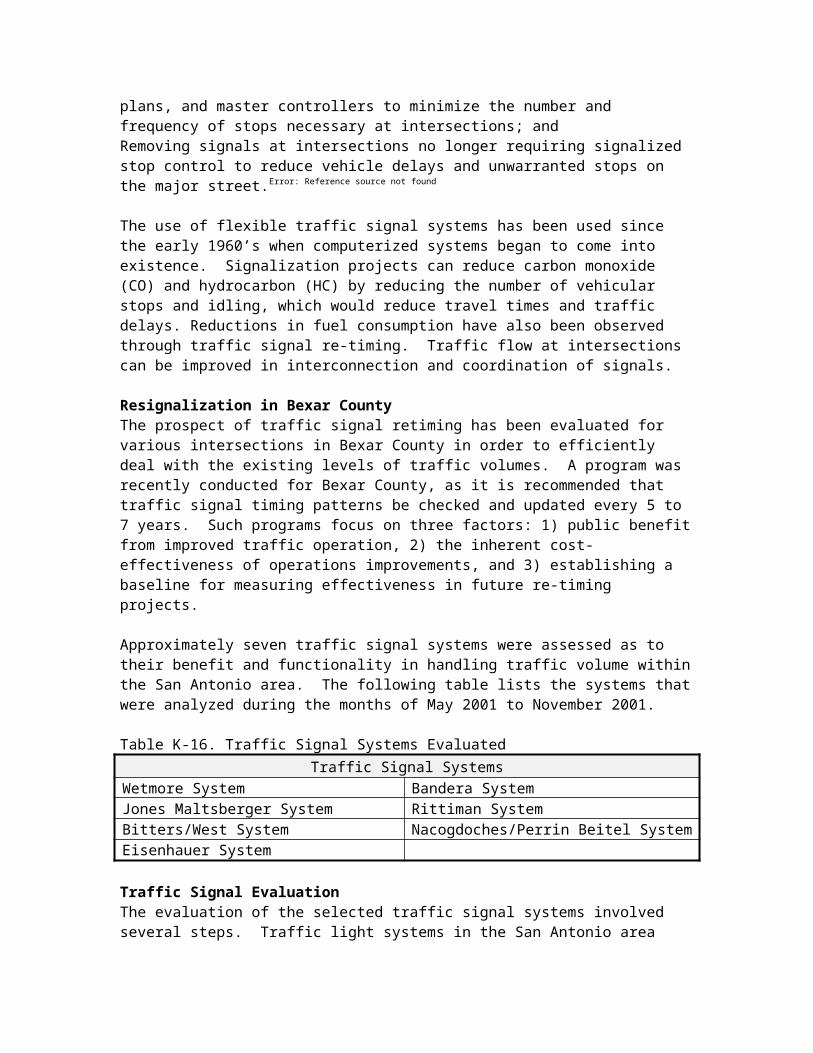
impacts ozone levels the greatest during the late morning and noon periods, while late afternoon on-road emissions have a minimal impact on ozone levels22.
22 For a further description please see San Antonio-Bexar County MPO, June 2002, “UPWP 3.12: Photochemical Analysis of Transportation Control Measures and Alternative Fuel Vehicle Fleets”, San Antonio, Texas.
ENERGY EFFICIENCY / RENEWABLE ENERGY PROJECTSOn December 13, 2002, the TCEQ revised the Houston-Galveston (HGA) SIP to include a protocol for implementing and calculating reductions from energy savings resulting from state Senate Bill 5 and Senate Bill 7 measures. This revision was followed by a revision to the Dallas-Fort Worth (DFW) SIP on March 5, 2003, which included an estimate of NOx reductions associated with SB5 and SB7. (Source: EEIRE)
Since that time, efforts have been underway both to implement the energy reductions required by the state and to quantify the associated ozone precursor reductions. Air quality planners in the San Antonio region currently benefit from a partnership created by the TCEQ between AACOG, the Energy Systems Laboratory (ESL) of Texas A&M University, the local Metropolitan Partnership for Energy, and the Brooks Energy Sustainability Laboratory (BESL) of the Texas Engineering Experiment Station.
ESL is charged by the state to assist local entities subject to Energy Efficiency mandates with these reduction quantification estimates. Under a recently-signed Memorandum of Agreement, BESL is to assist the ESL with technical assistance as part of its duties under Senate Bill 5 by producing an inventory of energy use and savings from existing and planned (through 2007) energy efficiency and renewable energy (EE/RE) projects. The Metropolitan Partnership for Energy (MPE) is assisting these other entities in the identification and inventory of existing and planned EE/RE using its reasonable best efforts.
The TCEQ guidance, "Incorporating Energy Efficiency and Renewable Energy (EEIRE) Projects in the SIP" is being used to provide specific guidance to BESL on content and reporting requirements, including requirements for a spreadsheet to facilitate conversion into creditable NOx reductions by the ESL.
The inventory is due to contain EE/RE project data from local, State, Federal and major private sector companies such as USAA and Toyota.
Types of projects will include, but not be limited to: 1. State-mandated IECC building codes and above code construction as well as special rating programs such as Build San Antonio Green and LEED ratings; 2. Local distributed energy projects including PV, solar-thennal, and fuel cells; renewable energy projects from remote locations planned; 3. Local government energy improvement projects including water and wastewater, street lighting and traffic signals; 4. Major energy conservation retrofits for existing facilities including Continuous Commissioning®, major equipment and control upgrades, and cool roofs, etc.
Deliverables will include: a) Development of inventory of creditable local area SIP EE/RE projects. b) Final report in spread sheet format of existing and planned energy efficiency projects by category, level of energy savings or clean energy from renewable energy projects.
Although credit is not taken here for the Energy Efficiency / Renewable Energy Projects in the region, the benefits of the reductions accrue as Additional Evidence that the San Antonio region will reach attainment. With the completion of the work accomplished through this partnership, the San Antonio regional air quality planners will include the SIP credit available.
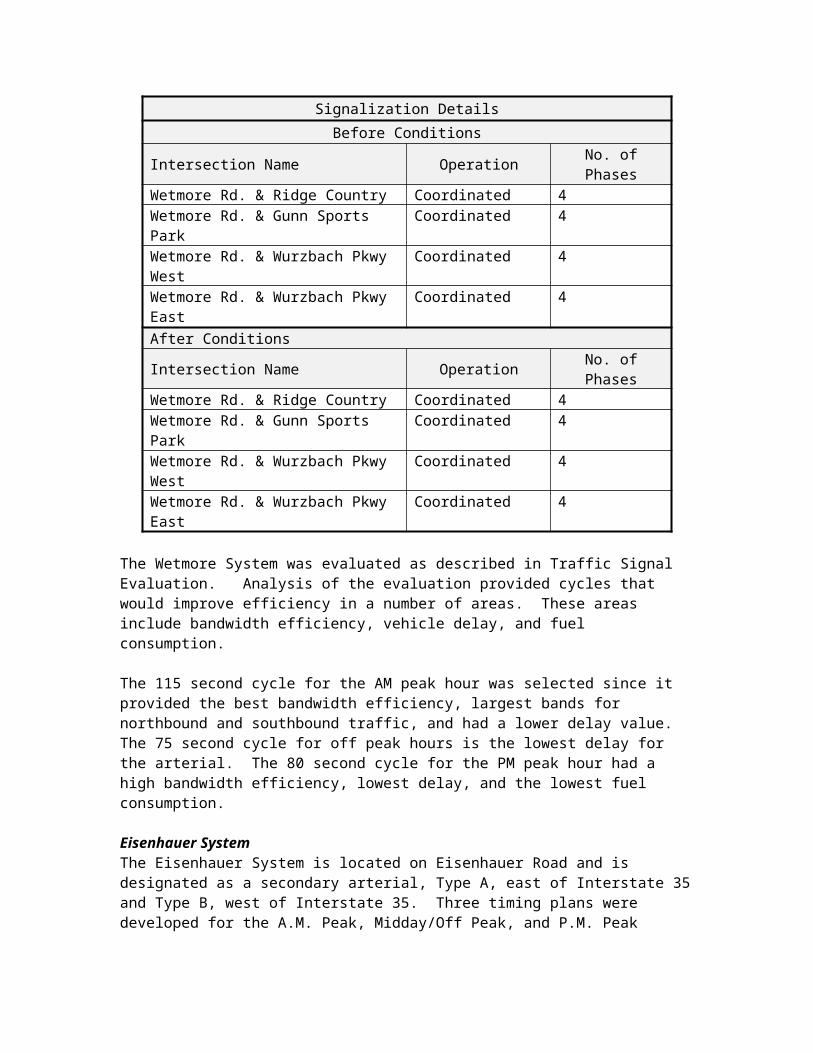
According to the very first draft efforts of the BESL/ESL/TCEQ/MPE/AACOG team, Energy Efficiency measures under Senate Bill 5 give the following reductions in energy production, in megawatt-hours per year (MWH/year): For Bexar County, the electricity savings are 18.179 MWH/year. For Guadalupe County, the electricity savings are 1.217 MWH/year.
With further research, these energy reductions will be quantified and precursor reductions located, as given in the outline above.
Executive Order 13123: Greening the Government Through Efficient Energy ManagementExecutive Order 13123 calls for Federal agencies to improve the energy efficiency of their buildings, promote the use of renewable energy, and reduce greenhouse gas emissions associated with energy use in their buildings, among other energy-related requirements. AACOG is working with several state sponsors to petition the federal government for emissions reductions credits for energy reductions in federal buildings. San Antonio has a high concentration of federal buildings subject to EO 13123. Just as credit for energy efficiency is afforded by state rules in Texas, credit should be available for energy efficiency measures installed in local federal buildings, as appropriate.
References:"Incorporating Energy Efficiency and Renewable Energy (EEIRE) Projects in the SIP," February 5, 2004, Texas Commission on Environmental Quality, Austin, Texas
Federal Register Publication of Executive Order 13123 - Greening the Government Through Efficient Energy Management; published June 8, 1999. Online: http://www.eere.energy.gov/femp/pdfs/eo13123.pdf
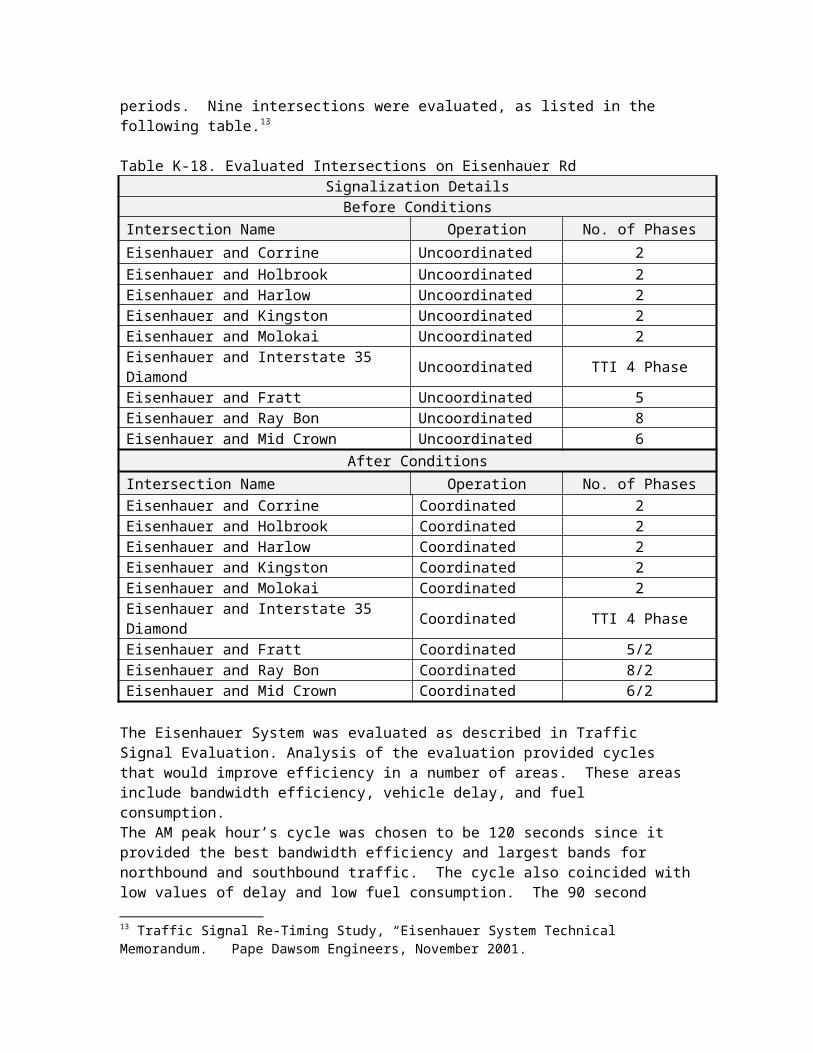
PUBLIC EDUCATION
IntroductionThe following pages describe the public outreach and education projects undertaken by AACOG staff for the purpose of disseminating information on air quality and informing the public of seriousness of air pollution problem in the San Antonio area. The main goal is to familiarize the public with actions they can take to improve the air quality.
Public Education to Encourage Voluntary Pollution Reduction MeasuresThe Air Improvement Resources Committee (AIR Co) has always recognized and will continue to recognize that public education is crucial to achieving long-term air quality improvement. Shortly after its formation, AIR Co created a Public Education subcommittee, comprised of public outreach specialists from local governments, utilities, and non-profits and chaired by AACOG staff, to oversee public outreach and education efforts.
The main goals of the Public Education committee are two fold; 1) to educate the public on the health risks posed by ozone pollution and how they can protect themselves, and 2) to encourage the public to take voluntary action to reduce ozone pollution. The primary method of basic ozone pollution and health education is the Air Quality Health Alert (AQHA) notification system and associated publicity and outreach efforts. The main voluntary pollution reduction measures advocated through publicity, paid media and presentations are:Maintain your vehicle. (basic car care)Drive less. (Commute Solutions, combining errands, walking and bicycling)Don’t idle. (Adopt-A-School Bus No-Idle Program)Re-fuel in the evening.Don’t “top off”.To achieve its goals, the Public Education committee makes full use of advertising funds made available through grants from the Texas Commission on Environmental Quality, the Texas Department of Transportation, and, when available, the Environmental Protection Agency. In addition, AACOG staff makes significant efforts to obtain free publicity for air quality issues. Public education and outreach efforts, including paid advertising, publicity and other voluntary measures campaigns are summarized in the following paragraphs.
Air Quality Health Alert Notification SystemAACOG provides and will continue to provide free AQHA notification for citizens, organizations, and companies within the region. The AQHA system informs citizens of TCEQ’s forecast of high ozone pollution levels on a given day through emails and faxes distributed the afternoon prior to that day. The faxes not only advise recipients of the high ozone pollution forecast and advocate health protection, but also suggest voluntary measures that citizens can make year-round to help reduce ozone pollution. AACOG actively promotes this free service and has more than doubled the number of recipients in the last two years. As of March 2004, the number of registered recipients of AQHA notifications was approximately 1,000, many of whom spread the email to their entire organization, increasing the number of recipients to several thousand. AQHA notifications are also provided to major media outlets and AACOG maintains relationships with those outlets to ensure that Alerts are broadcast with local news and weather. In the near future, AACOG hopes to increase pressure on local media outlets
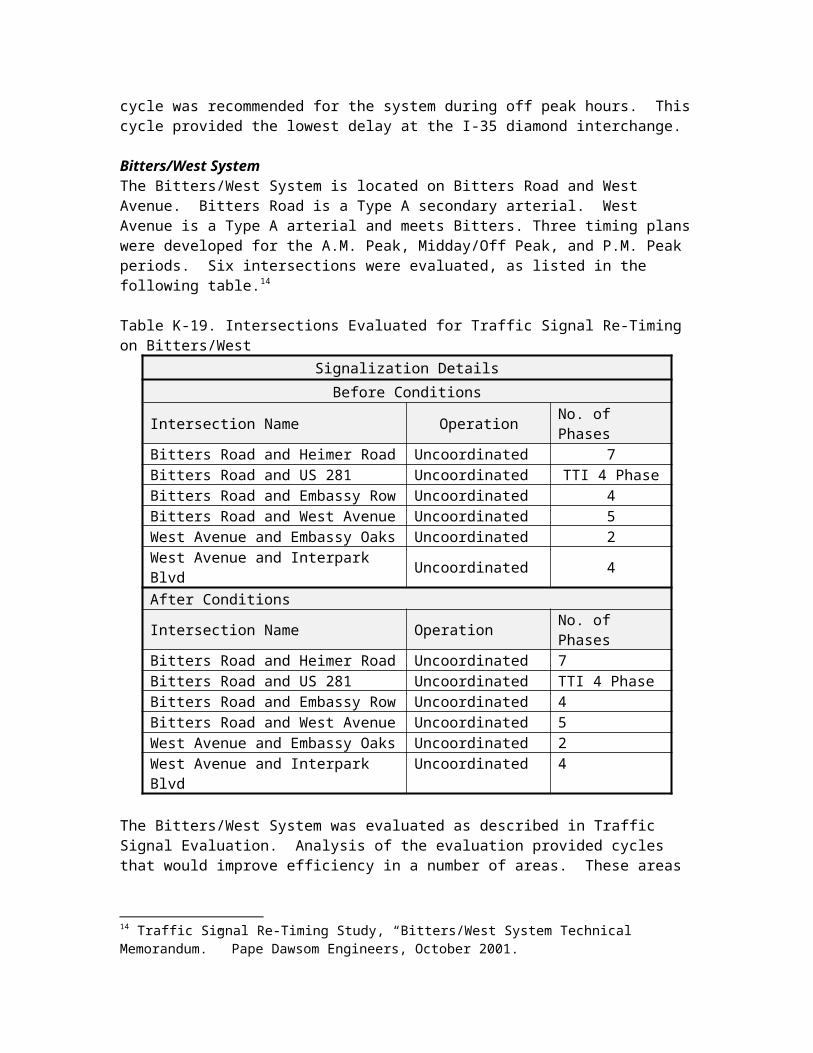
to provide a daily Air Quality Index (AQI) report in addition to AQHAs. Past efforts have already resulted in daily AQI reports from two outlets, News 9 San Antonio (cable television news) and the San Antonio Express-News (primary metropolitan newspaper).As a part of actively promoting the AQHA notification system, AACOG staff routinely presents air quality and health issues to local community groups, businesses and students of all ages. Information on regional clean air policy and voluntary pollution reduction measures is and will continue to be included as a part of these presentations.
Paid AdvertisingPaid advertising campaigns are broadcast on various local radio and television stations, in local newspapers, on highway billboards, and on Internet “hub” websites. Messages used promote clean air actions such as vehicle maintenance, fueling in the evening, and driving less by carpooling, combining errands, or using mass transit. A summary of paid media campaigns for 2001, 2002, and 2003 is available upon request as an example of standard advertising campaigns undertaken by this program. In general, the program advertises using radio “traffic” advertisements because they reach individuals where they are most susceptible to messages about alternate commuting, vehicle maintenance, and cleaner air: while they sit in their vehicles in traffic. The program also uses limited television advertising to convey both air quality and Commute Solutions promotion messages and, additionally, uses newspaper to advertise special events, such as the annual Ozone Season Kickoff event, which is described in later sections.The paid advertising budget is provided through the Alamo Area Commute Solutions grant funds from the Texas Department of Transportation. Advertising Commute Solutions transportation alternatives and their relation to improved air quality has been a major task in the Commute Solutions grant work plan for over five years and will continue to be as long as AACOG is the recipient of those grant funds. Publicity
AACOG staff regularly issue news briefs, news releases, and Air Quality Health Alerts to local media in order to obtain coverage of air quality issues and events. Media coverage for 2001-2003, provided to show the continually increasing effort and result of AACOG staff work, is summarized in the table below:
Table K-32. Media coverage for 2001-2003Media Coverage 2001 2002 2003 2004 Goals
Television Pieces 10 32 34 50Radio Pieces 9 32 37 50Print News Pieces 16 38 70 100
In 2003 alone, AACOG issued over 40 news items. AACOG staff will continue to issue news items and plans to increase the number of items issued each year.
Outreach Events & PresentationsAACOG staff also hosts and/or participates in community events, gives presentations to civic groups, and gives interactive lessons to student groups. As an example of the region’s continuing commitment to educating individuals on a personal or small group basis, events, presentations, and interactive lessons given in the past three years are summarized below:
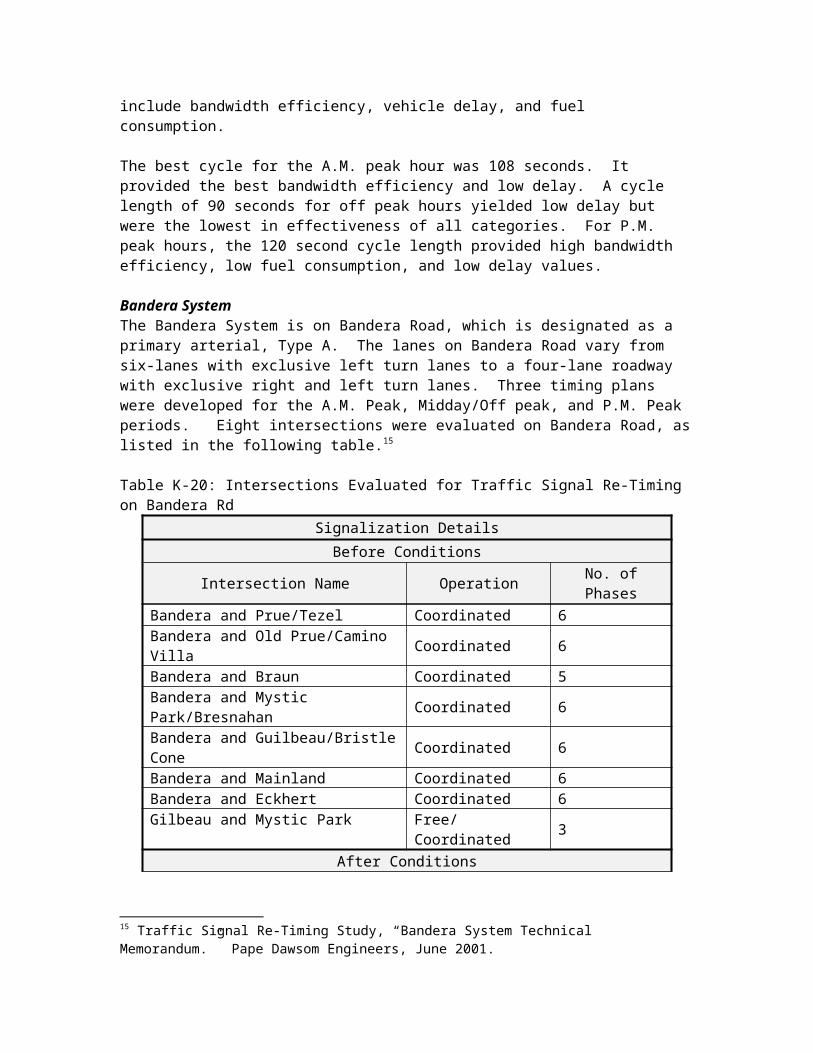
Table K-33. Outreach Activities
Outreach Type 2001 2002 2003 2004 Goals
Civic Group Presentations 27 23 34 50School-Related Presentations 12 9 20 25Events 18 19 27 40
At each of these outreach events or presentations, staff disseminates informational and promotional items to remind the public of ozone pollution’s health effects and encourage individual voluntary pollution reduction measures. Materials are produced by AACOG through the Commute Solutions budget and are also donated to AACOG by various state and federal agencies, including the Texas Department of Transportation, the Texas Commission on Environmental Quality and the Environmental Protection agency. An example of this materials dissemination lies in the first eight weeks of 2004, in which staff has distributed over 4,000 items and reached over 1,600 individuals.
WebsiteIn addition to external outreach efforts, AACOG staff maintains an air quality website, www.aacog.com/air, that provides extensive information on ozone pollution, its causes, its health effects, and voluntary measures citizens can take to help reduce the pollution problem. The website is constantly updated and expanded, providing weekly air quality facts and the latest news on air pollution and policy issues. Beyond just providing information, the website allows users to make requests of staff, including online registration for the AQHA program, informational and promotional materials requests and requests for air quality presentations for students or organizations.
Alamo Area Commute Solutions ProgramThe Alamo Area Commute Solutions Program, funded by the Texas Department of Transportation, seeks to reduce traffic and air pollution by promoting commute alternatives, including:RideShare (carpooling and vanpooling)Alternate Schedule (compressed work week and flex scheduling)Mass TransitTeleworkBicycling and WalkingThe Commute Solutions Program has experienced great success in the past by targeting not only individual commuters with radio and television outreach, but by approaching businesses to institute Commute Solutions programs as benefits for their employees. Over 4,000 individuals currently participate in the Commute Solutions program. Commute Solutions will continue to increase success by further targeting outreach to companies through the Best Workplaces for Commuters program. As this program allows employers to receive substantial tax savings and improved public image by meeting a national standard of excellence in commuter benefits, it is a much improved tool for encouraging and actually achieving a reduction in single occupancy vehicle travel and, hence, air pollution.
In addition, Commute Solutions promotes and assists with the implementation of two commute assistance programs for schools, SchoolPool and Walking School Bus. By reaching out to parents and schools through Parent Teacher Association meetings, mailings, and contact with administrators, Commute Solutions staff establishes and
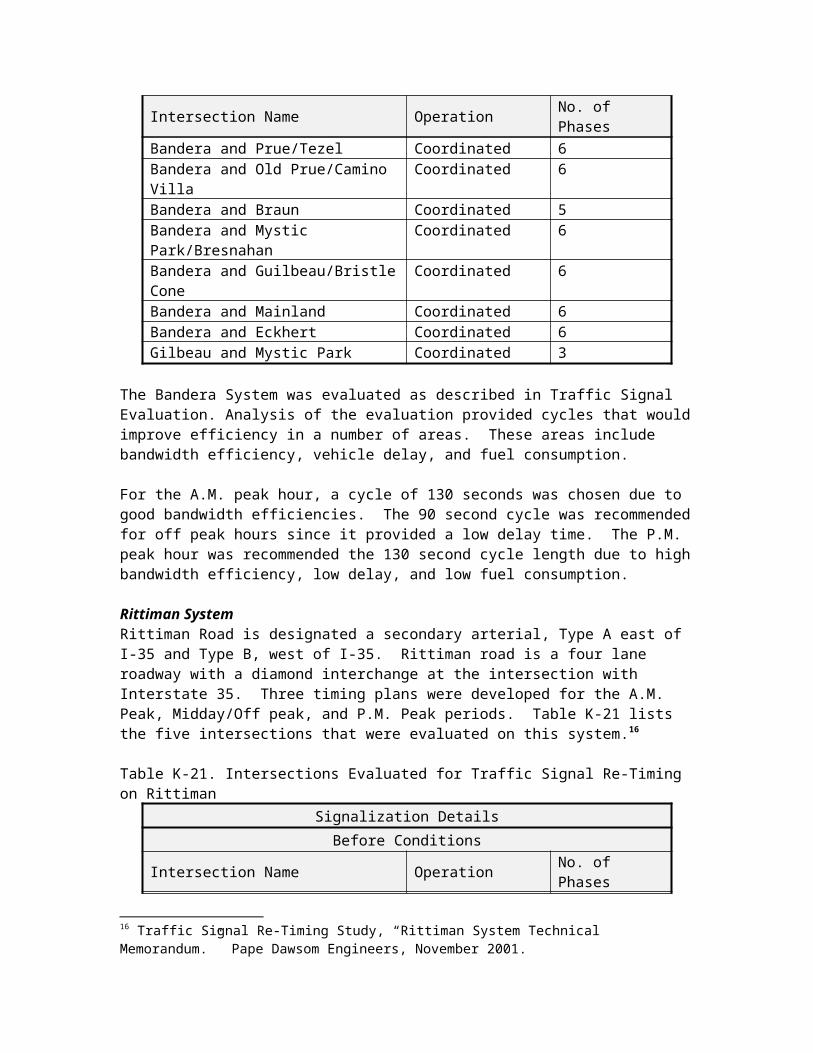
maintains School Pool and Walking School Bus programs that allow parents to share the responsibilities of driving or chaperoning a group of walking children on the way to and from school. This reduces the number of cars idling in the school’s student pick-up/drop-off zone, which directly reduces pollution and also improves safety by reducing potential student-vehicle interaction in the parking lot.
All Commute Solutions services are available through the Commute Solutions website, www.aacog.com/commutesolutions, which is constantly updated and expanded. This website will be maintained throughout the coming years and will be used to provide ever quicker, more responsive, more accurate services to the region’s commuters.
Adopt-A-School Bus Idling Reduction ProgramThrough the Adopt-A-School Bus grant, AACOG is embarking upon a new air quality outreach campaign focused on idling reduction. The No Idle program will educate students, parents, teachers and administrators on the air quality improvements possible through reduced idling, both by buses and passenger vehicles, during student drop-off and pick-up. The program will encourage drivers to “Clean it up. Turn it off. Keep it Green.” by turning off their passenger vehicle engines when the vehicle will remain idle for more than ten seconds. Similar idling limits will be sought of bus drivers. The main methods for this outreach will be personal contact and presentations to students, parents, school staff, and bus drivers. Students will participate as a “Green Patrol”, tracking and rewarding drivers who are not idling. Parents and bus drivers will take the “No Idle Pledge.” Schools will become certified “No Idle Zones.” Though schools will be the first focus of this program, once success is achieved at the schools, the program will be expanded to encourage reduced idling while waiting in parking lots and drive-through lanes.
A projected replacement of 275 school buses for the San Antonio area over the course of three school fiscal years could realize a reduction of approximately 110 tons/year of NOx and 11 tons/year of PM. There would be an added benefit of a substantial reduction in the emissions of air toxins as well. There could be a combination of replacement and retrofitting of buses to achieve NOx and PM reductions, depending on technology available and the availability of low-sulfur fuel.
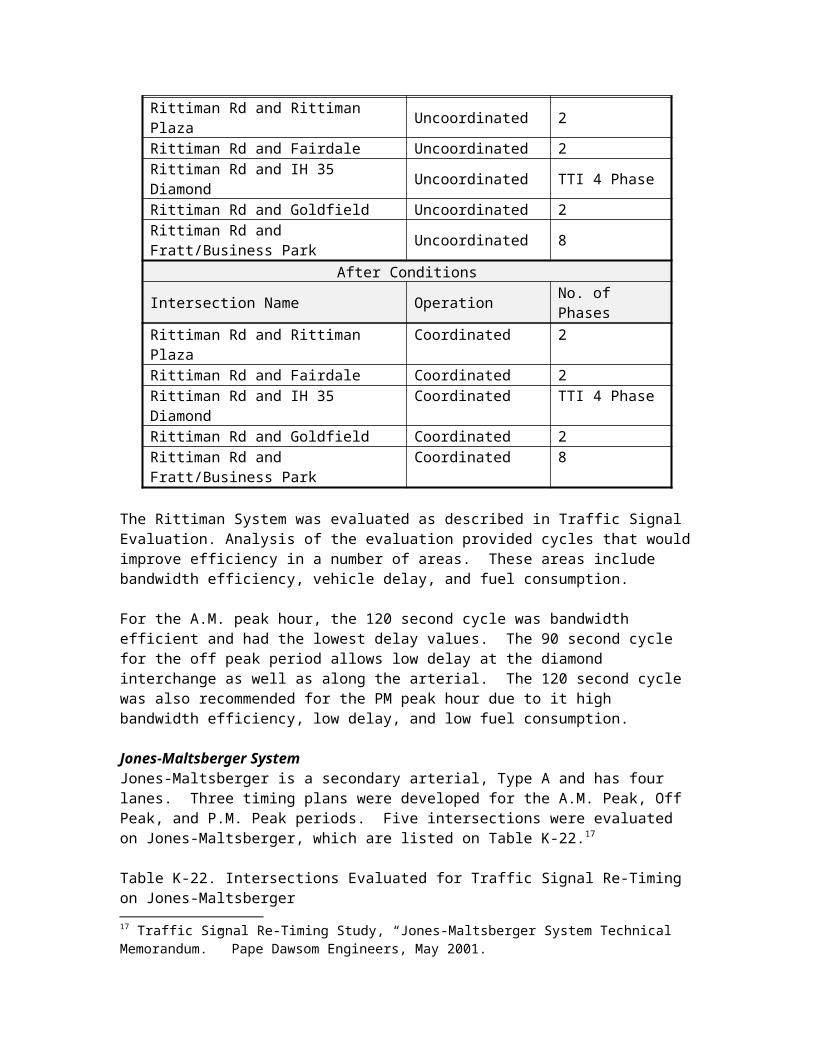
LAWNMOWER RECYCLING PROGRAM
IntroductionLawnmowers, rotary tillers, lawn and garden tractors, leaf blower/vacuums, and chainsaws are examples of this residential equipment category. When aggregated, residential equipment represents a major source of emissions that contribute to the pollution of air. There are ongoing efforts, with a degree of success, in the San Antonio area to mitigate pollution generated by residential lawn and garden equipment. In the following pages these efforts and attributed emissions benefits are discussed.
Calculating Emission FactorsAn essential part of calculating residential equipment emissions is the use of an accurate emission factor (EF) for each pollutant. In the process of 1999 emission inventory, AACOG staff developed techniques for calculating residential equipment EFs, which have been documented in a report entitled “ 1999 Emissions Inventory for the Alamo Area Council of Governments Region, August 2001." These EFs will be used here to calculate the amount of emission reduction due to the CPS’s “Mow Down Smog” lawnmower recycling initiative. The followings, taken from the above mentioned report, will describe this calculation procedure in more detail.
“In an effort to find more recent and specific equipment type EFs, EPA’s recently updated (April 2000) Nonroad Emission Inventory Model was used.23 The EFs for residential equipment were developed using the following process:24
A 1999 Nonroad Model run for residential equipment was done for Texas. The output from this run was used to obtain the following for all types of residential equipment:HC, CO (i.e., a colorless, odorless and tasteless gas released primarily by incomplete combustion of fossil fuels) and NOx (i.e., a group of gases released by the combustion of fossil fuels and natural sources such as forest fires, lightning and decaying vegetation) emissions in tons/year for each type of equipment Equipment populations (Eqmt. Pop) for each type of equipmentThe Nonroad Model input file activity.dat, was then used to obtain the following values:The activity rate of each type of equipment in hrs/yr. (HRS)A LF (the average power level at which the engine operates divided by the maximum available power) for each type of equipment The average horsepower (Avg. hp) for each type of equipment was then determined from the Nonroad Model input file Tx.pop.With all the factors in place, EFs for HC, CO, and NOx were then calculated using the following formula:
EF (g/bhp-hr) = (tons/year of pollutant) x (2000 lbs./ton) x (453.6 g/lb.)/ (Eqmt. Pop) x hrs/yr.) x (Avg. Hp) x (LF)
23 U.S. Environmental Protection Agency, 1992. Procedures for Emission Inventory Preparation, Volume IV: Mobile Sources. Research Triangle Park, NC., and U.S. Environmental Protection Agency, 1991. Nonroad Engine and Vehicle Emissions Study Report. Washington, DC.
24 U.S. Environmental Protection Agency, 2000. Nonroad Emission Inventory Model.Ann Arbor, MI.
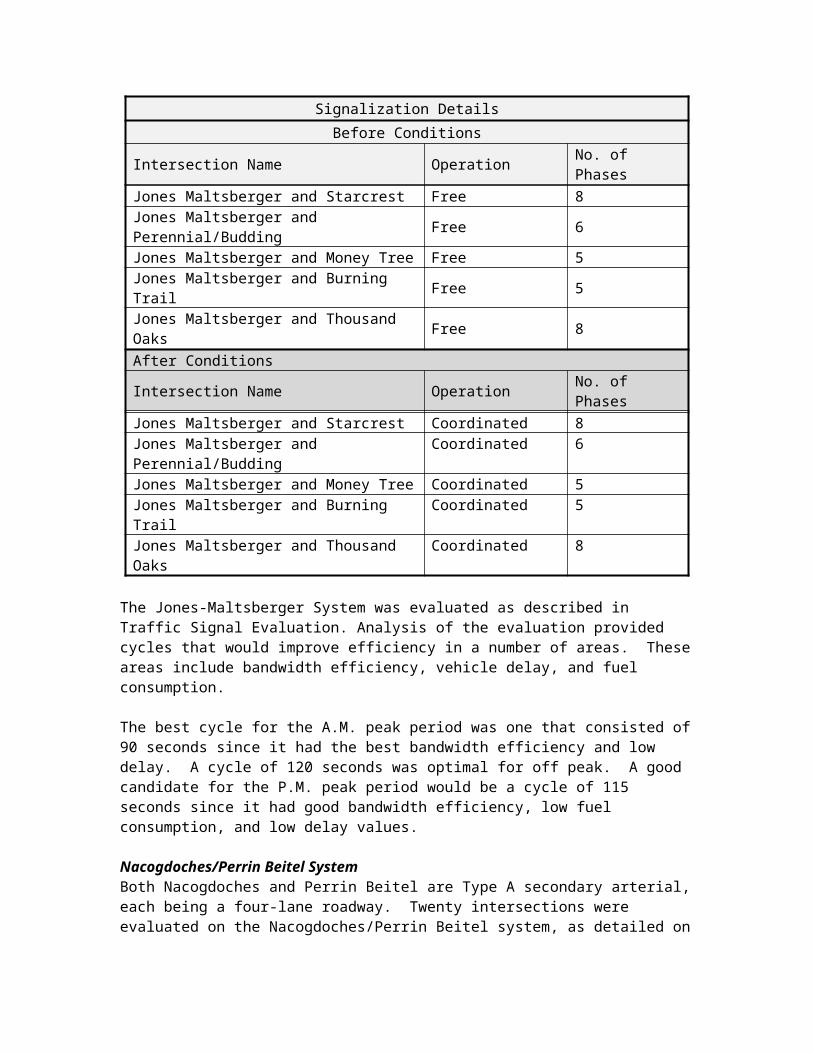
The resulting EFs are used in calculating emissions from each type of equipment.”
For reference, the following tables, which describe the residential equipment parameters and the calculated EFs for the residential equipment, reported in the above mentioned 1999 EI, are presented in this appendix:
Table K-34: Residential Equipment
Residential Equipment Parameters
Equipment Type and Category
Average Horsepower (HP) Load Factor (LF)
RT/R/2S 2.321 0.4RT/C/2S 2.321 0.4CS/R/2S 2.110 0.7CS/C/2S 3.532 0.7LV/R/2S 1.363 0.94LV/C/2S 1.956 0.94LM/R/4S 4.070 0.33LM/C/4S 4.070 0.33RT/R/4S 4.712 0.4RT/C/4S 4.712 0.4LV/R/4S 3.420 0.94LV/C/CS 10.924 0.94RERM/R/4S 10.657 0.38RERM/C/4S 10.657 0.38FM/C/4S 13.519 0.65OLGE/R/4S 5.356 0.58OLGE/C/4S 5.387 0.58
Table K-35: Emissions FactorsCalculated EFs for Residential Equipment (grams/hp-hr)
Equipment Type
VOC CO Exhaust
NOx ExhaustExhaust Crank Diurnal Displ. Spillage
LM/R/4S 52.0869 2.0697 3.3551 0.8595 7.2977 658.3792 2.7479
The next step in our calculation process entails estimation of length of time that a typical lawnmower is used in San Antonio area. By applying the EFs for NOx and VOC emissions to this length of time, the amount of emissions generated by a typical residential lawnmower can be calculated.
Lawnmower Usage TimeThis length of time, according to the 1999 EI report, is 35.9872 hours per a year for Bexar County, which is the assumed area of interest for this calculation and the CPS’s “Mow Down Smog” recycling program. Table K-36 illustrates how this usage time has been calculated.
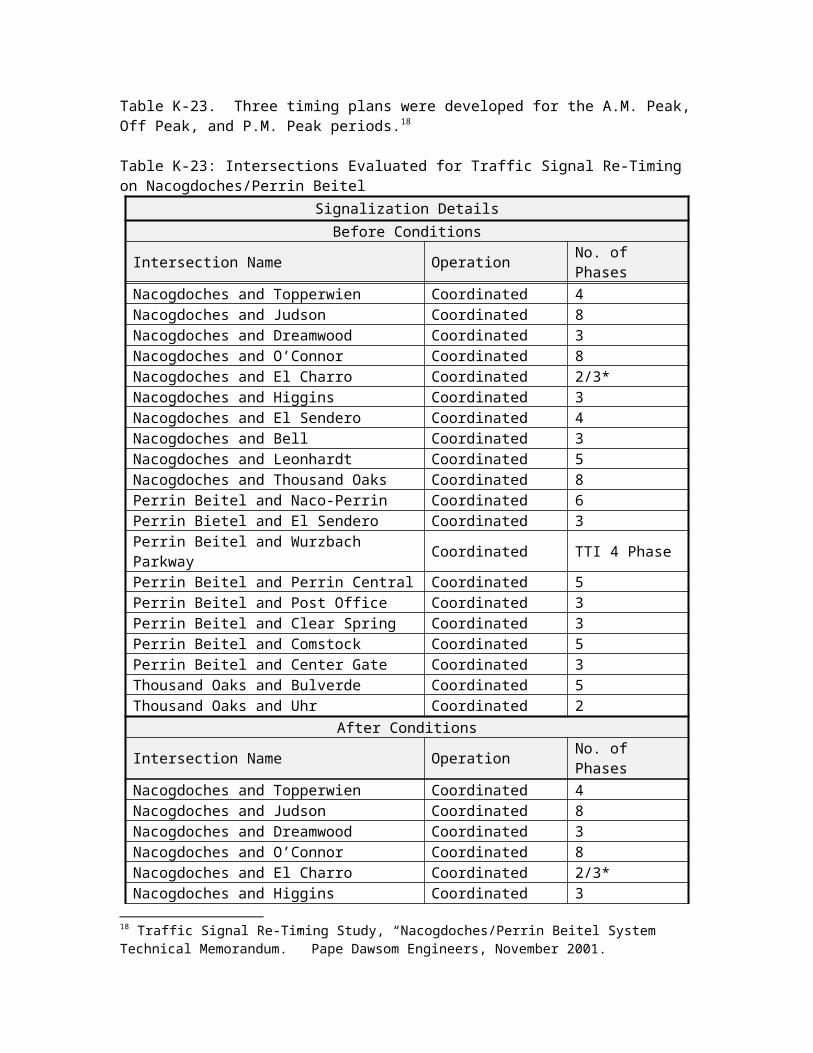
Table K-36: Adjusted Lawnmower Usage Time How many hours per summer week is the gasoline powered lawnmower used?
Lawnmower Use Ratio
Use (hr/yr.)Choice
(minutes per week)
Survey Response
Survey Response Ratio
Adjusted Survey Response
Adjusted Survey Response Ratio
None 14 0.0388 0 0.0000
0.8643
0.00000-15 11 0.0305 11 0.0353 0.123415-30 24 0.0665 24 0.0769 0.807730-45 50 0.1385 50 0.1603 2.804545-60 75 0.2078 75 0.2404 5.889460-90 48 0.1330 48 0.1538 5.384690-120 25 0.0693 25 0.0801 3.9263120-150 30 0.0831 30 0.0962 6.0577>150 49 0.1357 49 0.1571 10.9936Don’t know 35 0.0970 0 0.0000 Total Use 35.9872Total 361 1.0000 361 1.0000
Emissions Reductions AmountsThe next step is to calculate the emission reduction amount (pound/day) due to the recycling of 4-cycle residential lawnmowers for emissions of VOC (exhaust, crank, diurnal, displacement, and spillage), CO exhaust, and NOx exhaust categories in Bear County. This process entailed use of EFs from Table K- 37 for LM/R/4S equipment and the following formula from 1999 EI report.
Emissions for VOC, NOx, and CO = EP x HRS x HP x LF x EF
Where:
EP = equipment populationHRS = annual hours of useHP = average rated horsepowerLF = typical load factorEF = average emissions of pollutant per unit of use
Table K-37 illustrates the results of this calculation for all VOC, CO, and NOx categories in Bexar County.
Table K-37: Reduced Emissions from “Mow Down Smog” Recycling Program
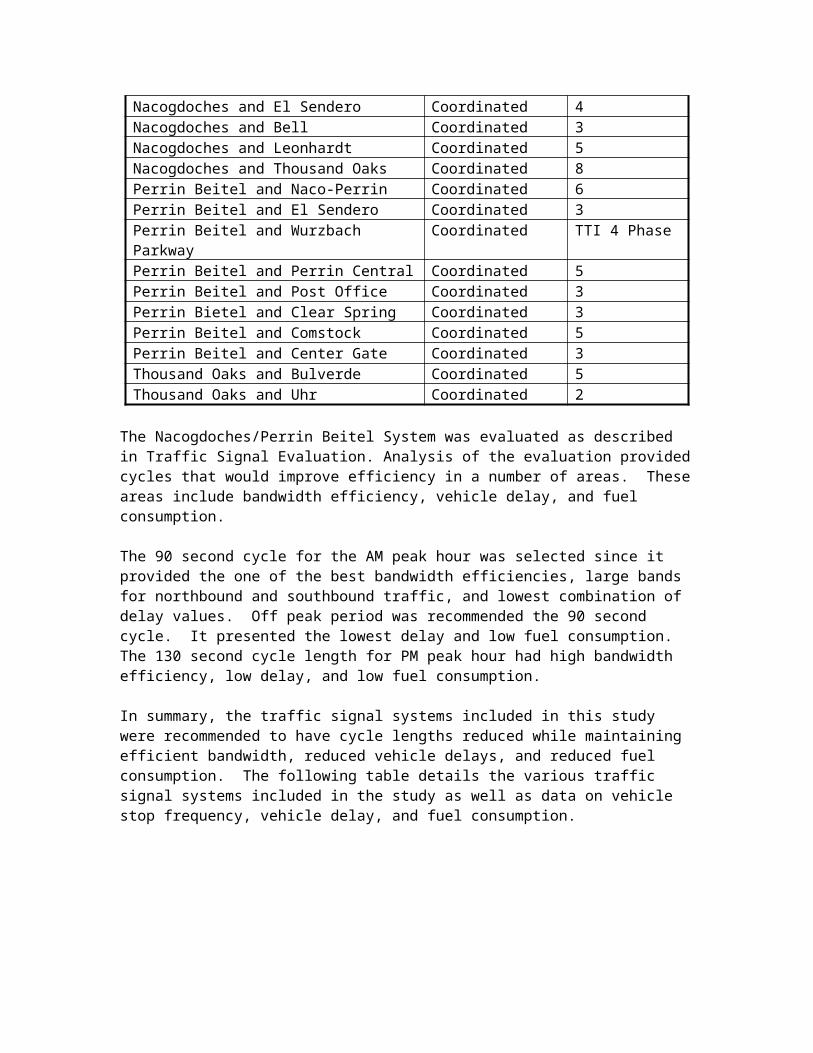
TRUCK STOP ANTI-IDLING PROGRAM
IdleAire provides individual electrical service for 53 parking spaces at the Trans America Truck Stop the intersection of Foster Road and IH-10 East. This has traditionally been referred to as “truck stop electrification (TSE).” On top of TSE, IdleAire provides other layers of services that comprise Advanced Travel Center Electrification (ATE), a flexible package that can be altered and customized to industry needs. Currently, a heating, cooling and ventilation unit sits above each parking space. The unit is connected to the Service Delivery Module by means of a flexible, reinforced, concentric hose, which also houses the delivery mechanisms for the communications and entertainment packages. All TSE and ATE services, including temperature, fan speed and all other service selections, are delivered to and independently controlled by each individual driver in the truck cab via the Service Delivery Module.
The IdleAire system removes 100% of emissions associated with extended diesel idling, including nitrogen oxides (NOx), particulate matter (PM), volatile organic compounds (VOC), carbon monoxide (CO) and carbon dioxide (CO2). The system has a net reduction of 98% of criteria pollutants under the Clean Air Act after accounting for the electricity from the grid used to power the system, and an overall 83% net emissions reduction. Per each parking spaces each year (assuming 60% utilization), those diesel emissions amount to an estimated .71 metric tons of NOx, .014 tons of PM, .036 tons of VOC, 54.65 tons of CO2, and .30 tons of CO totaling 55.71 metric tons a year. Applied to the 53 parking spaces at this facility, those emissions would amount to about 2952.63 tons each year. The IdleAire system saves 100% of the diesel fuel associated with extended diesel idling, approximately 1.0 to 1.1 gallons per hour.
WALKING SCHOOL BUS PROGRAMSWalking School Bus programs help provide a safe and healthy way for young students to travel to and from school while also decreasing vehicle-related pollution, increasing child activity, and relieving parents of extra morning stress. Currently, many students who live near schools, instead of riding the bus, are driven to and from school by their parents. Both the additional vehicle miles traveled and vehicle time spent idling due to parental drop-off and pick-up are sources of air pollution. Walking School Bus matches parents of non-bus riding students who live near one another and attend the same school. The matched parents are then advised to set up a schedule by which they divide chaperoning duties for a small group of students on their walk to school. Parental supervision increases the safety of the student walkers and thus eases parent fears about allowing their children to walk rather than be driven. Walking to school provides the students with healthy daily activity, and, with fewer vehicles making the home-to-school commute air pollution and parental stress are significantly reduced.
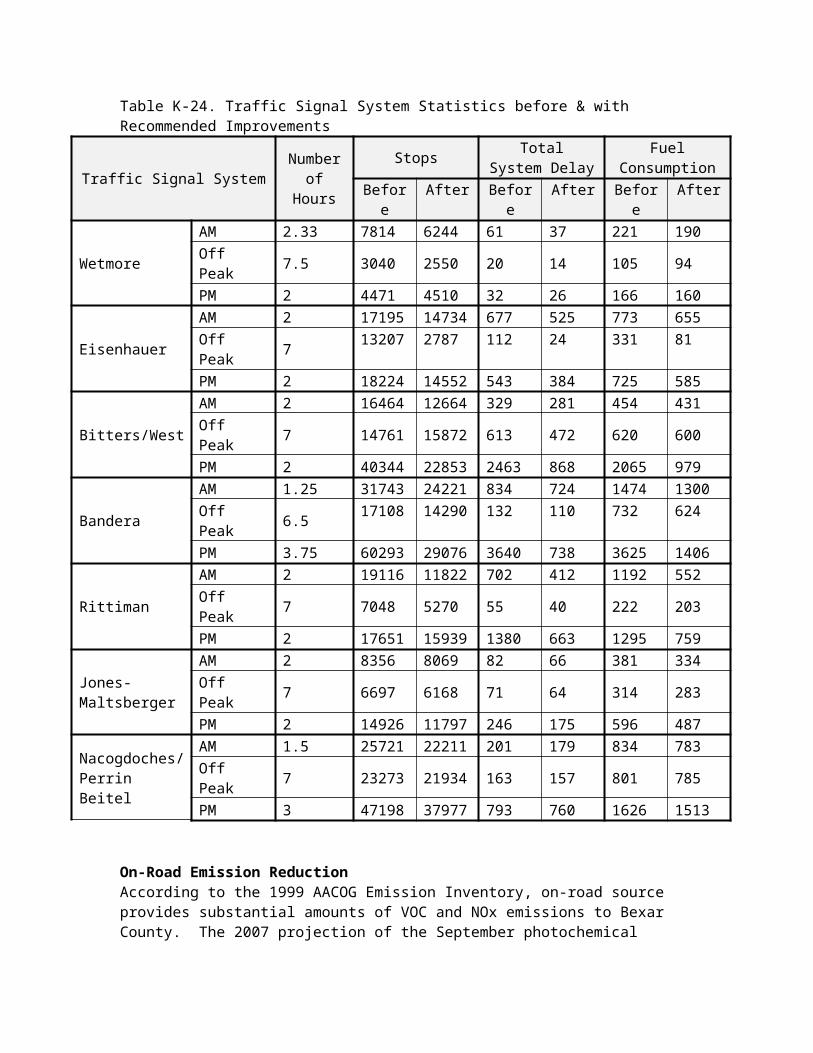
Lower Reid Vapor PressureFuel control measures are effective strategies for states to use to reduce ozone pollution. The two primary approaches to fuel controls are state opt-in to the federal RFG program subject to certain conditions, and state adoption of a low Reid Vapor Pressure (RVP) requirement that is more stringent than the applicable federal RVP requirement. While both approaches reduce volatile organic compounds, which are precursors to ozone, they differ in their overall environmental benefits, whether the state or federal government administers them, and the statutory provisions governing their adoption.
About Credits for Lower RVP Under an Early Action CompactIn general, the Clean Air Act (CAA) provides that states are preempted from adopting their own fuel control requirements different from existing federal requirements. However, EPA may waive preemption under certain circumstances.
State opt-in to the RFG program is not preempted because EPA establishes and enforces the federal RFG requirements at the federal level and the Act provides explicit authority for states to opt-in to the federal requirements under section 211(k).
State adoption of low RVP gasoline requirements is controlled by section 211(c)(4) of the CAA. Section 211(c)(4)(A) prohibits25 states from prescribing or attempting to enforce any "control or prohibition" of a "characteristic or component of a fuel or fuel additive" if EPA has promulgated a control or prohibition applicable to such characteristic or component under section 211(c)(1). This preemption does not apply if the state control is identical to the federal control. Section 211(c)(4)(C) provides an exception to this prohibition for a non-identical state standard contained in a state SIP where the standard is "necessary to achieve" the primary or secondary NAAQS that the SIP implements. EPA can approve such a state SIP provision as necessary if the Administrator finds that "no other measures that would bring about timely attainment exist," or that "other measures exist and are technically possible to implement, but are unreasonable or impracticable."
The 7.2 psi gasoline RVP of for the San Antonio region was proposed after undertaking careful and in depth modeling, cost-benefit analysis, and consideration of sentiments of the local communities and their elected officials. The local refineries have also been contacted to determine their ability to produce and market this fuel with considerable competition among each other. It was determined that the refiners were technologically capable of producing the proposed gasoline fuel and the market forces would drive the at-pump price.
If allowed, adoption of this fuel during the ozone season is expected to help reduce emissions of VOCs and NOx by 2.1 and 0.05 tons/day respectively. The requirement for gasoline refineries to provide such gasoline will only be during the months of March through October, which is usually the time of the year ozone levels exceed the national standard in San Antonio region. Currently, the State’s Regional Low RVP Gasoline program requires that low RVP gasoline be used in 95 central and eastern Texas counties during the summer months when ozone pollution is at its worst. The program,
25 Federal Clean Air Act, Sec. 211. (a)(4)(A) “Except as otherwise provided in subparagraph (B) or (C), no State (or political subdivision thereof) may prescribe or attempt to enforce, for the purposes of motor vehicle emission control, any control or prohibition respecting any characteristic or component of a fuel or fuel additive in a motor vehicle or motor vehicle engine.” Available online as http://www.epa.gov/oar/caa/caa211.txt.
which began May 1, 2000, requires that all gasoline sold from retail gasoline-dispensing facilities within the affected counties have a maximum Reid vapor pressure of 7.8 psi from June 1 through October 1 of each year. Gasoline suppliers are required to supply low RVP gasoline to the affected counties from May 1 through October 1 of each year.
Credit CalculationsAdoption of 7.2 psi fuel during the ozone season is expected to help reduce emissions of VOCs and NOx by 2.1 and 0.05 tons/day respectively. The requirement for gasoline refineries to provide such gasoline will only be during the months of March through October, which is usually the time of the year ozone levels exceed the national standard in San Antonio region.
Reduction Calculations Methodology OverviewModeling scenarios with the MOBILE6 model indicated that lowering the RVP in gasoline to 7.2 from 7.8 would reduce emissions from the on-road mobile fleet in the SAER counties. The table below lists the emission reduction percentages for each of the SAER counties.
Reductions for SAER counties with RVP 7.2 gasoline, compared with RVP 7.8.
County VOC % Reduction, 2007 On-Road Mobile Fleet
NOx % Reduction, 2007 On-Road Mobile Fleet
Bexar County 4.18 0.06Comal County 3.73 0.05Guadalupe County 3.69 0.05Wilson County 3.14 0.06
The percentage reduction of precursor emissions was used to calculate actual reductions. The actual reduction was estimated by multiplying the 2007 daily on road emissions total for each county with the emission reduction percentage. The resulting number was then divided by 100 to provide the emission reduction total in tons per day.
(2007 tons/day VOC x emission reduction %) / 100 = 2007 tons/day of VOC reduced)
References:
Texas Commission on Environmental Quality (TCEQ), 2000. “Dallas/Fort Worth Attainment Demonstration.” Available online: http://www.tnrcc.state.tx.us/oprd/rule_lib/4dfwsip.pdf
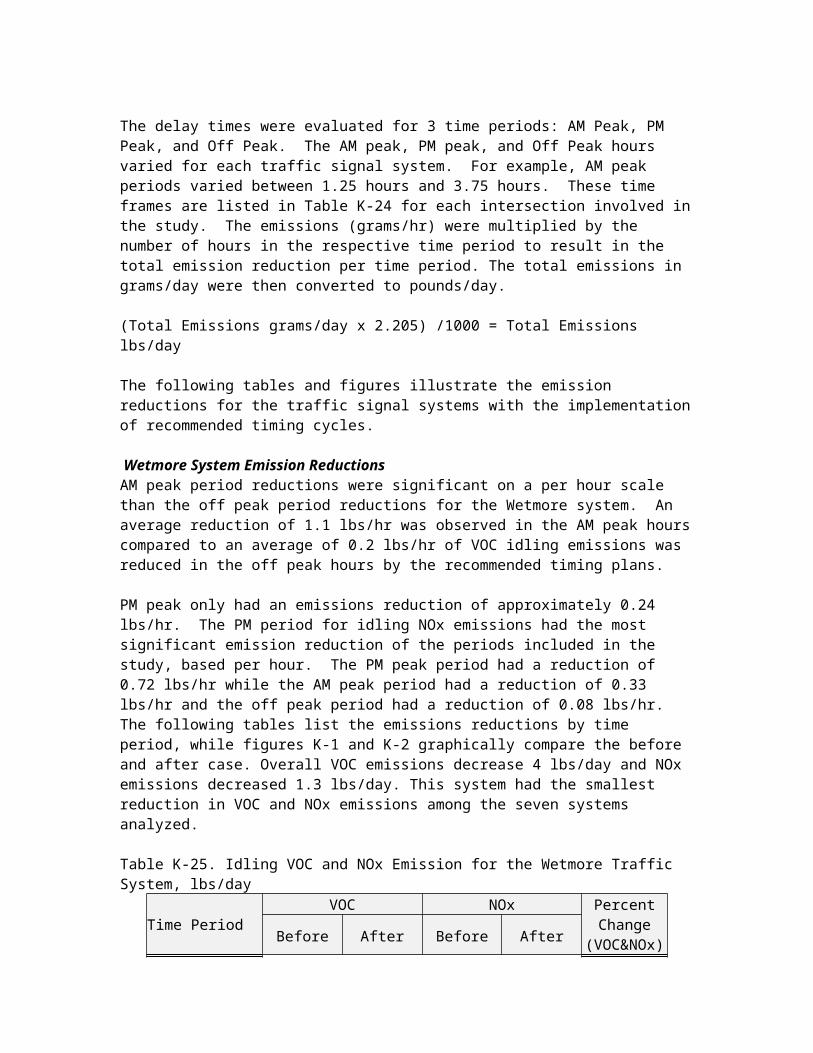
Energy Generated from WindWind is a natural resource that is constantly replenished, supplying energy to wind turbine installations in 26 states. Second only to North Dakota26, the state of Texas is a leader in wind energy potential (average megawatts of capacity), with an annual energy potential of some 1,190 billion kWh and an average power output of 136,000 megawatts.27
While numerous wind farms in Texas have been built over the past few years, it is clear that the opportunity for generating additional electricity from the wind is huge. The Pacific Northwest Laboratory28 has mapped the wind resources available nationwide and published their findings as the Wind Energy Resource Atlas of the Unites States.29 If one browses the atlas, it will become clear that the wind in many states, including Texas, represents a good energy resource.
San Antonio City Public Service (CPS), the provider of electricity to the San Antonio region, has purchased all of the power produced at the Desert Sky wind farm under a long-term contract.30 Located in West Texas, just north of Interstate 10 about 45 miles east of Fort Stockton, Desert Sky wind farm has a power generation capacity of 160,500 kilowatts, enough power to supply about 40,000 average American homes. The electricity from the site flows into the Electric Reliability Council of Texas (ERCOT) power transmission network that serves CPS's customers in the San Antonio area.
City Public Service intends to use energy generated from wind in place of fossil fuels (coal, oil, and natural gas), for the purpose of keeping the amounts of NOx and VOC emissions at current or lower levels. CPS proposes to have an additional 150 MW of renewable energy capacity by 2012.31
Emission Reduction Estimates due to Wind PowerIn the following table we have estimated the emissions reductions due to the use of wind power produced by the Desert Sky facility.
First, the 2002 and 2003 electricity consumption levels by CPS customers are compared and the 2007 consumption levels are forecasted. Given the corresponding levels of NOx and VOC produced agency wide by CPS power production facilities, a correlation is developed between power consumed by CPS customers and emissions produced by CPS facilities.
Given also the historical and forecast supply of electricity produced by wind power, if the electricity produced by wind supplants the electricity produced by traditional non-renewable CPS power production facilities, then the corresponding reduction in fuel
26 Source: An Assessment of the Available Windy Land Area and Wind Energy Potential in the Contiguous United States, Pacific Northwest Laboratory, August 1991. PNL-7789, as quoted online: http://www.awea.org/faq/tutorial/wwt_potential.html - How%20much%20energy27 American Wind Energy Association, available online: http://www.awea.org/projects/texas.html28 Pacific Northwest Laboratory homepage: http://www.pnl.gov/29 The Wind Energy Resource Atlas of the Unites States, available online: http://rredc.nrel.gov/wind/pubs/atlas/30 Desert Sky Wind Farm: http://www.desertskywind.com/31 http://www.citypublicservice.com/energyplan/faq/seven.asp
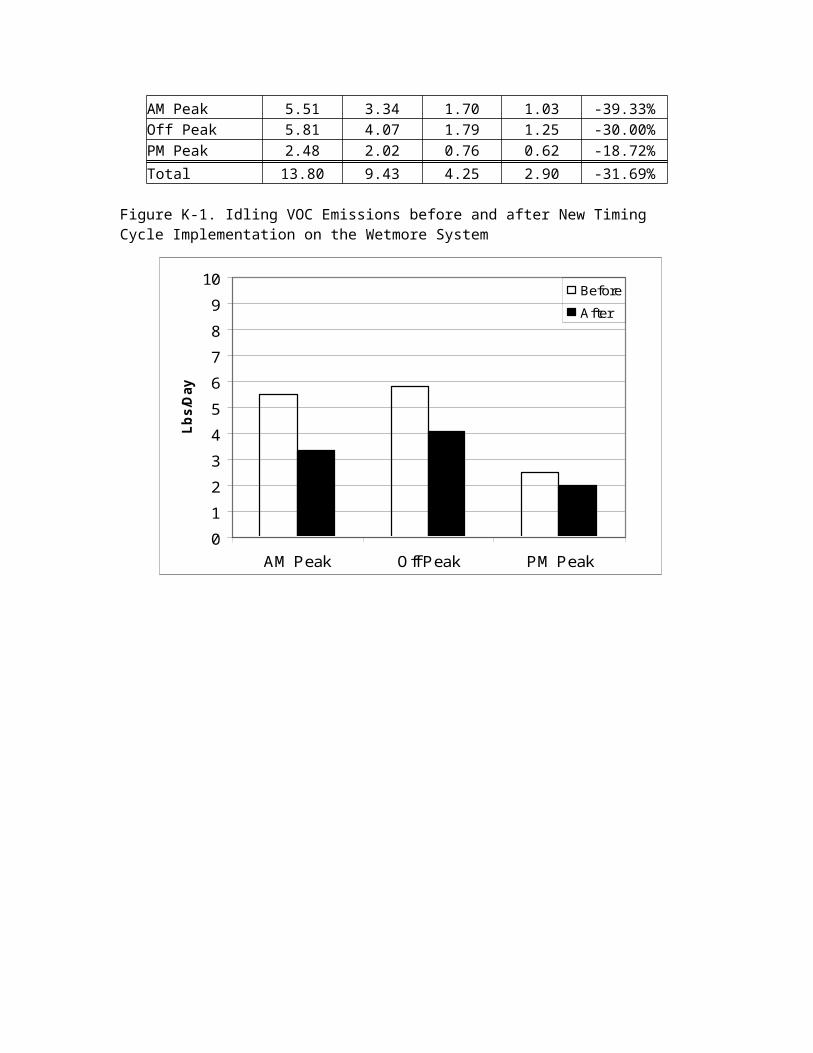
consumed by traditional power production represents a net reduction in traditional emissions as well. It is this hypothetical reduction which is calculated here.
Sample Calculation: In 2002, the total electrical consumption by CPS customers was 14,705 gigawatthours (GWh), and CPS estimates that, system-wide, their facilities produced about 11,855 tons of NOx in 2002, which averages out to 1612.4 lbs. NOx per GWh. During 2002, Desert Sky produced about 352 GWh yearly. Supposing the electricity produced by Desert Sky supplanted the electricity produced by traditional non-renewable CPS power production facilities, then 352 GWh x 1,612.4 lbs. NOx / GWh represents a yearly savings of 567,564.8 lbs. or 283.78 tons of NOx in 2002.
Overall for the year 2007, emissions of 1.51 tons of NOx and 0.03 ton of VOC are forecast to be avoided on a daily basis.
Impacts of Wind-generated Electricity on Ozone Precursors in Bexar County
Annual Consumption (GWH) / Year
Wind Power Energy
Production (GWH) / Year
PollutantTotal Yearly
Emission Pound
Pound Emission per GWh
Yearlylbs
Avoided
Yearly Ton
Avoided
DailyTon
Avoided
Year 200214,705 352 / 2002
NOx 23,710,000 1612.4 567,557 284 0.78
VOC 352,000 23.9 8,426 4 0.01
Year 200313,478 376 / 2003
NOx 22,252,000 1650.99 620,771 310 0.85
VOC 380,000 28.2 10,601 5 0.01
Year 200715,568 764 / 2007
NOx 22,400,000 1438.8 1,099,281 550 1.51
VOC 380,000 24.4 18,649 9 0.03
The Texas Emissions Reduction Plan (TERP)
“The Texas Emissions Reduction Plan (TERP) is a comprehensive set of incentive programs aimed at improving air quality in Texas. The Texas Commission on Environmental Quality (TCEQ) administers TERP grants and other financial TERP incentives. The Legislature established the TERP in 2001. TERP includes a number of voluntary financial incentive programs, as well as other assistance programs, to help improve the air quality in Texas.
The goals of the TERP, as set forth in SB5, are to: Assure that the air in this state is safe to breathe and meets minimum federal
standards established under the Federal Clean Air Act (42 U.S.C. Section 7407); Develop multi-pollutant approaches to solving the state's environmental
problems; and Adequately fund research and development that will make the state a leader in
new technologies that can solve the state's environmental problems while creating new business and industry in the state.”
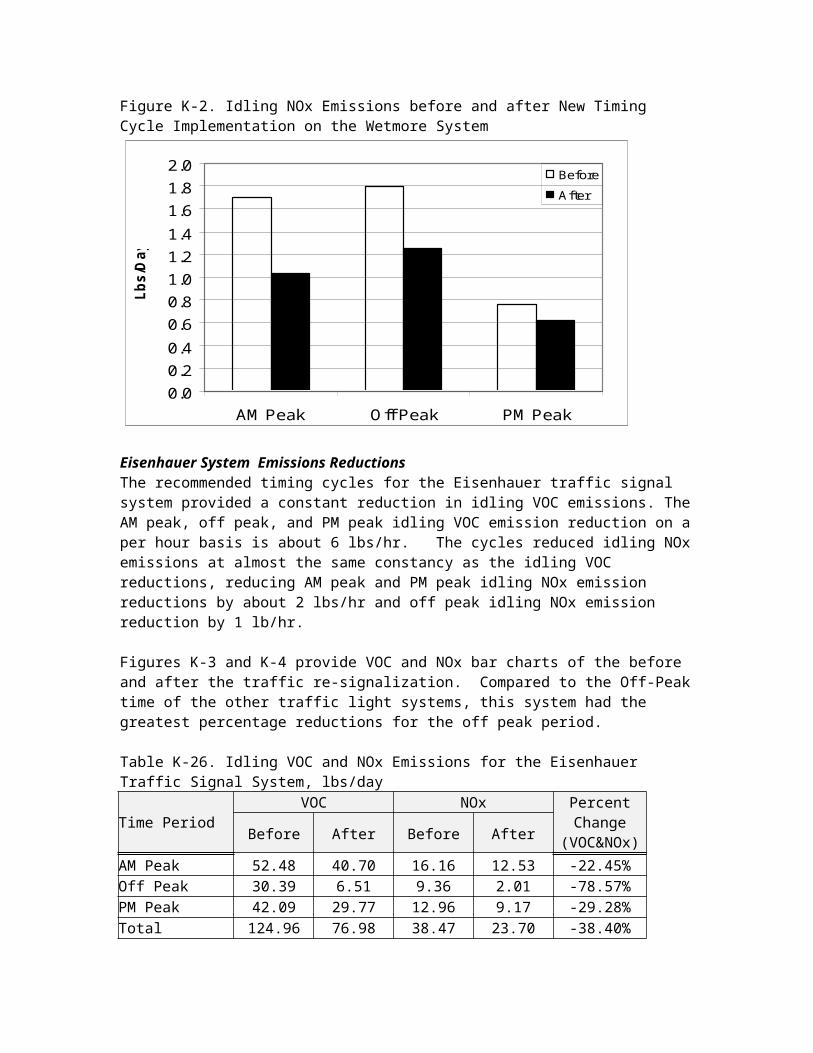
Funding for TERP projects for the San Antonio region was first available during the 1st round of FY 2004 grants. There are two major local grants for which contracts are signed: one for the public utility of San Antonio, City Public Service (CPS) and one for the city’s public transportation service, VIA Metropolitan Transit. In total, 0.47 tons per day is available under contracts signed for FY 2004 Round 1 grants.“Incentive funding was also expected to be available to help achieve reductions in counties located in the other two non-attainment areas (Beaumont-Port Arthur Area and El Paso County) and in designated near non-attainment areas, where air quality is approaching non-attainment levels.”
According to the TCEQ’s calculations about 0.47 tons per day for at least the five years of the grant period, through 2007 at least, are available under signed contract. Given that there is a debate about continuing the TERP program funding, claiming local SIP credit for local TERP projects across Texas may help the TCEQ Commissioners justify continuance of the TERP program to the Legislature. Claiming local SIP credit for TERP projects in the San Antonio Clean Air Plan should aid TCEQ in prioritizing future funding needs.
During the June 23, 2004, meeting of the Air Improvement Resources Executive Committee, the committee formally resolved the following, in a letter signed by the Chair and Vice Chair and addressed to TCEQ Chairman White:
Due to the aggressive promotion of the TERP grants available to our region for just this one cycle and the two accompanying workshops held at the Alamo Area Council of Governments with TCEQ's partnership, some 0.47 ton per day in NOx reduction should be available to our region in 2007. This is the total reduction secured for our region through signed contracts from the FY 2004 1st round.
We understand that the FY 2004 2nd round of these TERP grants is now being finalized. As with so many other federal, and state, level clean air quality planning efforts, we continue to benefit from these TERP related efforts.
We wish to see the TERP program continue beyond the current expiration date (2008) for funding given in HB 1365. Hence, we would request that the TCEQ seek approval for an extension of the program past this date. By maximizing the TERP funding available to our region we can pursue these reductions on behalf of both the state and our region.
The signatories to the San Antonio regional Early Action Compact intend to pursue TERP grants and to work with other public and private sector entities operating in the region to pursue grants that will result in total NOx reductions of at least 2 tons per day. This is a commitment by us which is aided by the 0.47 ton per day given by the existing FY 2004 1st round signed contracts.