Embed Size (px)
Citation preview
Designing SQL Server 2005 Analysis Services Cubes for Excel 2007 PivotTablesApplies to Microsoft® Office Excel® 2007 and Microsoft SQL Server™ 2005 Analysis Services
April 2007
Allan FoltingProgram ManagerMicrosoft Office Excel

Contents
Introduction................................................................................................................3Excel 2007 PivotTables................................................................................................4Measure Groups..........................................................................................................5Display Folders.........................................................................................................11
Attribute Hierarchy Display Folders...............................................................................................11User Hierarchy Display Folders......................................................................................................13Measure Display Folders...............................................................................................................14Named Sets and Calculated Measure Display Folders...................................................................16KPI Display Folders........................................................................................................................19Multilevel Display Folders..............................................................................................................21Adding an Entity in Multiple Display Folders..................................................................................23Adding Attribute Hierarchies to the Root Dimension Folder..........................................................24
Named Sets...............................................................................................................26Perspectives.............................................................................................................28Time Dimensions.......................................................................................................30
Placing Time Information in Columns............................................................................................30Exposing Date-Specific Filtering Options.......................................................................................31
Member Properties....................................................................................................35Member Properties in Tooltips.......................................................................................................37Member Properties in the Report...................................................................................................40Filtering by Member Properties.....................................................................................................43Actions.......................................................................................................................................... 43
Measure Formatting..................................................................................................47Currency Formatting.....................................................................................................................51
Key Performance Indicators.......................................................................................53Calculated Members..................................................................................................56Translations..............................................................................................................57Conclusion................................................................................................................62Related Links............................................................................................................63
www.microsoft.com/office© 2007 Microsoft Corporation. All rights reserved. Page 2By using or providing feedback on these materials, you agree to the attached license agreement.To comment on this paper or request more documentation on these developer features, contact us at [email protected]. We look forward to hearing from you.
Introduction
Microsoft® Office Excel® 2007 takes advantage of most of the features in Microsoft SQL Server™ 2005 Analysis Services. To take full advantage of these features, it is important to consider the end-user experience in Office Excel 2007 when you are designing cubes. This document outlines how to make the end-user experience great by optimizing the cube design for Office Excel 2007 PivotTable® dynamic views.
Note that the features described in this document are applicable not only to SQL Server 2005 Analysis Services cubes; Excel exposes the features described with any OLAP (online analytical processing) server that supports the required functionality.
www.microsoft.com/office© 2007 Microsoft Corporation. All rights reserved. Page 3By using or providing feedback on these materials, you agree to the attached license agreement.To comment on this paper or request more documentation on these developer features, contact us at [email protected]. We look forward to hearing from you.
Excel 2007 PivotTables
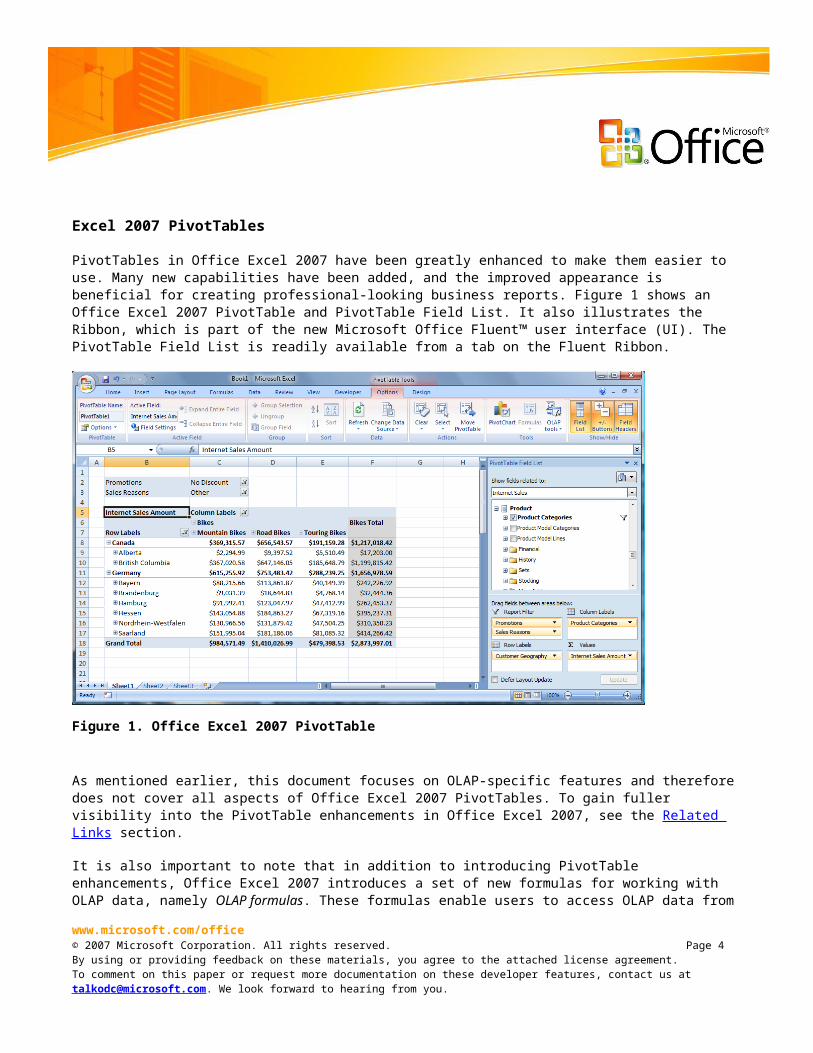
PivotTables in Office Excel 2007 have been greatly enhanced to make them easier to use. Many new capabilities have been added, and the improved appearance is beneficial for creating professional-looking business reports. Figure 1 shows an Office Excel 2007 PivotTable and PivotTable Field List. It also illustrates the Ribbon, which is part of the new Microsoft Office Fluent™ user interface (UI). The PivotTable Field List is readily available from a tab on the Fluent Ribbon.
Figure 1. Office Excel 2007 PivotTable
As mentioned earlier, this document focuses on OLAP-specific features and therefore does not cover all aspects of Office Excel 2007 PivotTables. To gain fuller visibility into the PivotTable enhancements in Office Excel 2007, see the Related Links section.
It is also important to note that in addition to introducing PivotTable enhancements, Office Excel 2007 introduces a set of new formulas for working with OLAP data, namely OLAP formulas. These formulas enable users to access OLAP data from a server on a per-cell basis, so that any report layout can be produced. Also, other Excel formulas can then be added inside such reports to fully benefit from the capabilities of Excel in reports based on OLAP data.
www.microsoft.com/office© 2007 Microsoft Corporation. All rights reserved. Page 4By using or providing feedback on these materials, you agree to the attached license agreement.To comment on this paper or request more documentation on these developer features, contact us at [email protected]. We look forward to hearing from you.
The following sections cover different aspects and features of SQL Server 2005 Analysis Services and outline how to take advantage of them when you are using Office Excel 2007 PivotTables for analysis and reporting.
Measure Groups
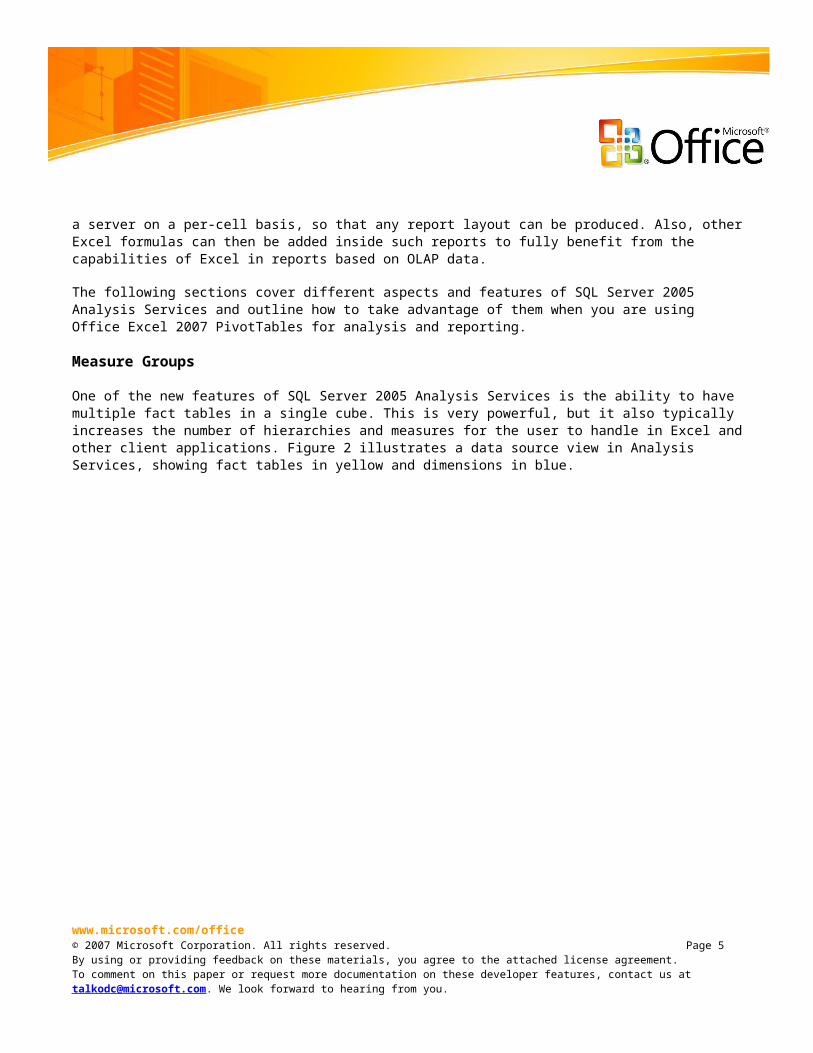
One of the new features of SQL Server 2005 Analysis Services is the ability to have multiple fact tables in a single cube. This is very powerful, but it also typically increases the number of hierarchies and measures for the user to handle in Excel and other client applications. Figure 2 illustrates a data source view in Analysis Services, showing fact tables in yellow and dimensions in blue.
Figure 2. Data Source View in Analysis Services
www.microsoft.com/office© 2007 Microsoft Corporation. All rights reserved. Page 5By using or providing feedback on these materials, you agree to the attached license agreement.To comment on this paper or request more documentation on these developer features, contact us at [email protected]. We look forward to hearing from you.
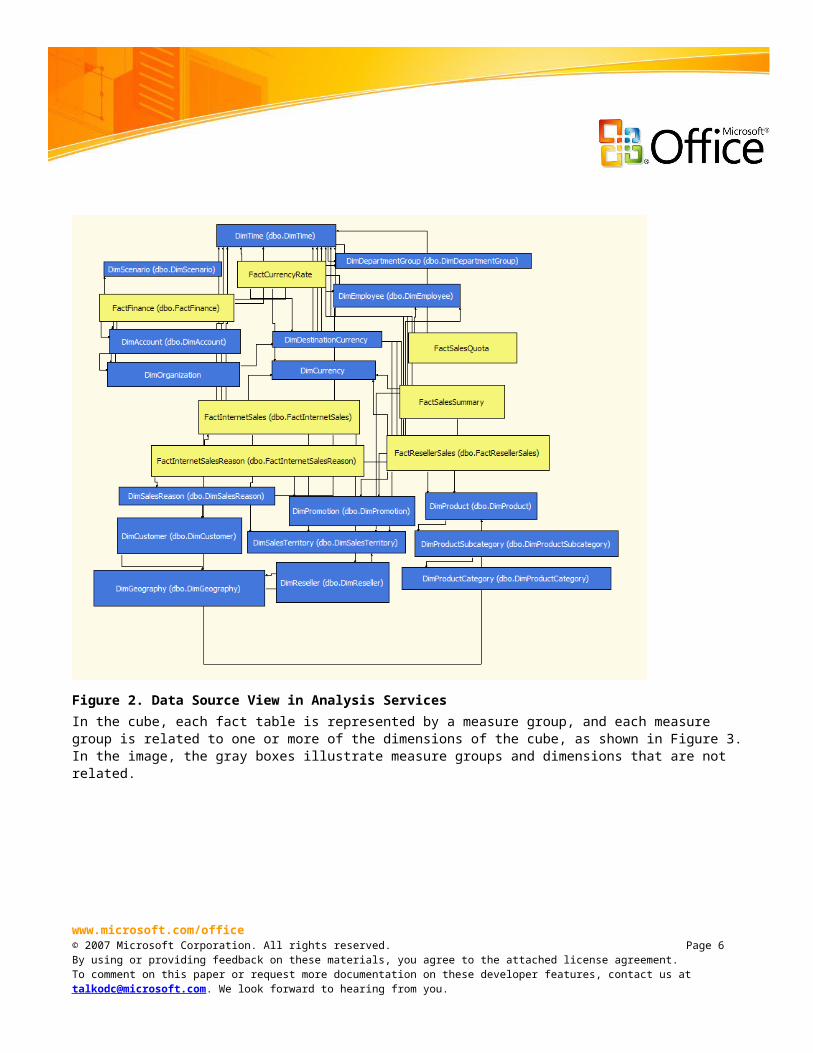
In the cube, each fact table is represented by a measure group, and each measure group is related to one or more of the dimensions of the cube, as shown in Figure 3. In the image, the gray boxes illustrate measure groups and dimensions that are not related.
Figure 3. Measure groups and dimensions
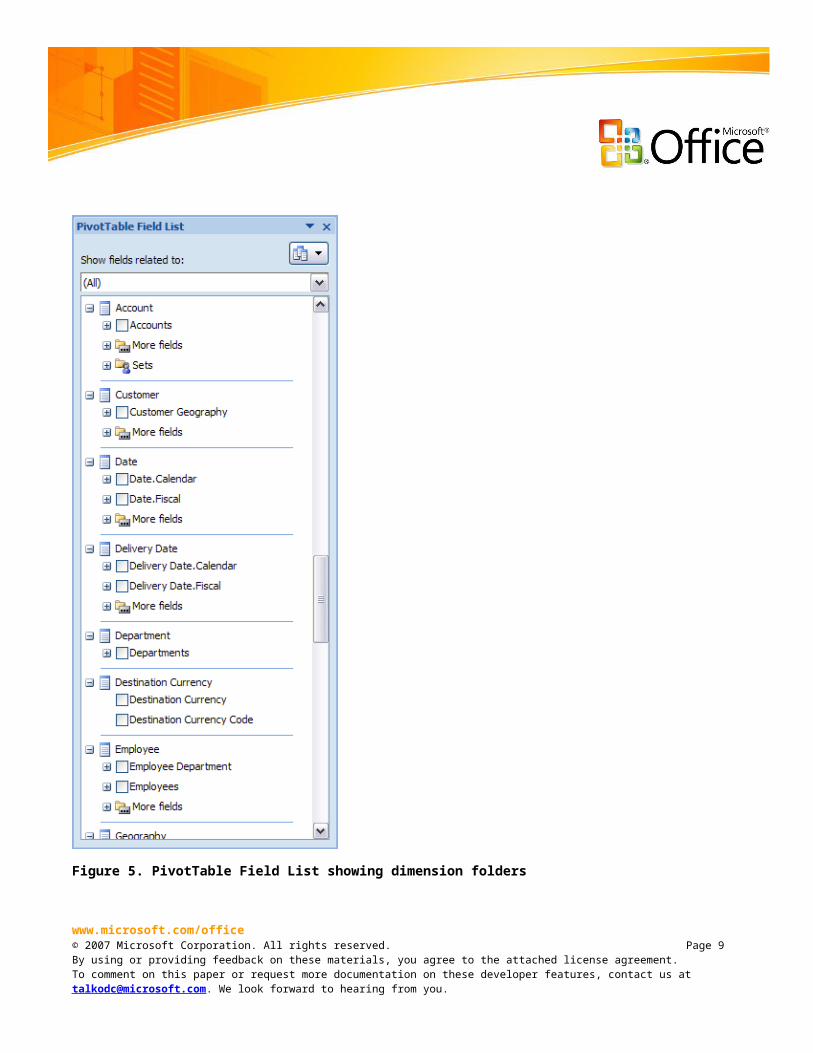
When you are connecting to the cube from Excel, the PivotTable Field List shows all the measure groups and dimensions automatically. There is a folder for each measure group and a folder for each dimension (see Figures 4 and 5), which makes it easier to find related information.
www.microsoft.com/office© 2007 Microsoft Corporation. All rights reserved. Page 6By using or providing feedback on these materials, you agree to the attached license agreement.To comment on this paper or request more documentation on these developer features, contact us at [email protected]. We look forward to hearing from you.
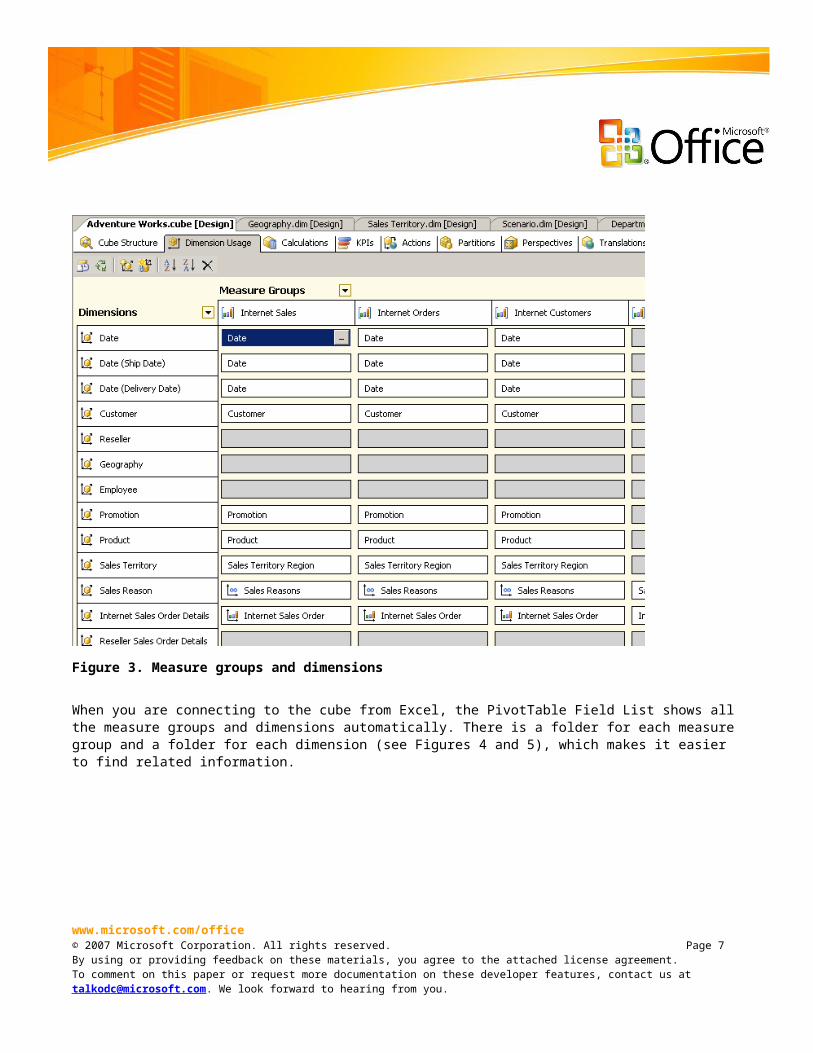
Figure 4. PivotTable Field List showing measure group folders
www.microsoft.com/office© 2007 Microsoft Corporation. All rights reserved. Page 7By using or providing feedback on these materials, you agree to the attached license agreement.To comment on this paper or request more documentation on these developer features, contact us at [email protected]. We look forward to hearing from you.
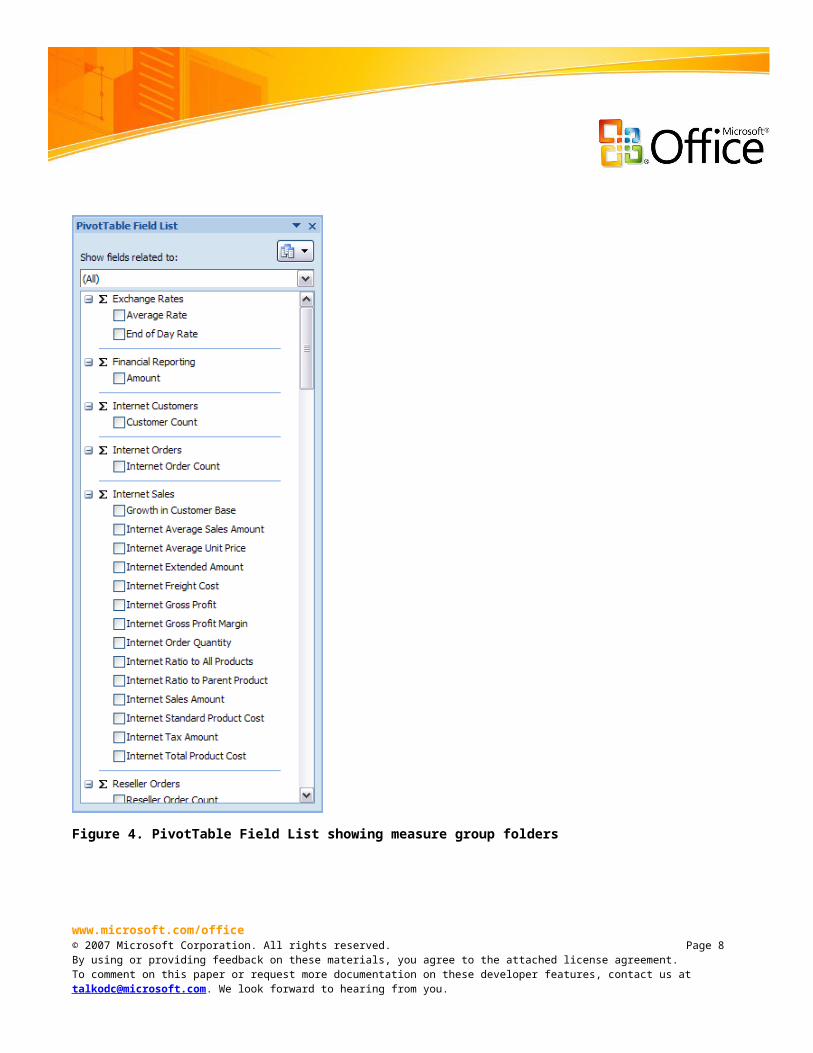
Figure 5. PivotTable Field List showing dimension folders
www.microsoft.com/office© 2007 Microsoft Corporation. All rights reserved. Page 8By using or providing feedback on these materials, you agree to the attached license agreement.To comment on this paper or request more documentation on these developer features, contact us at [email protected]. We look forward to hearing from you.
At the top of the PivotTable Field List there is a drop-down list of all the measure groups in the cube, as shown in Figure 6. When this drop-down list is set to (All), the PivotTable Field List shows all measure groups and all dimensions of the cube.
Figure 6. PivotTable Field List with measure group drop-down list
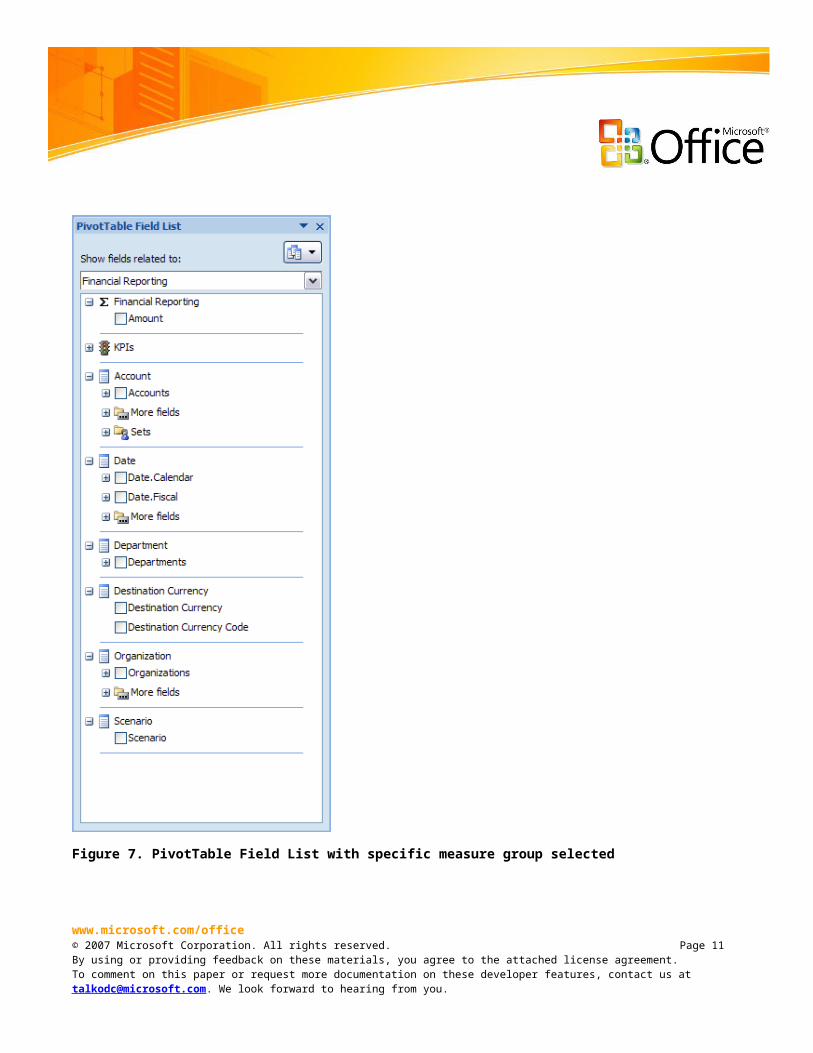
When the drop-down list is set to a specific measure group, as shown in Figure 7, only that measure group is displayed in the PivotTable Field List, and the PivotTable Field List only shows dimensions related to the selected measure group. This enables users to focus on specific areas of interest when they are analyzing data and makes it much easier to find relevant information.
www.microsoft.com/office© 2007 Microsoft Corporation. All rights reserved. Page 9By using or providing feedback on these materials, you agree to the attached license agreement.To comment on this paper or request more documentation on these developer features, contact us at [email protected]. We look forward to hearing from you.
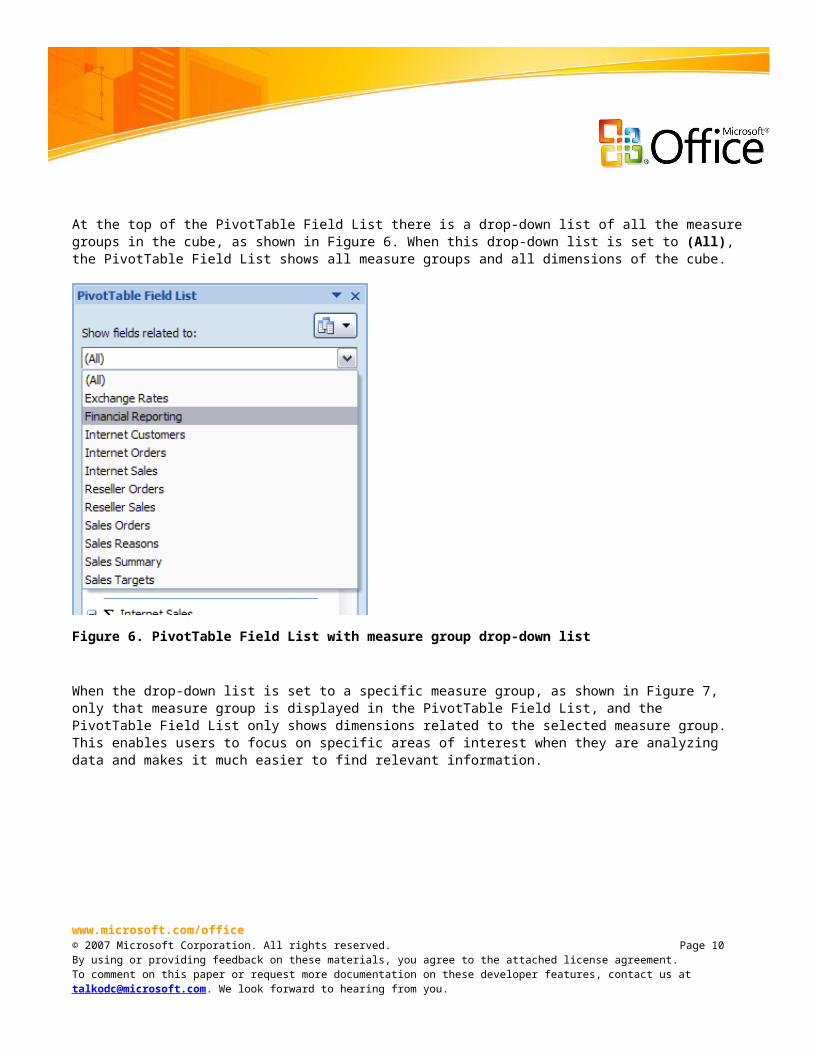
Figure 7. PivotTable Field List with specific measure group selected
www.microsoft.com/office© 2007 Microsoft Corporation. All rights reserved. Page 10By using or providing feedback on these materials, you agree to the attached license agreement.To comment on this paper or request more documentation on these developer features, contact us at [email protected]. We look forward to hearing from you.
Display Folders
To present cube information in a user-friendly way that corresponds to business areas, Analysis Services lets you define folders that client applications can expose when presenting the content of the cube. The PivotTable reads the display folder information from the server, and the information is exposed in the PivotTable Field List.
In Analysis Services, you can set display folders for the following entities:
Attribute hierarchies User hierarchies Measures Calculated measures Named sets Key performance indicators (KPIs)
For each of these entities, you can set the display folder property in Business Intelligence Development Studio, the development environment for SQL Server Analysis Services, SQL Server Integration Services, and SQL Server Reporting Services projects. The PivotTable Field List will then include these folders as illustrated in the following examples.
Attribute Hierarchy Display FoldersWhen no display folders are defined, attribute hierarchies are put into a special More Fields folder under the dimension folder to which the hierarchies belong. To show an attribute hierarchy in a display folder instead, open the Properties pane for the hierarchy and type the name of the display folder in the AttributeHierarchyDisplayFolder box.
Note If a dimension has no user hierarchies, only attribute hierarchies, the special More Fields folder is not present for that dimension.
In Figure 8, a display folder named Stocking is defined for the Color attribute hierarchy.
www.microsoft.com/office© 2007 Microsoft Corporation. All rights reserved. Page 11By using or providing feedback on these materials, you agree to the attached license agreement.To comment on this paper or request more documentation on these developer features, contact us at [email protected]. We look forward to hearing from you.
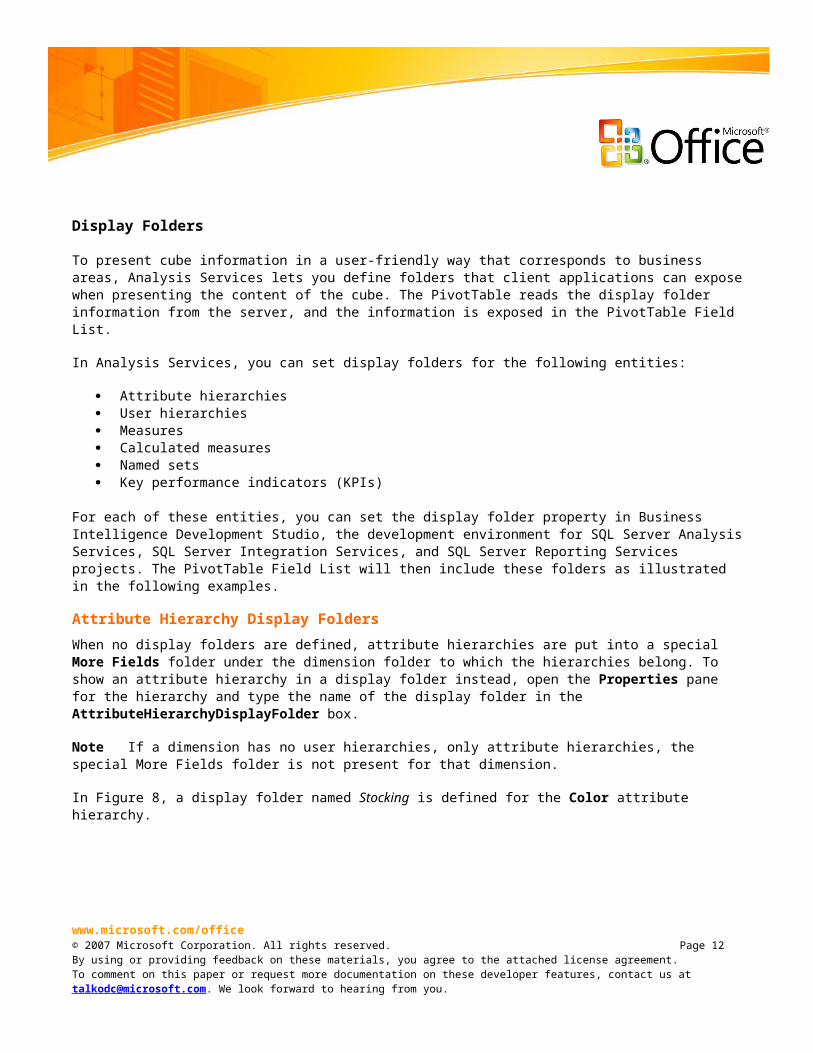
Figure 8. Setting display folder for an attribute hierarchy
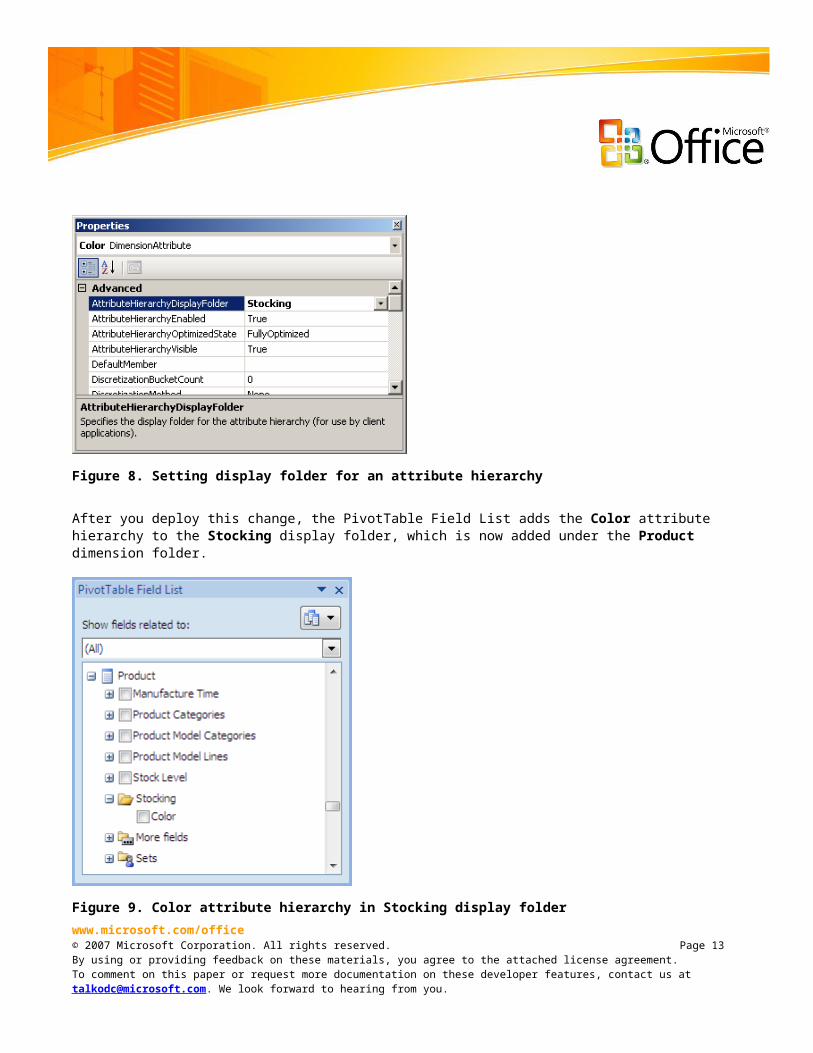
After you deploy this change, the PivotTable Field List adds the Color attribute hierarchy to the Stocking display folder, which is now added under the Product dimension folder.
Figure 9. Color attribute hierarchy in Stocking display folder
www.microsoft.com/office© 2007 Microsoft Corporation. All rights reserved. Page 12By using or providing feedback on these materials, you agree to the attached license agreement.To comment on this paper or request more documentation on these developer features, contact us at [email protected]. We look forward to hearing from you.
User Hierarchy Display FoldersWhen display folders are not defined, user hierarchies are added directly under the dimension folder they belong to. To put user hierarchies into a display folder instead, open the Properties pane for each user hierarchy and type the name of a display folder in the DisplayFolder property box.
In Figure 10, the Manufacture Time user hierarchy is placed in a display folder named Stocking.
Figure 10. Setting display folder for a user hierarchy
The display folder is now visible in the PivotTable Field List where the Manufacture Time hierarchy is added in the Stocking folder under the Product dimension folder.
www.microsoft.com/office© 2007 Microsoft Corporation. All rights reserved. Page 13By using or providing feedback on these materials, you agree to the attached license agreement.To comment on this paper or request more documentation on these developer features, contact us at [email protected]. We look forward to hearing from you.
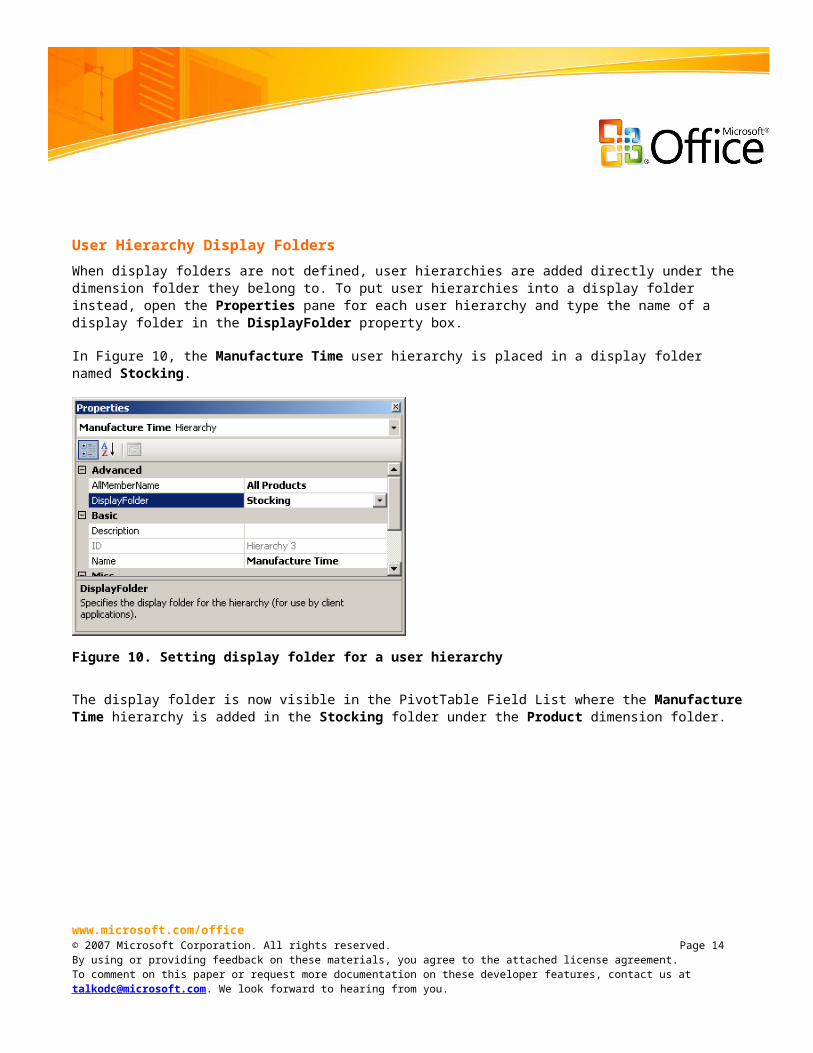
Figure 11. Manufacture Time user hierarchy in Stocking display folder
Measure Display FoldersIf display folders are defined for measures in the cube, the PivotTable Field List adds these folders under the corresponding measure group folder and puts the measures there.
In the following example, the Internet Sales Amount measure has a display folder named Sales. Figure 12 illustrates how to set the display folder by using the Properties pane for the Internet Sales Amount measure in Business Intelligence Development Studio.
www.microsoft.com/office© 2007 Microsoft Corporation. All rights reserved. Page 14By using or providing feedback on these materials, you agree to the attached license agreement.To comment on this paper or request more documentation on these developer features, contact us at [email protected]. We look forward to hearing from you.
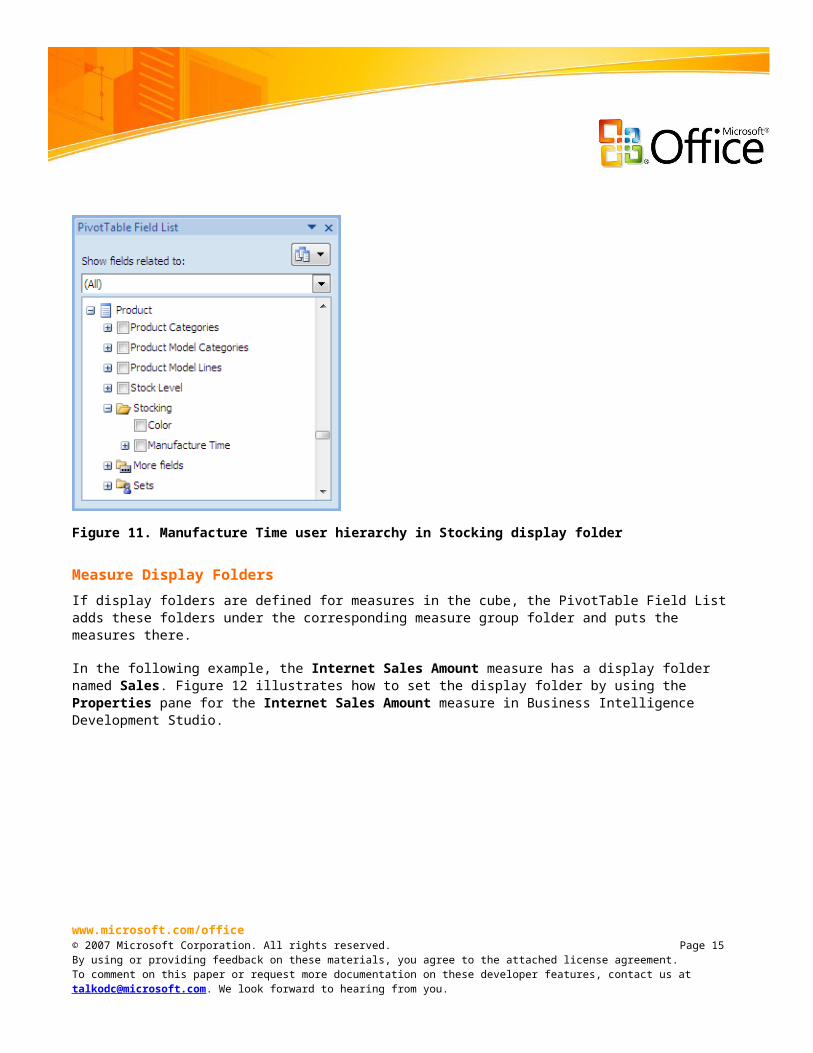
Figure 12. Setting display folder for a measure
Figure 13 shows the effect on the PivotTable Field List where the Internet Sales Amount measure is listed in the Sales folder under the Internet Sales measure group folder.
www.microsoft.com/office© 2007 Microsoft Corporation. All rights reserved. Page 15By using or providing feedback on these materials, you agree to the attached license agreement.To comment on this paper or request more documentation on these developer features, contact us at [email protected]. We look forward to hearing from you.
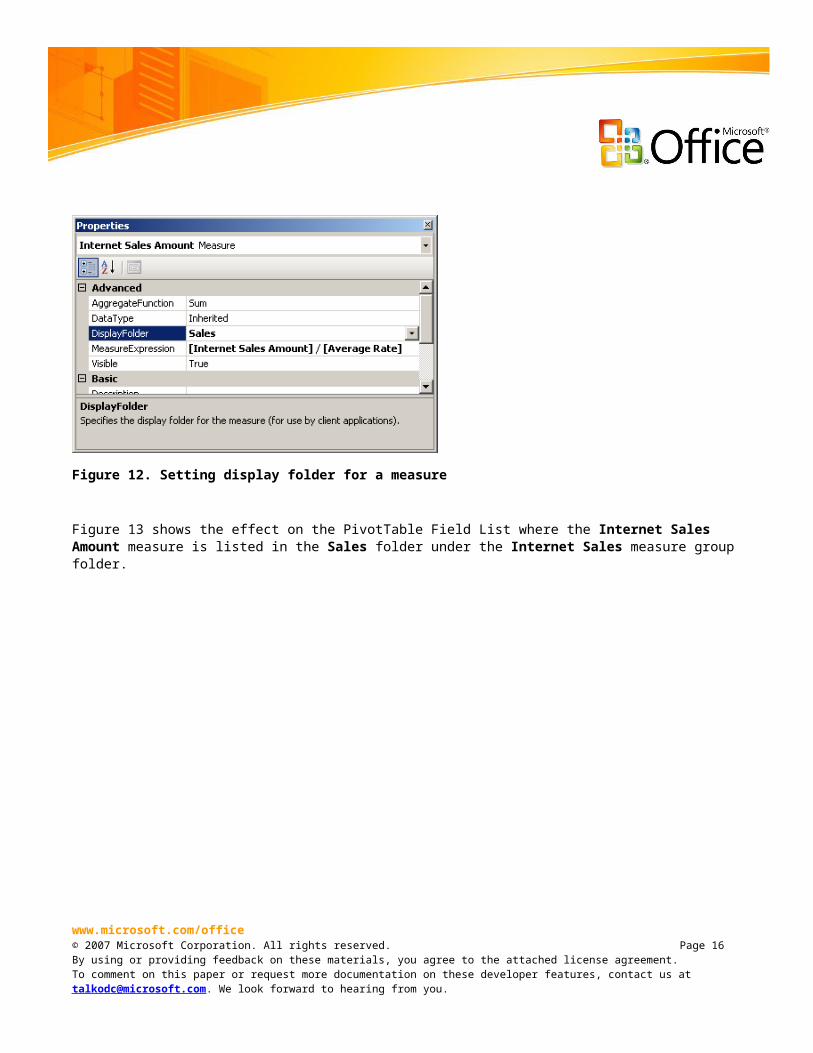
Figure 13. Internet Sales Amount measure in Sales display folder
Named Sets and Calculated Measure Display FoldersYou can set display folders for named sets and calculated measures by clicking the Calculation Properties button on the Calculations tab in Business Intelligence Development Studio. This opens the Calculation Properties dialog box, which includes a Display Folder column.
In Figure 14, the two named sets, Long Lead Products and Core Product Group, are put into the same display folder, Special Products. The calculated measure, Internet Average Sales Amount, is put into the display folder Sales.
www.microsoft.com/office© 2007 Microsoft Corporation. All rights reserved. Page 16By using or providing feedback on these materials, you agree to the attached license agreement.To comment on this paper or request more documentation on these developer features, contact us at [email protected]. We look forward to hearing from you.
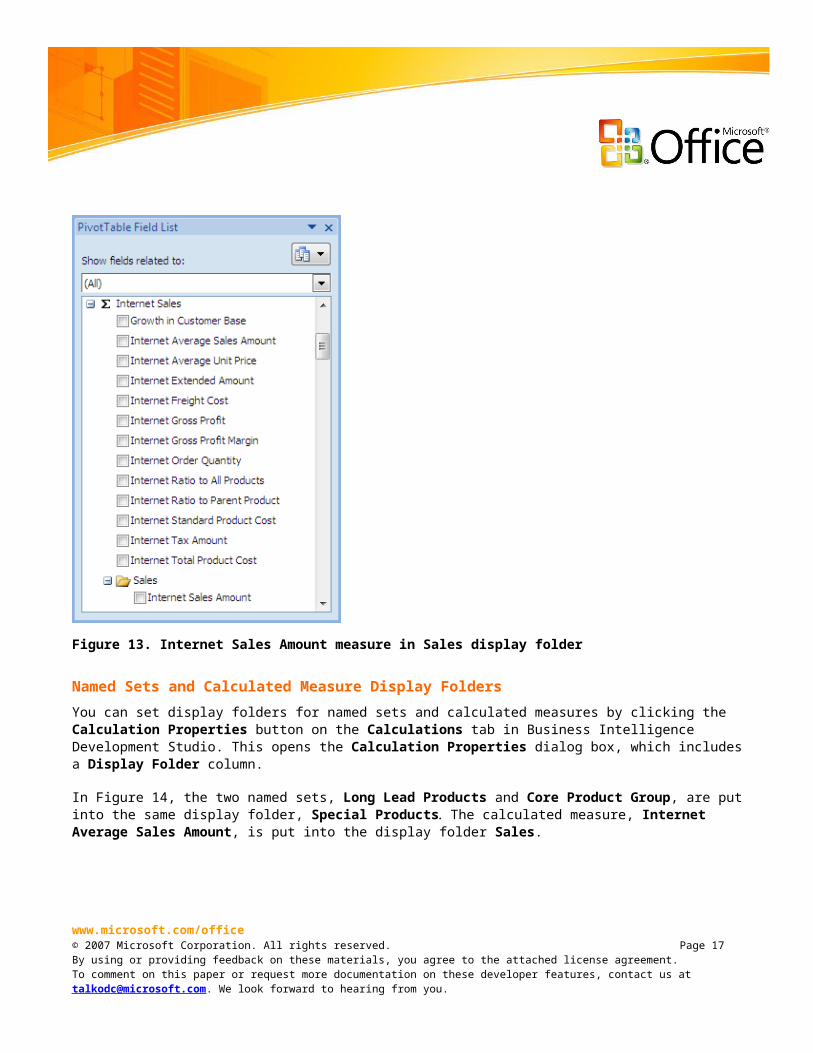
Figure 14. Setting display folders for calculated measures and named sets
When you are creating a PivotTable based on this cube, the display folders are added to the PivotTable Field List as illustrated in Figures 15 and 16.
www.microsoft.com/office© 2007 Microsoft Corporation. All rights reserved. Page 17By using or providing feedback on these materials, you agree to the attached license agreement.To comment on this paper or request more documentation on these developer features, contact us at [email protected]. We look forward to hearing from you.
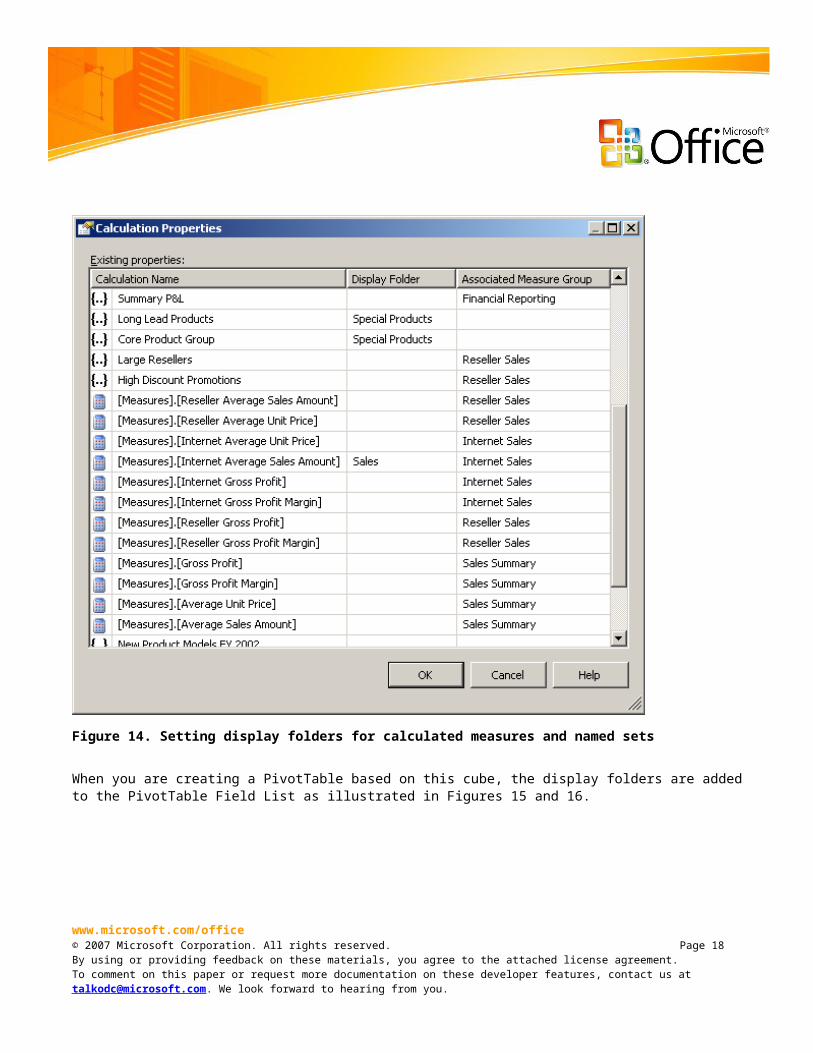
Figure 15. Named sets in Special Products display folder
www.microsoft.com/office© 2007 Microsoft Corporation. All rights reserved. Page 18By using or providing feedback on these materials, you agree to the attached license agreement.To comment on this paper or request more documentation on these developer features, contact us at [email protected]. We look forward to hearing from you.
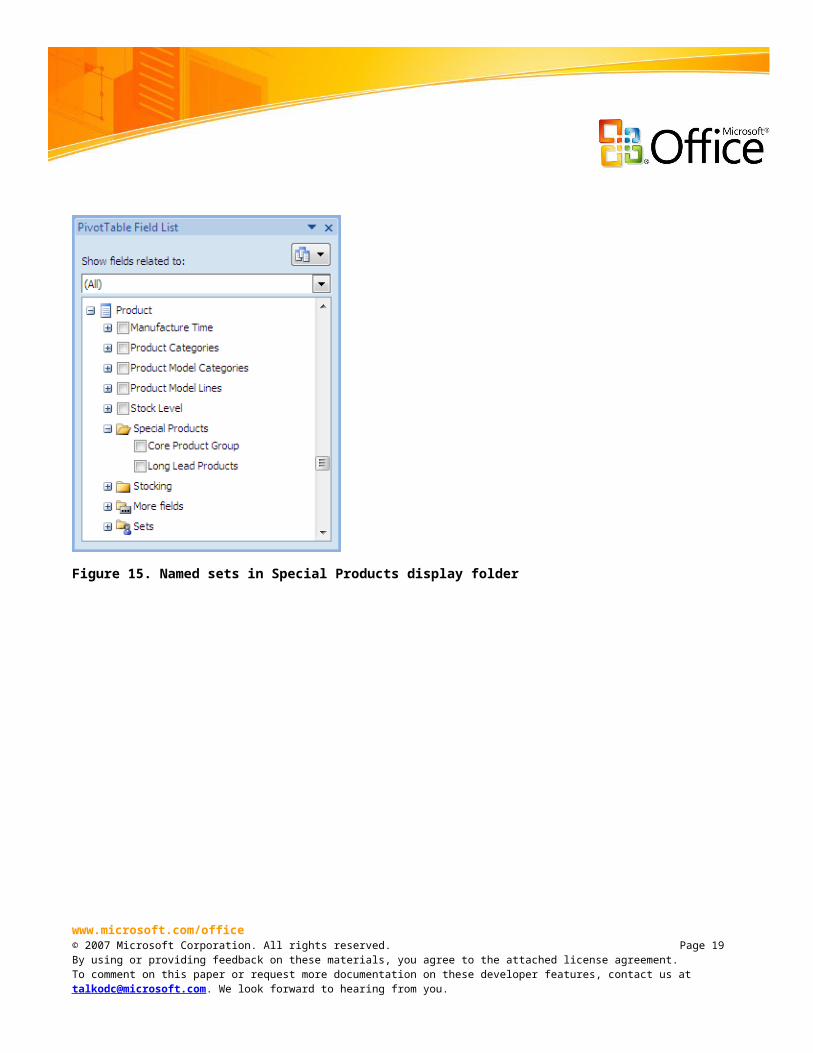
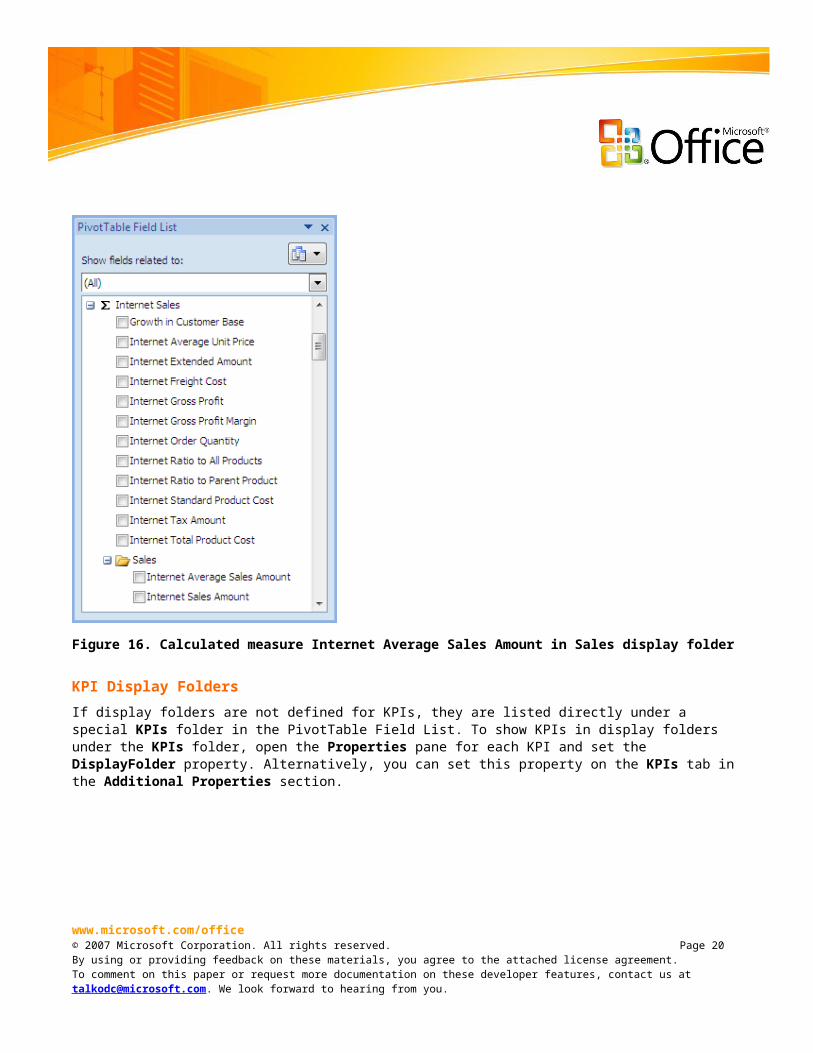
Figure 16. Calculated measure Internet Average Sales Amount in Sales display folder
KPI Display FoldersIf display folders are not defined for KPIs, they are listed directly under a special KPIs folder in the PivotTable Field List. To show KPIs in display folders under the KPIs folder, open the Properties pane for each KPI and set the DisplayFolder property. Alternatively, you can set this property on the KPIs tab in the Additional Properties section.
www.microsoft.com/office© 2007 Microsoft Corporation. All rights reserved. Page 19By using or providing feedback on these materials, you agree to the attached license agreement.To comment on this paper or request more documentation on these developer features, contact us at [email protected]. We look forward to hearing from you.
In Figure 17, the display folder property for the Growth in Customer Base KPI is set to \Customer Perspective\Expand Customer Base.
Figure 17. Setting display folder for a KPI
Note that in this example, the display folder was defined to include two levels of folders. The next section covers multilevel display folders.
The PivotTable Field List now adds the Customer Perspective folder under the KPIs folder, and the Expand Customer Base folder under the Customer Perspective folder. The Growth in Customer Base KPI is then added under the Expand Customer Base folder, as shown in Figure 18.
www.microsoft.com/office© 2007 Microsoft Corporation. All rights reserved. Page 20By using or providing feedback on these materials, you agree to the attached license agreement.To comment on this paper or request more documentation on these developer features, contact us at [email protected]. We look forward to hearing from you.
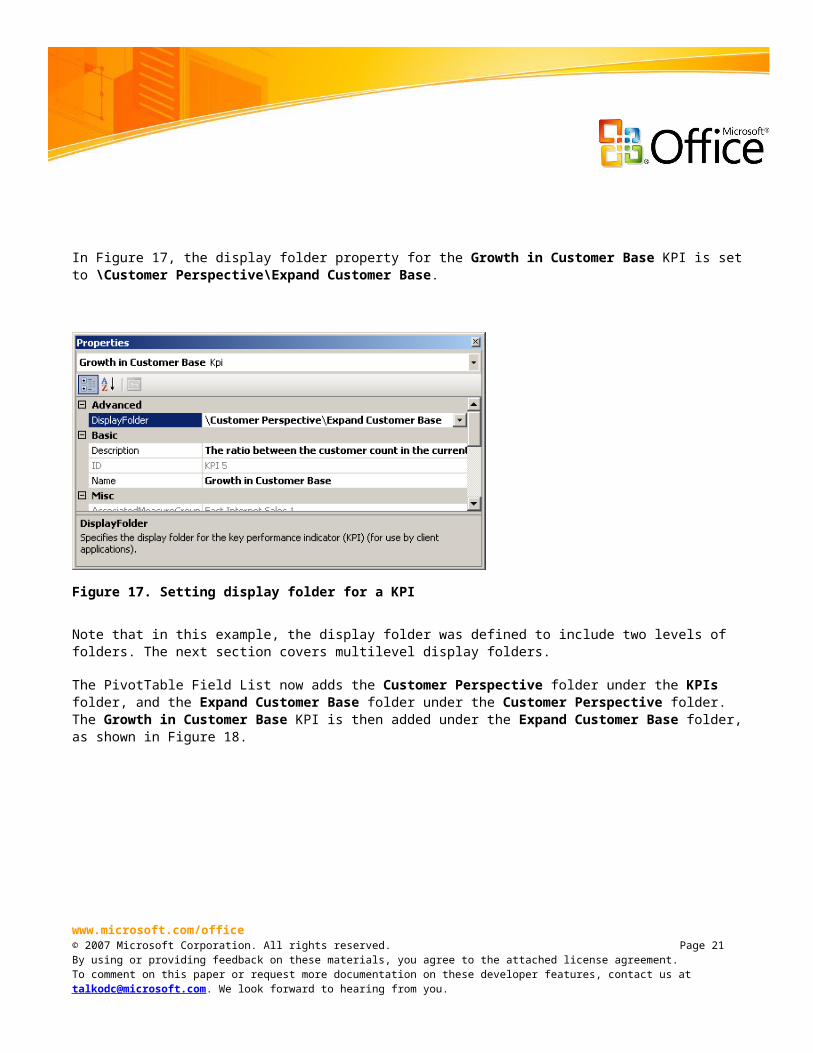
Figure 18. Growth in Customer Base KPI listed in a multilevel display folder
Multilevel Display FoldersAs illustrated in Figure 17, using a backslash (\) in the display folder definition enables you to create multilevel display folders. You can use this approach for all entities, not only KPIs.
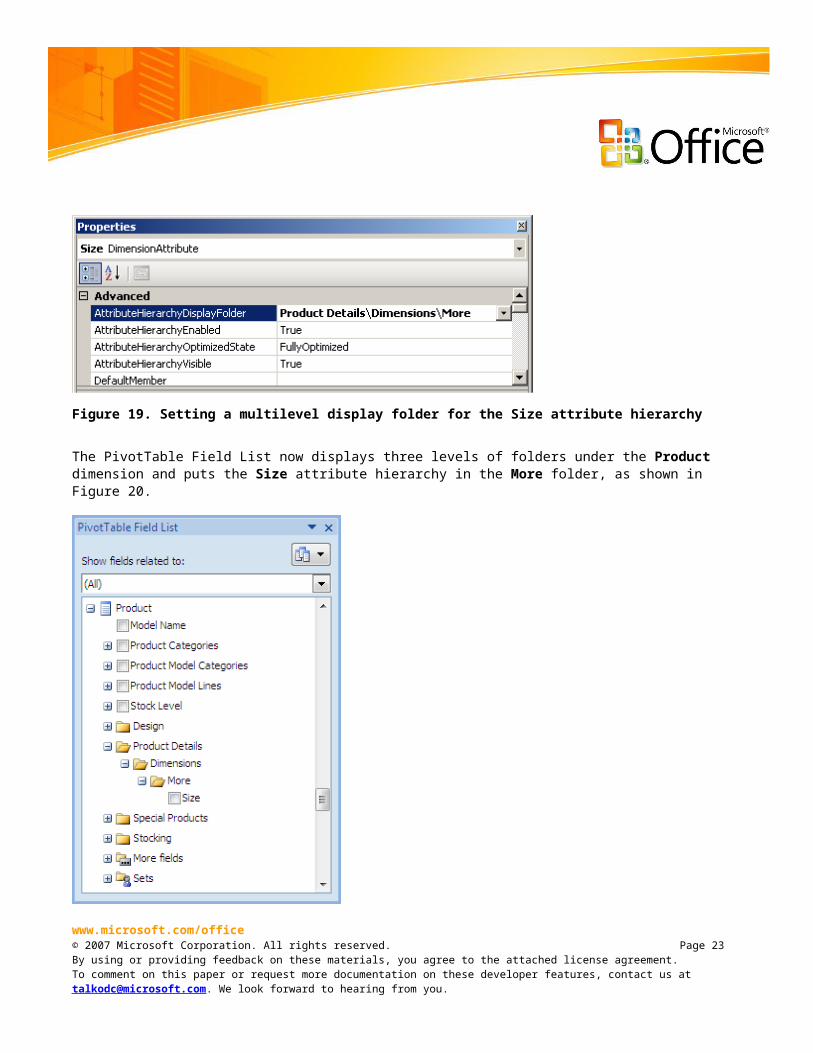
When you are setting the display folder property, add a backslash to separate each folder level that you need. In Figure 19, the Size attribute hierarchy is added under three levels of folders. You do this by setting the AttributeHierarchyDisplayFolder property to Product Details\Dimensions\More.
www.microsoft.com/office© 2007 Microsoft Corporation. All rights reserved. Page 21By using or providing feedback on these materials, you agree to the attached license agreement.To comment on this paper or request more documentation on these developer features, contact us at [email protected]. We look forward to hearing from you.
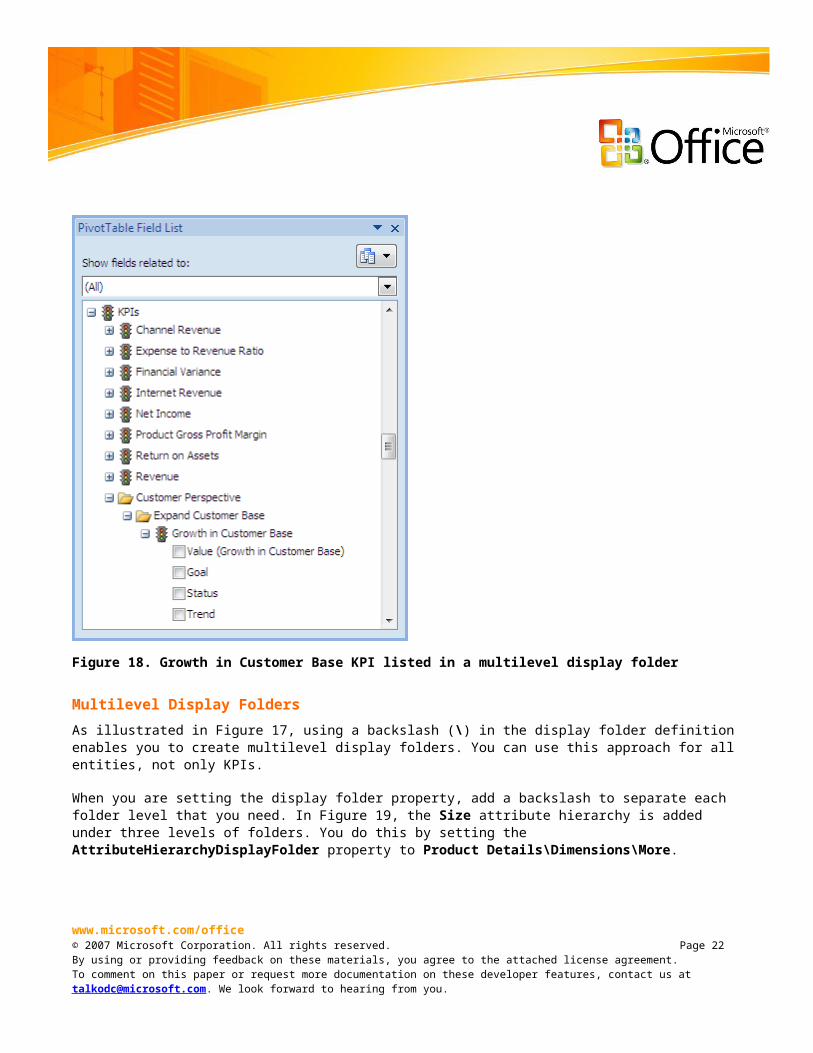
Figure 19. Setting a multilevel display folder for the Size attribute hierarchy
The PivotTable Field List now displays three levels of folders under the Product dimension and puts the Size attribute hierarchy in the More folder, as shown in Figure 20.
Figure 20. Size attribute hierarchy in third-level display folder
www.microsoft.com/office© 2007 Microsoft Corporation. All rights reserved. Page 22By using or providing feedback on these materials, you agree to the attached license agreement.To comment on this paper or request more documentation on these developer features, contact us at [email protected]. We look forward to hearing from you.
Adding an Entity in Multiple Display FoldersYou can add the same entity to multiple display folders. To do this, add a semicolon (;) between each display folder name.
Figure 21 shows how to add the Color attribute hierarchy to two display folders, Stocking and Design, at the same time. In Figure 21, the AttributeHierarchyDisplayFolder property is set to Stocking;Design.
Figure 21. Adding user hierarchy in multiple display folders
In the PivotTable Field List, the Color attribute hierarchy is now added in both the Design and the Stocking display folders, as shown in Figure 22.
www.microsoft.com/office© 2007 Microsoft Corporation. All rights reserved. Page 23By using or providing feedback on these materials, you agree to the attached license agreement.To comment on this paper or request more documentation on these developer features, contact us at [email protected]. We look forward to hearing from you.
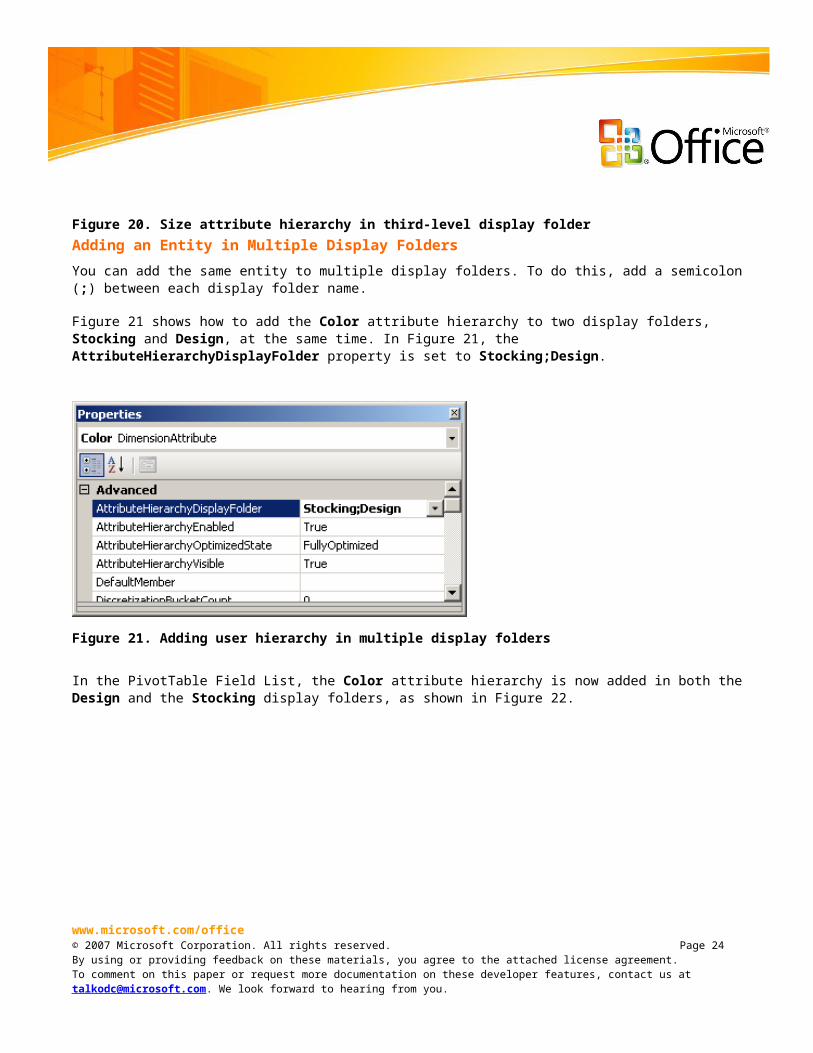
Figure 22. Color attribute hierarchy added in two display folders
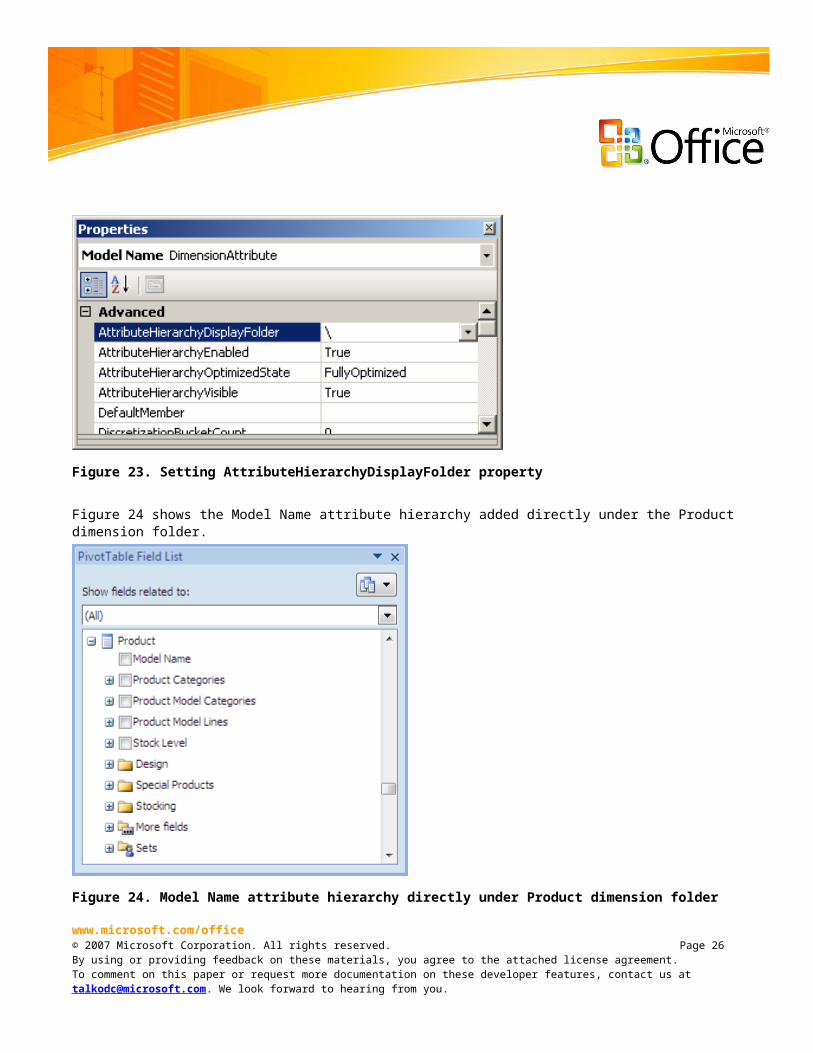
Adding Attribute Hierarchies to the Root Dimension FolderIf you regularly use certain attribute hierarchies, you can add them directly under the dimension folder, just as you do with user hierarchies without a display folder.
To do this, open the Properties pane for the attribute hierarchies and set the AttributeHierarchyDisplayFolder property to \, as shown in Figure 23.
www.microsoft.com/office© 2007 Microsoft Corporation. All rights reserved. Page 24By using or providing feedback on these materials, you agree to the attached license agreement.To comment on this paper or request more documentation on these developer features, contact us at [email protected]. We look forward to hearing from you.
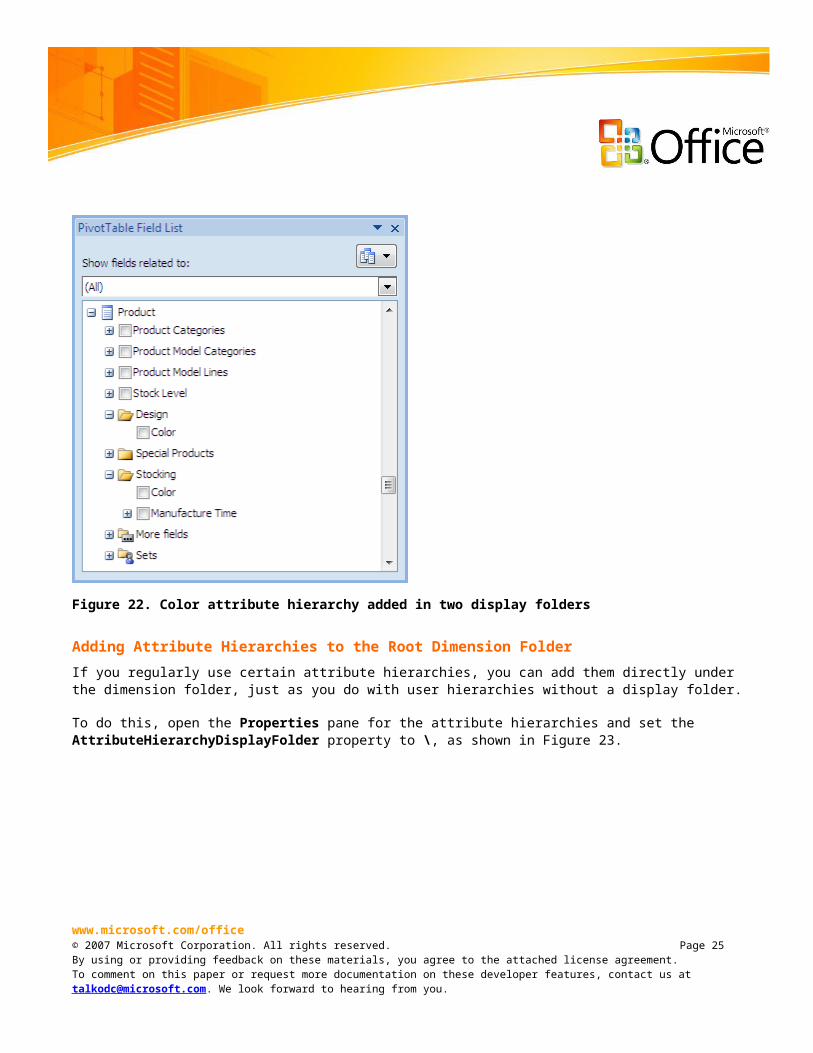
Figure 23. Setting AttributeHierarchyDisplayFolder property
Figure 24 shows the Model Name attribute hierarchy added directly under the Product dimension folder.
Figure 24. Model Name attribute hierarchy directly under Product dimension folder
www.microsoft.com/office© 2007 Microsoft Corporation. All rights reserved. Page 25By using or providing feedback on these materials, you agree to the attached license agreement.To comment on this paper or request more documentation on these developer features, contact us at [email protected]. We look forward to hearing from you.
Named Sets
In Office Excel 2007, named sets that are defined in the cube are automatically displayed in the PivotTable Field List. You can add them to rows or columns in the PivotTable.
Named sets are placed under the dimension folder of the dimension that they belong to. If a display folder is not defined for a named set, it is placed in a special Sets folder. However, you can place it in any display folder under the dimension folder by specifying a display folder for it on the server. For more information on display folders please see the Display Folders section in this document.
Note that only named sets that contain members from a single hierarchy are supported in Excel PivotTables. Named sets that contain members from multiple hierarchies do not appear in the PivotTable Field List.
In Figure 25, five named sets are defined in the cube for the Product dimension. Two of those sets are listed in the Special Products display folder, set up by the cube designer, and the other three are listed in the Sets folder because no display folders are defined for these.
www.microsoft.com/office© 2007 Microsoft Corporation. All rights reserved. Page 26By using or providing feedback on these materials, you agree to the attached license agreement.To comment on this paper or request more documentation on these developer features, contact us at [email protected]. We look forward to hearing from you.
Figure 25. Named sets in the PivotTable Field List
You can add named sets to a cube on the Calculations tab in Business Intelligence Development Studio, as shown in Figure 26. These named sets can be dynamic expressions, or they can contain a static list of members.
Figure 26. Defining a named set based on expression
Perspectives
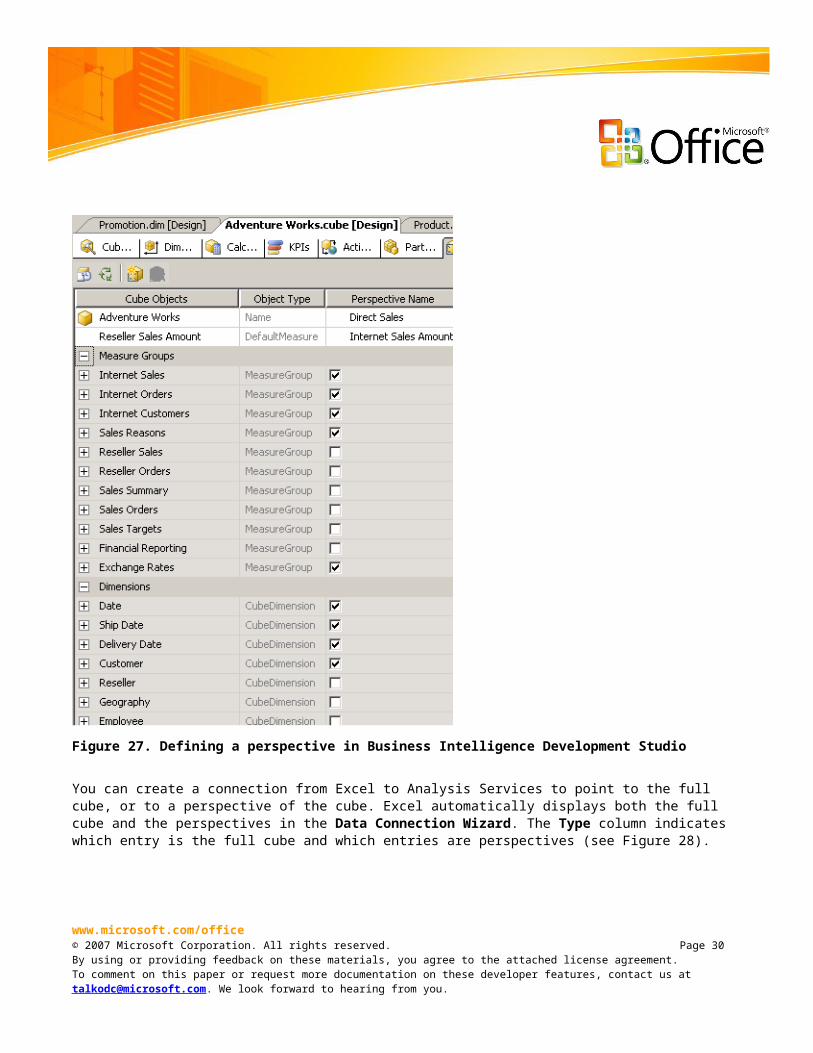
As stated earlier, the amount of information stored in a cube can be very large and contain multiple measure groups and, typically, many attribute hierarchies. SQL Server 2005 Analysis Services includes a feature called perspectives, which enables cube designers to define views that only include parts of the full cube. Perspectives are used to view a relevant subset of information for a specific business purpose.
In Analysis Services, creating a new perspective is easy. You can identify the information needed for a specific purpose or specific group of people by selecting check boxes. Then, you can create a perspective based on just what was selected (see Figure 27).
www.microsoft.com/office© 2007 Microsoft Corporation. All rights reserved. Page 27By using or providing feedback on these materials, you agree to the attached license agreement.To comment on this paper or request more documentation on these developer features, contact us at [email protected]. We look forward to hearing from you.
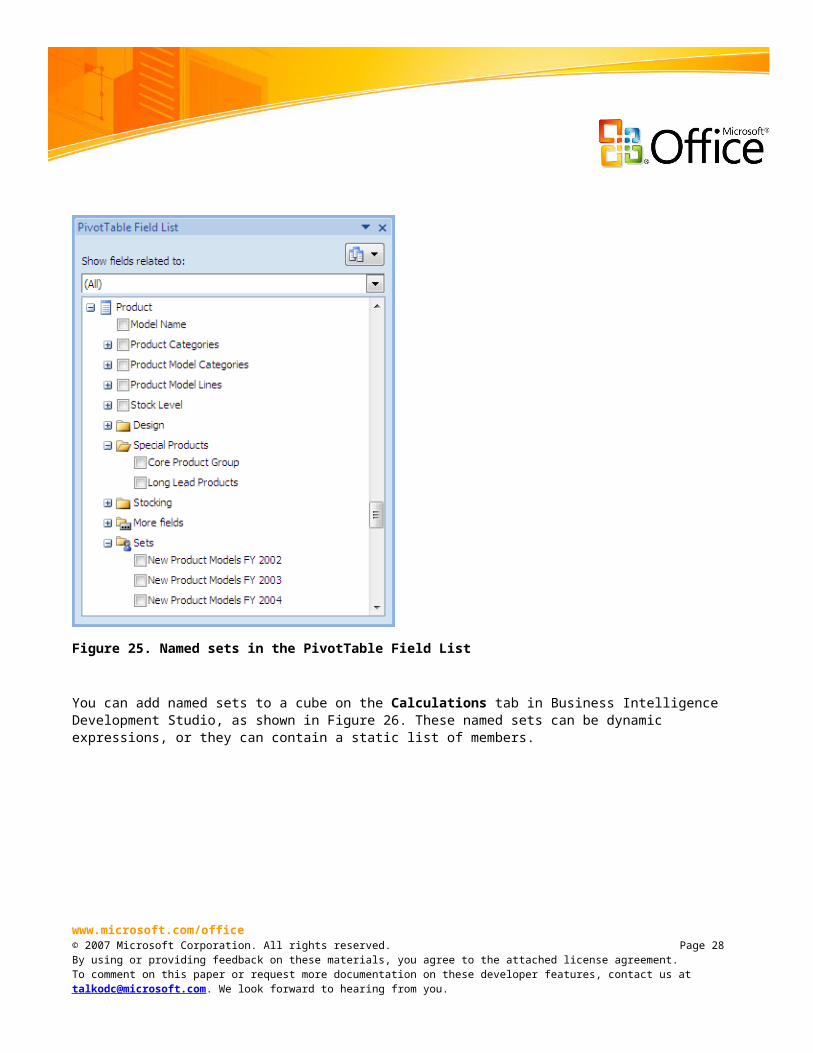
Figure 27. Defining a perspective in Business Intelligence Development Studio
You can create a connection from Excel to Analysis Services to point to the full cube, or to a perspective of the cube. Excel automatically displays both the full cube and the perspectives in the Data Connection Wizard. The Type column indicates which entry is the full cube and which entries are perspectives (see Figure 28).
www.microsoft.com/office© 2007 Microsoft Corporation. All rights reserved. Page 28By using or providing feedback on these materials, you agree to the attached license agreement.To comment on this paper or request more documentation on these developer features, contact us at [email protected]. We look forward to hearing from you.
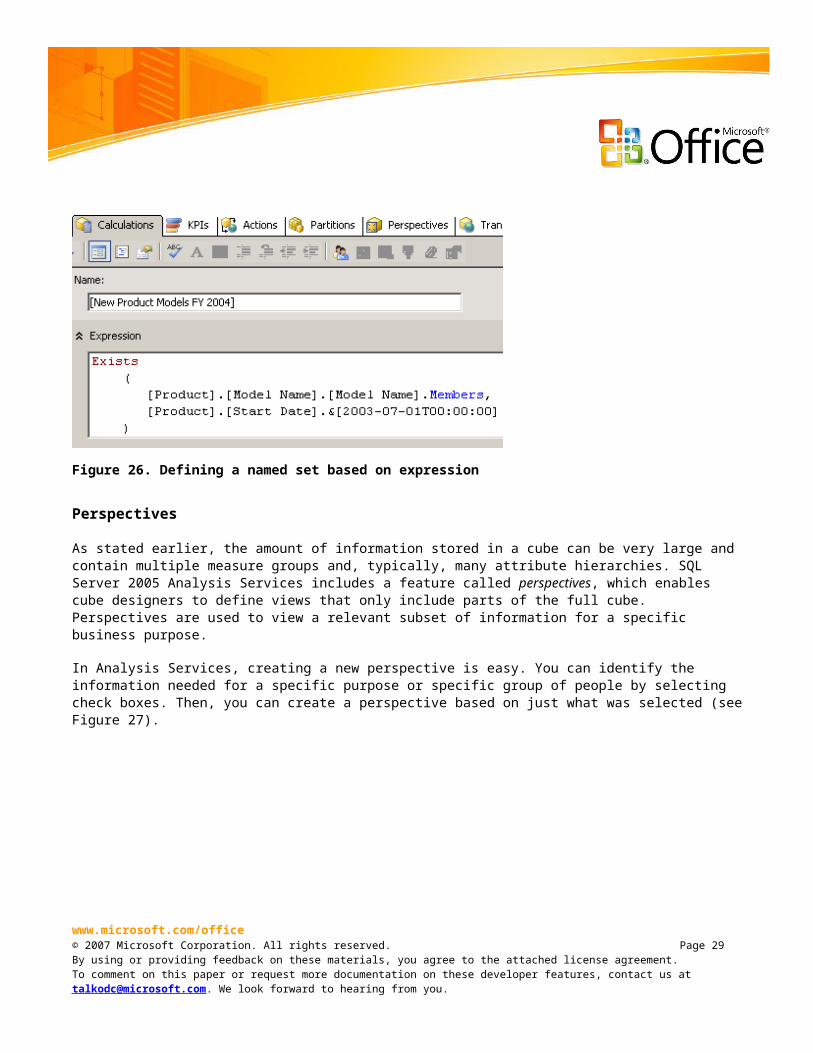
Figure 28. Connecting to a perspective in Excel
When connected to a perspective, the PivotTable Field List only shows the information included in the perspective. If a cube or perspective only includes a single measure group, the Show fields related to measure group menu at the top of the PivotTable Field List does not appear because there is only one choice.
Time Dimensions
For cubes that contain time dimensions, the Office Excel 2007 PivotTable applies time-specific logic to hierarchies of those dimensions. This section outlines these behaviors.
Placing Time Information in ColumnsWhen you use the check boxes in the PivotTable Field List to add fields to the PivotTable report, Excel automatically chooses where these fields go (row, column, or values area). Generally, hierarchies go to the row area and measures to the values area, but hierarchies belonging to dimensions of the type Time, are placed in the column area because it is common to display time information across the top of a report.
www.microsoft.com/office© 2007 Microsoft Corporation. All rights reserved. Page 29By using or providing feedback on these materials, you agree to the attached license agreement.To comment on this paper or request more documentation on these developer features, contact us at [email protected]. We look forward to hearing from you.
You can manually move time hierarchies to any of the row, column, or report filter areas using a drag-and-drop operation or by using the menus available from hierarchies in the PivotTable Field List.
To designate a time dimension, set the Type property of the dimension to Time, as illustrated in Figure 29.
Figure 29. Setting the dimension Type property to Time
Exposing Date-Specific Filtering OptionsIf a dimension, in addition to having the Type property set to Time, also has a date property, Office Excel 2007 PivotTables expose date-specific filtering options for this dimension’s hierarchies instead of label filtering options.
In Analysis Services, you do this by having a date data type column in the data source view tables for the time dimension and then setting the ValueColumn property to point to that column, as illustrated in Figure 30.
To enable date filtering in the PivotTable, first set the Type of the dimension to Time.
www.microsoft.com/office© 2007 Microsoft Corporation. All rights reserved. Page 30By using or providing feedback on these materials, you agree to the attached license agreement.To comment on this paper or request more documentation on these developer features, contact us at [email protected]. We look forward to hearing from you.
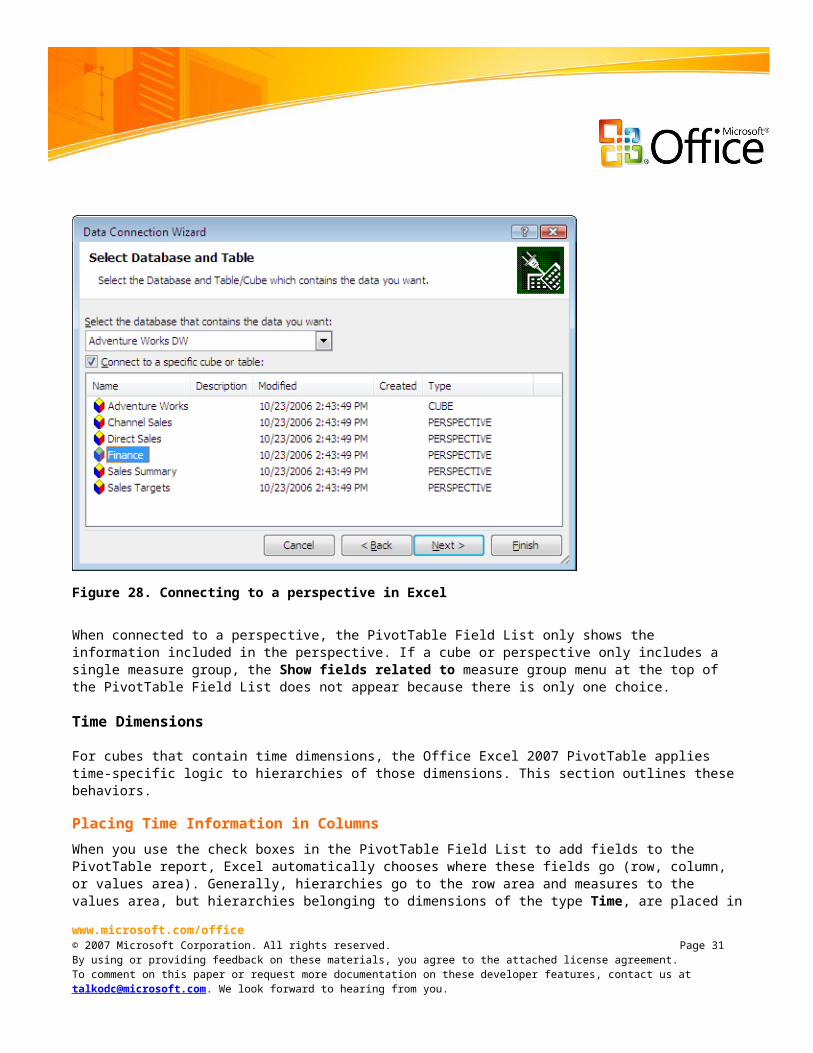
Figure 30. Setting the dimension type to Time to expose date filtering options
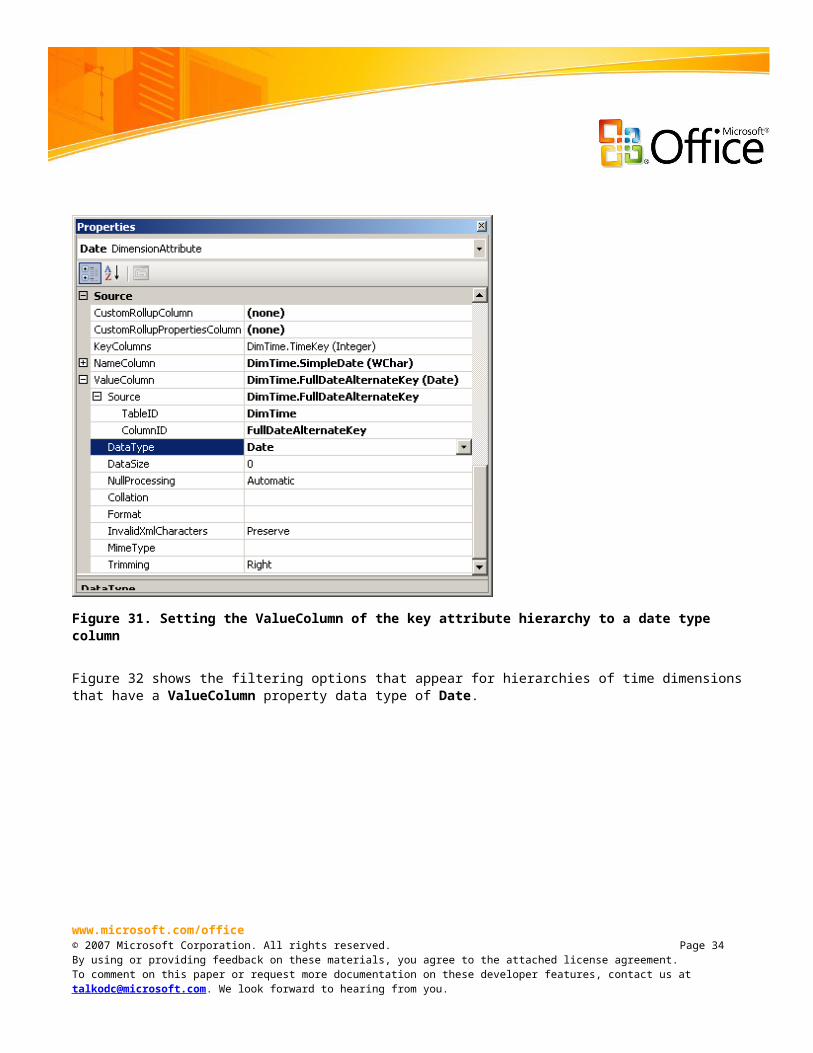
Next, set the ValueColumn property of the key attribute hierarchy in the time dimension to point to a date data type column in the source database. The DataType property should be set to Date, as illustrated in Figure 31.
www.microsoft.com/office© 2007 Microsoft Corporation. All rights reserved. Page 31By using or providing feedback on these materials, you agree to the attached license agreement.To comment on this paper or request more documentation on these developer features, contact us at [email protected]. We look forward to hearing from you.
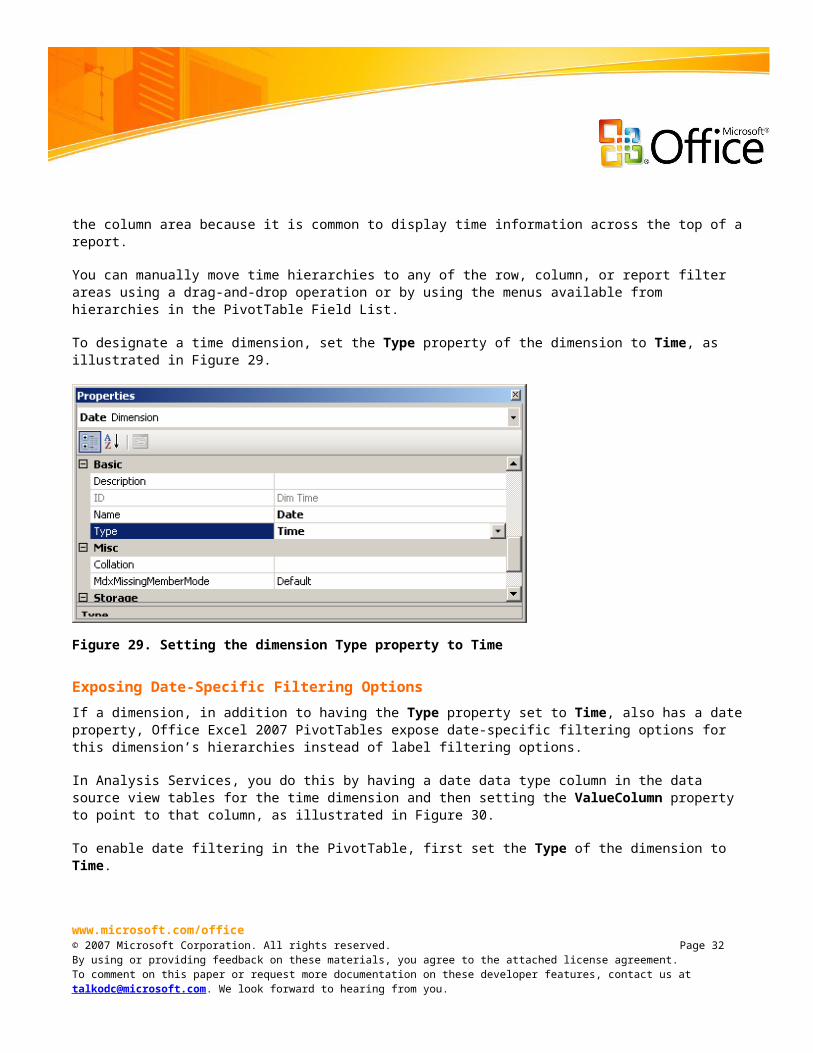
Figure 31. Setting the ValueColumn of the key attribute hierarchy to a date type column
Figure 32 shows the filtering options that appear for hierarchies of time dimensions that have a ValueColumn property data type of Date.
www.microsoft.com/office© 2007 Microsoft Corporation. All rights reserved. Page 32By using or providing feedback on these materials, you agree to the attached license agreement.To comment on this paper or request more documentation on these developer features, contact us at [email protected]. We look forward to hearing from you.
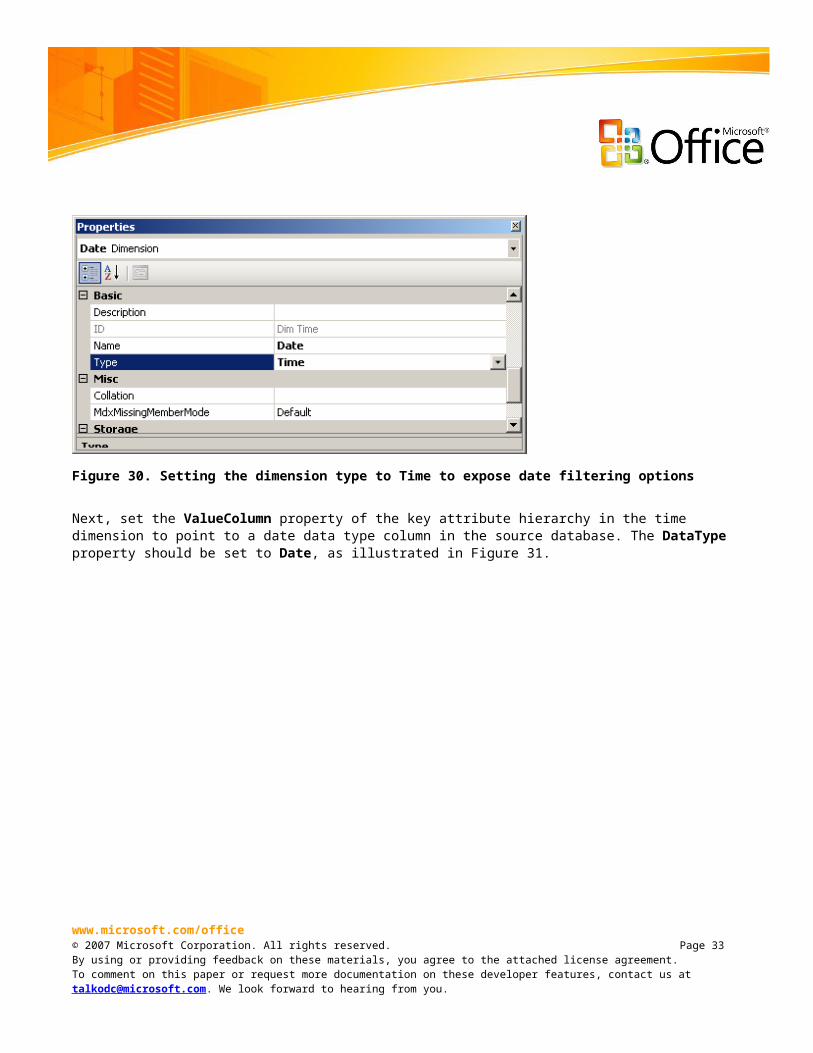
Figure 32. Date filtering options exposed in a PivotTable for a time hierarchy
www.microsoft.com/office© 2007 Microsoft Corporation. All rights reserved. Page 33By using or providing feedback on these materials, you agree to the attached license agreement.To comment on this paper or request more documentation on these developer features, contact us at [email protected]. We look forward to hearing from you.
Date filtering in a PivotTable is based on the ValueColumn of the key attribute hierarchy in the time dimension and is available for any hierarchy of the time dimension.
Member Properties
Member properties defined on the server enable a set of features in Excel PivotTables. This section covers these features.
In Analysis Services, member properties are defined by creating relationships between attributes. If an attribute is moved, through a drag–and-drop operation, underneath another attribute (as illustrated in Figure 33), the dragged attribute becomes a member property of that attribute.
www.microsoft.com/office© 2007 Microsoft Corporation. All rights reserved. Page 34By using or providing feedback on these materials, you agree to the attached license agreement.To comment on this paper or request more documentation on these developer features, contact us at [email protected]. We look forward to hearing from you.
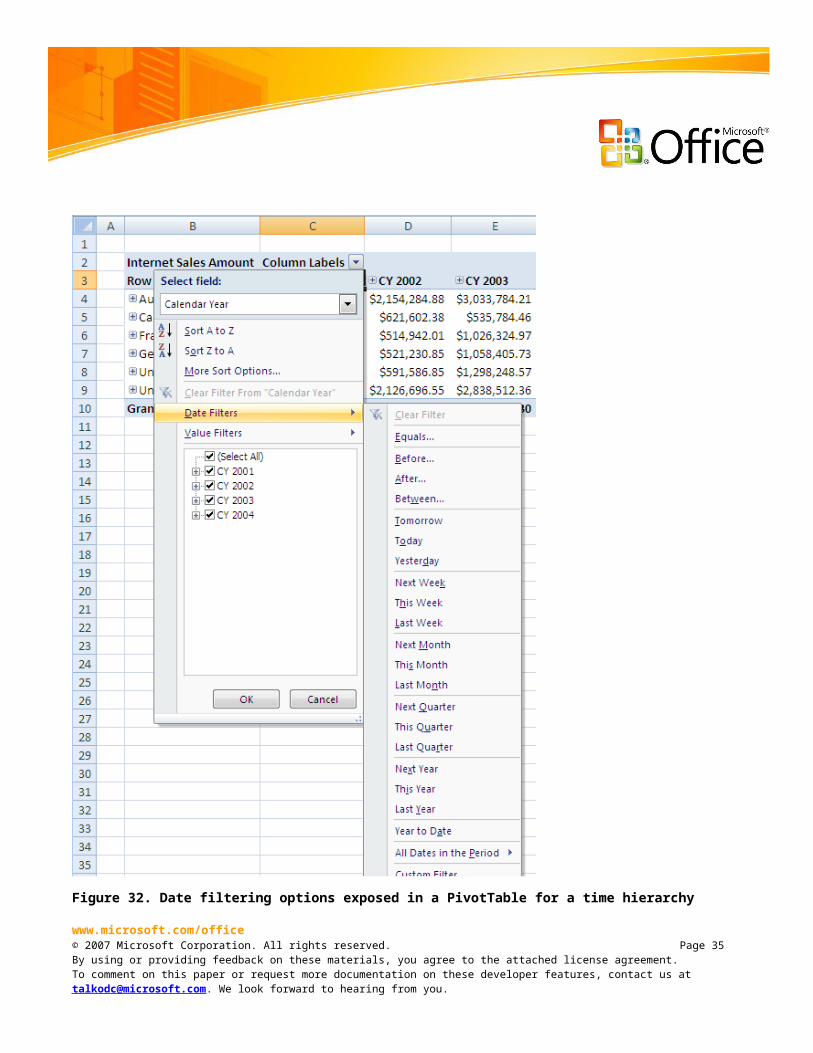
Figure 33. Creating member properties by setting up attribute relationships
For a member property to show up in the PivotTable, set the AttributeHierarchyVisible property to True for the attribute hierarchy. For example, with Class defined as a member property of the Product attribute hierarchy, you set the AttributeHierarchyVisible property to True to make Class show up in the PivotTable, as shown in Figure 34.
www.microsoft.com/office© 2007 Microsoft Corporation. All rights reserved. Page 35By using or providing feedback on these materials, you agree to the attached license agreement.To comment on this paper or request more documentation on these developer features, contact us at [email protected]. We look forward to hearing from you.
Figure 34. AttributeHierarchyVisible is set to True
Member Properties in TooltipsBy default, PivotTables connected to Analysis Services cubes retrieve member property information for levels of hierarchies currently visible in the PivotTable. This information is displayed in tooltips when the user places the mouse pointer over items in the PivotTable, as shown in Figure 35.
www.microsoft.com/office© 2007 Microsoft Corporation. All rights reserved. Page 36By using or providing feedback on these materials, you agree to the attached license agreement.To comment on this paper or request more documentation on these developer features, contact us at [email protected]. We look forward to hearing from you.
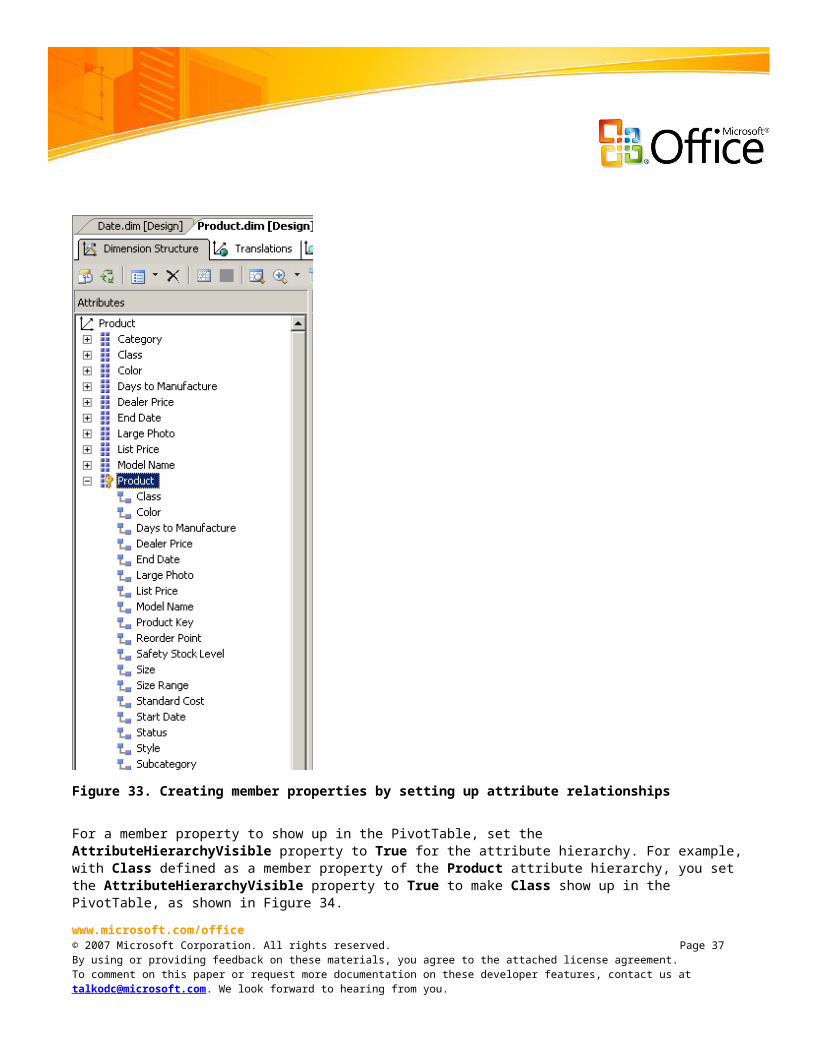
Figure 35. Tooltip showing member property information
The user can control whether member property information is retrieved. It is only when the Show properties in tooltips check box in the PivotTable Options dialog box of the Display tab is selected that member property information is retrieved from the OLAP server and displayed in tooltips.
www.microsoft.com/office© 2007 Microsoft Corporation. All rights reserved. Page 37By using or providing feedback on these materials, you agree to the attached license agreement.To comment on this paper or request more documentation on these developer features, contact us at [email protected]. We look forward to hearing from you.
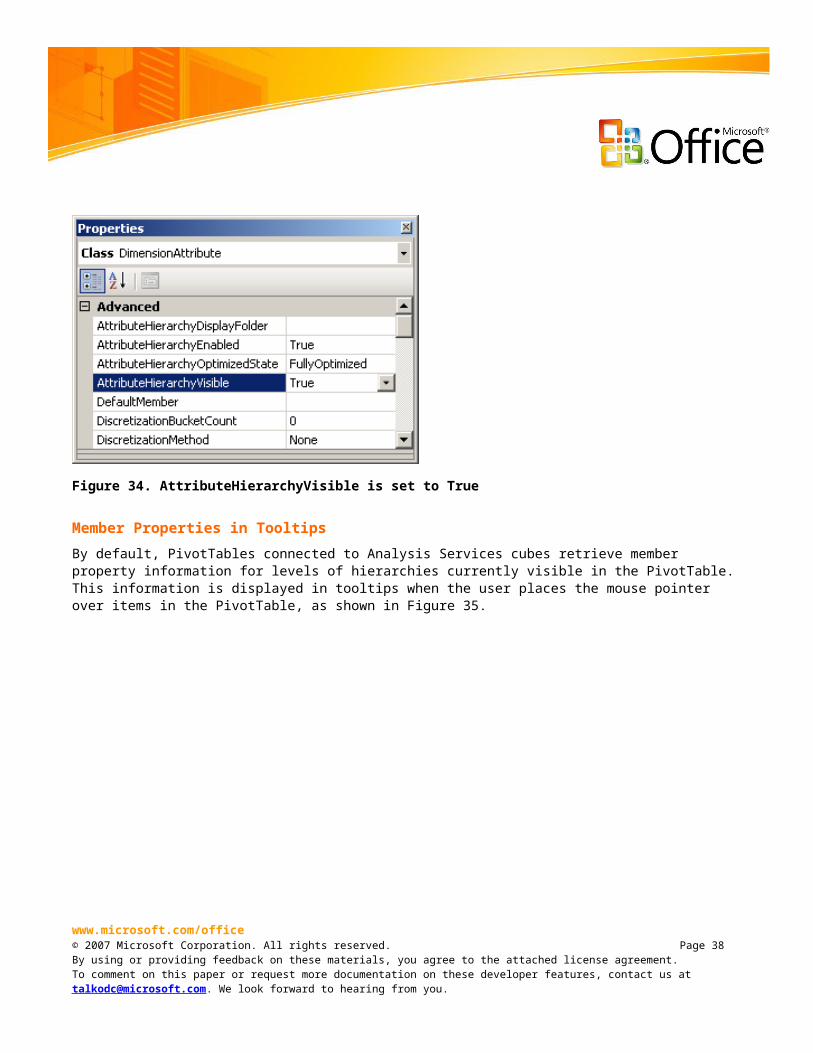
Figure 36. PivotTable Options dialog box with Show properties in tooltips setting
The user can also control which member properties are displayed in tooltips by right-clicking and selecting the Show Properties in Tooltips menu.
www.microsoft.com/office© 2007 Microsoft Corporation. All rights reserved. Page 38By using or providing feedback on these materials, you agree to the attached license agreement.To comment on this paper or request more documentation on these developer features, contact us at [email protected]. We look forward to hearing from you.
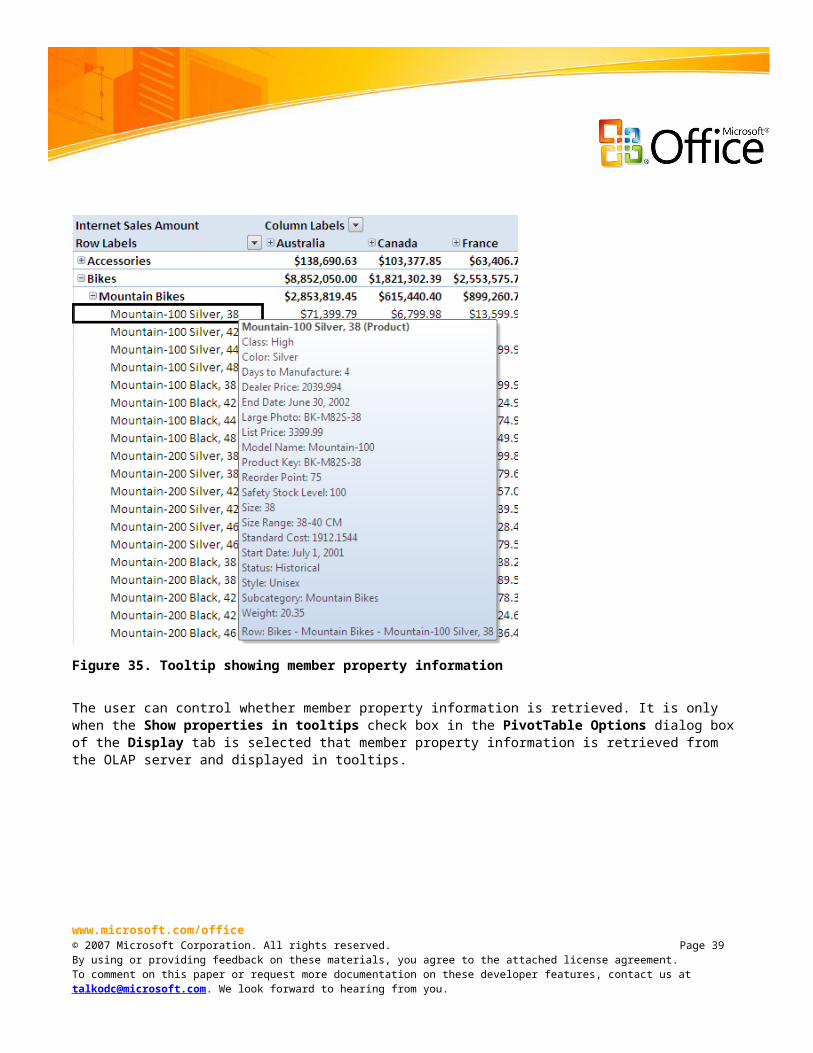
Figure 37. Shortcut menu for hiding or showing member properties in tooltips
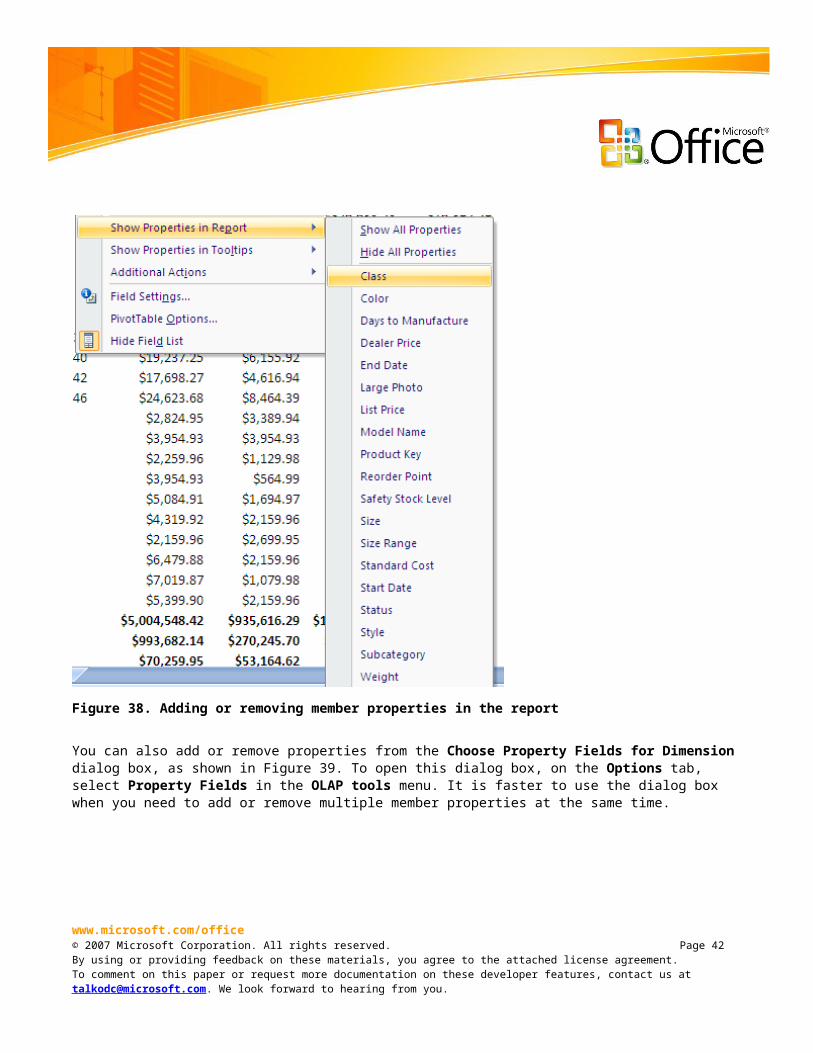
Member Properties in the ReportYou can add member property information to the PivotTable itself, allowing it to be read with the rest of the information in the report and to be printed. There are two ways to add or remove member properties from the PivotTable. One way is to use the shortcut menu (see Figure 38).
www.microsoft.com/office© 2007 Microsoft Corporation. All rights reserved. Page 39By using or providing feedback on these materials, you agree to the attached license agreement.To comment on this paper or request more documentation on these developer features, contact us at [email protected]. We look forward to hearing from you.
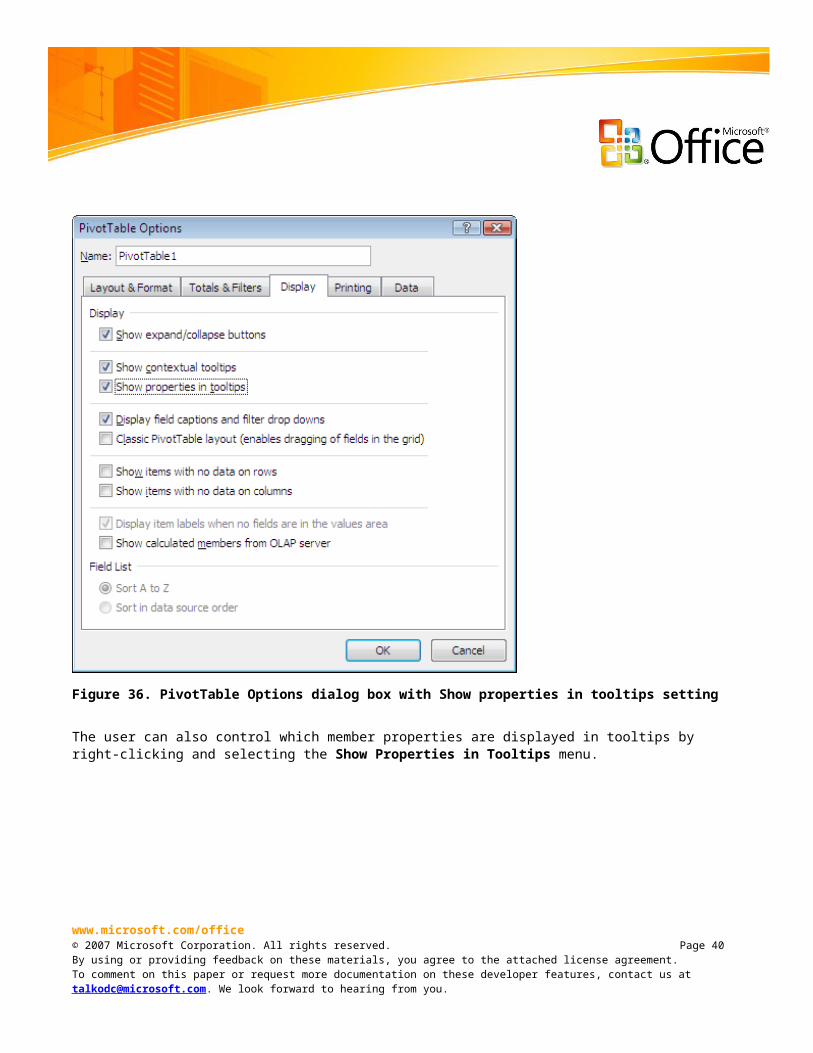
Figure 38. Adding or removing member properties in the report
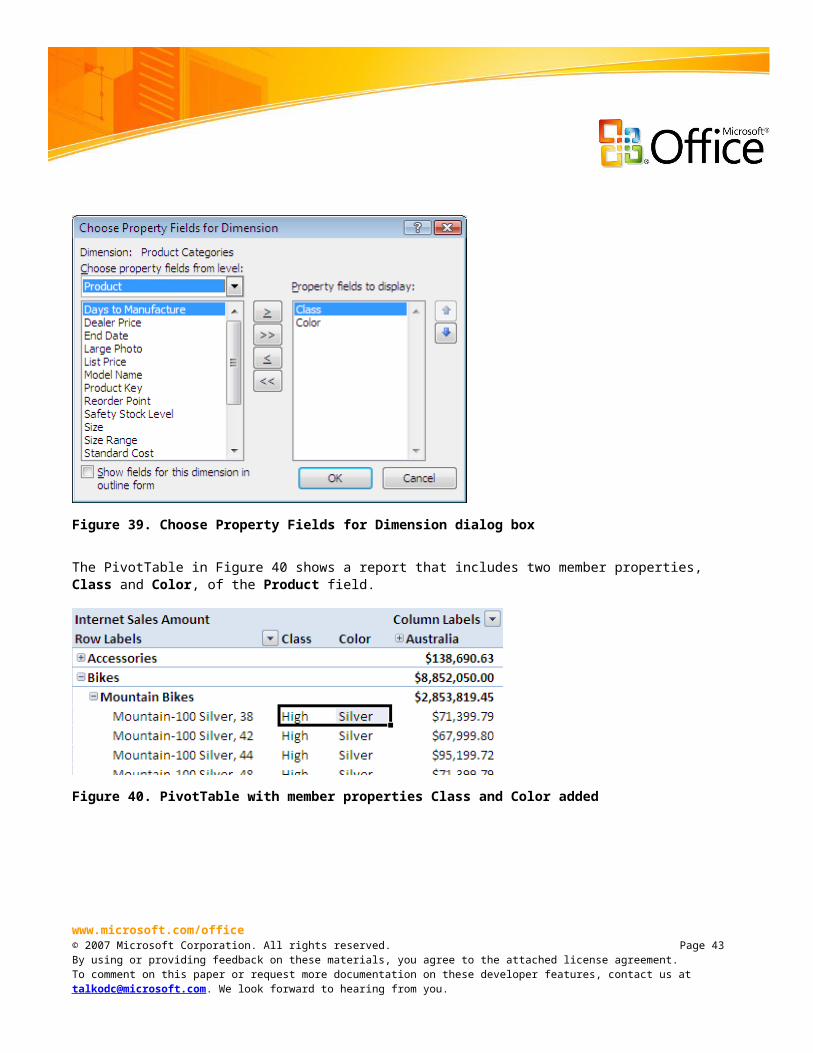
You can also add or remove properties from the Choose Property Fields for Dimension dialog box, as shown in Figure 39. To open this dialog box, on the Options tab, select Property Fields in the OLAP tools menu. It is faster to use the dialog box when you need to add or remove multiple member properties at the same time.
www.microsoft.com/office© 2007 Microsoft Corporation. All rights reserved. Page 40By using or providing feedback on these materials, you agree to the attached license agreement.To comment on this paper or request more documentation on these developer features, contact us at [email protected]. We look forward to hearing from you.
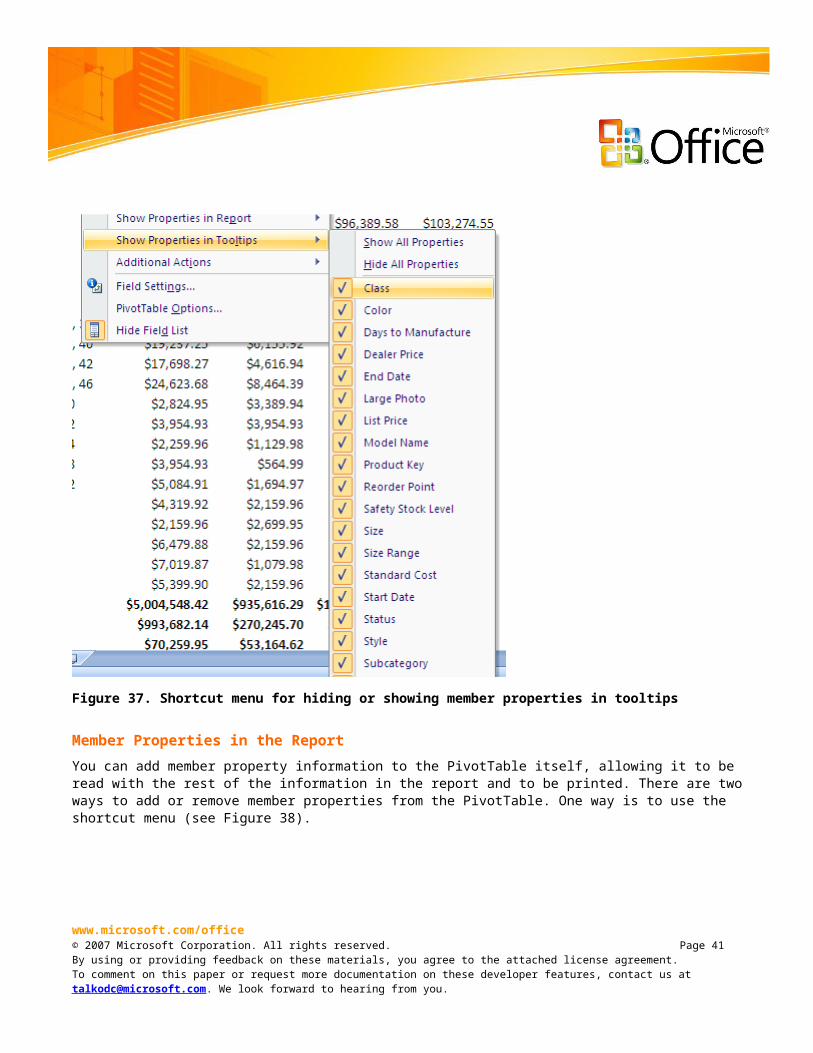
Figure 39. Choose Property Fields for Dimension dialog box
The PivotTable in Figure 40 shows a report that includes two member properties, Class and Color, of the Product field.
Figure 40. PivotTable with member properties Class and Color added
Filtering by Member Propertieswww.microsoft.com/office© 2007 Microsoft Corporation. All rights reserved. Page 41By using or providing feedback on these materials, you agree to the attached license agreement.To comment on this paper or request more documentation on these developer features, contact us at [email protected]. We look forward to hearing from you.
When applying a label filter to a field that has member properties defined on the OLAP server, the user can filter the field by the captions of a member property instead of by the captions of the field itself. For example, you can use this feature to filter the Product field to only show products with the color silver, where Color is a member property of the Product field.
For fields that have member properties, the Label Filter dialog box displays member properties in the first list box. The properties are labeled using the field name appended with the member property name.
Figure 41. Label Filter dialog box showing member properties
ActionsOffice Excel 2007 PivotTables expose actions defined in Analysis Services cubes. The following types of actions are supported:
URL
Rowset
Reporting
Drillthrough
www.microsoft.com/office© 2007 Microsoft Corporation. All rights reserved. Page 42By using or providing feedback on these materials, you agree to the attached license agreement.To comment on this paper or request more documentation on these developer features, contact us at [email protected]. We look forward to hearing from you.
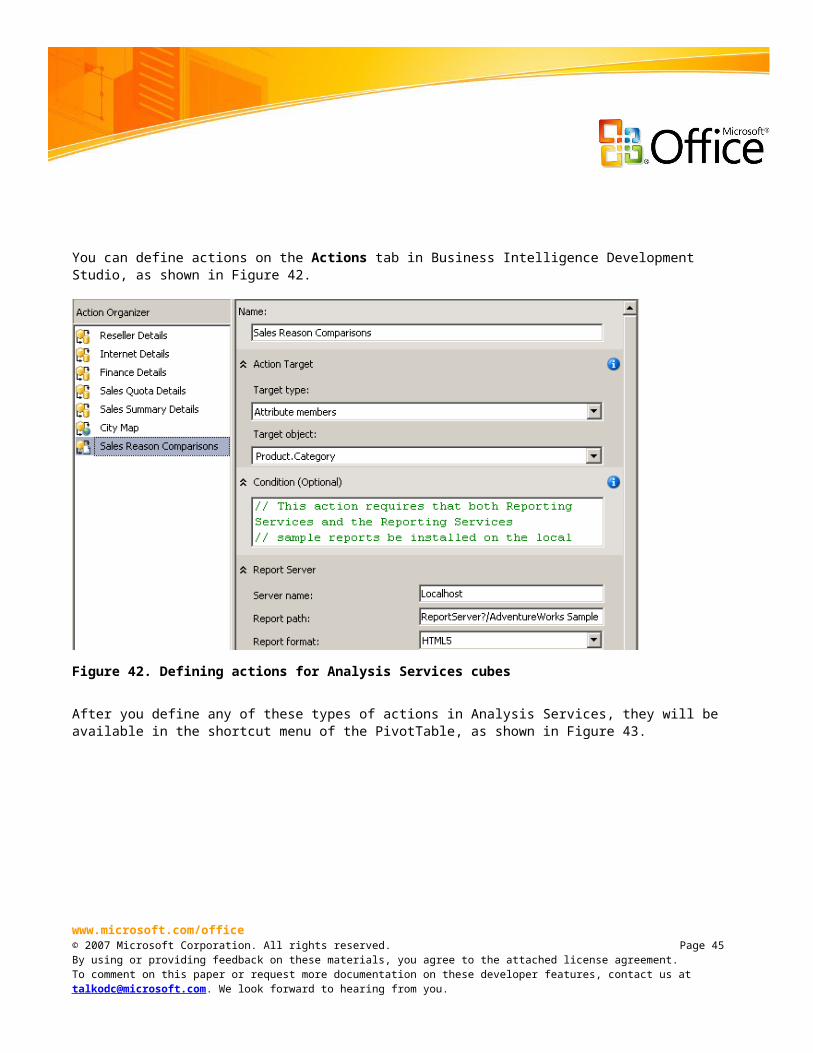
You can define actions on the Actions tab in Business Intelligence Development Studio, as shown in Figure 42.
Figure 42. Defining actions for Analysis Services cubes
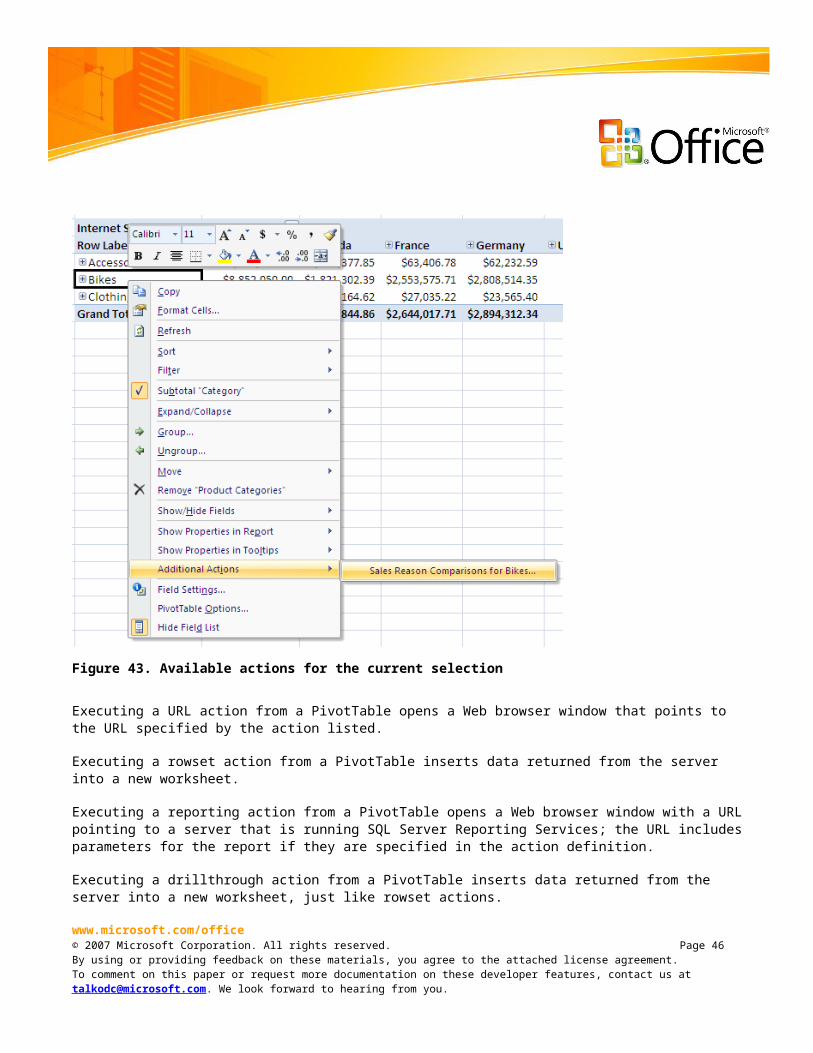
After you define any of these types of actions in Analysis Services, they will be available in the shortcut menu of the PivotTable, as shown in Figure 43.
www.microsoft.com/office© 2007 Microsoft Corporation. All rights reserved. Page 43By using or providing feedback on these materials, you agree to the attached license agreement.To comment on this paper or request more documentation on these developer features, contact us at [email protected]. We look forward to hearing from you.
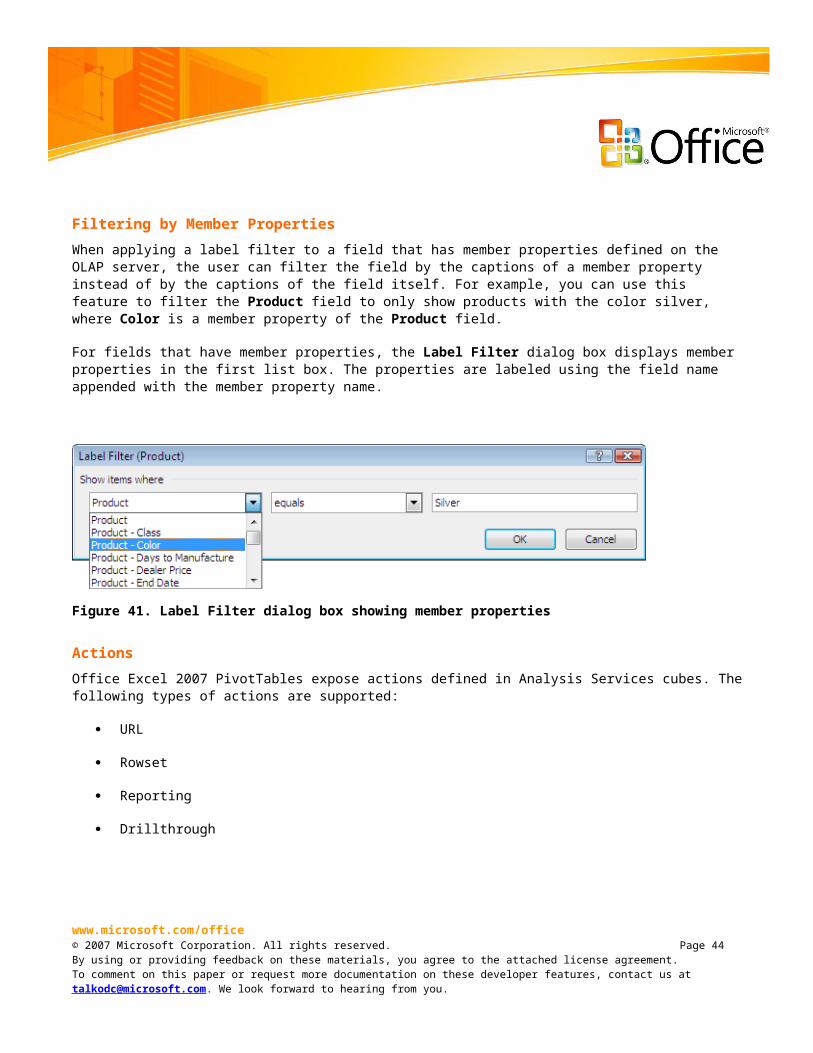
Figure 43. Available actions for the current selection
Executing a URL action from a PivotTable opens a Web browser window that points to the URL specified by the action listed.
Executing a rowset action from a PivotTable inserts data returned from the server into a new worksheet.
Executing a reporting action from a PivotTable opens a Web browser window with a URL pointing to a server that is running SQL Server Reporting Services; the URL includes parameters for the report if they are specified in the action definition.
Executing a drillthrough action from a PivotTable inserts data returned from the server into a new worksheet, just like rowset actions.
www.microsoft.com/office© 2007 Microsoft Corporation. All rights reserved. Page 44By using or providing feedback on these materials, you agree to the attached license agreement.To comment on this paper or request more documentation on these developer features, contact us at [email protected]. We look forward to hearing from you.
The example in Figure 44 shows the result of executing a reporting action. Note that the report is filtered by Bikes, which is the cell that was selected when the action was executed from the PivotTable.
Figure 44. Reporting Services report opened by a PivotTable action
All action target types are exposed in Office Excel 2007 PivotTables, including the following:
Attribute members
Cells
www.microsoft.com/office© 2007 Microsoft Corporation. All rights reserved. Page 45By using or providing feedback on these materials, you agree to the attached license agreement.To comment on this paper or request more documentation on these developer features, contact us at [email protected]. We look forward to hearing from you.
Cube
Dimension members
Hierarchy
Hierarchy members
Level
Level members
The targets apply to different selections in the PivotTable.
Measure Formatting
PivotTables in Office Excel 2007 automatically pick up and apply formatting defined in Analysis Services. Whether to apply server-defined formatting, and which pieces to apply, is controlled in the new Connection Properties dialog box.
The following formatting components from Analysis Services are supported in Office Excel 2007:
Number Format
Fill Color
Font Style
Text Color
Figure 45 shows the OLAP Server Formatting options.
www.microsoft.com/office© 2007 Microsoft Corporation. All rights reserved. Page 46By using or providing feedback on these materials, you agree to the attached license agreement.To comment on this paper or request more documentation on these developer features, contact us at [email protected]. We look forward to hearing from you.
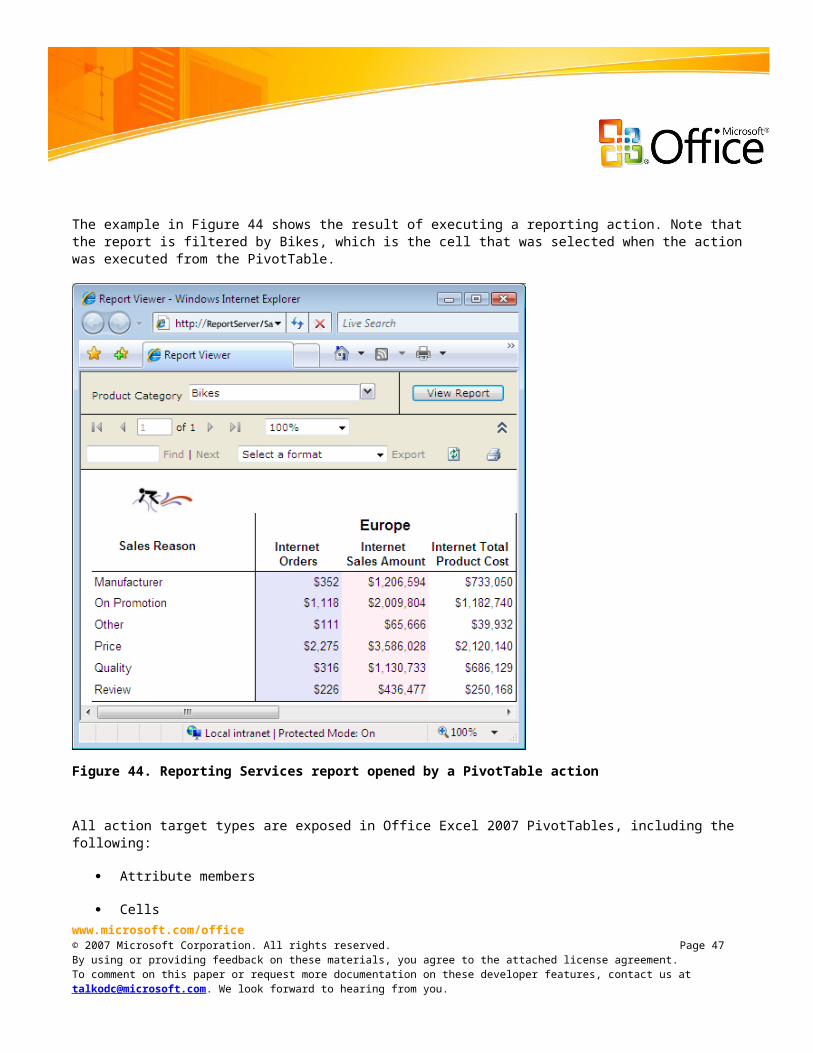
Figure 45. OLAP Server Formatting options
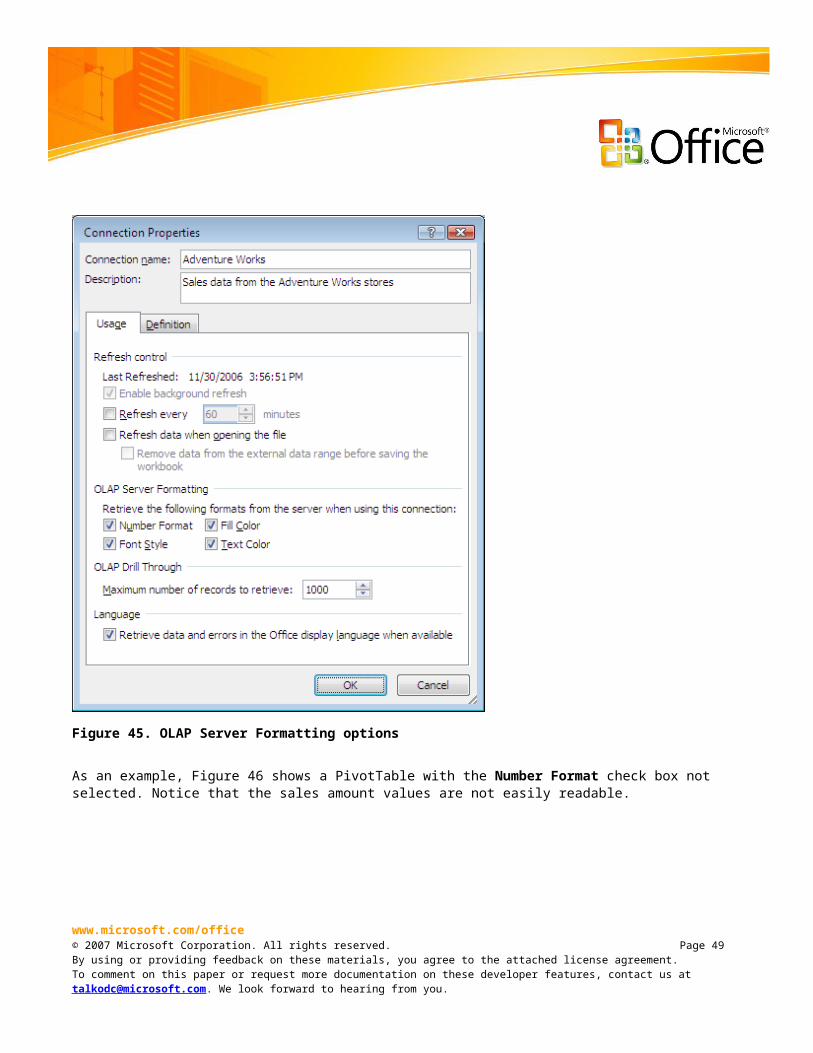
As an example, Figure 46 shows a PivotTable with the Number Format check box not selected. Notice that the sales amount values are not easily readable.
www.microsoft.com/office© 2007 Microsoft Corporation. All rights reserved. Page 47By using or providing feedback on these materials, you agree to the attached license agreement.To comment on this paper or request more documentation on these developer features, contact us at [email protected]. We look forward to hearing from you.
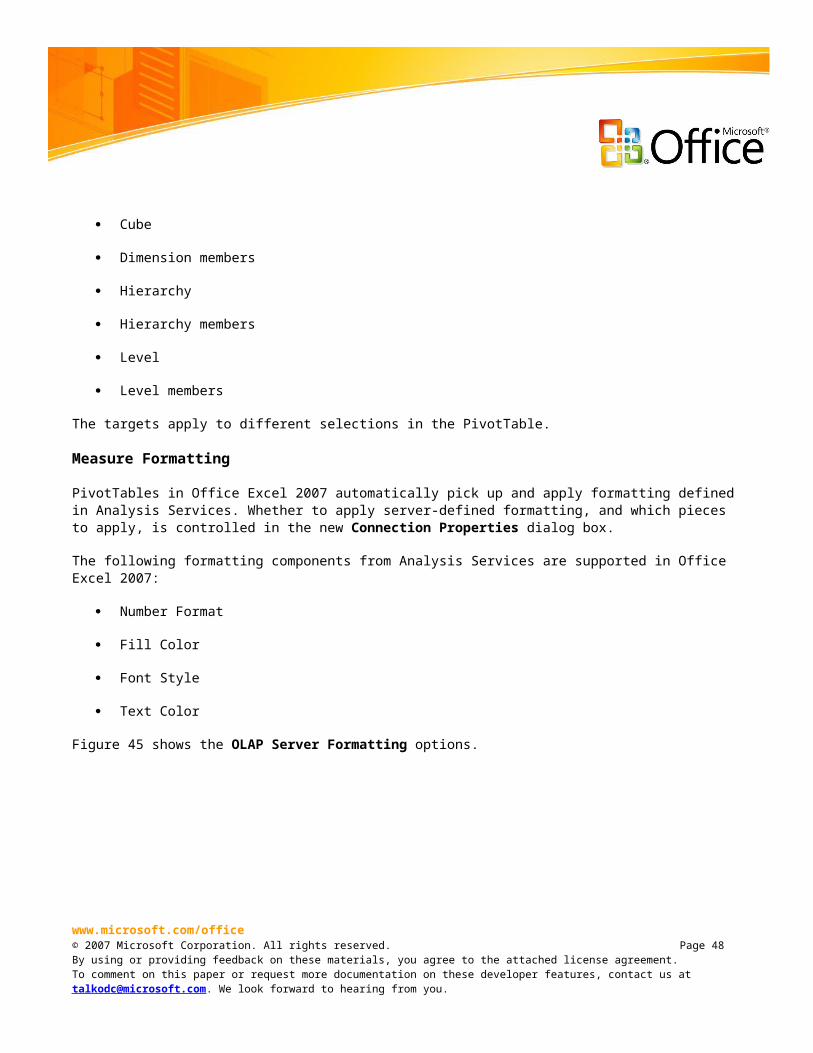
Figure 46. PivotTable without Number Format applied
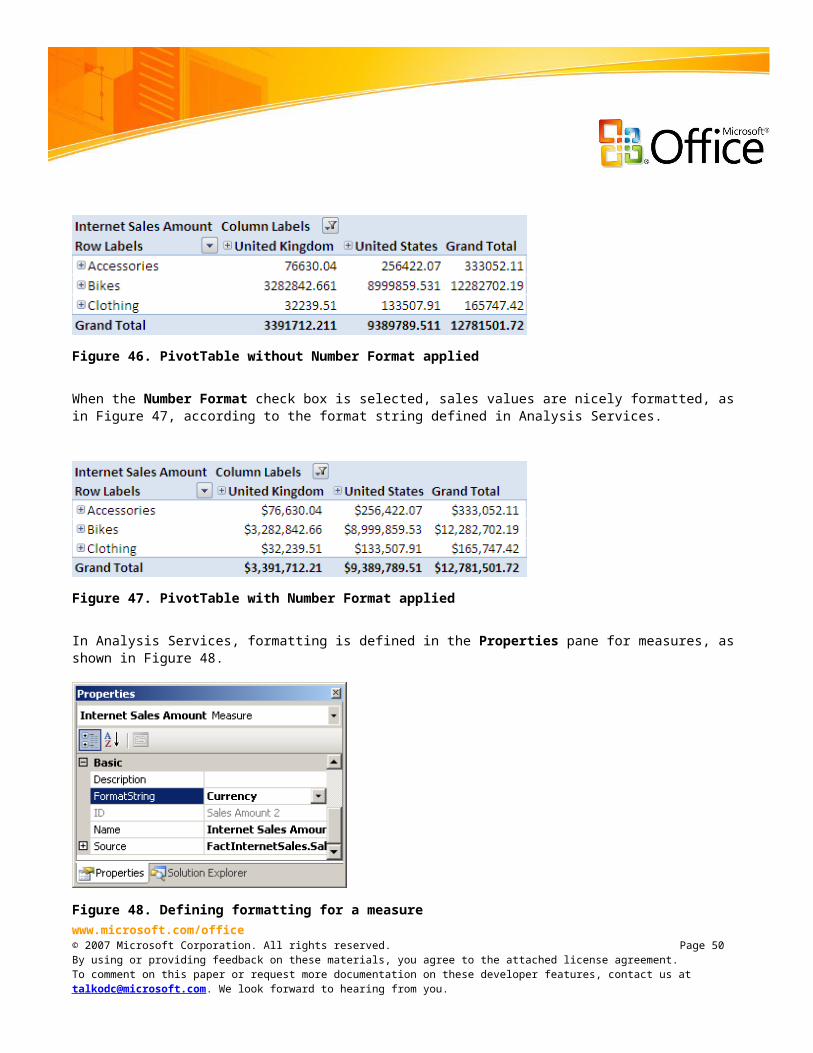
When the Number Format check box is selected, sales values are nicely formatted, as in Figure 47, according to the format string defined in Analysis Services.
Figure 47. PivotTable with Number Format applied
In Analysis Services, formatting is defined in the Properties pane for measures, as shown in Figure 48.
Figure 48. Defining formatting for a measure
www.microsoft.com/office© 2007 Microsoft Corporation. All rights reserved. Page 48By using or providing feedback on these materials, you agree to the attached license agreement.To comment on this paper or request more documentation on these developer features, contact us at [email protected]. We look forward to hearing from you.
For calculated measures, you can define formatting in the Calculations tab in Business Intelligence Development Studio, as shown in Figure 49.
Figure 49. Formatting options for calculated measure
www.microsoft.com/office© 2007 Microsoft Corporation. All rights reserved. Page 49By using or providing feedback on these materials, you agree to the attached license agreement.To comment on this paper or request more documentation on these developer features, contact us at [email protected]. We look forward to hearing from you.
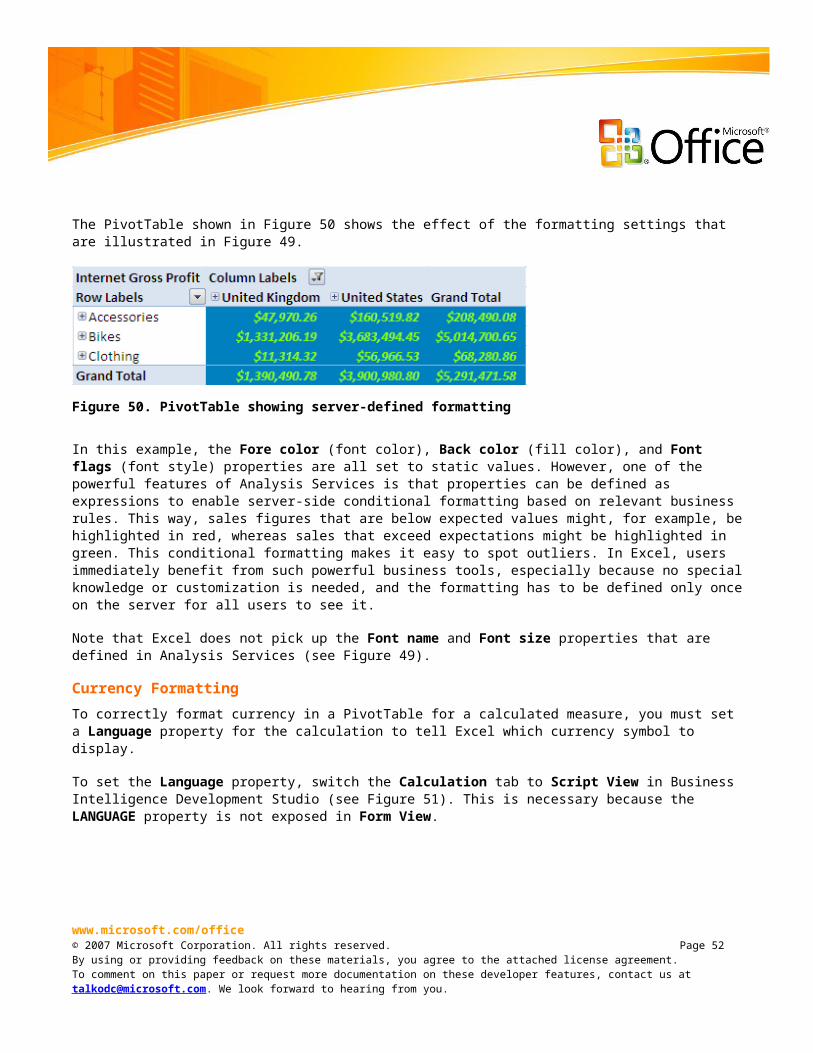
The PivotTable shown in Figure 50 shows the effect of the formatting settings that are illustrated in Figure 49.
Figure 50. PivotTable showing server-defined formatting
In this example, the Fore color (font color), Back color (fill color), and Font flags (font style) properties are all set to static values. However, one of the powerful features of Analysis Services is that properties can be defined as expressions to enable server-side conditional formatting based on relevant business rules. This way, sales figures that are below expected values might, for example, be highlighted in red, whereas sales that exceed expectations might be highlighted in green. This conditional formatting makes it easy to spot outliers. In Excel, users immediately benefit from such powerful business tools, especially because no special knowledge or customization is needed, and the formatting has to be defined only once on the server for all users to see it.
Note that Excel does not pick up the Font name and Font size properties that are defined in Analysis Services (see Figure 49).
Currency FormattingTo correctly format currency in a PivotTable for a calculated measure, you must set a Language property for the calculation to tell Excel which currency symbol to display.
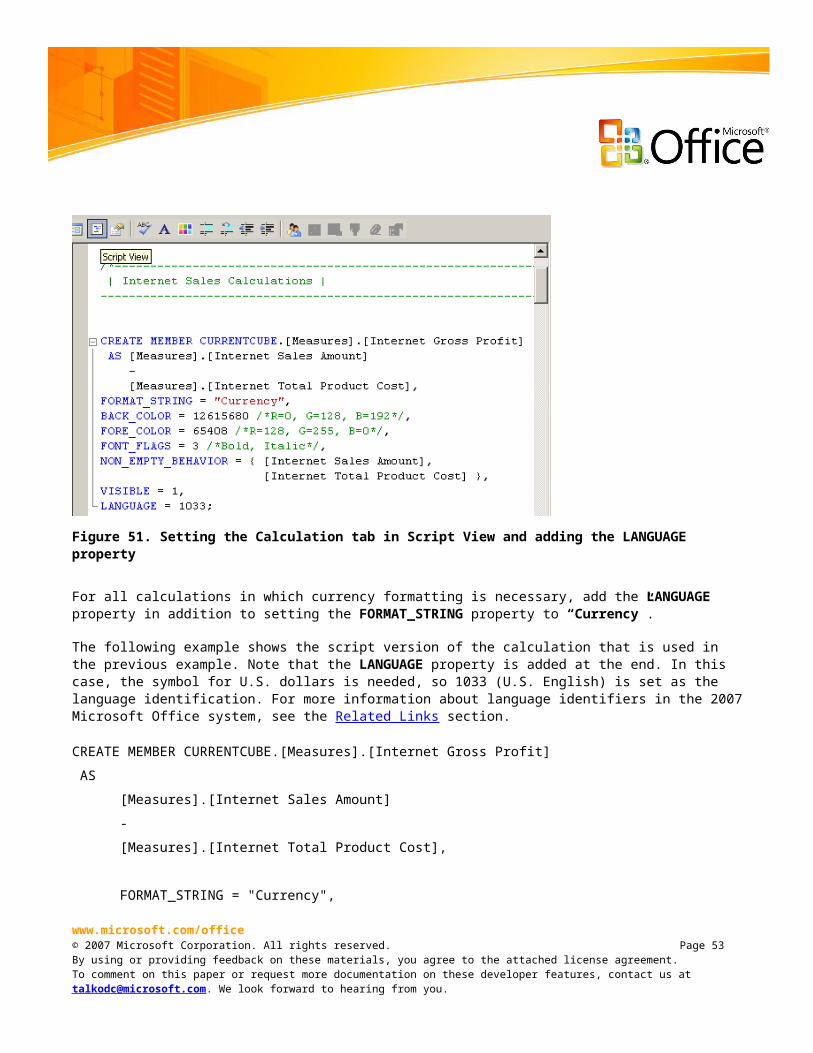
To set the Language property, switch the Calculation tab to Script View in Business Intelligence Development Studio (see Figure 51). This is necessary because the LANGUAGE property is not exposed in Form View.
www.microsoft.com/office© 2007 Microsoft Corporation. All rights reserved. Page 50By using or providing feedback on these materials, you agree to the attached license agreement.To comment on this paper or request more documentation on these developer features, contact us at [email protected]. We look forward to hearing from you.
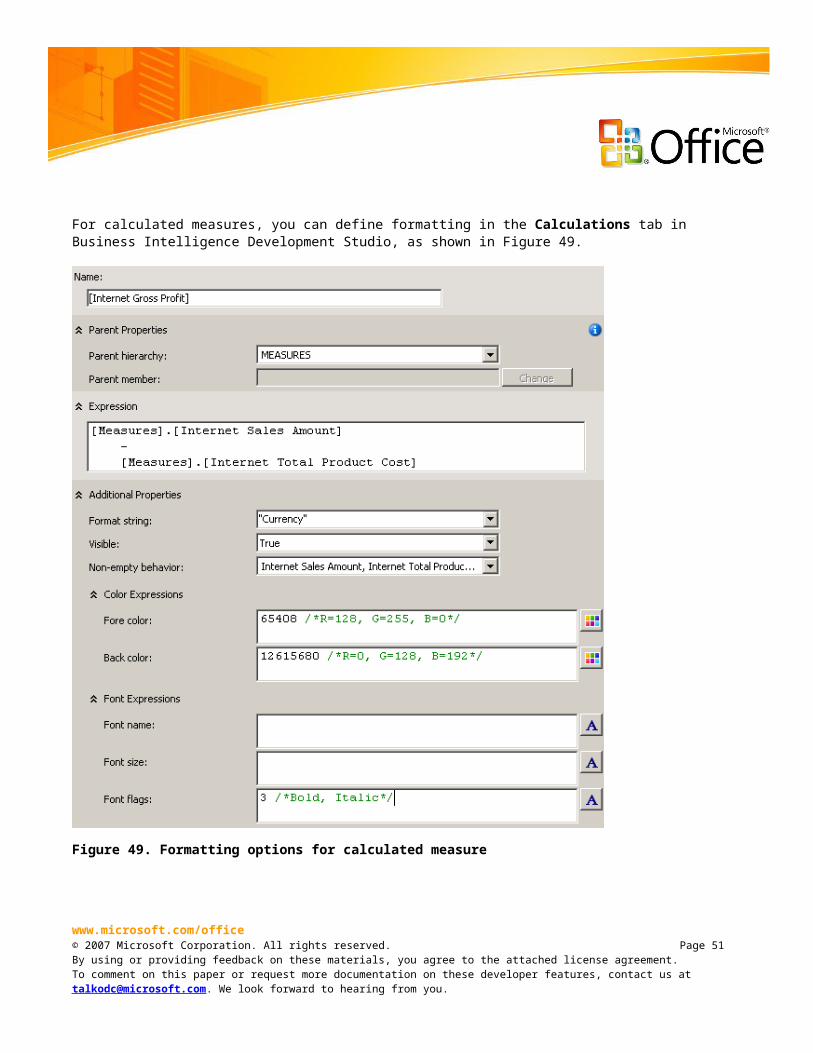
Figure 51. Setting the Calculation tab in Script View and adding the LANGUAGE property
For all calculations in which currency formatting is necessary, add the LANGUAGE property in addition to setting the FORMAT_STRING property to “Currency”.
The following example shows the script version of the calculation that is used in the previous example. Note that the LANGUAGE property is added at the end. In this case, the symbol for U.S. dollars is needed, so 1033 (U.S. English) is set as the language identification. For more information about language identifiers in the 2007 Microsoft Office system, see the Related Links section.
CREATE MEMBER CURRENTCUBE.[Measures].[Internet Gross Profit]
AS
[Measures].[Internet Sales Amount]
-
[Measures].[Internet Total Product Cost],
FORMAT_STRING = "Currency",
BACK_COLOR = 12615680 /*R=0, G=128, B=192*/,
FORE_COLOR = 65408 /*R=128, G=255, B=0*/,
www.microsoft.com/office© 2007 Microsoft Corporation. All rights reserved. Page 51By using or providing feedback on these materials, you agree to the attached license agreement.To comment on this paper or request more documentation on these developer features, contact us at [email protected]. We look forward to hearing from you.
FONT_FLAGS = 3 /*Bold, Italic*/,
NON_EMPTY_BEHAVIOR = { [Internet Sales Amount],
[Internet Total Product Cost] },
VISIBLE = 1,
LANGUAGE = 1033;
Key Performance Indicators
A new feature in SQL Server 2005 Analysis Services is the addition of Key Performance Indicators (KPIs) for easily tracking business metrics.
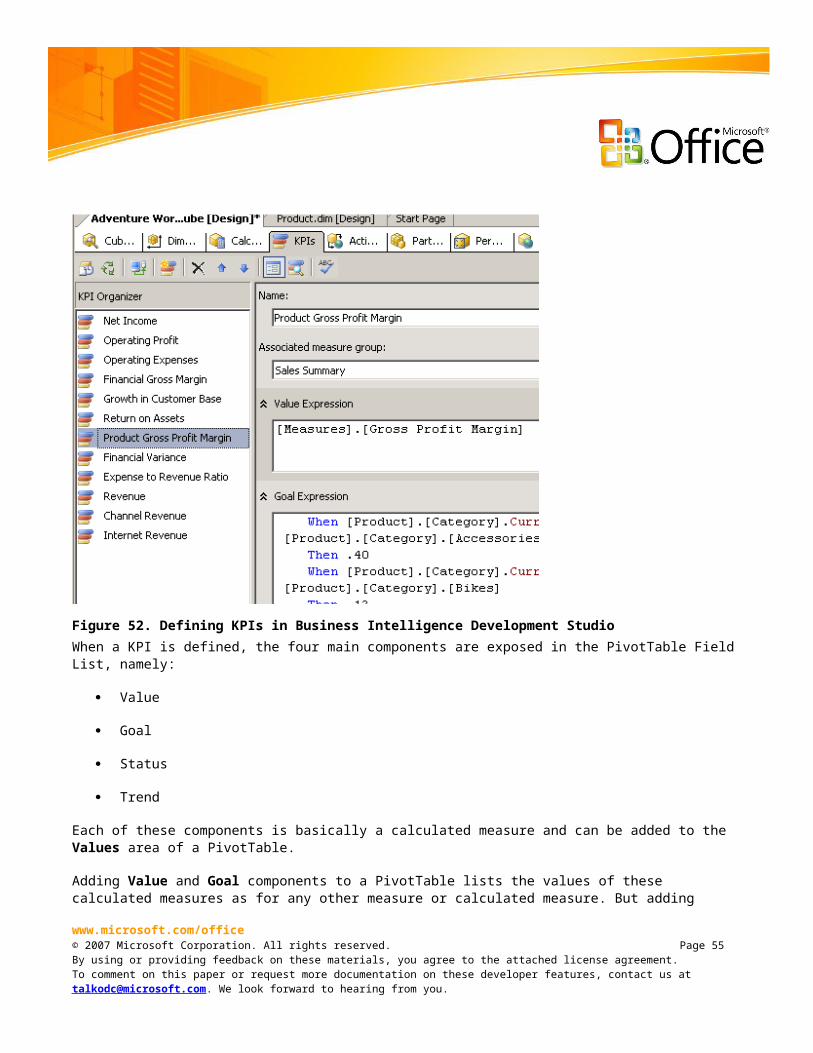
KPIs that are defined in Analysis Services are exposed in the PivotTable Field List in Office Excel 2007. KPIs are defined on the KPI tab in Business Intelligence Development Studio, as illustrated in Figure 52.
Figure 52. Defining KPIs in Business Intelligence Development Studiowww.microsoft.com/office© 2007 Microsoft Corporation. All rights reserved. Page 52By using or providing feedback on these materials, you agree to the attached license agreement.To comment on this paper or request more documentation on these developer features, contact us at [email protected]. We look forward to hearing from you.
When a KPI is defined, the four main components are exposed in the PivotTable Field List, namely:
Value
Goal
Status
Trend
Each of these components is basically a calculated measure and can be added to the Values area of a PivotTable.
Adding Value and Goal components to a PivotTable lists the values of these calculated measures as for any other measure or calculated measure. But adding Status and Trend components to a PivotTable displays a graphic in the PivotTable instead of the value. Excel reads the proposed graphic (status indicator) defined on the server and maps it to the closest available graphic in Excel conditional formatting (see Figure 53).
www.microsoft.com/office© 2007 Microsoft Corporation. All rights reserved. Page 53By using or providing feedback on these materials, you agree to the attached license agreement.To comment on this paper or request more documentation on these developer features, contact us at [email protected]. We look forward to hearing from you.
Figure 53. Setting Status and Trend graphic indicators
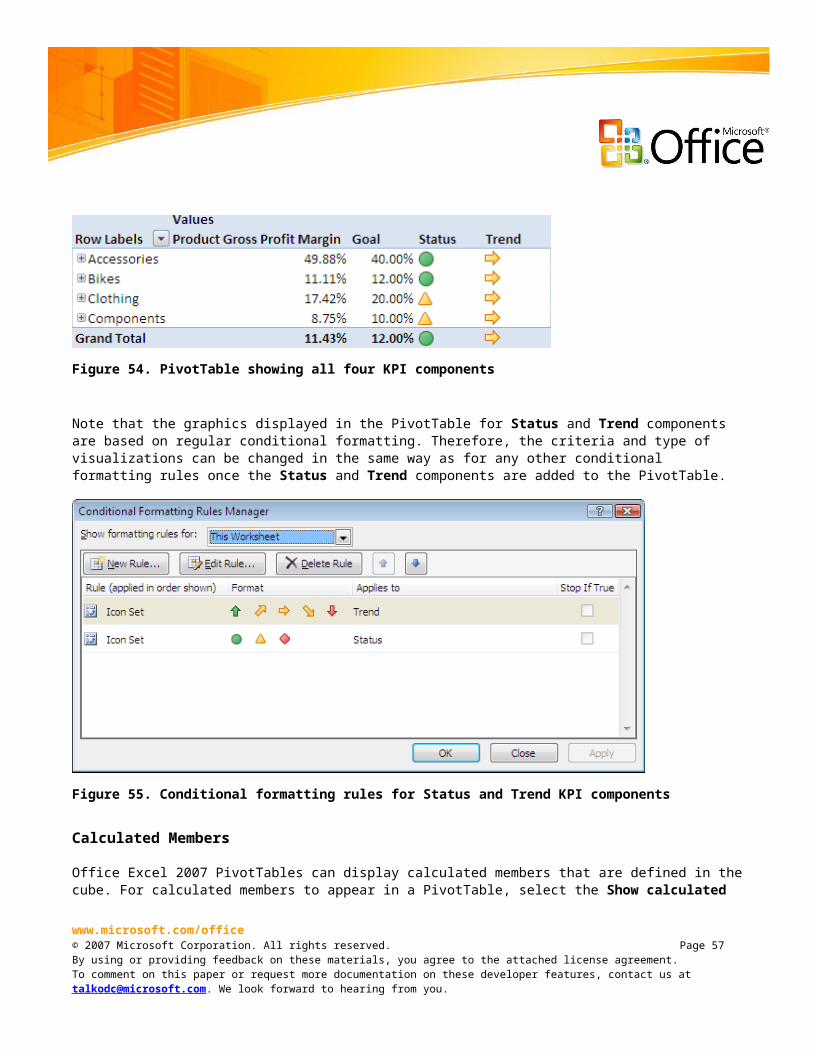
Figure 54 shows an example of a PivotTable with the four KPI components added.
Figure 54. PivotTable showing all four KPI components
www.microsoft.com/office© 2007 Microsoft Corporation. All rights reserved. Page 54By using or providing feedback on these materials, you agree to the attached license agreement.To comment on this paper or request more documentation on these developer features, contact us at [email protected]. We look forward to hearing from you.
Note that the graphics displayed in the PivotTable for Status and Trend components are based on regular conditional formatting. Therefore, the criteria and type of visualizations can be changed in the same way as for any other conditional formatting rules once the Status and Trend components are added to the PivotTable.
Figure 55. Conditional formatting rules for Status and Trend KPI components
Calculated Members
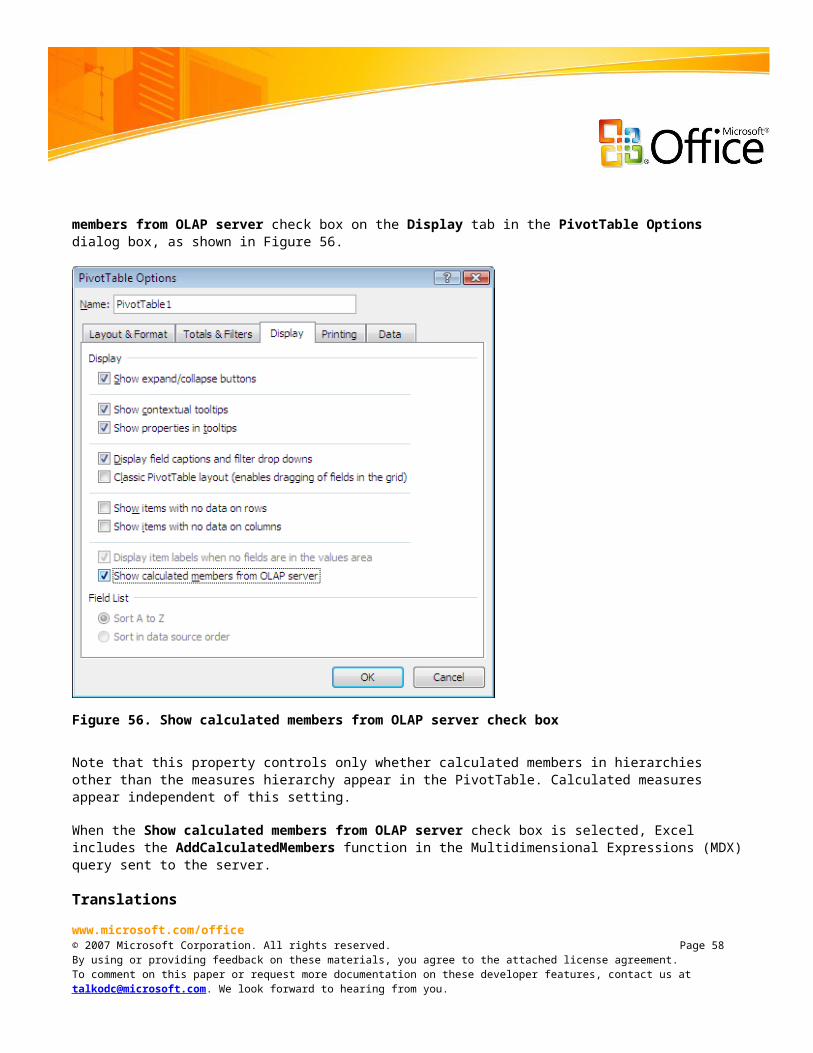
Office Excel 2007 PivotTables can display calculated members that are defined in the cube. For calculated members to appear in a PivotTable, select the Show calculated members from OLAP server check box on the Display tab in the PivotTable Options dialog box, as shown in Figure 56.
www.microsoft.com/office© 2007 Microsoft Corporation. All rights reserved. Page 55By using or providing feedback on these materials, you agree to the attached license agreement.To comment on this paper or request more documentation on these developer features, contact us at [email protected]. We look forward to hearing from you.
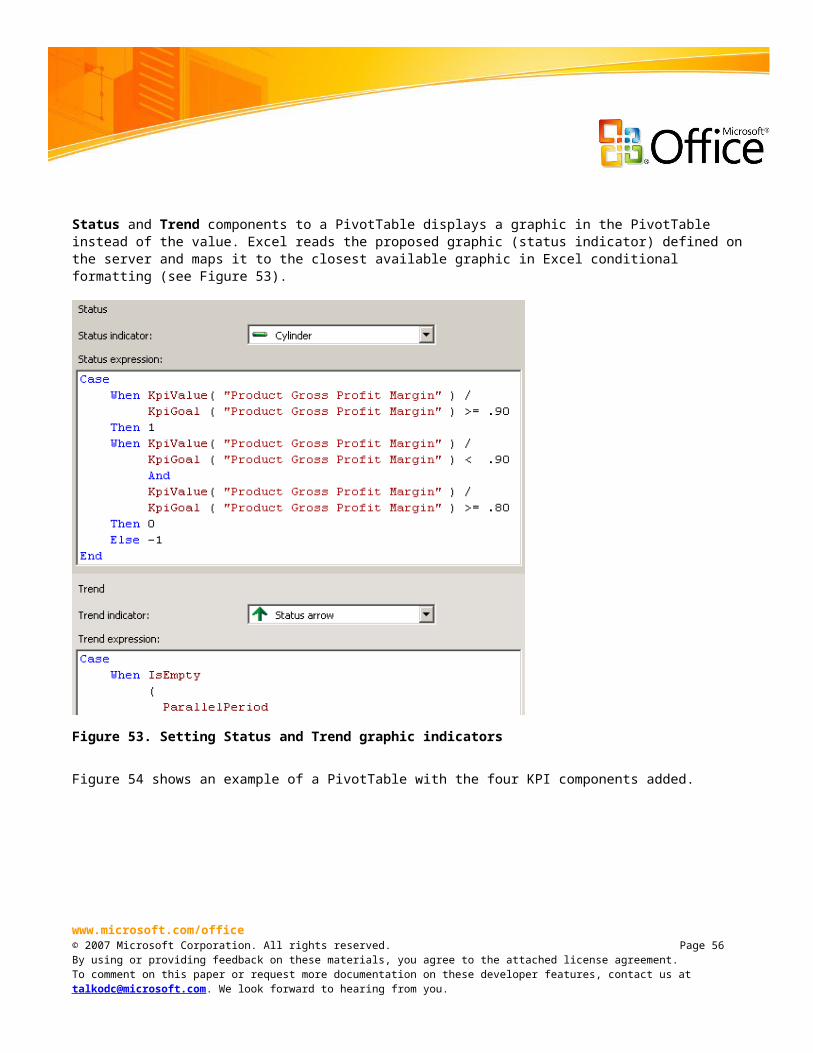
Figure 56. Show calculated members from OLAP server check box
Note that this property controls only whether calculated members in hierarchies other than the measures hierarchy appear in the PivotTable. Calculated measures appear independent of this setting.
When the Show calculated members from OLAP server check box is selected, Excel includes the AddCalculatedMembers function in the Multidimensional Expressions (MDX) query sent to the server.
Translations
SQL Server 2005 Analysis Services introduces a new feature called translations. With translations, you can now have multiple languages available to end users for dimensions, hierarchies, levels, members, and more.www.microsoft.com/office© 2007 Microsoft Corporation. All rights reserved. Page 56By using or providing feedback on these materials, you agree to the attached license agreement.To comment on this paper or request more documentation on these developer features, contact us at [email protected]. We look forward to hearing from you.
If the Microsoft Office display language exists as a translation on the server, Excel automatically retrieves information from the server in that language.
You can configure whether Excel will retrieve translations in the Connection Properties dialog box for the connection to the server. To receive translations, select the Retrieve data and errors in the Office display language when available check box under the Language section of the Usage tab, as illustrated in Figure 57.
Figure 57. Setting for retrieving translations from the OLAP server
www.microsoft.com/office© 2007 Microsoft Corporation. All rights reserved. Page 57By using or providing feedback on these materials, you agree to the attached license agreement.To comment on this paper or request more documentation on these developer features, contact us at [email protected]. We look forward to hearing from you.
If you need a specific translation, regardless of the Office display language, you can obtain the translation by adding a property in the Office Data Connection (ODC) file representing the server with the OLAP cube.
The default connection string section of the ODC file looks like this:
<odc:ConnectionString>Provider=MSOLAP.3;Integrated Security=SSPI;Persist Security Info=True;Data Source=MyOLAPServer;Initial Catalog=Adventure Works DW</odc:ConnectionString>
By adding an additional property, namely Locale Identifier, you can set the retrieved translations to a certain language. In the following example, Spanish is requested by adding Locale Identifier=3082.
<odc:ConnectionString>Provider=MSOLAP.3;Integrated Security=SSPI;Persist Security Info=True;Data Source= MyOLAPServer;Initial Catalog=Adventure Works DW;
Locale Identifier=3082</odc:ConnectionString>
In the example in Figure 58, the first PivotTable is retrieving the translations in the Office display language, which, in this case, is English.
www.microsoft.com/office© 2007 Microsoft Corporation. All rights reserved. Page 58By using or providing feedback on these materials, you agree to the attached license agreement.To comment on this paper or request more documentation on these developer features, contact us at [email protected]. We look forward to hearing from you.
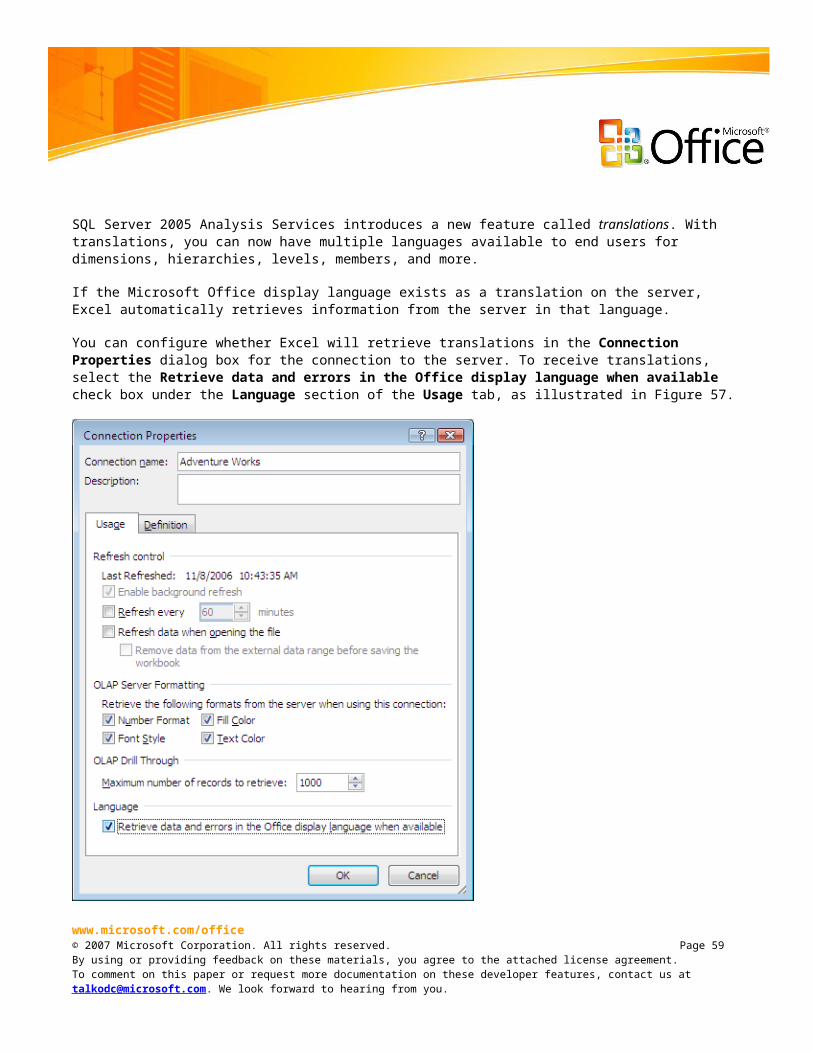
Figure 58. PivotTable displaying English translations from the OLAP server
The PivotTable shown in Figure 59 is retrieving Spanish translations as specified in the ODC file.
Figure 59. PivotTable displaying Spanish translations from the OLAP server
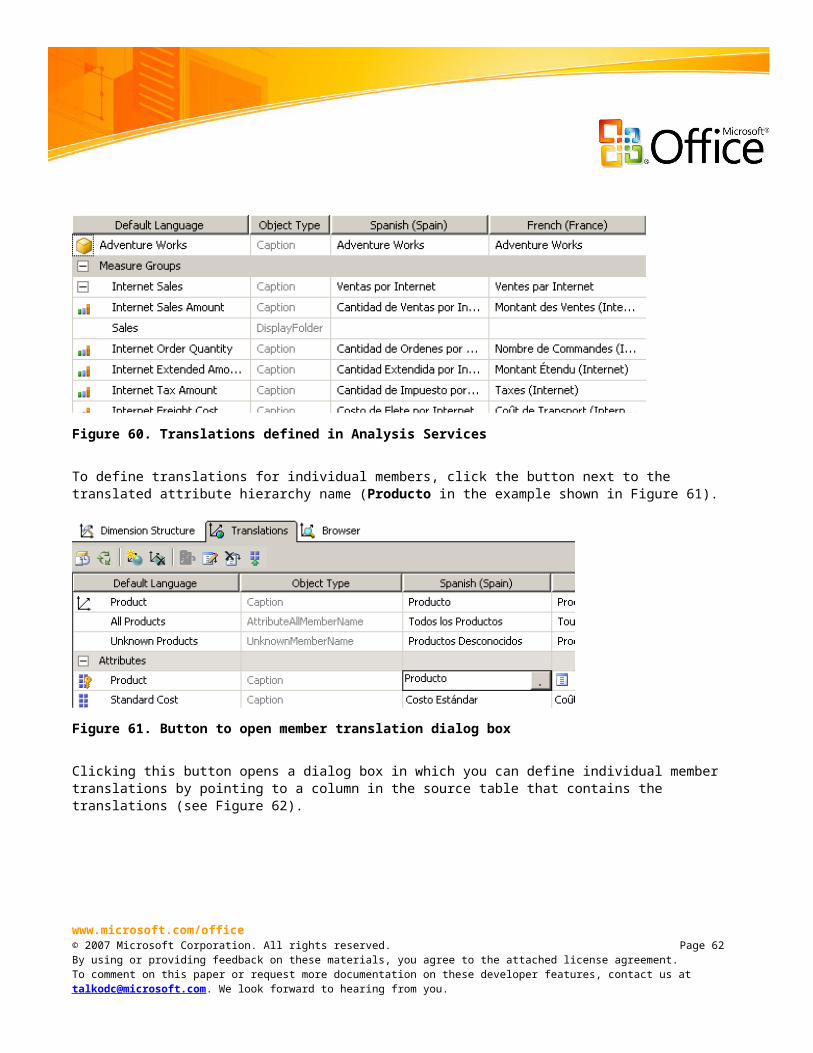
You can set translations for dimensions, hierarchies, and levels on the general Translations tab in Business Intelligence Development Studio, as illustrated in Figure 60.
www.microsoft.com/office© 2007 Microsoft Corporation. All rights reserved. Page 59By using or providing feedback on these materials, you agree to the attached license agreement.To comment on this paper or request more documentation on these developer features, contact us at [email protected]. We look forward to hearing from you.
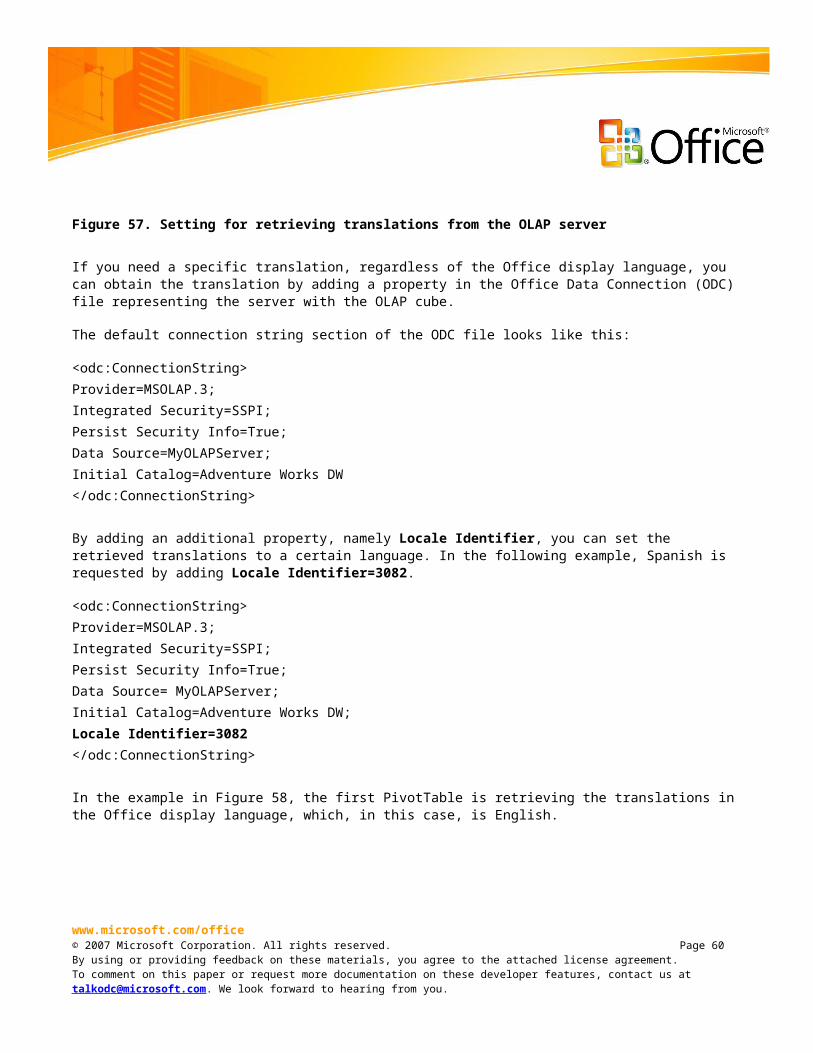
Figure 60. Translations defined in Analysis Services
To define translations for individual members, click the button next to the translated attribute hierarchy name (Producto in the example shown in Figure 61).
Figure 61. Button to open member translation dialog box
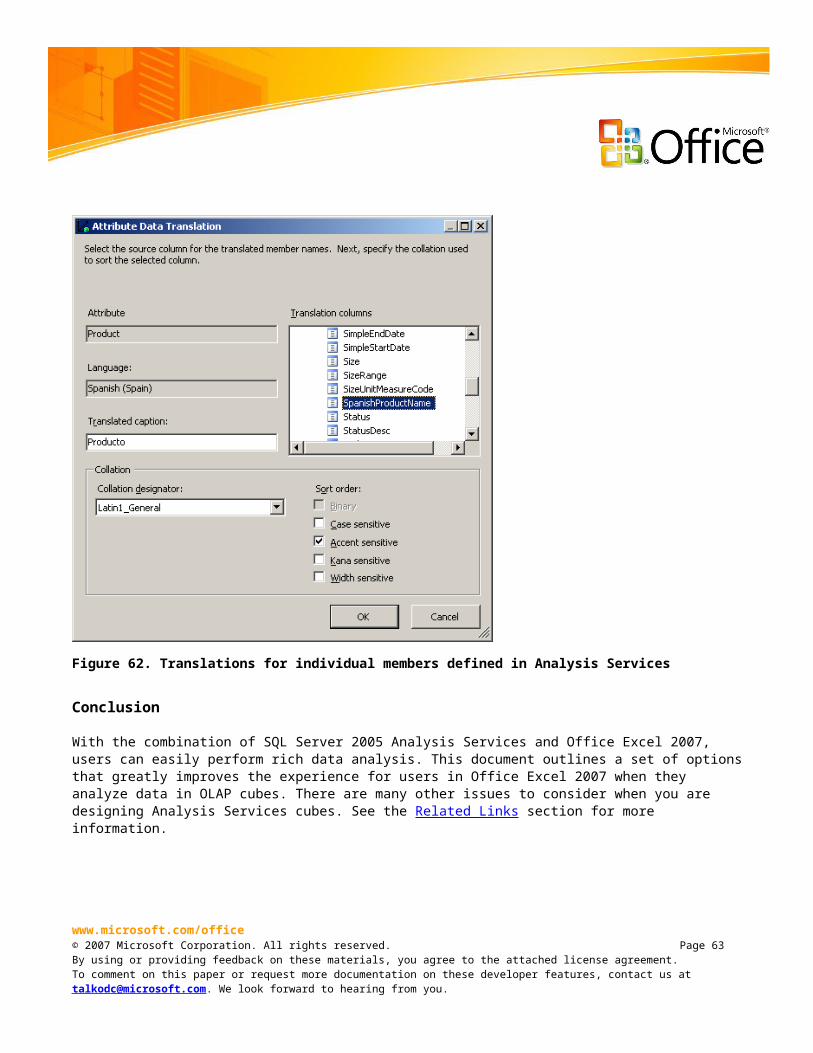
Clicking this button opens a dialog box in which you can define individual member translations by pointing to a column in the source table that contains the translations (see Figure 62).
www.microsoft.com/office© 2007 Microsoft Corporation. All rights reserved. Page 60By using or providing feedback on these materials, you agree to the attached license agreement.To comment on this paper or request more documentation on these developer features, contact us at [email protected]. We look forward to hearing from you.
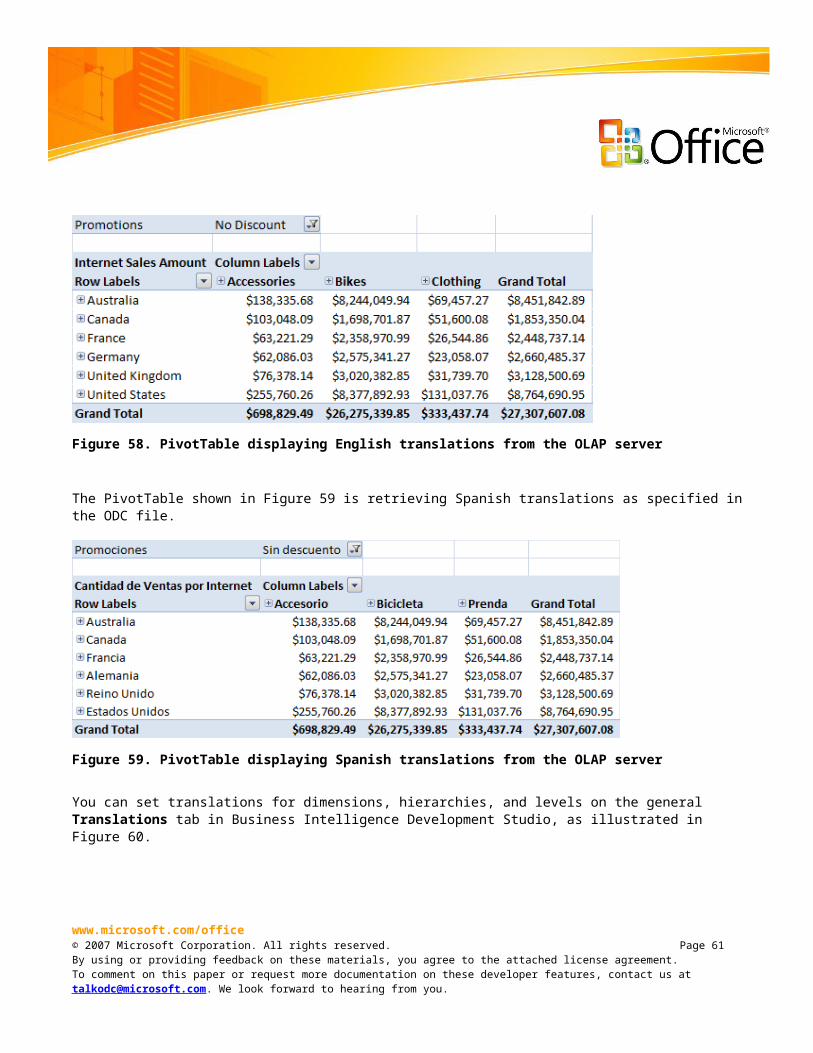
Figure 62. Translations for individual members defined in Analysis Services
Conclusion
With the combination of SQL Server 2005 Analysis Services and Office Excel 2007, users can easily perform rich data analysis. This document outlines a set of options that greatly improves the experience for users in Office Excel 2007 when they analyze data in OLAP cubes. There are many other issues to consider when you are designing Analysis Services cubes. See the Related Links section for more information.
www.microsoft.com/office© 2007 Microsoft Corporation. All rights reserved. Page 61By using or providing feedback on these materials, you agree to the attached license agreement.To comment on this paper or request more documentation on these developer features, contact us at [email protected]. We look forward to hearing from you.
Related Links
Although this document focuses on how to take advantage of OLAP server features by using Excel PivotTables, Office Excel 2007 also includes many new capabilities and improvements in other areas.
For more information about Office Excel 2007:http://office.microsoft.com/excel
For more information about Microsoft SQL Server 2005 Analysis Services:http://www.microsoft.com/sql/technologies/analysis/default.mspx
For more information about Office Excel 2007 PivotTable dynamic views:http://office.microsoft.com/en-us/excel/HP101773841033.aspx
Another good resource for information about Office Excel 2007 is the Excel blog:http://blogs.msdn.com/excel/
For a TechNet webcast, "Office Excel 2007 and SQL Server 2005 Analysis Services Integration Explained" (Level 200):http://msevents.microsoft.com/cui/WebCastEventDetails.aspx?EventID=1032299077&EventCategory=5&culture=en-US&CountryCode=US
For more information about language identifiers in the 2007 Office system: http://technet2.microsoft.com/Office/en-us/library/f5fee727-df49-4ef7-b073-dd6c08dfecfa1033.mspx?mfr=true
www.microsoft.com/office© 2007 Microsoft Corporation. All rights reserved. Page 62By using or providing feedback on these materials, you agree to the attached license agreement.To comment on this paper or request more documentation on these developer features, contact us at [email protected]. We look forward to hearing from you.
The information contained in this document represents the current view of Microsoft Corporation on the issues discussed as of the date of publication. Because Microsoft must respond to changing market conditions, it should not be interpreted to be a commitment on the part of Microsoft, and Microsoft cannot guarantee the accuracy of any information presented after the date of publication.This white paper is for informational purposes only. MICROSOFT MAKES NO WARRANTIES, EXPRESS OR IMPLIED, IN THIS DOCUMENT.Complying with all applicable copyright laws is the responsibility of the user. Without limiting the rights under copyright, no part of this document may be reproduced, stored in, or introduced into a retrieval system, or transmitted in any form or by any means (electronic, mechanical, photocopying, recording, or otherwise), or for any purpose, without the express written permission of Microsoft Corporation.Microsoft may have patents, patent applications, trademarks, copyrights, or other intellectual property rights covering subject matter in this document. Except as expressly provided in any written license agreement from Microsoft, the furnishing of this document does not give you any license to these patents, trademarks, copyrights, or other intellectual property.© 2007 Microsoft Corporation. All rights reserved.The example companies, organizations, products, domain names, e-mail addresses, logos, people, places, and events depicted herein are fictitious. No association with any real company, organization, product, domain name, e-mail address, logo, person, place, or event is intended or should be inferred. Microsoft, Excel, Fluent, the Office logo, PivotTable and SQL Server are either registered trademarks or trademarks of Microsoft Corporation in the United States and/or other countries.The names of actual companies and products mentioned herein may be the trademarks of their respective owners.
www.microsoft.com/office© 2007 Microsoft Corporation. All rights reserved. Page 63By using or providing feedback on these materials, you agree to the attached license agreement.To comment on this paper or request more documentation on these developer features, contact us at [email protected]. We look forward to hearing from you.