Embed Size (px)
Citation preview

Level 3 Writing
Bar Charts / Line Graphs
Part 1
Timed Writing Exam Task 1 Preparation
Your Timed Writing Exam is in Week 7. Get ready!
For the exam, you will have to write an essay and a report. These notes are only about the report.
For the report, you will have to write about a bar chart or line graph in just 20 minutes.
You will have to write at least 150 words.
Name: __________________________________ ID: __________________
Section: ____________________ Teacher: ___________________________

BAR CHART/ LINE GRAPHThe line graph and bar chart below both show the same data; for costs of three utilities over a 20 year period. Look at them carefully and then look at the report on the next page.
0891 5891 0991 5991 00020
02
04
06
08
001
021
041
niA lA ni sei itli tU fo tsoC ylhtnoM egarevA
yitcirtcelEretaW
noisiveleT elbaC
shD
EAU
1
1980 1985 1990 1995 20000
20
40
60
80
100
120
140
160
Average Monthly Cost of Uitliites in Al Ain
ElectricityWaterCable TV
UAE
Dhs

Analysing a report1) Gapfill:Look at the line graph or bar chart on the previous page. Use information from the page to complete the gaps in this report.
2) Paragraph organisation
The bar chart shows the average cost per month of _____________,
_____________ and cable television in Al Ain from 1980 to 2000 in UAE Dhs. As an
overall trend, the cost of both _____________ and _____________ _____________
rose, while the cost of _____________ fell over the 20 year period.
1.______________________
2.______________________
3._________/____________
4.______________________
Looking at the average monthly cost of _____________, it is clear to see that it
increased over the 20 years. In _______, it stood at about 70 Dhs. Then, from 1980
to _______ it increased slightly to 80 Dhs. From 1985 to __________ the cost of
electricity fell moderately to approximately _____________ Dhs, which was the
lowest figure in the 20 years. After that, it rose dramatically to just under
_____________ Dhs in 2000.
1.______________________
______________________
2.______________________
______________________
______________________
______________________
Similarly, the cost of ___________ _________ went up during the same 20 years.
It stood at just over _________ Dhs in 1980. Following this, it increased steadily to
approximately _________ Dhs in 1990. Between 1990 and __________ the average
monthly cost of cable television remained constant. Finally, there was a moderate
rise in costs to slightly over __________ Dhs in 2000, which was the highest in the
20 years.
1.______________________
______________________
2.______________________
______________________
______________________
______________________
Unlike the cost of ___________ and ___________ ___________, there was an
overall decrease in the cost of ___________. It started at 20 Dhs in ________, after
which it rose steadily to just over __________ Dhs in 1985. From __________ to
1995 the monthly cost of water fluctuated up to a peak of slightly under _________
Dhs. Finally, in __________, there was a moderate decrease in the cost of water to
just under 20 Dhs, which was the lowest figure in the 20 years.
1.______________________
______________________
______________________
2.______________________
______________________
______________________
______________________
2

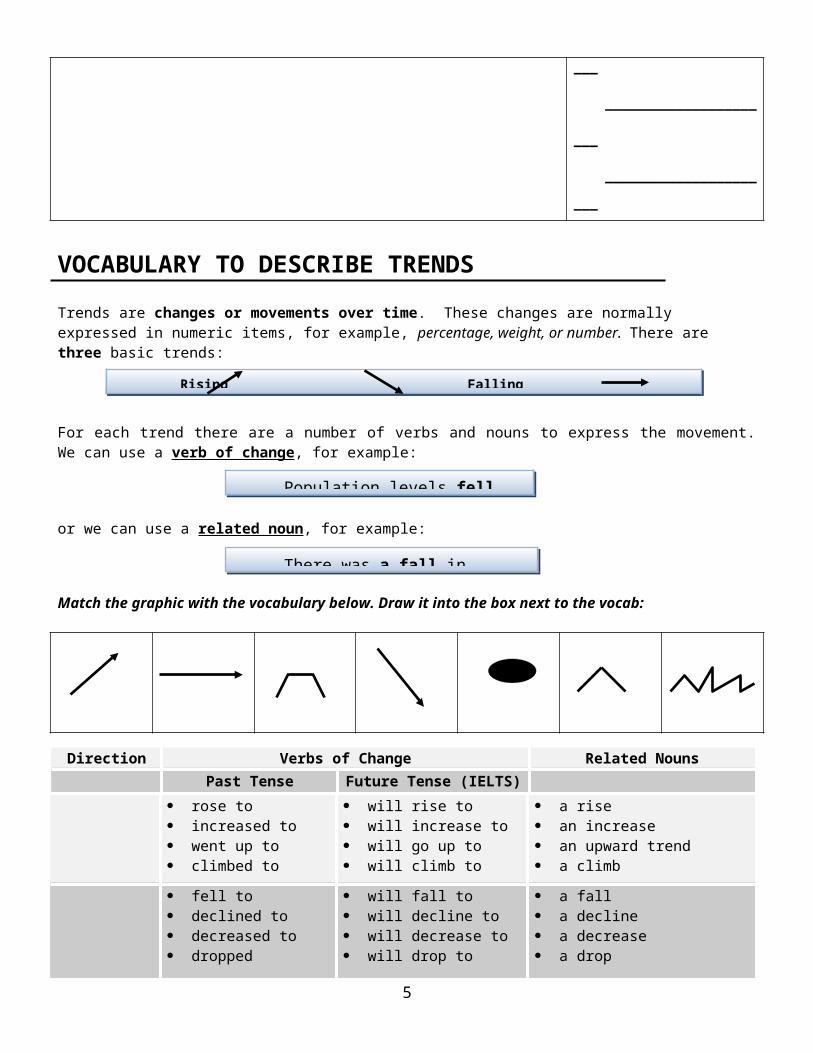
Trends are changes or movements over time. These changes are normally expressed in numeric items, for example, percentage, weight, or number. There are three basic trends:
For each trend there are a number of verbs and nouns to express the movement. We can use a verb of change, for example:
or we can use a related noun, for example:
Match the graphic with the vocabulary below. Draw it into the box next to the vocab:
Direction Verbs of Change Related NounsPast Tense Future Tense (IELTS)
rose to increased to went up to climbed to
will rise to will increase to will go up to will climb to
a rise an increase an upward trend a climb
3
Population levels fell.
There was a fall in population.
Rising Falling Remaining the same
VOCABULARY TO DESCRIBE TRENDS

fell to declined to decreased to dropped went down to
will fall to will decline to will decrease to will drop to will go down to
a fall a decline a decrease a drop a reduction
leveled out at did not change remained steady at stayed constant at
will level out at will not change will remain steady at will stay constant at
a leveling out no change
fluctuated will fluctuate a fluctuation
peaked at will peak at a peak
plateaued at will plateau at a plateau
stood at (began at…)
will stand at
1. Complete the sentences below by filling in the correct adverb or adjective - look at the arrows to guide you.
4
We use ADVERBS (following the verb) to describe to what extent (how much) the verb of change happened.
USING ADVERBS TO EXPLAIN VERBS OF CHANGE
rapidlydramatically
sharply
steadilygradually
moderately
slightly
Al Ain’s population rose _______________ to 400,000 people by 2008.
The number of people living in rural areas of China decreased __________.
By 2008, the population of Dubai climbed ___________ to 1.4 million people.
2. We use ADJECTIVES (before the noun) to describe to what extent (how much) the related nouns happened.
a rapida dramatic
a sharp
a steadya gradual
a moderate
a slight
There was a __________ rise in Al Ain’s population to 400,000 people by 2008.
There was a __________ decrease in the number of people living in rural areas of China.
By 2008, there was a __________ climb in the population of Dubai to 1.4 million people.
You have the choice of two basic sentence structures to write about information in a chart or graph.
5
TYPES OF SENTENCES

1. Sentences using verbs of change
Sales increased slightly, to eight thousand dirhams in September.subject + verb + adverb + other important details
2. Sentences using nouns of change (noun verbs)
There was a slight increase in sales, to 8,000 dirhams in September. be + art.+ adj. +noun + subject + other important details verb
Verbs of change/ adverbs
Adjectives/ Related nouns
rose dramatically to
increased steadily to
climbed gradually to
__________________________
__________________________
__________________________
_______________________
_______________________
_______________________
_______________________
_______________________
there was a sharp fall to
there was a dramatic decline
there was a slight decrease
there was a sudden drop
there was a steady reduction
fluctuated (upwards)
fluctuated (downwards)
__________________________
__________________________
_______________________
_______________________
there was a leveling out at
there was no change
_______________________ there was a peak
6
Practice changing these verbs of change and adverbs into adjectives and related nouns.

Listen and draw the line for each chart:
Graph A – Number of cars
1970 1980 1990 2000
Graph B – Number of cars
1970 1980 1990 2000
Graph C – Number of cars
1970 1980 1990 2000
Graph D – Number of cars
1970 1980 1990 2000
Graph E – Number of cars
1970 1980 1990 2000
Graph F – Number of cars
1970 1980 1990 2000
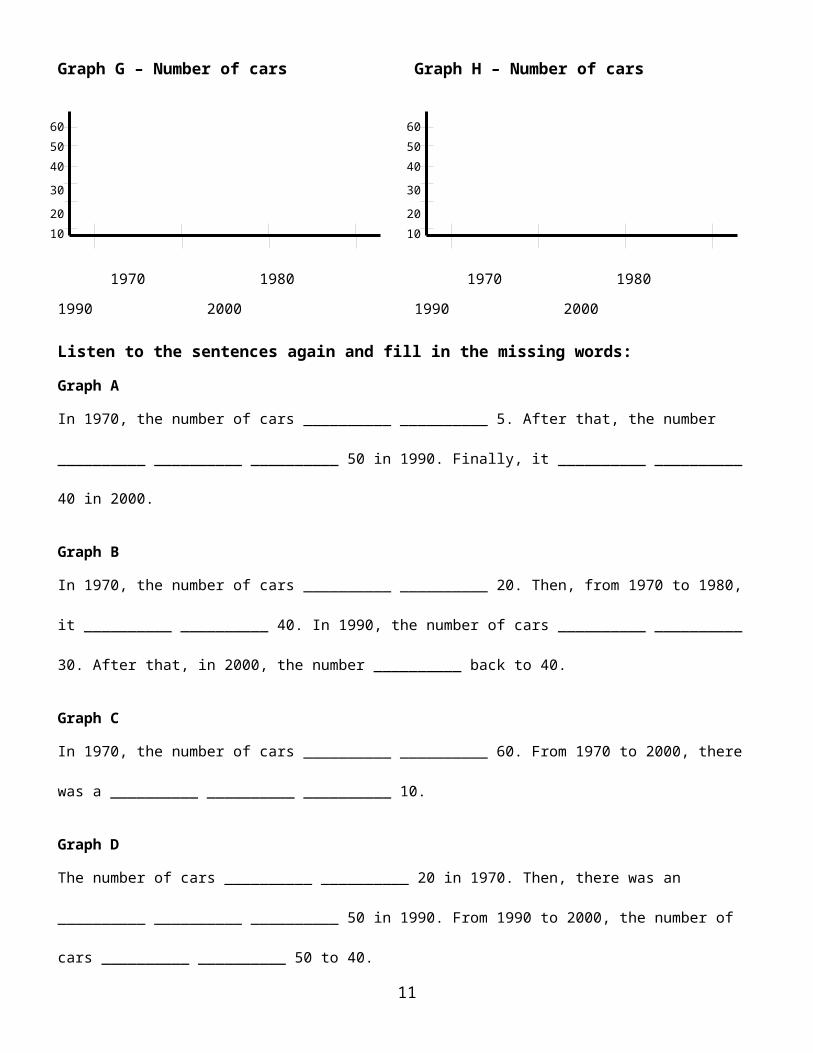
Graph G – Number of cars Graph H – Number of cars
7
605040
30
2010
605040
30
2010
605040
30
2010
605040
30
2010
605040
30
2010
605040
30
2010
605040
30
2010
605040
30
2010

1970 1980 1990 2000 1970 1980 1990 2000
Listen to the sentences again and fill in the missing words:
Graph A
In 1970, the number of cars __________ __________ 5. After that, the number __________ __________
__________ 50 in 1990. Finally, it __________ __________ 40 in 2000.
Graph B
In 1970, the number of cars __________ __________ 20. Then, from 1970 to 1980, it __________
__________ 40. In 1990, the number of cars __________ __________ 30. After that, in 2000, the number
__________ back to 40.
Graph C
In 1970, the number of cars __________ __________ 60. From 1970 to 2000, there was a __________
__________ __________ 10.
Graph D
The number of cars __________ __________ 20 in 1970. Then, there was an __________ __________
__________ 50 in 1990. From 1990 to 2000, the number of cars __________ __________ 50 to 40.
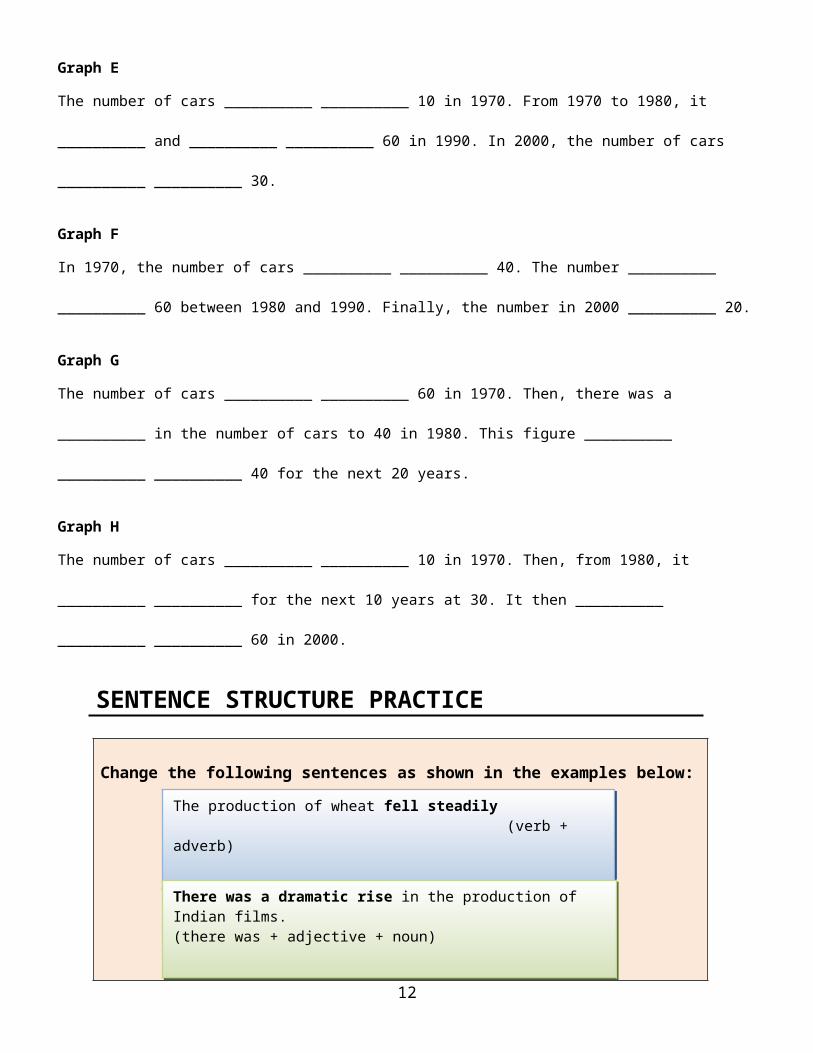
Graph E
The number of cars __________ __________ 10 in 1970. From 1970 to 1980, it __________ and
__________ __________ 60 in 1990. In 2000, the number of cars __________ __________ 30.
Graph F
In 1970, the number of cars __________ __________ 40. The number __________ __________ 60
between 1980 and 1990. Finally, the number in 2000 __________ 20.
Graph G
The number of cars __________ __________ 60 in 1970. Then, there was a __________ in the number of
cars to 40 in 1980. This figure __________ __________ __________ 40 for the next 20 years.
Graph H
8

The number of cars __________ __________ 10 in 1970. Then, from 1980, it __________ __________ for
the next 10 years at 30. It then __________ __________ __________ 60 in 2000.
SENTENCE STRUCTURE PRACTICE
Change the following sentences as shown in the examples below:
a) Exports from Africa fluctuated dramatically throughout the period.
b) The development of new products fell gradually during the two year period.
c) The price of petrol dropped significantly in Sydney between 2007 and 2008.
d) The price of goods in the UAE increased slowly over the last ten months.
e) The average temperature in Abu Dhabi rose steeply between June and August.
f) There was a rapid rise in the price of food in third world countries.
g) There was a steady increase in the number of tourists visiting Dubai.
9
The production of wheat fell steadily (verb + adverb)
There was a steady fall in the production of wheat.(there was a + adjective + noun)
There was a dramatic rise in the production of Indian films.(there was + adjective + noun)
The production of Indian films rose dramatically. (verb + adverb)
Change the following from (verb + adverb) to (there was a + adjective + noun)
Change the following from (there was a + adjective + noun) to (verb + adverb)

h) There was a gradual decline in the export of fruit from Jordan over the period.
i) There was a sudden drop in Syria’s water supplies in 2007.
Average monthly cost of utilities in Al Ain: Model answer
The bar chart shows the average cost per month of electricity, water and cable television in
Al Ain from 1980 to 2000 in UAE Dhs. As an overall trend, the cost of both electricity and cable
television rose, while the cost of water fell over the 20 year period.
Looking at the average monthly cost of electricity, it is clear to see that it increased over the
20 years. In 1980, it stood at about 70 Dhs. Then, from 1980 to 1985 it increased slightly to 80
Dhs. From 1985 to 1990 the cost of electricity fell moderately to approximately 50 Dhs, which was
the lowest figure in the 20 years. After that, it rose dramatically to just under 140 Dhs in 2000.
Similarly, the cost of cable television went up during the same 20 years. It stood at just over
40 Dhs in 1980. Following this, it increased steadily to approximately 75 Dhs in 1990. Between
1990 and 1995 the average monthly cost of cable television remained constant. Finally, there was
a moderate rise in costs to slightly over 100 Dhs in 2000, which was the highest in the 20 years.
Unlike the cost of electricity and cable television, there was an overall decrease in the cost
of water. It started at 20 Dhs in 1980, after which it rose steadily to just over 40 Dhs in 1985. From
1985 to 1995 the monthly cost of water fluctuated up to a peak of slightly under 60 Dhs. Finally, in
2000, there was a moderate decrease in the cost of water to just under 20 Dhs, which was the
lowest figure in the 20 years.
10
Analysing a report ANSWERS1) Gapfill:Look at the line graph or bar chart on the previous page. Use information from the page to complete the gaps in this report.
2) Paragraph organisation
The bar chart shows the average cost per month of electricity, water and cable
television in Al Ain from 1980 to 2000 in UAE Dhs. As an overall trend, the cost of
both electricity and cable television rose, while the cost of water fell over the 20 year
period.
1 graph/chart
2 what
3 when/where
4 overview of trends
Looking at the average monthly cost of electricity, it is clear to see that it
increased over the 20 years. In 1980 it stood at about 70 Dhs. Then, from 1980 to
1985 it increased slightly to 80 Dhs. From 1985 to 1990 the cost of electricity fell
moderately to approximately 50 Dhs, which was the lowest figure in the 20 years.
After that, it rose dramatically to just under 140 Dhs in 2000.
1Introduce topic
overview info again
2 Description
start
changes
end
Similarly, the cost of cable television went up during the same 20 years. It stood at
just over 40 Dhs in 1980. Following this, it increased steadily to approximately 75
Dhs in 1990. Between 1990 and 1995 the average monthly cost of cable television
remained constant. Finally, there was a moderate rise in costs to slightly over 100
Dhs in 2000, which was the highest in the 20 years.
1Compare topic with Para 1
overview info again
2 Description
start
changes
end
Unlike the cost of electricity and cable television, there was an overall decrease
in the cost of water. It started at 20 Dhs in 1980, after which it rose steadily to just
over 40 Dhs in 1985. From 1985 to 1995 the monthly cost of water fluctuated up to a
peak of slightly under 60 Dhs. Finally, in 2000, there was a moderate decrease in
the cost of water to just under 20 Dhs, which was the lowest figure in the 20 years.
1Compare topic with Para 1
and Para 2
overview info again
2 Description
start
changes
end
11
Verb + Adverb to describe change: Answers
Al Ain’s population rose rapidly to 400,000 people by 2008.
The number of people living in rural areas of China decreased steadily.
By 2008, the population of Dubai climbed slightly to 1.4 million people.
Adjective + Noun to describe change: Answers
There was a rapid rise in Al Ain’s population to 400,000 people by 2008.
There was a steady decrease in the number of people living in rural areas of China.
By 2008, there was a slight climb in the population of Dubai to 1.4 million people.
Verbs of change/ adverbs
Adjectives/ Related nouns
rose dramatically to
increased steadily to
climbed gradually to
There was a dramatic rise to
There was a steady increase to
There was a gradual climb to
fell sharply to
declined dramatically to
decreased slightly to
dropped suddenly to
reduced steadily to
there was a sharp fall to
there was a dramatic decline
there was a slight decrease
there was a sudden drop
there was a steady reduction
fluctuated (upwards)
fluctuated (downwards)
There was an upwards fluctuation
There was a downwards fluctuation
leveled out at
did not change
there was a leveling out at
there was no change
peaked at there was a peak
12
Graph A Answers
In 1970, the number of cars stood at 5. After that, the number went up to 50 in 1990. Finally, it dropped to 40 in 2000.
Graph B
In 1970, the number of cars stood at 20. Then, from 1970 to 1980, it increased to 40. In 1990, the number of cars dropped to 30. After that, in 2000, the number rose back to 40.
Graph C
In 1970, the number of cars started at 60. From 1970 to 2000, there was a downwards fluctuation to 10.
Graph D
The number of cars stood at 20 in 1970. Then, there was an upward trend to 50 in 1990. From 1990 to 2000, the number of cars dropped from 50 to 40.
Graph E
The number of cars began at 10 in 1970. From 1970 to 1980, it increased and peaked at 60 in 1990. In 2000, the number of cars reduced to 30.
Graph F
In 1970, the number of cars began at 40. The number plateaued at 60 between 1980 and 1990. Finally, the number in 2000 was 20.
Graph G
The number of cars began at 60 in 1970. Then, there was a decline in the number of cars to 40 in 1980. This figure leveled out at 40 for the next 20 years.
Graph H
The number of cars started at 10 in 1970. Then, from 1980, it remained constant for the next 10 years at 30. It then fluctuated upwards to 60 in 2000.
13

Sentence structure Practice: Answers
a) Exports from Africa fluctuated dramatically throughout the period. There was a dramatic fluctuation in exports from Africa throughout the period.
b) The development of new products fell gradually during the two year period. There was a gradual fall in the development of new products during the two year period.
c) The price of petrol dropped significantly in Sydney between 2007 and 2008. There was a significant drop in the price of petrol in Sydney between 2007 and 2008.
d) The price of goods in the UAE increased slowly over the last ten months. There was a slow increase in the price of goods in the UAE over the last ten months.
e) The average temperature in Abu Dhabi rose steeply between June and August. There was a steep rise in the average temperature in Abu Dhabi between June and August.
f) There was a rapid rise in the price of food in third world countries. The price of food in third world countries rose rapidly.
g) There was a steady increase in the number of tourists visiting Dubai. The number of tourists visiting Dubai increased steadily.
h) There was a gradual decline in the export of fruit from Jordan over the period. The export of fruit from Jordan declined gradually over the period.
i) There was a sudden drop in Syria’s water supplies in 2007. Syria’s water supplies dropped suddenly in 2007.
14