Embed Size (px)
Citation preview
Algebra 1/Integrated I Grade Level Lesson PlanContext: Invasive Plants
Collaborators: Darin Gonzales, Diane Jones, Mandy Simpson
The focus of this context is to have students explore invasive plant spread through a simulator. Several important areas within the high school Idaho Content and Practice Standards can be addressed through this context.
Essential Question: The Bureau of Land Management has a budget of $7,000,000 to fight the spread of invasive weeds on Idaho’s public lands. How can they decide how to spend these funds?
Guiding Questions:
1. Which invasive weed spreads the fastest? How do you know? An investigation into this question would involve students informally collecting, representing, and analyzing univariate or bivariate data on the rate or amount of spread for each of the four plants. Students can be pressed to formally analyze data produced by the simulator, generating summary statistics for each plant, comparing these representations and statistics, and then drawing conclusions supported by evidence. Students can be pressed to work with univariate or bivariate data sets depending on the questions they ask or relationships they are interested in discovering, which connects to other domains in the standards, such as Number and Quantity or Functions.
2. Which weed spreads the fastest on all landscapes? Which weed spreads the fastest on a particular landscape? How do you know?
An investigation into this question could involve students collecting and analyzing bivariate categorical data, addressing a relatively new concept that is included in the Idaho Core Standards. When analyzing bivariate categorical data, students are asked to calculate and use joint, marginal, and conditional relative frequencies to make and justify claims about relationships in the data. This reinforces their proportional reasoning and skills learned in earlier grades and will help students access standards that address conditional probability in later grades.
3. How many simulations do we need to run before we can gain confidence in our claims?An investigation into this question drives discussions surrounding the standards that address sampling and inference in many secondary grades. Students will need to understand that different claims can be made depending on sampling processes and sample sizes, and the strength and generalizability of claims made about a sample or population greatly depend on the sampling processes.
4. How can you represent the data the simulator provides visually? When students attend to question 3 and begin to collect data, tables and spreadsheets are difficult tools to use for communication. Creating data displays help audiences see the patterns, trends, and relationships, which can then be modeled with mathematics to perhaps predict future outcomes. This allows students to focus on formulating an answer the essential question guiding this task. With this context, and depending on the questions students are investigating, those displays could include line plots, histograms, box plots, stacked bar graphs, or scatter plots.

5. How many cells could we reasonably expect to be filled with weeds if we run the simulator again (and again and again)?
Attempting to answer this question is really the culmination of the invasive species investigation. In order to answer this question, students need to understand the concepts of center and variability in data, and use information about their sampling processes, displays, and statistical summaries to make and justify their claims. The importance of using visual displays and statistical summaries to make claims is echoed in the Standards for Mathematical Practice 1, 3 and 4. Once students can formulate and justify claims to answer questions 4 and 5, they will be well-equipped to defend their invasive weed budget recommendations for the BLM.
SAMPLE LESSON PLAN:
Though a full range of High School standards can be targeted through use of this simulator, this sample lesson plan and instructional sequence targets the following:
HS-S.ID Summarize, represent, and interpret data on a single count or measurement variable.● S.ID.1 Represent data with plots on the real number line (dot plots, histograms, and box plots). ● S.ID.2 Use statistics appropriate to the shape of the data distribution to compare center
(median, mean) and spread (interquartile range, standard deviation) of two or more different data sets.
● S.ID.3 Interpret differences in shape, center, and spread in the context of the data sets, accounting for possible effects of extreme data points (outliers).
HS-S.ID Summarize, represent, and interpret data on two categorical and quantitative variables.● S.ID.5 Summarize categorical data for two categories in two-way frequency tables. Interpret
relative frequencies in the context of the data (including joint, marginal, and conditional relative frequencies). Recognize possible associations and trends in the data.
Before the Lesson Students can work individually or in groups, but they will need access to an electronic device that has internet access (e.g., smartphone, tablet, computer, etc.).
It may be possible that students are unfamiliar with invasive species and/or do not know the ecological and economical problems they they pose. Consider front-loading the investigation, perhaps with information similar to what is in this Slides Presentation. Then teachers can progress through the instructional sequence below.
Instructional Sequence (more detailed in the table below)
1. Which invasive weed spreads the fastest? How do you know? Students will experiment with the Invasive Weed Simulator in groups of 2-3 to discover which weed is growing the fastest.
2. Which weed spreads the fastest on all landscapes? Which weed spreads the fastest on a particular landscape? How do you know? Students will informally select which weed they believe is growing the fastest on all landscapes. Class will discuss their decisions and justify their reasoning. This allows the teacher to gather formative feedback on how students are thinking
about and gathering data.3. Using the weed they selected in (2), students will then need to determine the landscape on
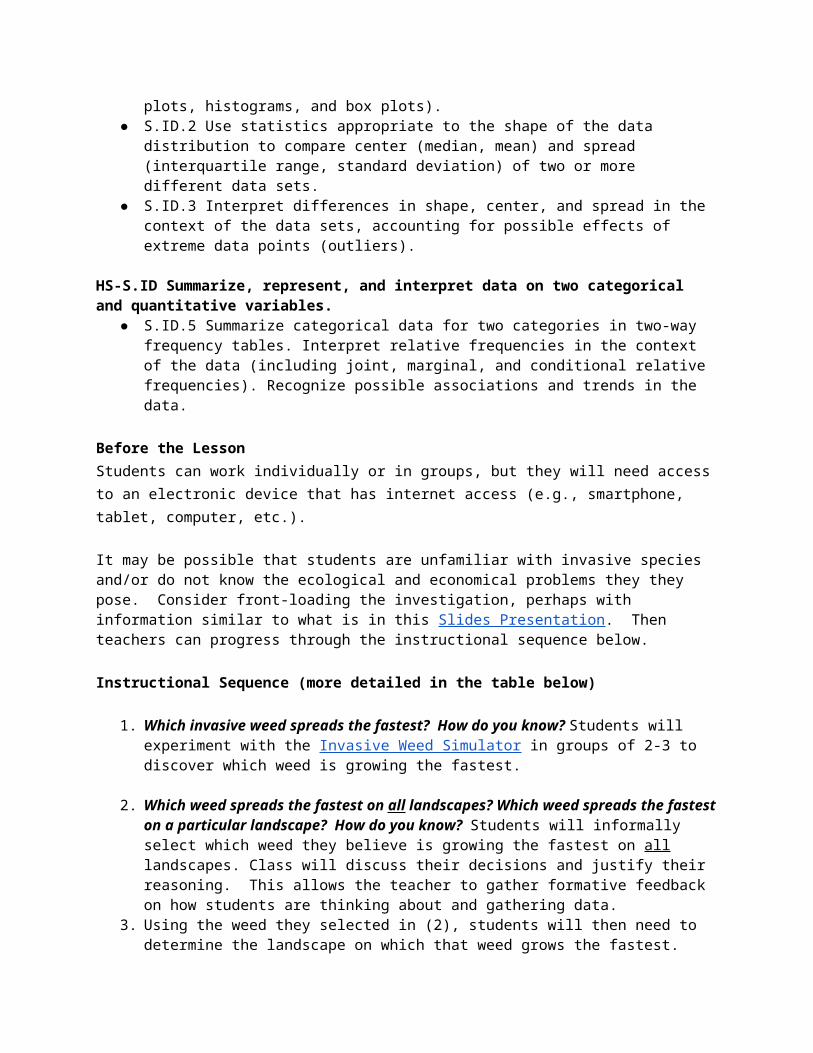
which that weed grows the fastest. This can be done informally or formally using this optional extension.Optional Extension: Students can use a two-way table to help them determine the landscape on which their selected weed is growing the fastest. Students can set up the margins of the table with landscapes as one category and number of cells filled as the other. Sample provided, but understand the bins used can be changed as deemed appropriate by the students. Conditional relative frequencies are shown (i.e. 60% of the simulations run on Rockland Ranch show Medusahead spreading to 21 or more cells.).
MEDUSAHEAD Number of Cells Filled on Year 5
Landscape
0-10 11-20 21-36 Totals
Rockland Ranch
110%
330%
660%
10
Freeland Prairie
110%
990%
00%
10
Borderville Farms
330%
770%
00%
10
Totals 5 19 6 30
4. How many simulations do we need to run before we can gain confidence in our claims? Students will discuss how many simulations they will need to run in order to make a claim about the data the simulator generates. Students will then run new simulations with the weed selected in (2) and the landscape they selected in (3). Students can choose the starting spot or let the simulator randomize that. If they choose the starting spot, suggest that every 3-5 simulations they choose a new starting spot. Have students record the number of cells filled with the weeds after 5 years for all simulations.
5. How can you represent the data the simulator provides visually? Students will construct a line plot using the data from year 5 to determine the average number of plots covered by the invasive weed. Discussion questions: From the display, can we see and describe a “center”? How can we describe the variability or the spread in the data?
6. How many cells could we reasonably expect to be filled with weeds if we run the simulator again (and again and again)? At this stage in the lesson, students should be pressed to think about how to calculate the measure of center of the data, and how to quantify the variability. Sample student work could be used to show students how to calculate the mean of the data set (if the mean is deemed an appropriate measure of center for their sample), and introduce the standard deviation as a measure of variability. In grades 6 & 7, students are exposed to the mean absolute deviation (MAD) as a measure of variability for univariate data, which conceptually and procedurally connects to the standard deviation.
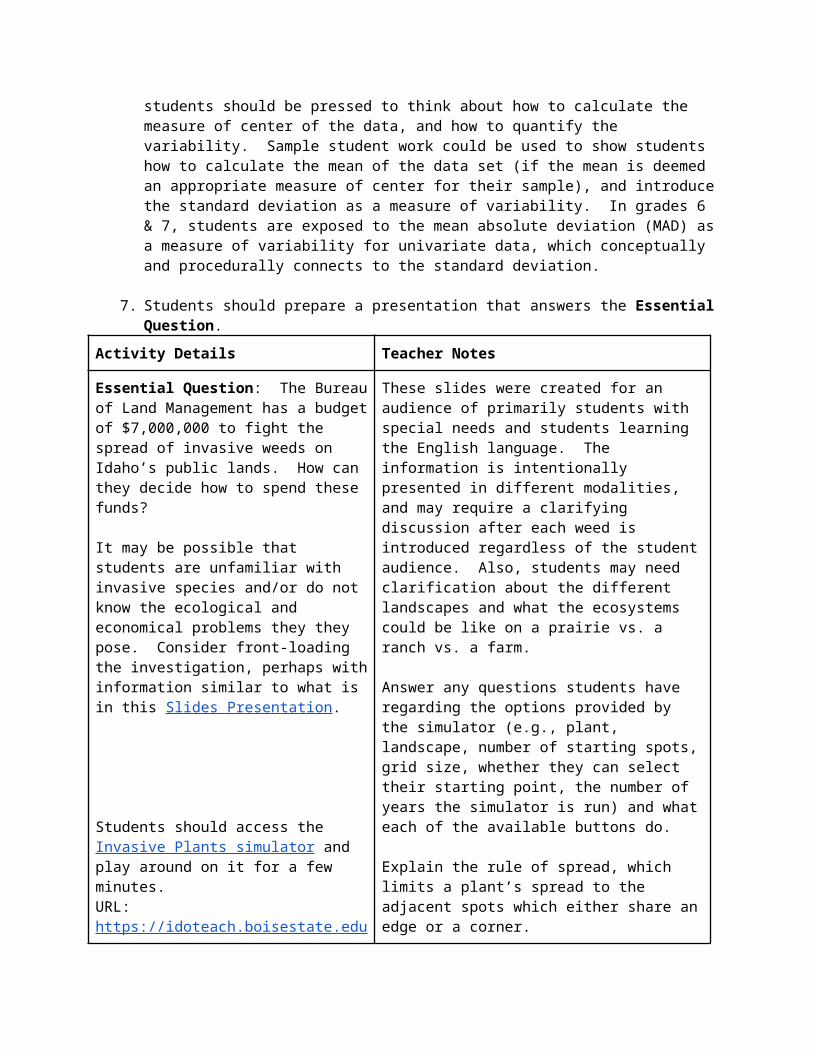
7. Students should prepare a presentation that answers the Essential Question.
Activity Details Teacher Notes
Essential Question: The Bureau of Land Management has a budget of $7,000,000 to fight the spread of invasive weeds on Idaho’s public lands. How can they decide how to spend these funds?
It may be possible that students are unfamiliar with invasive species and/or do not know the ecological and economical problems they they pose. Consider front-loading the investigation, perhaps with information similar to what is in this Slides Presentation.
Students should access the Invasive Plants simulator and play around on it for a few minutes.URL: https://idoteach.boisestate.edu/modal/invaders/
These slides were created for an audience of primarily students with special needs and students learning the English language. The information is intentionally presented in different modalities, and may require a clarifying discussion after each weed is introduced regardless of the student audience. Also, students may need clarification about the different landscapes and what the ecosystems could be like on a prairie vs. a ranch vs. a farm.
Answer any questions students have regarding the options provided by the simulator (e.g., plant, landscape, number of starting spots, grid size, whether they can select their starting point, the number of years the simulator is run) and what each of the available buttons do.
Explain the rule of spread, which limits a plant’s spread to the adjacent spots which either share an edge or a corner.
Without additional guidance, students should recognize that plants can’t spread to as many spots if they start at the corner or an edge, and they may begin to see even with a few simulations that some plants spread to more cells than others.
Pose the first Guiding Question: Which invasive weed spreads the fastest? How do you know?Students will experiment with the Invasive Weed Simulator in groups of 2-3 to discover which weed is growing the fastest.
“Students are collecting data and filling out a table with the number of grid squares during the 5 year growth. I am asking students if any plant is growing faster than another. Do
Teachers should gather information about the number of simulations students are running to make their claims. They should also note how students are formulating their claims: What are they keeping track of? Are they doing visual inspections or recording data? What does that data tell them? What patterns are they noticing?
Discussion of the guiding question to follow this experimentation time.
they see any patterns in the growth based on a certain landscape?”
Pose the second Guiding Question: Which weed spreads the fastest on all landscapes?Students will informally select which weed they believe is growing the fastest on all landscapes.
Which weed spreads the fastest on a particular landscape? How do you know? Using the weed they selected, students will then need to determine the landscape on which that weed grows the fastest.
“This student is comparing each weed on one particular landscape. He did this for all landscapes. Does the graph help you see which plant is growing the fastest/slowest? How? How many simulations did you run to make this graph? Would the graph look exactly like this if you ran the simulation again? Would it look similar? Why or why not?”
After a few minutes of more exploration with the simulator, class will discuss their decisions and justify their reasoning about which weed grows the fastest on all landscapes. It is the hope that the simulator will provide such varied data for each weed and each landscape that students’ decisions will also be varied. This may provide an opportunity to discuss variability in data, and the role it plays in data analysis.
When students are asked to select the particular landscape on which the weed is growing the fastest, teachers can monitor how they are going about making this decision. Data gathering should be encouraged here since visual inspection may not be precise enough. This can be done in a variety of ways, but the creation of a two-way table does prove to be a nice organizational tool.
If two-way tables are used to gather data, analyzing them using conditional relative frequencies provides an opportunity for a discussion to share results and make decisions about which weed and which landscape students will further investigate.
Restate the essential question and prepare students for the evidence they will be gathering about the weed/landscape they are further investigating.
Students should now be ready to make formal claims about which weed and which landscape should be targeted by the BLM. Teachers should bring to students’ attention that so far, they have arrived at their decision rather informally. In order to propose

Pose the third Guiding Question: How many simulations do we need to run before we can gain confidence in our claims?Students will discuss how many simulations they will need to run in order to make a claim about the data the simulator generates. Students will then run new simulations. Students can choose the starting spot or let the simulator randomize that. If they choose the starting spot, suggest that every 3-5 simulations they choose a new starting spot. Have students record the number of cells filled with the weeds after 5 years for all simulations.
that potentially $7M should be spent fighting an invasive weed, more formal claims backed by statistical evidence should be presented.
Pose the fourth Guiding Question: How can you represent the data the simulator provides visually? Students will construct a line plot using the data from year 5 to determine the average number of plots covered by the invasive weed. Discussion questions: From the display, can we see and describe a “center”? How can we describe the variability or the spread in the data?
Students should have familiarity with the creation of line plots. Teachers could help students set up the appropriate scale for their data, scaffold with graph paper, or have students create their line plots digitally. It might be powerful to have all students create their line plots on congruent (copied) number lines to help with direct visual comparisons, but it also might be powerful to compare them accounting for the differences in the number lines or scales. This is up to the teacher’s discretion.
“This student made this line plot to show how many cells Medusahead spread to on Freeland Prairie after 5 years. How many cells would you expect to be filled if you ran the simulation again? Will it be exactly ___ cells, or a range of cells? How would you determine that range? Are there any data points that you find to be outside of what you would typically expect? Which ones? Why? How does your data compare to your classmate’s (who graphed Puncturevine on Rockland Ranch)?”
Pose the fifth Guiding Question: How many cells could we reasonably expect to be filled with weeds if we run the simulator again (and again and again)? At this stage in the lesson, students should be pressed to think about how to calculate the measure of center
Sample student work could be used to show students how to calculate the mean of the data set (if the mean is deemed an appropriate measure of center for their sample), and introduce the standard deviation as a measure of variability. In grades 6 & 7, students are exposed to the mean absolute deviation

of the data, and how to quantify the variability.
Showing the absolute deviation (distance) from the mean, which is then averaged to calculate the MAD.
Showing some of the squares generated by the absolute deviation from the mean, which leads to the calculation of the standard deviation.
(MAD) as a measure of variability for univariate data, which can be shown on a line plot by drawing a line segment from the mean value of the data to each data point.
The standard deviation is calculated by first averaging the area of the squares made from the line segments made when calculating the MAD, and then finding the square root.
The pictured line plot can generate some interesting discussion about the mean and the standard deviation of the data set. Students can be asked to estimate the mean before calculating it, and it is likely that their estimate will be close to 26 because of the perceived visual center of the data. The fact that it is close to 24 (skewed left) can be discussed, and the effects of the spread on the standard deviation can be questioned/highlighted.
Students should be pressed to consider questions like:
● How many data points lie within one standard deviation of the mean? How many lie within two standard deviations?
● What is the likelihood that if we run a new simulation that we will have a cell count within one standard deviation of the mean?
● If we ran a simulation and ___ cells were filled on year 5, what effect would that have on the mean? What effect would it have on the standard deviation?
● What is a typical number of cells that the weed spreads to in 5 years?
ASSESSMENTStudents must prepare a presentation that addresses the Essential Question:The Bureau of Land Management has a budget of $7,000,000 to fight the spread of invasive weeds on Idaho’s public lands. How can they decide how to spend these funds?
Students should use visual representations of collected data, summary statistics, and their interpretations of both to help support their claim. They may also want to consider features other than rate of spread (impact on wildlife and other native species, existing treatments for control, etc.) in their presentation.
Students can vote on the most convincing presentations and discuss why they cast their vote the way they did.