Embed Size (px)
Citation preview
Quantifying Rail-Highway Grade Crossing Roughness: Accelerations and Dynamic Modeling Teng Wang1, Reginald R. Souleyrette1, Daniel Lau2, Ahmed Aboubakr3 and Edward Randerson3 1 Department of Civil Engineering, University of Kentucky, Lexington, KY 2 Department of Electrical and Computer Engineering, University of Kentucky, Lexington, KY 3 Department of Mechanical and Industrial Engineering, University of Illinois at Chicago, Chicago, IL
Quality of surface is an important aspect affecting both the safety and the performance of rail-highway grade crossings. Roughness may increase the risk of crashes for both trains and automobiles. With many crossings, maintenance management is a large undertaking. As with other highway assets, crossings deteriorate if not maintained, and life cycle cost increases without preventive maintenance. No quantitative method currently exists to assess the condition of rail crossings in order to evaluate the performance of crossings and set a quantitative trigger for their rehabilitation. As conventional inspection relies on qualitative judgment based on driving a vehicle over the crossing, it cannot assess ride experienced by different vehicles nor can it differentiate between the effects of as-built geometry and crossing deterioration. A quantifiable and extensible procedure is desired. This research reports on the use of LiDAR to collect a 3D surface point cloud as input to a customized vehicle dynamic model. The model predicts accelerations experienced by highway vehicles using the crossing. Actual accelerations at the crossing are compared to the model estimates as a first step towards developing a simple, repeatable method for quantifying crossing roughness for policy and maintenance input.
IntroductionThe objective of the research is to develop a method to quickly and inexpensively quantify the roughness of a crossing, and based on correlations between roughness and safety, help prioritize crossings for rehabilitation. As a first step, a low-cost 3D data acquisition system (DAS) based on 3D structured light imaging technology has been developed as reported in a paper given at the Joint Rail Conference [1]. As an extension of the research, a vehicle dynamic model that uses a 3D
surface point cloud and vehicle wheel paths to estimate highway vehicle acceleration has been developed by the authors [2]. By combining measurement and simulation technologies, this research represents a next step towards development of a methodology to quantify crossing roughness condition as a function of acceleration caused by crossing surface variation. This report focuses on the collection and analysis of acceleration data and use of a vehicle dynamic simulation model to quantify rail-highway grade crossing roughness. The methods presented in this research are tested for repeatability and data accuracy.
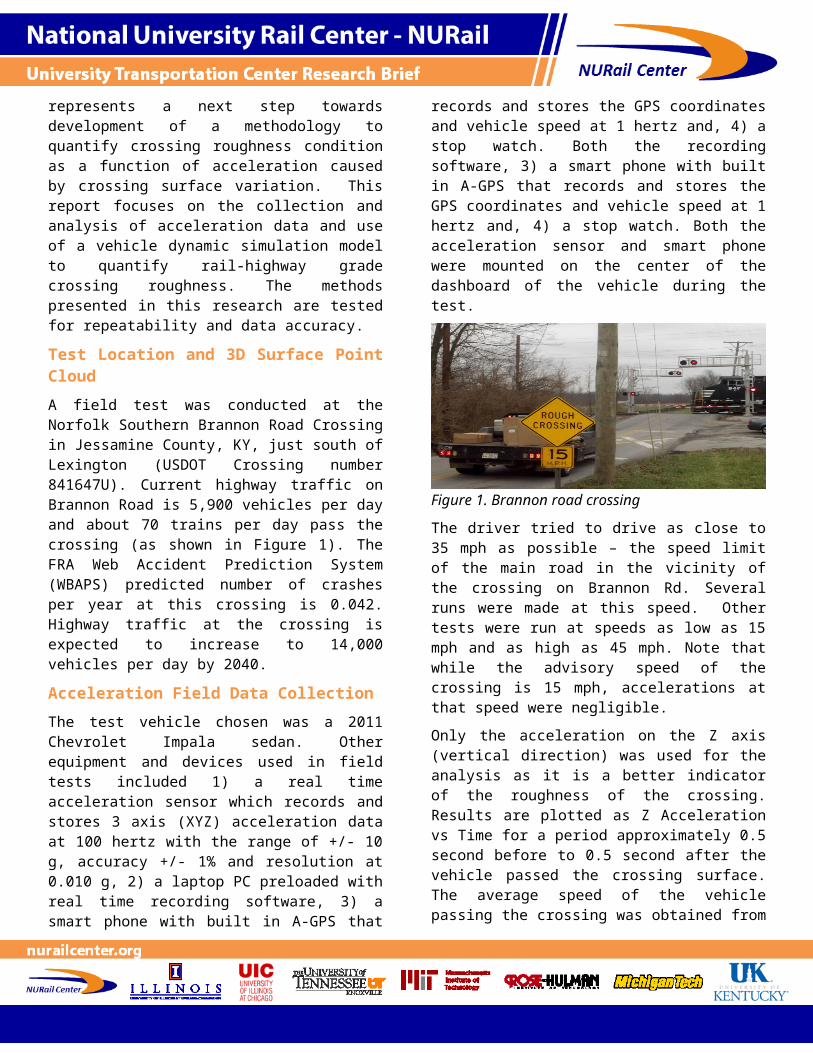
Test Location and 3D Surface Point Cloud A field test was conducted at the Norfolk Southern Brannon Road Crossing in Jessamine County, KY, just south of Lexington (USDOT Crossing number 841647U). Current highway traffic on Brannon Road is 5,900 vehicles per day and about 70 trains per day pass the crossing (as shown in Figure 1). The FRA Web Accident Prediction System (WBAPS) predicted number of crashes per year at this crossing is 0.042. Highway traffic at the crossing is expected to increase to 14,000 vehicles per day by 2040.
Acceleration Field Data CollectionThe test vehicle chosen was a 2011 Chevrolet Impala sedan. Other equipment and devices used in field tests included 1) a real time acceleration sensor which records and stores 3 axis (XYZ) acceleration data at 100 hertz with the range of +/- 10 g, accuracy +/- 1% and resolution at 0.010 g, 2) a laptop PC preloaded with real time recording software, 3) a smart phone with built in A-GPS that records and stores the GPS coordinates and vehicle speed at 1 hertz and, 4) a stop watch. Both the
recording software, 3) a smart phone with built in A-GPS that records and stores the GPS coordinates and vehicle speed at 1 hertz and, 4) a stop watch. Both the acceleration sensor and smart phone were mounted on the center of the dashboard of the vehicle during the test.
Figure 1. Brannon road crossing
The driver tried to drive as close to 35 mph as possible – the speed limit of the main road in the vicinity of the crossing on Brannon Rd. Several runs were made at this speed. Other tests were run at speeds as low as 15 mph and as high as 45 mph. Note that while the advisory speed of the crossing is 15 mph, accelerations at that speed were negligible.
Only the acceleration on the Z axis (vertical direction) was used for the analysis as it is a better indicator of the roughness of the crossing. Results are plotted as Z Acceleration vs Time for a period approximately 0.5 second before to 0.5 second after the vehicle passed the crossing surface. The average speed of the vehicle passing the crossing was obtained from the smart phone GPS associated with each test (using a time stamp). The results are shown in Figure 2 and 3.
Figure 2 shows that when the test speed is held constant (35mph), both the frequency and amplitude of acceleration from repeated test are very close. This indicates that the test is highly repeatable and method is reliable for future work.
Figure 2. Tests with speed close to 35 mph.
To test the effect of speed variation on accelerations, several tests were performed at various speeds. Results of these tests are shown in Figure 3. It can be seen that as expected, acceleration amplitudes and frequencies increase with increasing speeds.
Figure 3.Tests with various speeds.
Vehicle Dynamic Model SimulationIn order to simulate the highway vehicle driving over a crossing and estimate accelerations, a highway vehicle dynamic model was developed based on the computer code ATTIF (Analysis of Train/Track Interaction Forces). The model was developed at the Dynamic Simulation Laboratory (DSL) of the University of Illinois at Chicago (UIC). Its original purpose was to simulate train and track interaction. ATTIF included a detailed wheel/rail contact model based on surface geometry (see Figure 4).
Figure 4. ATTIF based vehicle dynamic simulation model
The authors modified the ATTIF vehicle dynamic model which uses the 3D surface point cloud coordinate data together with realistic vehicle parameters such for weight, velocity, wheel radius, wheel-base and suspension characteristics to simulate a vehicle driving over the rail crossing. During the validation and calibration process, the initial simulation acceleration

result was about 3 times larger than the field observation. It also had a lot high frequency noise in the wave as shown in Figure 5.
The amplitude and frequency differences between the simulation and field observation were caused by the stiffness and damping of the vehicle tires which were significantly different to rail steel wheels. After reducing the tire stiffness and increasing its damping, the model was calibrated. Simulated accelerations were then compared to field observations as discussed in the following section.
Figure 5. Initial simulation vs field data @ 34.9 mph
Simulation Result vs Field Data Simulation results vs. field collection data for two different speeds are shown in Figures 6 and 7 below.
Figure 6. Simulation result vs field data @ 34.9 mph
As can be seen in Figures 6 and7, simulation results are similar to field observations. General trends of the acceleration waves are similar, and maximum and minimum values of accelerations are quite close. In Figure 6 (comparison at 34.9 mph), the first 0.5 second and last 0.5 second data have higher “error” but are in fact artifacts of the virtual transition of simulated profile to the assumed approaches. These regions should be ignored. To quantify the goodness-of-fit and similarity
of the two waves in the plot, a MATLAB script was developed by using a cross correlation index (P in equation 1) and mean squared error (MSE). Results are shown in Table 1.
cross correlation indexP(A :B)= crosscorrelation (A :B)crosscorrelation (A : A)
where A, B are time series waves with the same number of data. And P (A:B) = 1, when wave A and B are the same shape.
TABLE 1. Simulation Results Compared to Field Collection Data
Figure 7. Simulation vs field collection data @ 43.6 mph
Summary and ConclusionTo model rail-highway crossing roughness, a 3D surface is needed. Previously, a low cost 3D data acquisition system was developed. In this research, a vehicle dynamic simulation model was developed and calibrated using 3D data and field accelerometer readings. Test repeatability and data accuracy was verified. The vehicle dynamic model can be used to facilitate estimation of vehicular accelerations at various speeds for different vehicles and lateral positioning. In future research, a method will be developed to extrapolate acceleration readings to those experienced by any design vehicle.
References[1]. Wang, T., R. Souleyrette, D. Lau and P. Xu, “Rail Highway Grade Crossing Roughness Quantitative Measurement Using

3D Technology,” Proceedings of the 2014 Joint Rail Conference, Colorado Springs, CO, April 2-4, 2014.
[2]. Wang, T., R.R. Souleyrette, D. Lau, A. Aboubakr and E Randerson. “Quantifying Rail-Highway Grade Crossing Roughness: Accelerations and Dynamic Modeling.” Proceedings of the 94th Annual Meeting of TRB, Washington, DC, Jan. 2015. 11 pages
The authors would thank the National University Rail (NURail) Center, a US DOT-OST Tier 1 University Transportation Center for sponsoring this study.