Embed Size (px)
Citation preview

Session 8
Engaging Feedback Mechanisms
Creating a Balanced Scorecard

(this page blank by design)

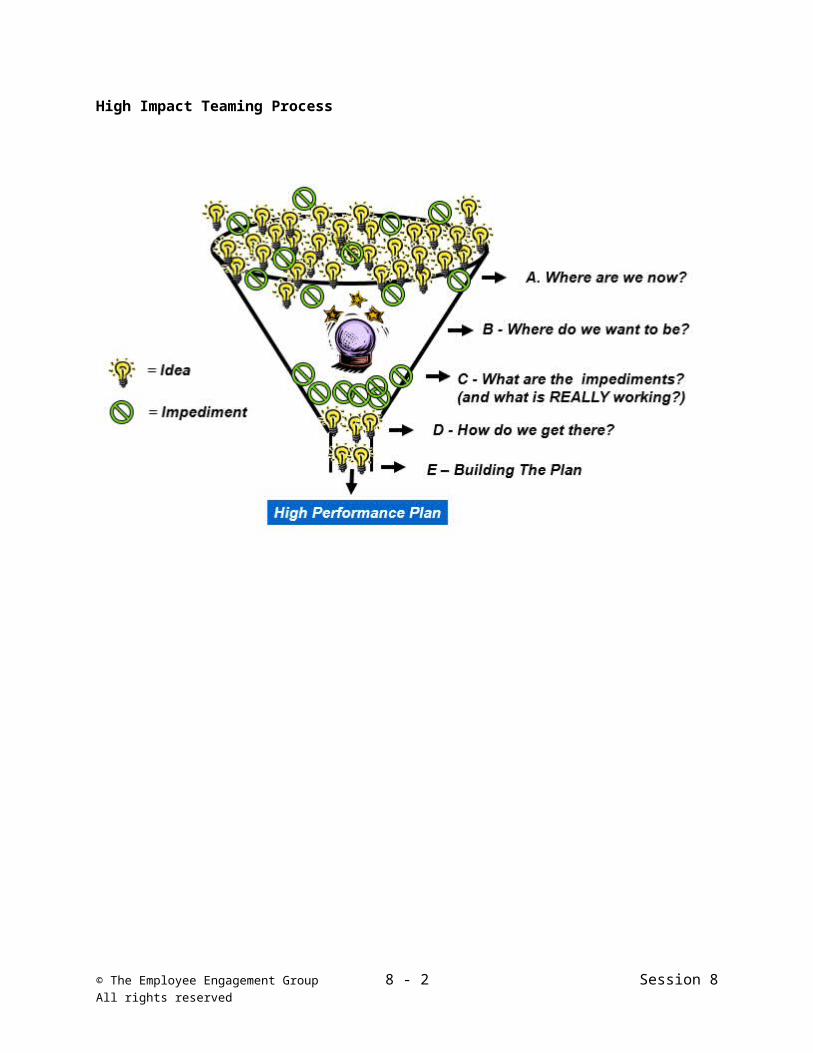
Session 8 – Develop Feedback Mechanisms and Designing and Implementing a Balanced Scorecard Review Feedback Mechanisms from Session 2 Discuss how to engage employees by using feedback Learn the high impact teaming process and use the idea evaluator Define a Balanced Scorecard Determine the key measurements for your organization Review the steps for building a scorecard Create a plan to implement a balanced scorecard in your organization
© The Employee Engagement Group 8 - 1 Session 8All rights reserved
High Impact Teaming Process
© The Employee Engagement Group 8 - 2 Session 8All rights reserved
Tools to Determine Current State
SWOT
SWOT analysis is a powerful model for many different situations. The SWOT tool is not just for business and marketing. Here are some examples of what a SWOT analysis can be used to assess:
A company (its position in the market, commercial viability, etc)
A method of sales distribution
A product or brand
A business idea
A strategic option, such as entering a new market or launching a new product
A opportunity to make an acquisition
A potential partnership
Changing a supplier
Outsourcing a service, activity or resource
Project planning and project management
An investment opportunity
Personal financial planning
Personal career development - direction, choice, change, etc.
Education and qualifications planning and decision-making
Life-change - downshifting, relocation,
Whatever the application, be sure to describe the subject (or purpose or question) for the SWOT analysis clearly so you remain focused on the central issue. This is especially crucial when others are involved in the process. People contributing to the analysis and seeing the finished SWOT analysis must be able to understand properly the purpose of the SWOT assessment and the implications arising.
Strengths Weaknesses
Opportunities Threats
SWOT Analysis Guide
© The Employee Engagement Group 8 - 3 Session 8All rights reserved

Strengths Advantages of proposition?
Capabilities?
Competitive advantages?
USP's (unique selling points)?
Resources, Assets, People?
Experience, knowledge, data?
Financial reserves, likely returns?
Marketing - reach, distribution, awareness?
Innovative aspects?
Location and geographical?
Price, value, quality?
Accreditations, qualifications, certifications?
Processes, systems, IT, communications?
Cultural, attitudinal, behavioral?
Management cover, succession?
Weaknesses Disadvantages of proposition?
Gaps in capabilities?
Lack of competitive strength?
Reputation, presence and reach?
Financials?
Own known vulnerabilities?
Timescales, deadlines and pressures?
Cash flow, start-up cash-drain?
Continuity, supply chain robustness?
Effects on core activities, distraction?
Reliability of data, plan predictability?
Morale, commitment, leadership?
Accreditations, etc?
Processes and systems, etc?
Management cover, succession?
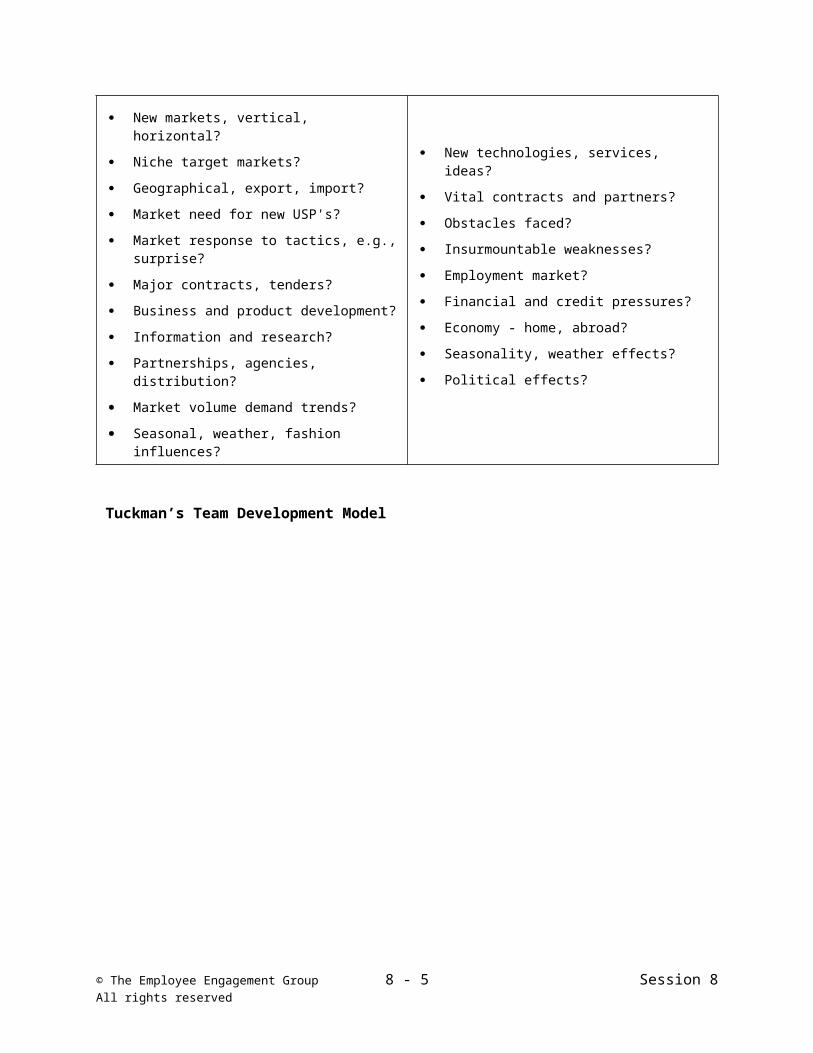
Opportunities Market developments?
Competitors' vulnerabilities?
Industry or lifestyle trends?
Technology development and innovation?
Global influences?
New markets, vertical, horizontal?
Niche target markets?
Geographical, export, import?
Market need for new USP's?
Market response to tactics, e.g., surprise?
Major contracts, tenders?
Business and product development?
Information and research?
Partnerships, agencies, distribution?
Market volume demand trends?
Seasonal, weather, fashion influences?
Threats Political effects?
Legislative effects?
Environmental effects?
IT developments?
Competitor intentions - various?
Market demand?
New technologies, services, ideas?
Vital contracts and partners?
Obstacles faced?
Insurmountable weaknesses?
Employment market?
Financial and credit pressures?
Economy - home, abroad?
Seasonality, weather effects?
Political effects?
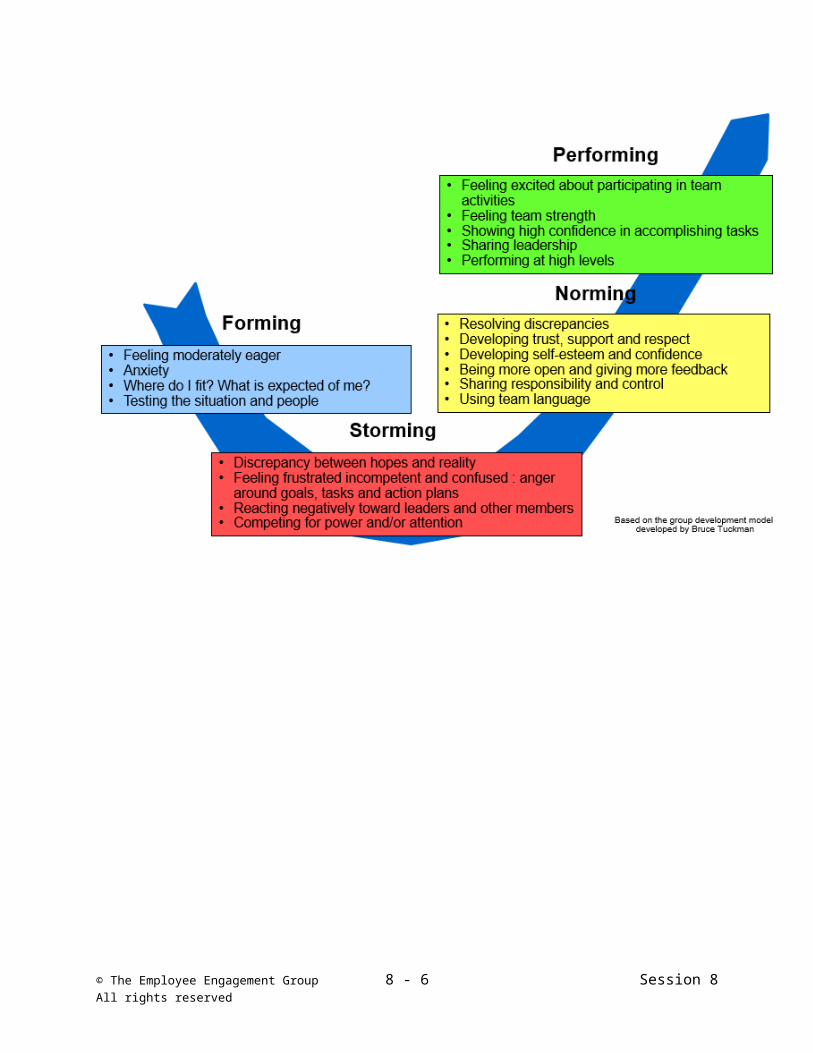
Tuckman’s Team Development Model
© The Employee Engagement Group 8 - 4 Session 8All rights reserved

© The Employee Engagement Group 8 - 5 Session 8All rights reserved
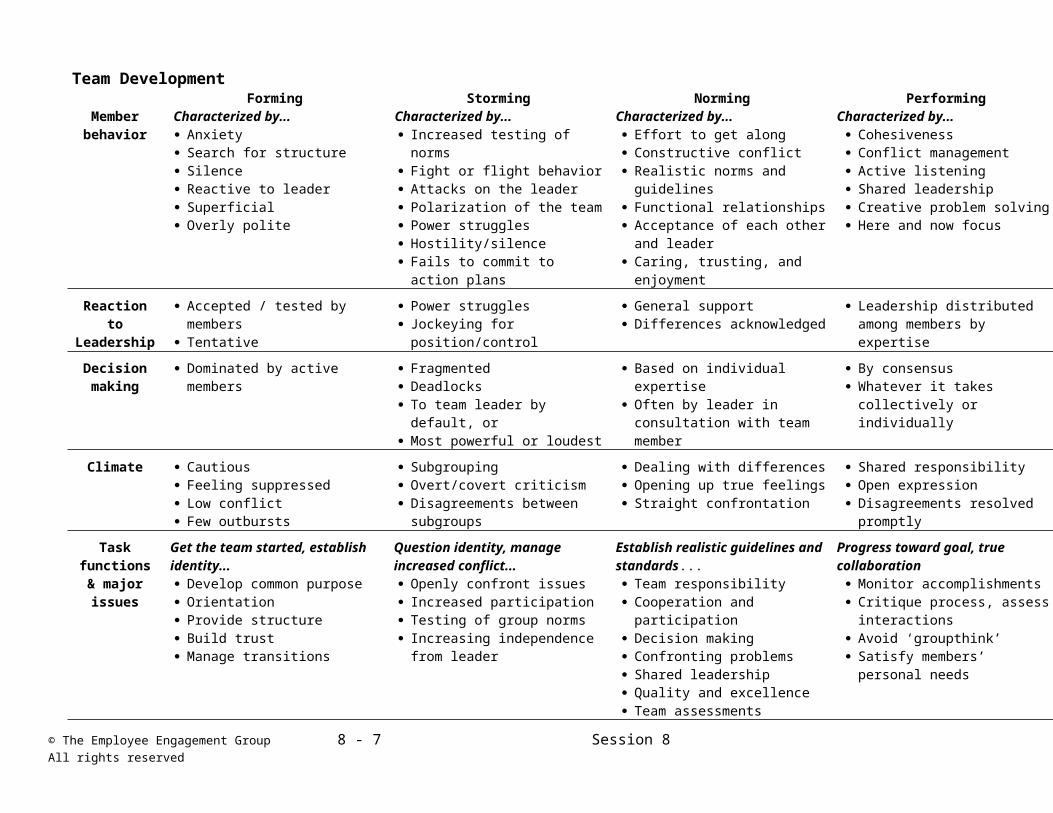
Team DevelopmentForming Storming Norming Performing
Member behavior
Characterized by... Anxiety Search for structure Silence Reactive to leader Superficial Overly polite
Characterized by... Increased testing of norms Fight or flight behavior Attacks on the leader Polarization of the team Power struggles Hostility/silence Fails to commit to action plans
Characterized by... Effort to get along Constructive conflict Realistic norms and guidelines Functional relationships Acceptance of each other and
leader Caring, trusting, and enjoyment
Characterized by... Cohesiveness Conflict management Active listening Shared leadership Creative problem solving Here and now focus
Reaction to Leadership
Accepted / tested by members Tentative
Power struggles Jockeying for position/control
General support Differences acknowledged
Leadership distributed among members by expertise
Decision making
Dominated by active members Fragmented Deadlocks To team leader by default, or Most powerful or loudest
Based on individual expertise Often by leader in consultation
with team member
By consensus Whatever it takes collectively or
individually
Climate Cautious Feeling suppressed Low conflict Few outbursts
Subgrouping Overt/covert criticism Disagreements between
subgroups
Dealing with differences Opening up true feelings Straight confrontation
Shared responsibility Open expression Disagreements resolved
promptly
Task functions &
major issues
Get the team started, establish identity... Develop common purpose Orientation Provide structure Build trust Manage transitions
Question identity, manage increased conflict... Openly confront issues Increased participation Testing of group norms Increasing independence from
leader
Establish realistic guidelines and standards... Team responsibility Cooperation and participation Decision making Confronting problems Shared leadership Quality and excellence Team assessments
Progress toward goal, true collaboration Monitor accomplishments Critique process, assess
interactions Avoid ‘groupthink’ Satisfy members’ personal
needs
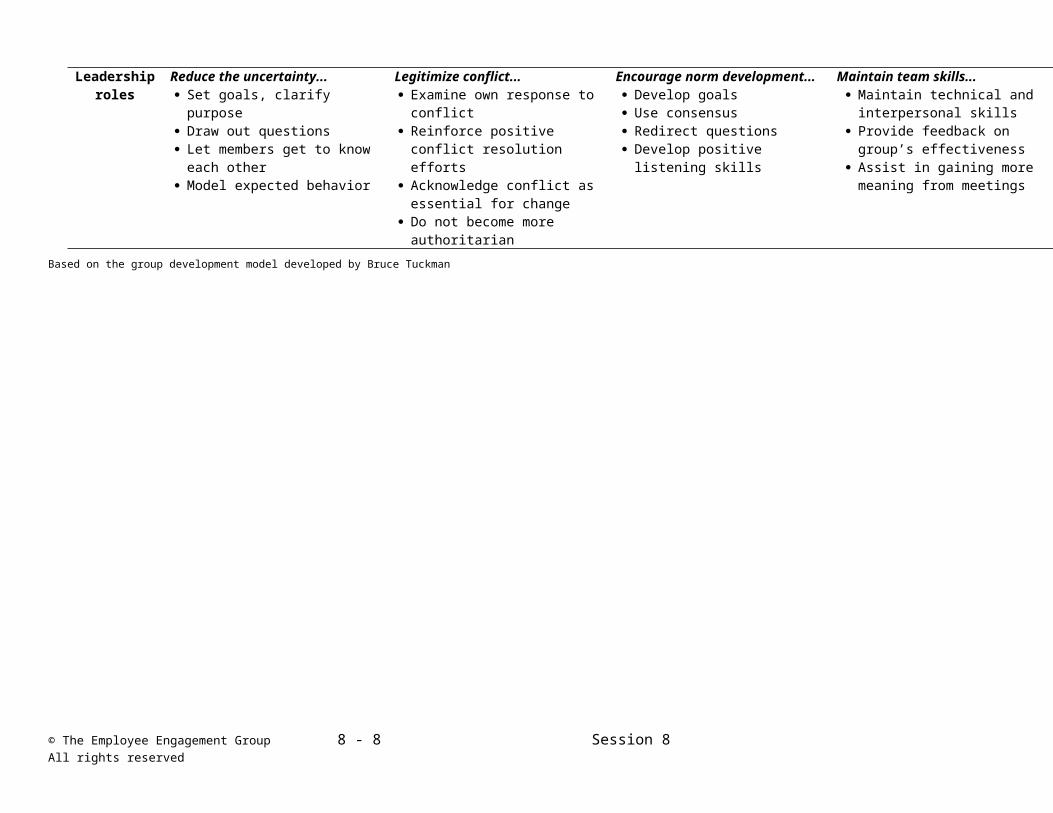
Leadership roles
Reduce the uncertainty... Set goals, clarify purpose Draw out questions Let members get to know each
other Model expected behavior
Legitimize conflict... Examine own response to
conflict Reinforce positive conflict
resolution efforts Acknowledge conflict as
essential for change Do not become more
authoritarian
Encourage norm development... Develop goals Use consensus Redirect questions Develop positive listening skills
Maintain team skills... Maintain technical and
interpersonal skills Provide feedback on group’s
effectiveness Assist in gaining more meaning
from meetings
Based on the group development model developed by Bruce Tuckman
© The Employee Engagement Group 8 - 6 Session 8All rights reserved
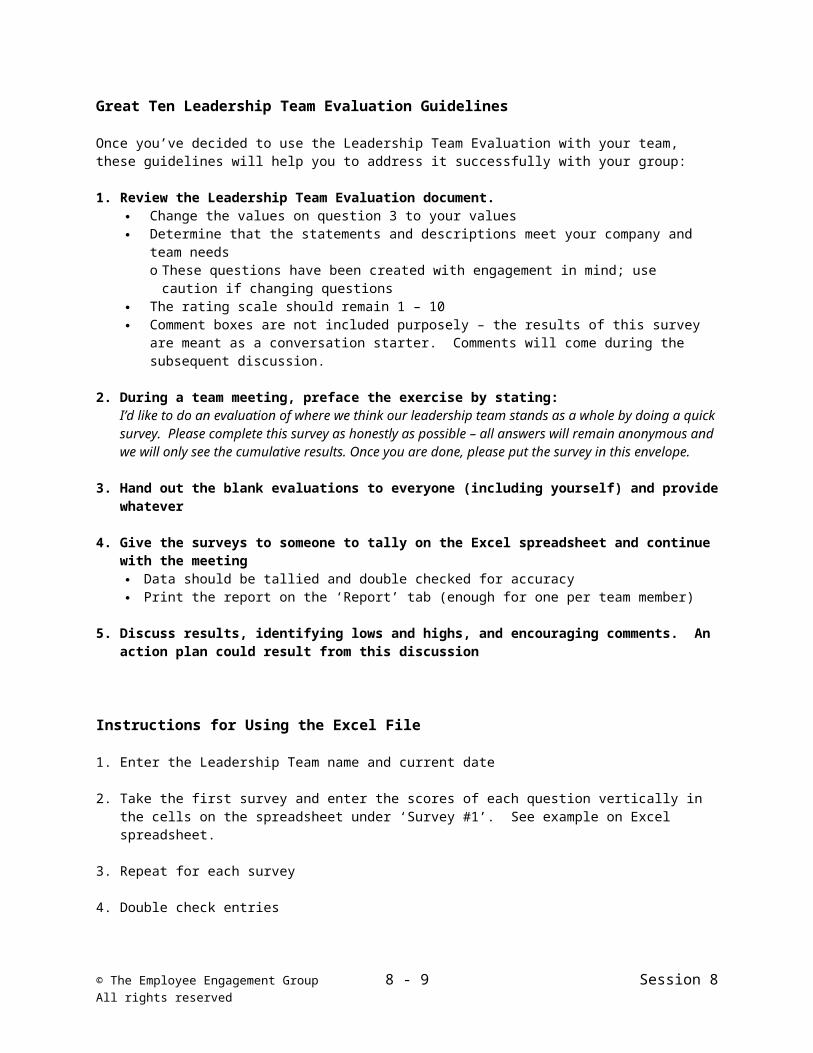
Great Ten Leadership Team Evaluation Guidelines
Once you’ve decided to use the Leadership Team Evaluation with your team, these guidelines will help you to address it successfully with your group:
1. Review the Leadership Team Evaluation document. Change the values on question 3 to your values Determine that the statements and descriptions meet your company and team needs
o These questions have been created with engagement in mind; use caution if changing questions
The rating scale should remain 1 – 10 Comment boxes are not included purposely – the results of this survey are meant as a
conversation starter. Comments will come during the subsequent discussion.
2. During a team meeting, preface the exercise by stating:I’d like to do an evaluation of where we think our leadership team stands as a whole by doing a quick survey. Please complete this survey as honestly as possible – all answers will remain anonymous and we will only see the cumulative results. Once you are done, please put the survey in this envelope.
3. Hand out the blank evaluations to everyone (including yourself) and provide whatever
4. Give the surveys to someone to tally on the Excel spreadsheet and continue with the meeting Data should be tallied and double checked for accuracy Print the report on the ‘Report’ tab (enough for one per team member)
5. Discuss results, identifying lows and highs, and encouraging comments. An action plan could result from this discussion
Instructions for Using the Excel File
1. Enter the Leadership Team name and current date
2. Take the first survey and enter the scores of each question vertically in the cells on the spreadsheet under ‘Survey #1’. See example on Excel spreadsheet.
3. Repeat for each survey
4. Double check entries
5. Click the ‘Report’ tab and print the report (best in color), one for each participant
6. Put reports in an envelope and return to the team leader
7. Destroy original surveys
© The Employee Engagement Group 8 - 7 Session 8All rights reserved
Leadership Team EvaluationRead the 10 statements and corresponding notes. Rate our Leadership Team on each statement using a scale of 1 – 10 (see Rating Key below).
Results will be tabulated and displayed as a benchmark.
1 Our Leadership Team makes decisions unselfishly, for the greater good of the company
We don’t make decisions in our own self interest
1 2 3 4 5 6 7 8 9 10
2 Our Leadership Team is seen by its employees as aligned on mission, strategy, goals, and priorities
We focus and align in one consistent direction
We behave in a way that supports this focus
1 2 3 4 5 6 7 8 9 10
3 Our Leadership Team ‘walks the talk’; we live the values the organization stands for
Our mutual commitments and values: Integrity Respect Balance Open Communications Flexibility Safety Innovation
Note: These are sample values – insert the values for your company
1 2 3 4 5 6 7 8 9 10
4 Our Leadership Team automatically and consistently ‘assumes the best intentions’ in one another
We do not assume ‘motives’, especially when we disagree
All team members assume that teammates want what is best for the organization
It is okay to have different opinions, but the team can engage in an open and respectful discussion
1 2 3 4 5 6 7 8 9 10
© The Employee Engagement Group 8 - 8 Session 8All rights reserved
Rating Key
1 = Not at all 10 = Excels at this
Leadership Team Evaluation (continued)
5 Our Leadership Team openly discusses issues in meetings
We have open, respectful, but yet challenging conversations in meetings
We do not have contrary discussions in the hallway after the meetings
We avoid ‘I won’t comment on your sandbox if you don’t comment on mine’
Team members say what they want in the room, not after the meeting
1 2 3 4 5 6 7 8 9 10
6 When a decision is made in a meeting, we own the decision as ours and fully support it outside the meeting
Our employees hear a single voice When decisions are made we support
the decision with our employees
1 2 3 4 5 6 7 8 9 10
7 We are acutely aware of the impact of the shadow we cast on our organization
We recognize that everything from our words to your moods are noticed by your employees
We act with the knowledge that others look up to us, and emulate our behavior
We are seen by our employees as being aligned
1 2 3 4 5 6 7 8 9 10
8 We fully participate in initiatives rather than just ‘blessing’ them
Because of the ‘shadow’ phenomenon*, our company initiatives are supported by all of us
We all share in the responsibility, knowing that how we are led determines how we lead
* The ‘shadow’ phenomenon states that leaders have tremendous influence on company environment
1 2 3 4 5 6 7 8 9 10
:
© The Employee Engagement Group 8 - 9 Session 8All rights reserved
© The Employee Engagement Group 8 - 10 Session 8All rights reserved
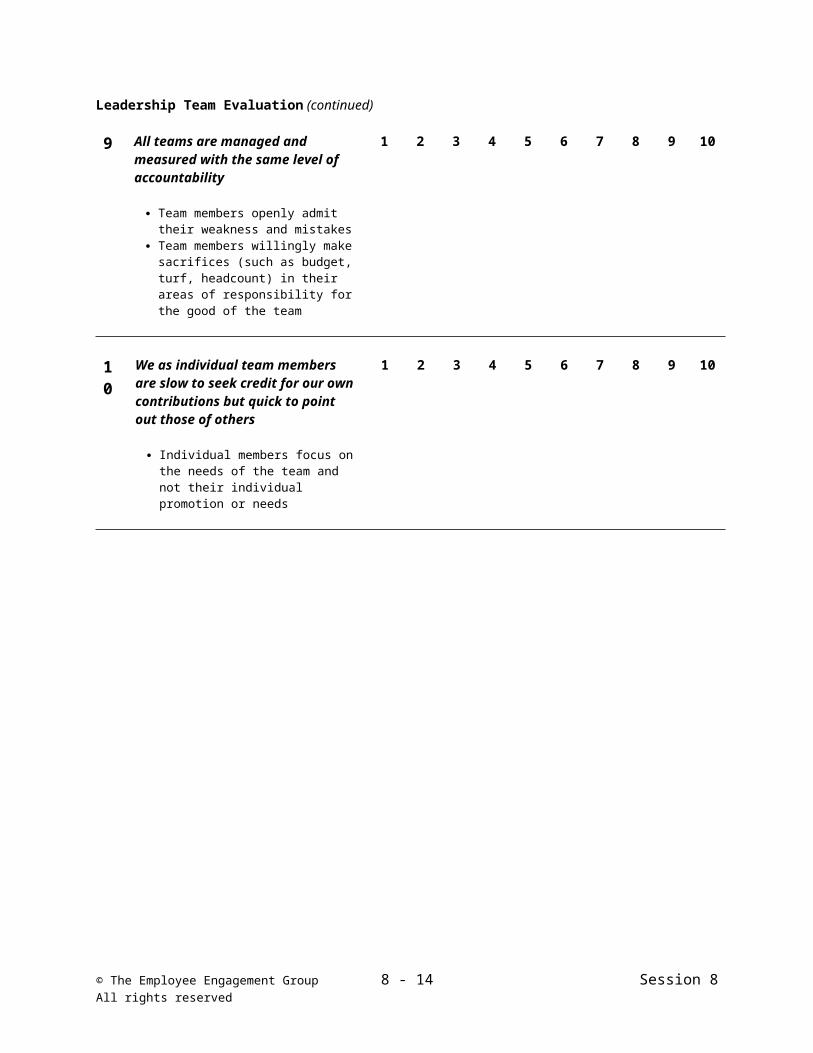
Leadership Team Evaluation (continued)
9 All teams are managed and measured with the same level of accountability
Team members openly admit their weakness and mistakes
Team members willingly make sacrifices (such as budget, turf, headcount) in their areas of responsibility for the good of the team
1 2 3 4 5 6 7 8 9 10
10 We as individual team members are slow to seek credit for our own contributions but quick to point out those of others
Individual members focus on the needs of the team and not their individual promotion or needs
1 2 3 4 5 6 7 8 9 10
© The Employee Engagement Group 8 - 11 Session 8All rights reserved

The Five Dysfunctions of a Team Assessment
Instructions: Use the scale below to indicate how each statement applies to your team. Be sure to evaluate the statements honestly and without over-thinking your answers.
3 = Usually 2 = Sometimes 1 = Rarely
_____ 1. Team members are passionate and unguarded in their discussion of issues
_____ 2. Team members call out one another’s deficiencies or unproductive behaviors
_____ 3. Team members know what their peers are working on and how they contribute to the collective good of the team.
_____ 4. Team members quickly and genuinely apologize to one another when they say or do something inappropriate or possibly damaging to the team.
_____ 5. Team members willingly make sacrifices (such as budget, turf, headcount) in their departments or areas of expertise for the good of the team.
_____ 6. Team members openly admit their weakness and mistakes
_____ 7. Team meetings are compelling and not boring.
_____ 8. Team members leave meeting confident that their peers are completely committed to decisions agreed upon during the meeting, even if there was initial disagreement.
_____ 9. Morale is significantly affected by the failure to achieve team goals.
_____ 10. During team meetings, the most important and most difficult issues are put on the table to be resolved.
_____ 11. Team members are deeply concerned about the prospect of letting down their peers.
_____ 12. Team members know about one another’s personal lives and are comfortable discussing them.
_____ 13. Team members end discussions with clear and specific resolutions and calls to action.
_____ 14. Team members challenge one another about their plans and approaches.
_____ 15. Team members are slow to seek credit for their own contributions but quick to point out those of others
Source: Patrick Lencioni, Overcoming the Five Dysfunctions of a Team
© The Employee Engagement Group 8 - 12 Session 8All rights reserved

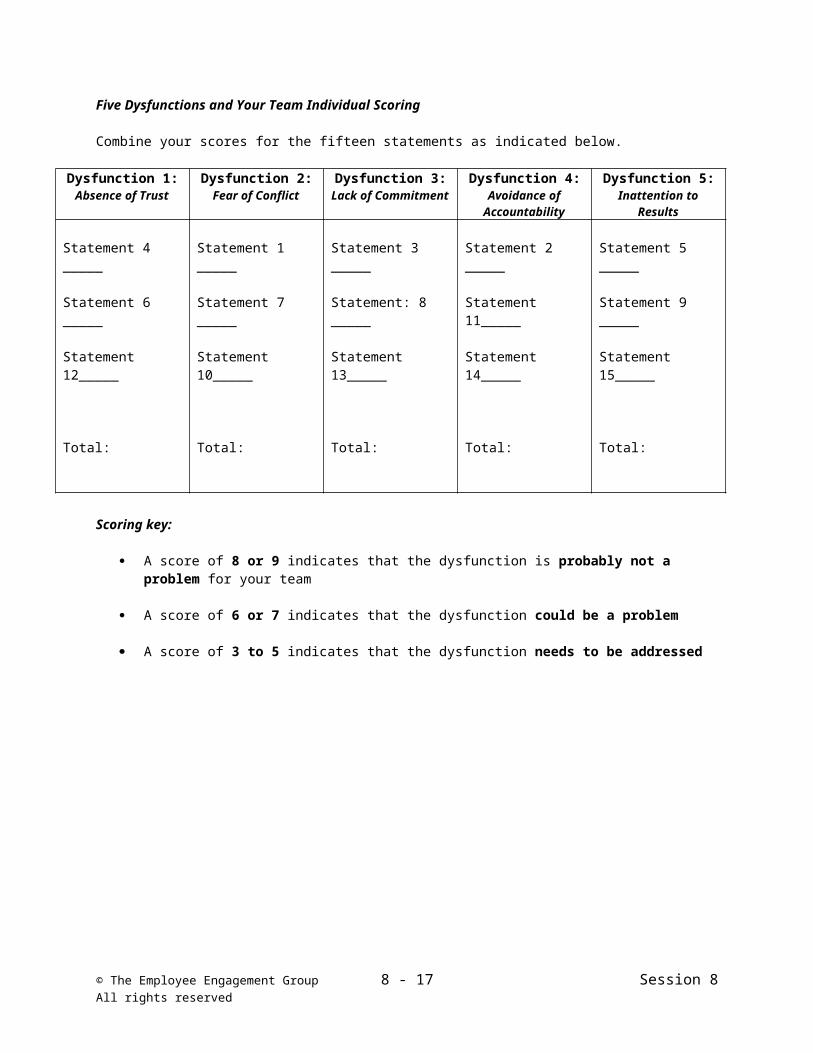
Five Dysfunctions and Your Team Individual Scoring
Combine your scores for the fifteen statements as indicated below.
Dysfunction 1:Absence of Trust
Dysfunction 2:Fear of Conflict
Dysfunction 3:Lack of Commitment
Dysfunction 4:Avoidance of
Accountability
Dysfunction 5:Inattention to
Results
Statement 4 _____
Statement 6 _____
Statement 12_____
Total:
Statement 1 _____
Statement 7 _____
Statement 10_____
Total:
Statement 3 _____
Statement: 8 _____
Statement 13_____
Total:
Statement 2 _____
Statement 11_____
Statement 14_____
Total:
Statement 5 _____
Statement 9 _____
Statement 15_____
Total:
Scoring key:
A score of 8 or 9 indicates that the dysfunction is probably not a problem for your team
A score of 6 or 7 indicates that the dysfunction could be a problem
A score of 3 to 5 indicates that the dysfunction needs to be addressed
© The Employee Engagement Group 8 - 13 Session 8All rights reserved

Employee Engagement Benchmark Data
Employee ratings of an organization's strengths and weaknesses can identify areas upon which to focus in order to increase employee satisfaction. Indeed, if you had no other data, you would still be in a position to make decisions about what to do in response to employee survey results.
You will be able to make much smarter decisions, however, with additional normative data. For example, it's not uncommon to discover half a dozen attributes which receive relatively poor ratings in comparison to others in the survey. What's to be done?
One option, of course, is to attempt to address all of the low scores at the same time. In some cases, limited resources may preclude an across the board response. Even if such a full court press is possible, it is often an inefficient use of organizational resources. Alternatively, you might make a judgment call, focusing on those attributes which you think matter most to employees. And you may be right.
Normative data, however, increase your odds, for they show where you stand in comparison with many other organizations on the same attributes. A case in point -- employee ratings of salaries and wages are substantially lower than their ratings of, say, corporate communications or quality of supervision. Looks like a money problem, but is it?
It may be that, compared to other organizations, your wage and salary ratings are on the upper end of the scale. And your apparently satisfactory communications ratings are actually lower than those of other organizations.
That kind of information is precisely what norms are designed to provide.
Without that information, you can't really tell where you stand, and you may waste resources fixing "problems" that simply reflect prevailing views of employees in general, and missing an opportunity to address the real areas in which your organization lags behind others.
© The Employee Engagement Group 8 - 14 Session 8All rights reserved
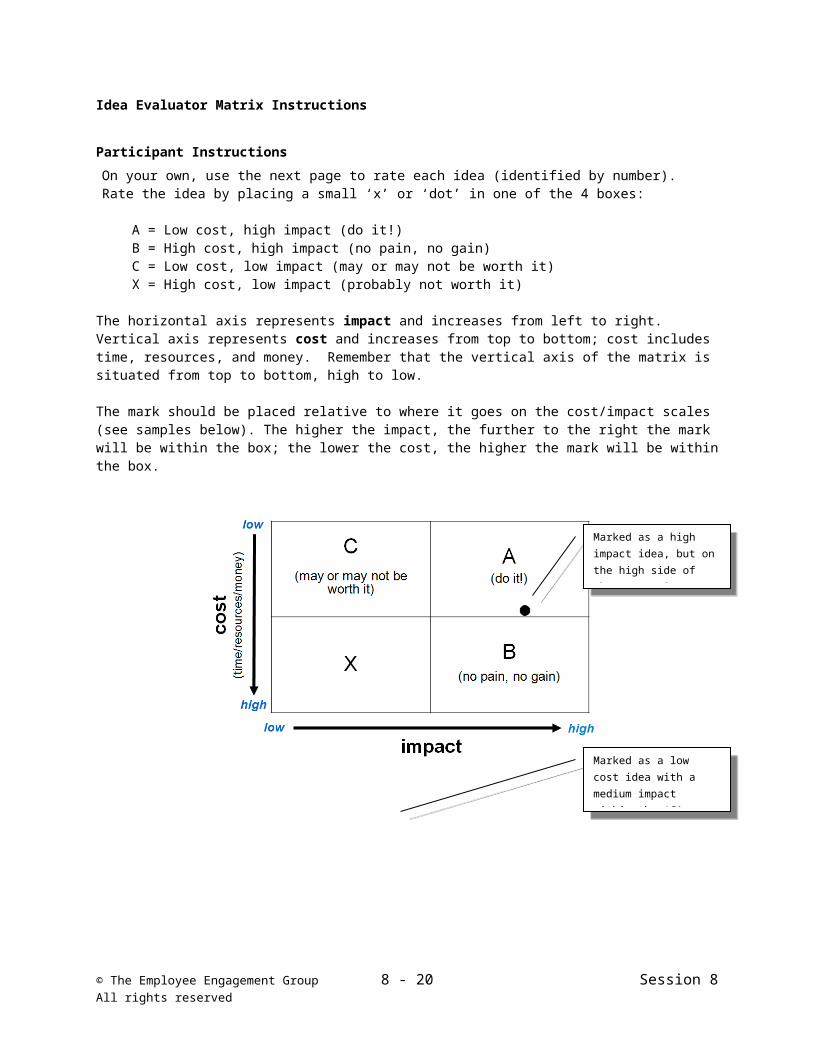
Idea Evaluator Matrix Instructions
Participant Instructions On your own, use the next page to rate each idea (identified by number). Rate the idea by placing a small ‘x’ or ‘dot’ in one of the 4 boxes:
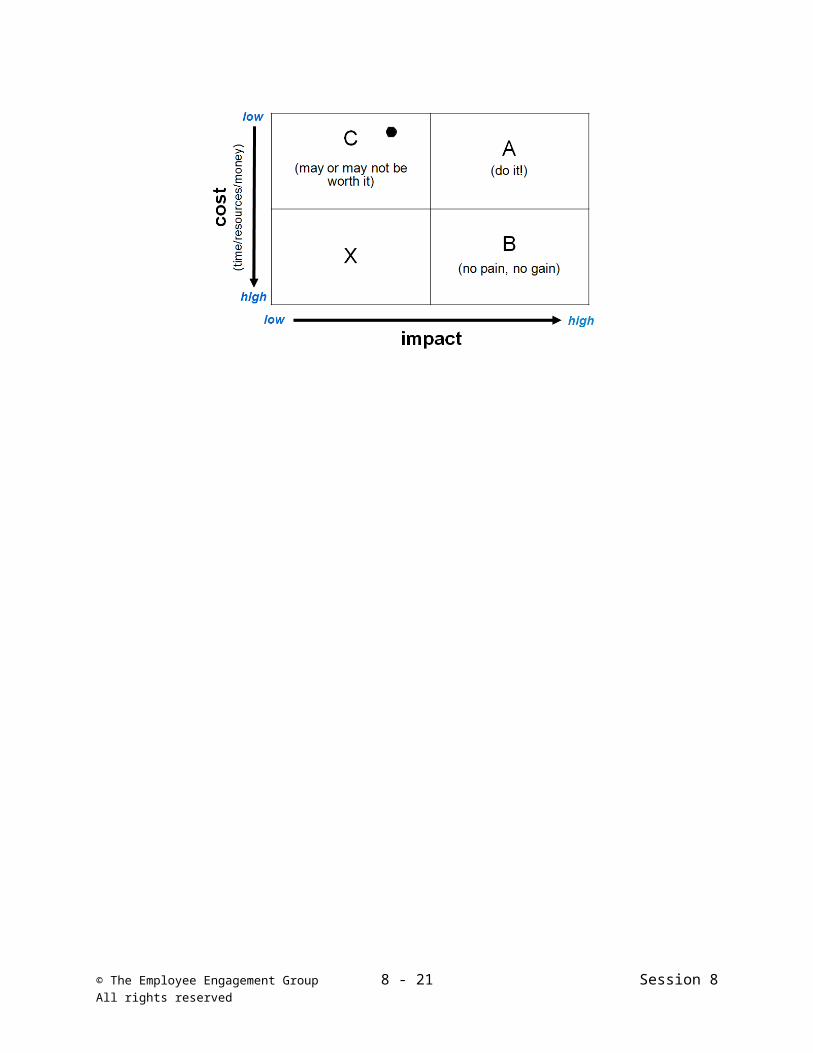
A = Low cost, high impact (do it!)B = High cost, high impact (no pain, no gain)C = Low cost, low impact (may or may not be worth it)X = High cost, low impact (probably not worth it)
The horizontal axis represents impact and increases from left to right. Vertical axis represents cost and increases from top to bottom; cost includes time, resources, and money. Remember that the vertical axis of the matrix is situated from top to bottom, high to low.
The mark should be placed relative to where it goes on the cost/impact scales (see samples below). The higher the impact, the further to the right the mark will be within the box; the lower the cost, the higher the mark will be within the box.
© The Employee Engagement Group 8 - 15 Session 8All rights reserved
Marked as a high impact idea, but on the high side of the cost axis within the ‘A’ quadrant.
Marked as a low cost idea with a medium impact within the ‘C’ quadrant

Idea Evaluator Form
1 C A 13 C A 25 C A 37 C A
X B X B X B X B
2 C A 14 C A 26 C A 38 C A
X B X B X B X B
3 C A 15 C A 27 C A 39 C A
X B X B X B X B
4 C A 16 C A 28 C A 40 C A
X B X B X B X B
5 C A 17 C A 29 C A 41 C A
X B X B X B X B
6 C A 18 C A 30 C A 42 C A
X B X B X B X B
7 C A 19 C A 31 C A 43 C A
X B X B X B X B
8 C A 20 C A 32 C A 44 C A
X B X B X B X B
9 C A 21 C A 33 C A 45 C A
X B X B X B X B
10 C A 22 C A 34 C A 46 C A
X B X B X B X B
11 C A 23 C A 35 C A 47 C A
X B X B X B X B
12 C A 24 C A 36 C A 48 C A
X B X B X B X B
© The Employee Engagement Group 8 - 16 Session 8All rights reserved
Facilitator Instructions (web meeting)
Objective:The purpose of this exercise is to evaluate ideas in order to prioritize based on cost and impact.
Preparation: Schedule a webinar with the participants Send the 2 page Idea Evaluator Form to all participants and ask that they print it out for the
session When opening webinar, select ‘Share Desktop’. Open PowerPoint (Idea Evaluator Matrix) and
Word (Idea Evaluator Form and blank page).
Directions (web meeting)1. Brainstorm ideas in an open environment; list ideas
If done in small groups, collect and combine ideas onto one central list blank Word document (remember to save the document periodically)
2. Work with the group to combine similar ideas to minimize repetition; edit the document as you go, removing any ideas that should not be part of this exercise
3. Go over each idea to determine: Clarity – be sure the participants truly understand the idea
– rewrite if needed Control – if this idea is to be considered, does this group
have the ability to implement; if not, eliminate the idea4. Assign a number to each idea sequentially (if you have more than 18 ideas, you will need a second
sheet for each participant)5. Switch to the PowerPoint slide showing the Idea Evaluator Matrix. Explain the Idea Evaluator Matrix
emphasizing these points: Horizontal axis represents impact and increases from left to right Vertical axis represents cost and increases from top to bottom; cost includes time, resources,
and money The matrix is made up of 4 categories:
A = Low cost, high impact (do it!)B = High cost, high impact (no pain, no gain)C = Low cost, low impact (may or may not be worth it)X = High cost, low impact (probably not worth it)
© The Employee Engagement Group 8 - 17 Session 8All rights reserved
Tips for Facilitating Brainstorming
Quantity vs. quality – promote rapid fire ideas
Piggy-backing on other ideas is encouraged
Capture all ideas All ideas are ‘good’ in the
beginning – don’t allow judg-ment, discussion, or debate
Prevent domination of one person; no long explanations
Ask clarifying questions
6. Ask participants to have their Idea Evaluator Form in front of them. Read these directions to participants to clearly describe the process.
On your own, you are to rate each idea by placing a small ‘x’ or ‘dot’ in one of the 4 boxes. The mark should be placed relative to where it goes on the cost/impact scales. The higher the impact, the further to the right the mark will be within the box; the lower the cost, the higher the mark will be within the box. Remember that the vertical axis of the matrix is situated from top to bottom, high to low.
7. Once everyone has finished, Option 1 – ask the participants to .PDF their documents and e-mail them to you. Compile the
results on a single form and send back to the participants with your notes and objectives for the next session
Option 2 – open a pre-formatted polling question; ask participants to rate each of the; make sure everyone has a chance to rate all ideas
8. After step 7 is complete, the results should show an indication of how the ideas should be prioritized; lead the group in a discussion to determine best next steps based on ratings and resources. Note the following as you discuss: Ideas with many marks in the ‘A’ rating may be quickly adopted as high priorities; be sure to listen
to those who rated this idea as a ‘B’ or ‘C’ to be sure key concepts aren’t being overlooked Ideas with may ‘B’ marks require an additional discussion of resources – once again, does this
group have the ability to truly implement or are there too many dependencies Don’t discount ideas too quickly, even if they fall into the ‘X’ or ‘C’ rating; low impact ideas may
still have value
© The Employee Engagement Group 8 - 18 Session 8All rights reserved

Facilitator Instructions (live group meeting)
Objective:The purpose of this exercise is to evaluate ideas in order to prioritize based on cost and impact.
Preparation: Make enough copies of the 2-page Idea Evaluator Form for each participant to have one (make a
few extra copies as back-up) Prepare a 10 – 12 flip chart pages with a 4 grid matrix labeled A, B, C, and X as shown below;
number each page sequentially (1 – whatever number of pages). Be prepared to add additional pages to accommodate the number of questions.
Directions 1. Brainstorm ideas in smaller groups of an open environment; write
ideas on flip chart paper. If done in small groups, collect and combine ideas onto
one central list on flip chart paper2. Work with the group to combine similar ideas to minimize
repetition3. Go over each idea to determine:
Clarity – be sure the participants truly understand the idea – rewrite if needed
Control – if this idea is to be considered, does this group have the ability to implement; if not, eliminate the idea
4. Assign a number to each idea sequentially (if you have more than 18 ideas, you will need a second sheet for each participant)
5. Hand out the form and matrix to each participant and explain the Idea Evaluator Matrix emphasizing these points: Horizontal axis represents impact and increases from left to right Vertical axis represents cost and increases from top to bottom; cost includes time, resources,
and money The matrix is made up of 4 categories:
A = Low cost, high impact (do it!)B = High cost, high impact (no pain, no gain)C = Low cost, low impact (may or may not be worth it)X = High cost, low impact (probably not worth it)
© The Employee Engagement Group 8 - 19 Session 8All rights reserved
Tips for Facilitating Brainstorming
Quantity vs. quality – promote rapid fire ideas
Piggy-backing on other ideas is encouraged
Capture all ideas All ideas are ‘good’ in the
beginning – don’t allow judg-ment, discussion, or debate
Prevent domination of one person; no long explanations
Ask clarifying questions

6. Read these directions to participants to clearly describe the process.On your own, you are to rate each idea by placing a small ‘x’ or ‘dot’ in one of the 4 boxes. The mark should be placed relative to where it goes on the cost/impact scales. The higher the impact, the further to the right the mark will be within the box; the lower the cost, the higher the mark will be within the box. Remember that the vertical axis of the matrix is situated from top to bottom, high to low.
7. Once everyone has finished, on the numbered flip chart pages ask participants to transfer their ratings from their paper to the quadrants on the page in approximately the same position.
8. After step 7 is complete, each flip chart should provide an indication of how the ideas should be prioritized; lead the group in a discussion to determine best next steps based on ratings and resources. Note the following as you discuss: Ideas with many marks in the ‘A’ rating may be quickly adopted as high priorities; be sure to listen
to those who rated this idea as a ‘B’ or ‘C’ to be sure key concepts aren’t being overlooked Ideas with may ‘B’ marks require an additional discussion of resources – once again, does this
group have the ability to truly implement or are there too many dependencies Don’t discount ideas too quickly, even if they fall into the ‘X’ or ‘C’ rating; low impact ideas may
still have value
© The Employee Engagement Group 8 - 20 Session 8All rights reserved
HIT Action Planning Worksheet
Action PlanDate:
Metric Area Opportunity Identified Specific Action Results Expected Responsible Person
Timetable
Note in this space any incentives associated with accomplishment of particular opportunities and related actions or any overall incentives:
© The Employee Engagement Group 8 - 21 Session 8All rights reserved
How to Create a Successful Balanced Scorecard
What is a Balanced ScorecardThe balanced scorecard is a concept and tool first conceived by by Robert Kaplan and David Norton. The balanced scorecard idea debuted in the Harvard Business Review in 1992.
"The balanced scorecard retains traditional financial measures. But financial measures tell the story of past events, an adequate story for industrial age companies for which investments in long-term capabilities and customer relationships were not critical for success. These financial measures are inadequate, however, for guiding and evaluating the journey that information age companies must make to create future value through investment in customers, suppliers, employees, processes, technology, and innovation."
It allows managers a tool on which view critical operational factors and their inter-relationships with current and future performance in mind.
When developing your Balanced Scorecard, the focus should be on organizational vision and long-term success, not on control and compliance (see ‘Recommendations for Success’ in this document.
The Process for Developing a Balanced Scorecard Get enthusiastic support and commitment from top management Carefully design the design team
• Cross-representation• Get your IT support on
board early Determine what the true drivers
of performance are• Enlightening process• Defines the “heart” of the
organization• Focus in on ‘cause and
effect’ relationships Determining how to measure (would you like that in pounds, inches, pieces or
adjectives?) Identify the design and functionality criteria? Create consistent definitions
Rolling Out Your Balanced Scorecard Create a Communication Plan – let people know why it’s there and how to use it Avoid an “identity crisis” Conduct a training session or at least an overview and tour for all employees
© The Employee Engagement Group 8 - 22 Session 8All rights reserved
Maintaining Your Balanced Scorecard On-going investment will be different in every organization In case study company’s case:
• Manual HR and H&S input each month (sometimes a bottleneck) • Delays from chasing and “normalizing” international data• Data still requires QA by knowledgeable person to ground-truth
Constant communication and integration with internal processes IT resources to update and maintain
Keeping the Balanced Scorecard Vibrant Reference the Balanced Scorecard in monthly CEO communication
• See information on Communication Protocol for more information about CEO communications
Use the information and, if possible, the live tool in the quarterly operations review Create a prominent place for the tool on your intranet
• Link from home page – make it easy to access• Make the scorecard page your default intranet home page (at least for a while)
Point employees to the Balanced Scorecard page instead of answering their questions • If they want to know something that is on the Balanced Scorecard, refer them
(even if you know the answer)• Empower them to find their own answers
Communicate positive trends visible on scorecard, as well as negative trends as an “early warning system”
Recommendations for Success Before anything else, seek management buy-in! Make sure someone owns it – it is best to have one person own and be responsible for
the project Keep the Balanced Scorecard simple and focused
• Think one screen and one page Metrics (drivers) have to be aligned with goals, especially at company level.
• Answer the question: What will fulfill the mission of the organization? Include the Balanced Scorecard link in as many communications and activities as
possible or conceivable. Get it in front of the employees at every opportunity, especially as it is rolled out
Numbers are the drivers of the Balanced Scorecard but pictures are essential for effective communication and ongoing use
Establish meaningful benchmarks/ comparisons to historical data Make it relevant and understandable to all employees When trends go south – engage employees in correcting the course (it’s about vision
and long-term success) Treat it as a learning tool – not a control tool!
© The Employee Engagement Group 8 - 23 Session 8All rights reserved