Embed Size (px)
Citation preview

Performance Management accounting
CUAC 411 Modules
Design of Management Accounting systems
Planning, Controlling and Decision Making
Hierarchy
-Planning, controlling and decision making can be classified into tree levels namely:
1. Strategic Planning
The process of developing long term plans for the organisation that is 5-10years or more
This mainly concerns new products to be launched, new markets to be developed etc.
It is planning and decision making done at board level and this tends to be an outline rather than detailed planning.
2. Management Planning/Tactical planning
A more detailed short-term planning for example one year budget in order to ensure resources are obtained and used efficiently to achieve the long term plans of the company.
This focuses on future staff needs of the company Control is then exercised against the budget using the aspect of variance
analysis.
3. Operational Control
The day to day management of the business in order to ensure that specific tasks are carried out effectively and efficiently for example ensuring that budgeted production has been achieved effectively.
The information used will be very detailed and will be quantitative but will often be expressed in terms of time taken that is hours or output for example units instead of in monetary terms.

Strategic Planning
The strategic plan covers the following
Vision
MISSION
GOALS AND OBJECTIVES
POSITION AUDIT
CORPORATE APPRAISALENVIRONMENTAL
ANALYSIS
STRATEGY CHOICE
STRATEGY IMPLEMENTATION
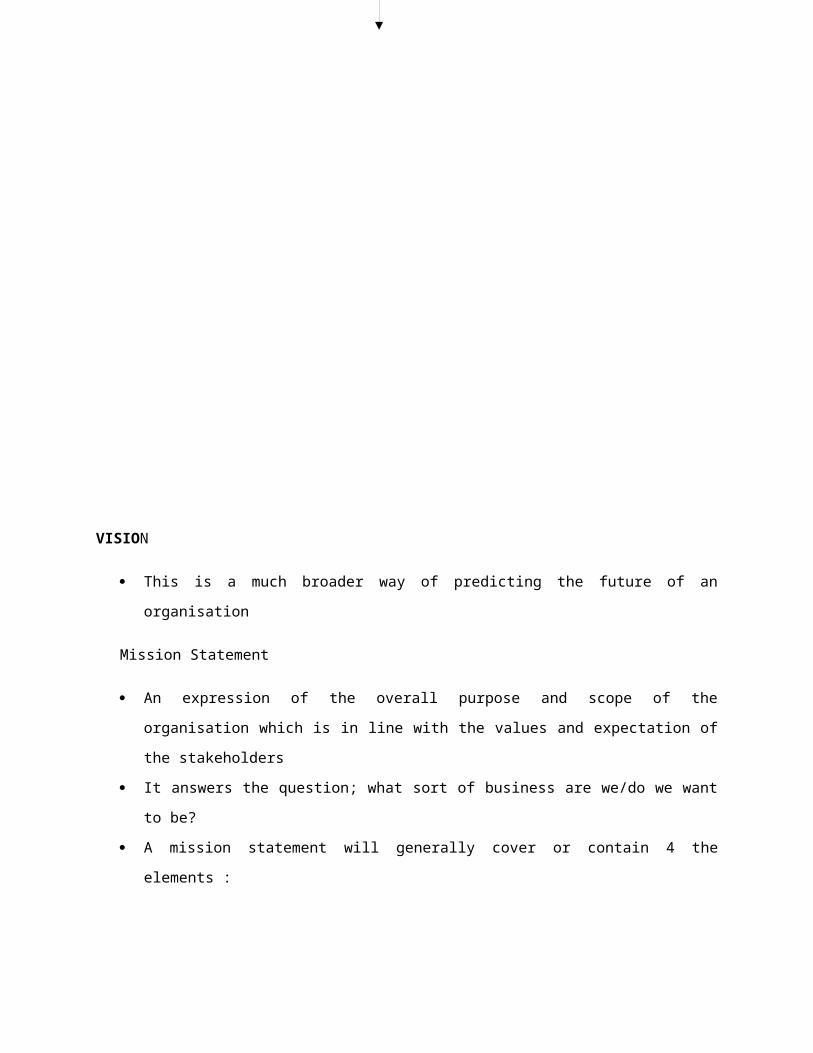
VISION
This is a much broader way of predicting the future of an organisation
Mission Statement
An expression of the overall purpose and scope of the organisation which is in line with the values and expectation of the stakeholders
It answers the question; what sort of business are we/do we want to be? A mission statement will generally cover or contain 4 the elements :
1. Purpose -what and for whom the company exist for?
2. Strategy The range of business in which the firm seems to compete and some
indications of how it intends to compete.
3. Polices and Behavior Standards These are the guidelines which help staff decide what to do on a day –to –day
basis to carry out the strategy.
4. Values These are the beliefs and moral principles which lie behind the firm’s culture. The purpose of the mission statement is to communicate to stakeholders, the
nature of the organisation and to focus strategy. However, in practice, there are generally full meaningless phrases. Taking an organisation of your choice, briefly outline its mission statement.
Goals and Objectives -Goal is broader than objectives, these are also known as aims of the entity. Goals and objectives are often put together without any distinction made
between them. e.g. of goals could be to improve profit or to reduce costs.
However, goals are statements of general intention where as objectives are more specific or targeted.
An objective could be to achieve a 10% return on asset or a 10% mark-up /margin within 6 months 1 year, 2 years etc.
- Objectives must be smart (specific,measurable,attainable,realistic and time –bound)
Example of financial objectives are :for the next 12months : To increase operating profit by 20%. To increase return on capital employed by at least 15%. To cut net losses to below 0, 5%.
Examples of goals: To be a clear leader in the market. Achieving biggest growth in volumes/meeting higher customer
satisfaction.
Corporate Appraisal It is a critical assessment of the strengths, weaknesses, opportunities and
threats in relation with the external and internal factors affecting an organisation.
The purpose is to establish the condition of an organisation prior to preparing a long-term strategic plan.
Position Audit This assesses the strength and weaknesses of the company by asking
questions such as: what are we good/bad at? In particular, existing products will be reviewed and consideration given as to
which products should be continued /promoted and which ones to be phased out /abandoned.
0ne thing to be considered in relation to each pr0duct is as to where it is positioned currently on its product life cycle.
Diagram
If the product is currently in the maturity /decline phase, the company needs to develop strategies for replacement of the product in the long term rather than relying on its continuing profitability.
NB. The pricing methods used depend on whether they are appropriate to the circumstance in which they are used.
It may be appropriate to charge the same price as competitors, e.g if customers perceive different producers` products as largely generic since no significant are achieved.
In situations where competition is limited ,competitors ‘s prices provide no real yardstick and hence full cost +mark up provides the way of arriving at a fair price which is reasonable relative to cost of production.
The general problem with adhoc approaches to pricing is the danger that the pricing approach used in particular circumstances will not be appropriate in other circumstances, will not serve the company’s strategic objectives and ultimately will be sub-optimum.
The proposal to adopt a strategic approach to pricing (is a very good one especially where it is started that there is no intention to lock the company into one particular approach to pricing.
Possible Strategies to pricing1. Pricing permanently a product at a level in excess of competitors’
comparable product. This is only feasible as part of product differentiation strategy. Here, the
supplier needs to convince customers that its products are superior to those of competitors and hence the need for customers to pay extra for superiority.
However shrinking consumer incomes may cause few customers to accept to a price premium and hence this lowers profitability of the entity.
2. Setting a high price in early months of a product’s life cycle and reducing the price for the remainder of the cycle.
The technique is used for ensuring that enthusiastic ‘early adopters (those who are not price sensitive) pay a higher price for the product.
The approach is not suitable for regular items like food where profitability is achieved through customer frequency and repeat purchases.
It is also not proper where competitors offer similar products.3. Charging a low price in the early months of a product’s life cycle and then increasing the price for the remainder of the product’s life cycle. (Addictive products).
It is a good way to penetrate a market where the key to profitability is to ensure that customers make repeat purchases.
The low initial price will encourage customers to try new products and this becomes an effective way of gaining market share.
Subsequent increases in selling price provide profitability although price sensitive customers may be lost at this stage.
The strategy is effective in building customer loyalty to a differentiated product.
4. Selling a product at loss throughout its life cycle This is desirable if it facilitates the profitability of some other product ranges. Example, in order to obtain shelf space from a bread retailer there may be
need to a comprehensive range of bread products for various allergy sufferers.
The major goal is to achieve overall profitability of many products rather than an individual product from the distribution channel.
5. Bundling Products This is a way of concealing individual product prices from the customer. The profitability of a bundle can be assessed by comparing its sale price with
the combined production and distribution costs of the products in the bundle. While bundles may be profitable, the customer is forced to buy some
products which may be unwanted.

Difficult strategy to sustain since their opportunities for competitors to offer customers the chance to buy similar products individually rather than purchase the entire bundle.
A potentially useful approach to considering each existing product is to position them on a Boston Matrix Grid.
Market share
High low
GROWTH
Low high
QUESTION MARK This generates income but consumes more so we have aggressive marketing
to turn product into cash cow.Cash Cow
This is a well invested product and this generates income, all you have to do is to maintain the low growth.
Dog Is a product that no longer generates cash
STAR QUESTION MARK
CASH COW DOG
STAR Generates cash but consumes all what it generates and investment is needed
to turn products to cash cow. N.B. Having positioned the products on the grid, it can then be used to
consider future strategy for each of them.
An environmental analysis can be carried out which identifies the opportunities and threats presented by the external environment.
These are summarized as PEST analysis.Additionally (esp. when launching a new product) consideration may be given to Porter’s 5 forces model i.e.:
Threat new entrance Threat of substitute Bargaining power of buyers Bargaining power of suppliers Rivalry between competitors
The Ansoff’s product market matrix can also be used. This is commonly used by businesses that have growth as their main
objective and is used to focus management attention on the four main alternative (strategic) available for growth.
Existing products new products Existing market Market penetration
EXISTING MARKET PRODUCT
PENETRATION DEVELOPMENT
MARKET
MARKET PRODUCT
NEW DEVELOPMENT DIVERSIFICATION
MARKET

|||||||||||||||||||||||||||||||||||||||||||||||||||||||||||||||||||||||\\\\
Having carried out the position audit and environmental analysis the task is to develop the strategies in order to:1. Convert weaknesses into strengthii) Convert threats into opportunities.iii) Match strengths and opportunities
The exercise is commonly
A SWOT analysis helps in identifying suitable strategy
To assist in identifying sufficient strategies, a gap analysis is also required.
Diagram
The types of strategy that can be adopted in order to fill the gap are:
Cost saving measures Becoming more efficient Making changes to the product /the market matrix, this could be by
organic or by acquisition Withdrawal.
Strategic Choice Having carried out a corporate appraisal and having identified potential
strategies, it is then necessary to appraise them and formulate a strategic plan.
The types of techniques that may be employed in appraising the strategies are :

i) Strategy Implementation
The strategic plan will generate the formulated on the board level and once it has been prepared, managers of the company are then expected to implement it.
The management will then carry out tactical planning0r management control.
II) Free Wheel Opportunitism This occurs where the company deals without a strategic plan but
operate a system where the opportunities are exploited as they arise. The major advantage is that opportunities can be sized as they arise. The major drawback is that it cannot guarantee that all opportunities are
identified and appraised.

TARGET COSTINGHistorical Background
It originated in Japan in the 1970s, it came to being as a result of recognition that customers were demanding more diversity in products that they bought and the life cycle of the products were getting shorter.
As such, it meant that new products had to be designed more frequently. Companies realised that the larger proportion of costs were committed in the
design stage of the product and hence the design stage become critical for the company to make profit.
Purpose Target costing is a method that is employed to manage costs and profits. It involves setting a target or objective for the maximum of a product /service
and working out now to achieve this target. It is used for business strategy and marketing strategy in particular by
companies who operate in a competitive environment and where new products are continuously being introduced.
For companies to achieve these, they need to: Continually improve their existing products or design new ones. Sell their products at a competitive price just like competitors or
slightly below competitors. Make a profit.
NB in order to make a profit, companies need to make the product at a cost below the expected sale price.
Target costing and New product Development

It is mainly used for new product development; this is due to the fact that whenever a new product is designed and developed for a competitive market, a company needs to know what maximum cost to be placed on a new product so that it will sell at a profit.
Keeping the cost of the product within the target level is the major factor in controlling its design and development.
New product design and developmentSetting target cost
$Target selling price xxxxLess target margin xxxTarget cost xx
The reason that target costing is used for new products is the opportunities for cutting costs to meet target costs since it is from the design stage and development that all production processes are set up.
Target costing method The principles of target costing can be summarized as: Target costing is based on the idea that when a new product is developed ,a
company will have a reasonable idea about: i) The price at which it will sell the product. ii) The sales volume that will be able to achieve for the products over its product life. iii) Their may be need to estimate capital investments, incremental fixed costs such as marketing costs and additional salaries. Taking estimates of sales volumes, capital investments, incremental costs
over the life of the product, it then becomes easier to ascertain the target cost.
The target cost for the product might be the maximum cost for the product that will provide at a least a required return on the investment.

Elements in Estimates Cost and Target Cost It is difficult to measure the cost of a product that has not yet been created
and the cost must include such items as raw material wastage, direct labour idle time which is expected to occur in normal circumstances.
Raw material The target cost should allow for expected wastage rates/wastage in the
process. The price of raw material should also allow for any possible increase up to
the time when the new product development is completed. Estimating price of raw materials can be difficult in inflation times when
prices are subject to large price increases within short periods.Labour Target cost should allow for any expected idle time that occurs during the
manufacturing of the product.
Production Overheads A target cost could be a target marginal cost or full cost. Production overheads, in some cases make up a large portion of the total
manufacturing cost and as such target cost should be based on full cost.NB Activity based costing can be employed to absorb costs rather than the traditional methods.
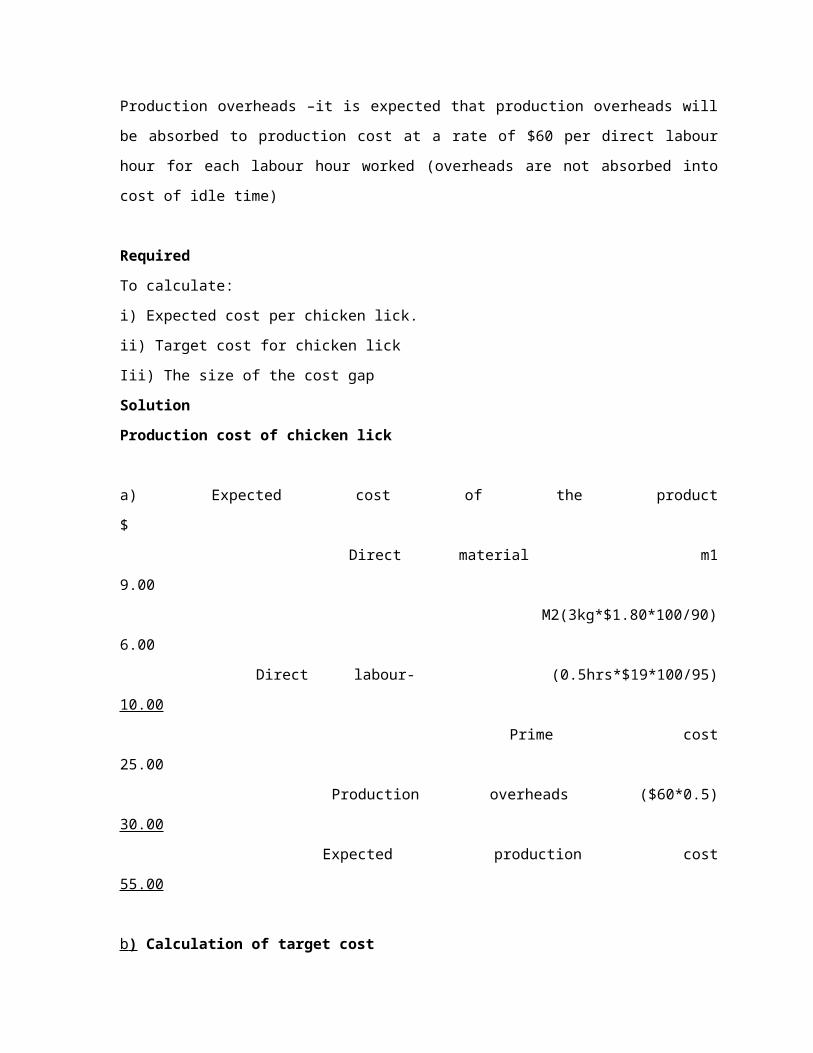
Example A company has designed a new product, chicken lick; it currently estimates
that in the current market, the product could be sold for $70.00 a unit. A gross profit margin of 30% on the selling price would be required to cover administration, marketing overheads and also make an acceptable level of profit. A cost estimation study has produced the following estimate of production cost for chicken lick.
Cost item I. Direct material m1 $9/unit Direct material m2 each unit would require 3kgs of material m2 but there will be a loss in production of 10% of the material used. Material m2 cost $1.80 per
kg. Direct labour –each unit of chicken lick will require 0,5hours of direct labour time. However, it is expected that there would unavoidable idle time equal to 5% of total labour time paid at $19 per hour.Production overheads –it is expected that production overheads will be absorbed to production cost at a rate of $60 per direct labour hour for each labour hour worked (overheads are not absorbed into cost of idle time)
Required To calculate:i) Expected cost per chicken lick.ii) Target cost for chicken lickIii) The size of the cost gapSolutionProduction cost of chicken lick
a) Expected cost of the product $ Direct material m1 9.00 M2(3kg*$1.80*100/90) 6.00 Direct labour- (0.5hrs*$19*100/95) 10.00 Prime cost 25.00 Production overheads ($60*0.5) 30.00 Expected production cost 55.00
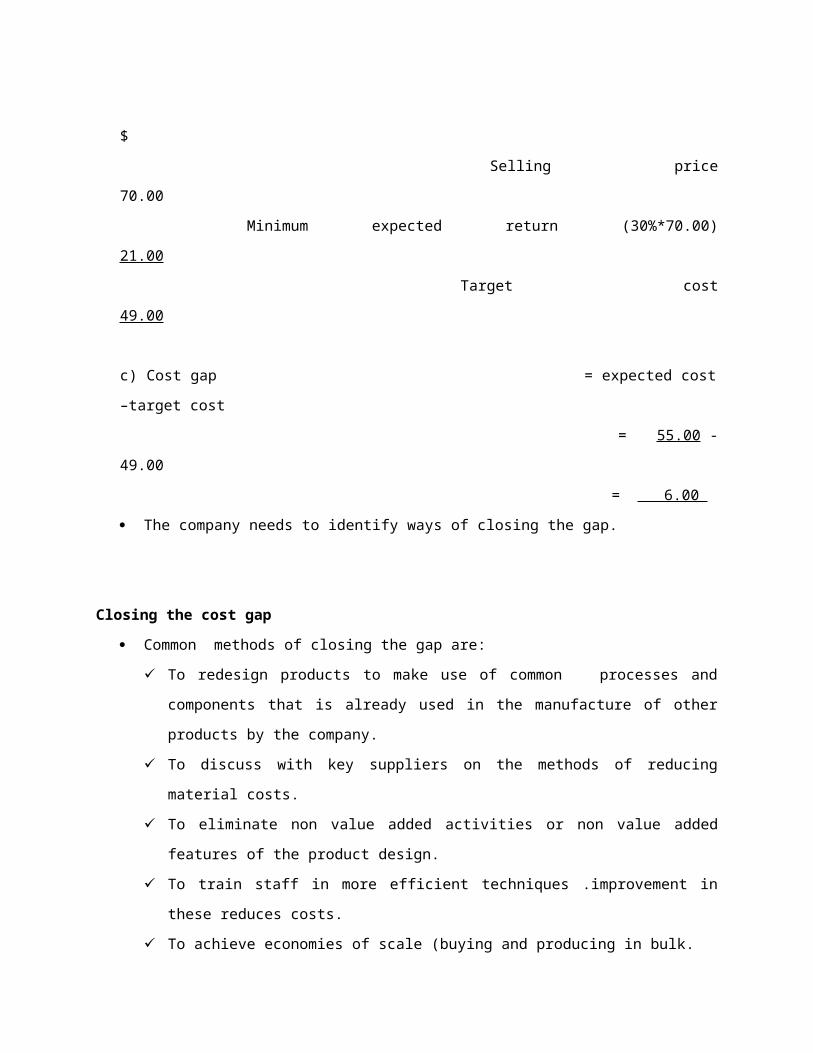
b ) Calculation of target cost $ Selling price 70.00 Minimum expected return (30%*70.00) 21.00 Target cost 49.00
c) Cost gap = expected cost –target cost = 55.00 -49.00 = 6.00 The company needs to identify ways of closing the gap.

Closing the cost gap Common methods of closing the gap are:
To redesign products to make use of common processes and components that is already used in the manufacture of other products by the company.
To discuss with key suppliers on the methods of reducing material costs. To eliminate non value added activities or non value added features of the
product design. To train staff in more efficient techniques .improvement in these reduces
costs. To achieve economies of scale (buying and producing in bulk. To achieve cost reduction as a result of the learning curve effect that is
through experience curve effect.
Advantages of target costing It helps to improve the understanding within a company 0f product cost. It recognizes that the most effective way of reducing costs is to plan and
control cost from the design stage onwards. It helps to create a focus on the final consumer for the product or service
because of the concept of value. It can be used together with recognized methods for reducing costs such as
JIT, process engineering, and total quality management.
Implications of target costing Target costing can be used with the pricing policy for a company or service. It assists in cost control and performance measurement that is
Cost savings are actively sought and made continuously over the product ‘life cycle.
There is joint responsibility for achieving benchmarking that is if one department fails to deliver the cost saving expected, other departments may find ways to achieve the savings.
Staff are trained and empowered to find ways of reducing costs while maintaining product quality.

NB Target costing is likely to succeed in company where there is a culture of continuous improvement.
Limitations 1. It is sometimes unrealistic hence unachievable targets are set.2. May demotivate workers if they fail to meet their targets.
Practice questions

PRODUCT LIFE CYCLE COSTING /WHOLE LIFE CYCLE COSTING This is a costing method that considers the cost of a product or on an asset
over its entire marketable or useful life. Life cycle costing tracks and accumulates costs and revenue attributable to
each product over the entire product life cycle. It can be applied to:
Products that are introduced to the market and then manufactured and sold over a number of years until they are eventually withdrawn from the market.
Building and other major construction items whose cost change over their useful life from construction to eventual demolition.
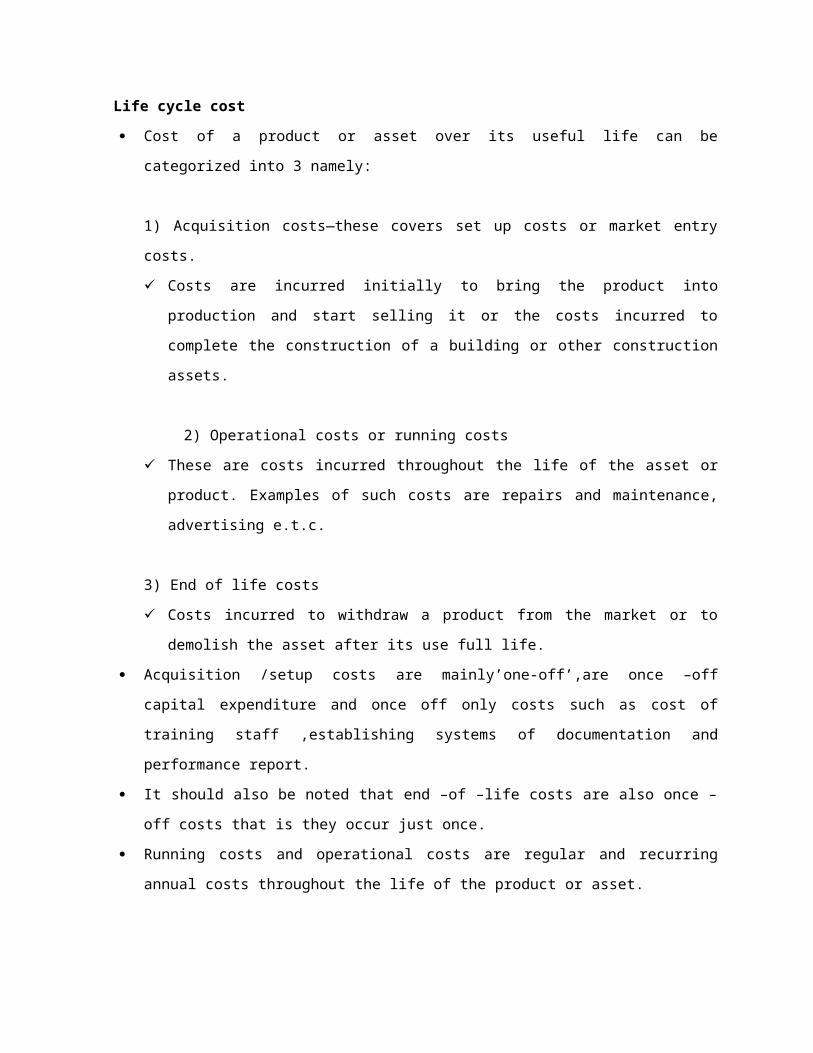
Life cycle cost Cost of a product or asset over its useful life can be categorized into 3
namely:
1) Acquisition costs—these covers set up costs or market entry costs. Costs are incurred initially to bring the product into production and start
selling it or the costs incurred to complete the construction of a building or other construction assets.
2) Operational costs or running costs These are costs incurred throughout the life of the asset or product.
Examples of such costs are repairs and maintenance, advertising e.t.c.
3) End of life costs Costs incurred to withdraw a product from the market or to demolish the
asset after its use full life. Acquisition /setup costs are mainly’one-off’,are once –off capital expenditure
and once off only costs such as cost of training staff ,establishing systems of documentation and performance report.
It should also be noted that end –of –life costs are also once –off costs that is they occur just once.
Running costs and operational costs are regular and recurring annual costs throughout the life of the product or asset.
However, these costs may vary overtime for example maintenance and repair cost of equipment such as elevators in a building industry which are likely to increase as equipment ages.
Although costs are incurred throughout the life span of an asset, a large proportion of these costs are incurred or committed at a very early stage of the product’s life cycle when the decision to develop the new product or construct a new building is made.
The product life cycle Most products made in large quantities for selling to customers go through a
life cycle. A life cycle consists of several stages:
Research and development of the product(design and development stage) Introduction to the market Growth in sales and market size Maturity Decline The product is finally withdrawn from the market.
Detail stages
Example of whole life costing Romantic ltd specializes in the manufacture of invertors .it is planning to
produce a new inverter specially designed for small houses. Development of the new inverter is to begin shortly and Romantic ltd is in the process of determining the price of the inverter. It expects the new product to have the following costs ;
Year 1 2 3 4Units manufactured 3000 12000 18000 7000
$ $ $ $Research and Development 1800 000 200 000 ---- ---Marketing costs 150 000 50 000 25 000 15000Production cost/unit 650 450 350 300Customer service cost/unit 40 30 30 30Disposal specialist equipment 350 000
The marketing Director believes that customers would be prepared to pay $480 for an inverter but the Financial Director believes this will not cover all the costs throughout the products ‘life cycle.
Required Calculate the cost /unit on the whole life cycle and comment on the suggested price.
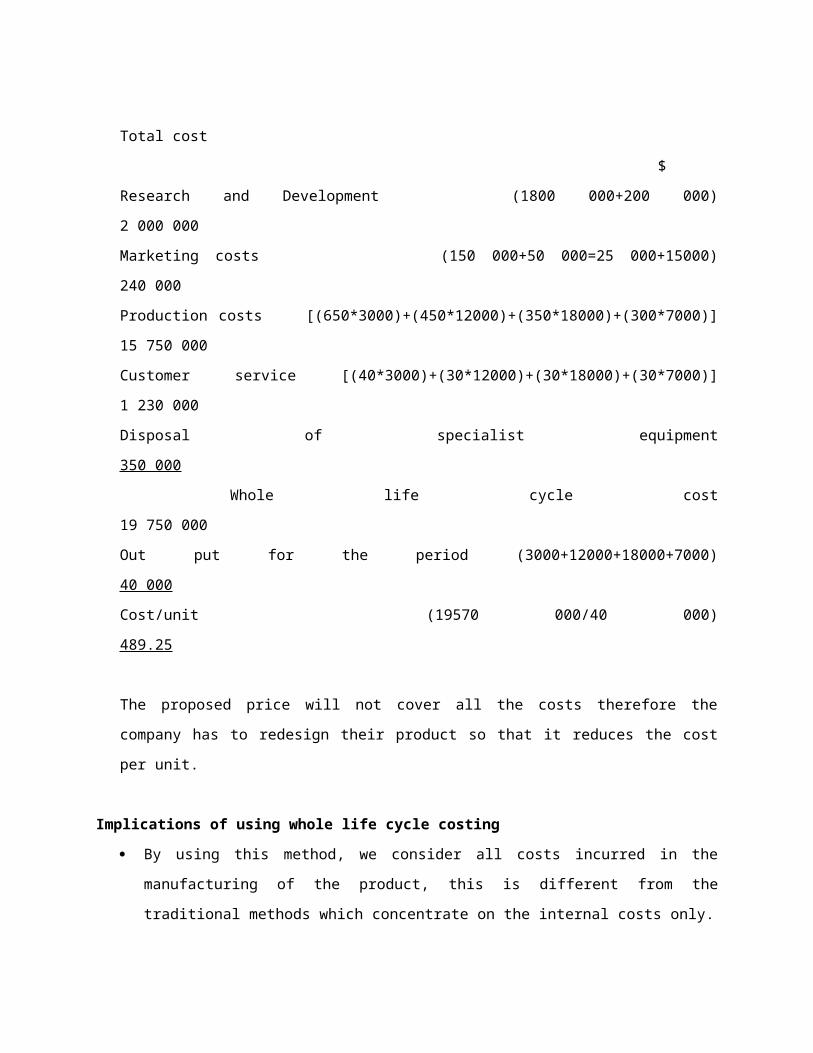
Solution PRODUCT LIFE CYCLE COSTING. Total cost
$

Research and Development (1800 000+200 000) 2 000 000Marketing costs (150 000+50 000=25 000+15000) 240 000Production costs [(650*3000)+(450*12000)+(350*18000)+(300*7000)] 15 750 000 Customer service [(40*3000)+(30*12000)+(30*18000)+(30*7000)] 1 230 000Disposal of specialist equipment 350 000 Whole life cycle cost 19 750 000Out put for the period (3000+12000+18000+7000) 40 000Cost/unit (19570 000/40 000) 489.25
The proposed price will not cover all the costs therefore the company has to redesign their product so that it reduces the cost per unit.
Implications of using whole life cycle costing By using this method, we consider all costs incurred in the manufacturing of
the product, this is different from the traditional methods which concentrate on the internal costs only.
Research and Development costs are written off as they are incurred. Profits are measured on a time/annual basis rather than on whole life under
tradional methods. Non –production overheads are not linked to products but written off as
general expenses under traditional methods. However ,life cycle costing compares the revenues and cost of the product over its entire life and the benefits accruing there from are;
Potential profitability of products can be assessed before major development of the product is carried out and the costs are incurred thereby enabling elimination of non-profitable products.
Techniques can be used to reduce costs over the life of the product.

The pricing strategy can be determined before the product enters production. This may lead to better control of marketing and distribution costs.
It also enables attention to be focused on reducing research and development costs to get the product to the market as quickly as possible.
By monitoring the actual performance of products against plans, lessons can be learnt to improve the performance of future products and it may also be possible to improve the estimating techniques.
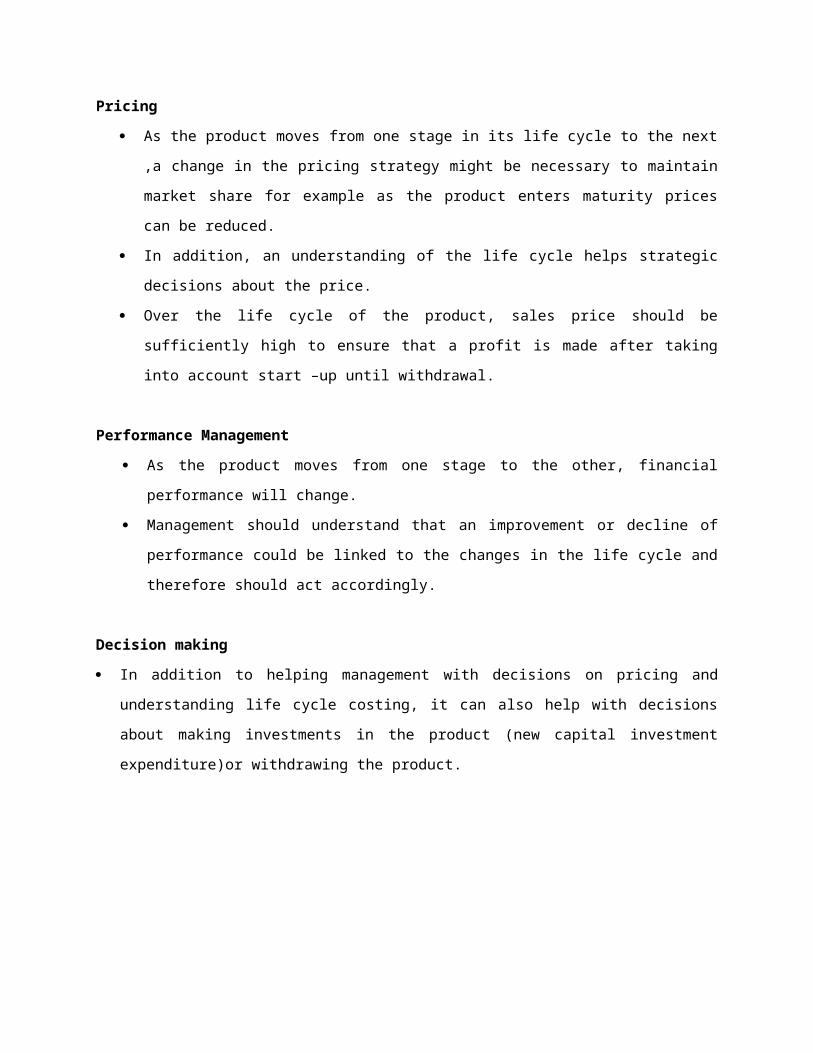
NB. An understanding of the product life cycle can also assist management with decisions about pricing, performance management and decision making.
Pricing As the product moves from one stage in its life cycle to the next ,a change in
the pricing strategy might be necessary to maintain market share for example as the product enters maturity prices can be reduced.
In addition, an understanding of the life cycle helps strategic decisions about the price.
Over the life cycle of the product, sales price should be sufficiently high to ensure that a profit is made after taking into account start –up until withdrawal.
Performance Management As the product moves from one stage to the other, financial performance will
change. Management should understand that an improvement or decline of
performance could be linked to the changes in the life cycle and therefore should act accordingly.
Decision making In addition to helping management with decisions on pricing and understanding
life cycle costing, it can also help with decisions about making investments in the product (new capital investment expenditure)or withdrawing the product.

ACTIVITY BASED COSTING (ABC)
It is a costing approach that analyses all activities to identify what drives costs incurred that is what causes costs to increase.
The major ideas behind ABC are: Activities cause costs—these activities include ordering materials,
handling, dispatching etc It believes that it is the products that create demand for the
activities. Costs are assigned to products on the basis of the product’s
consumption of the activities. NB In ABC:
Some manufacturing costs may be excluded from product costs. Non manufacturing overheads as well as manufacturing costs may be
assigned to products. Overhead /activity rates are based on the activity level at capacity rather
than on budgeted levels. An activity is an event that causes the consumption of overhead resources.
A number of overhead cost pools, each allocated to products and other costing methods /objects using its own unique measure of activity.
Cost driver This is a factor that directly influences cost over a relevant range of activity.
This could be number of orders, number of production runs, number of dispatches, labour hours and machine hours.
Cost Pool This is a bucket in which costs are accumulated that relate to the single
activities.
Reasons for the development of Activity Based Costing Activity Based Costing was developed to overcome the inability of absorption
costing to deal with the features of modern manufacturing methods. This was re –necessisted as a result of growth of overheads and the advent of
advanced manufacturing technology (AMT) that reduce the importance of labour.

The traditional methods failed to take into account the increasing complexity of modern manufacturing method.
The modern approaches are characterized by: An increased amount of overheads as a proportion of total cost. An increase in the cost of service support functions which assist in
the manufacturing of a wide range of goods and services that are unaffected by changes in production volume varying instead with the range and complexity of the products.
Shortfalls of the Traditional Methods (Absorption) It implied that all overheads were related primarily into production volume. These were developed at time when organisations produced a narrow range
of overheads and these overheads formed a small fraction of total costs. The traditional approach tends to allocate too great a proportion of
overheads to high volume products and a too small proportion of overheads to low volume products.
Steps in Activity Based Costing Identify an organisation’s major activities. Identify the cost drivers for each major activity for example: Activity cost driver Ordering number of orders made Material handling number of material movements Production scheduling production runs Dispatching number of dispatches etc Collect the cost associated with each activity into cost pools. Charge the activity cost to products on the basis of the number of activity
depending on the product’s demand for activities.
Example

Advantages ABC focuses attention on the real nature of cost behavior and hence helps in
reducing cost and identifying activities which do not add value to the product.
More realistic as the product costs are provided and overhead cost traced to the product.
It is flexible enough to trace costs and processes, customer areas of responsibility as well as product cost.
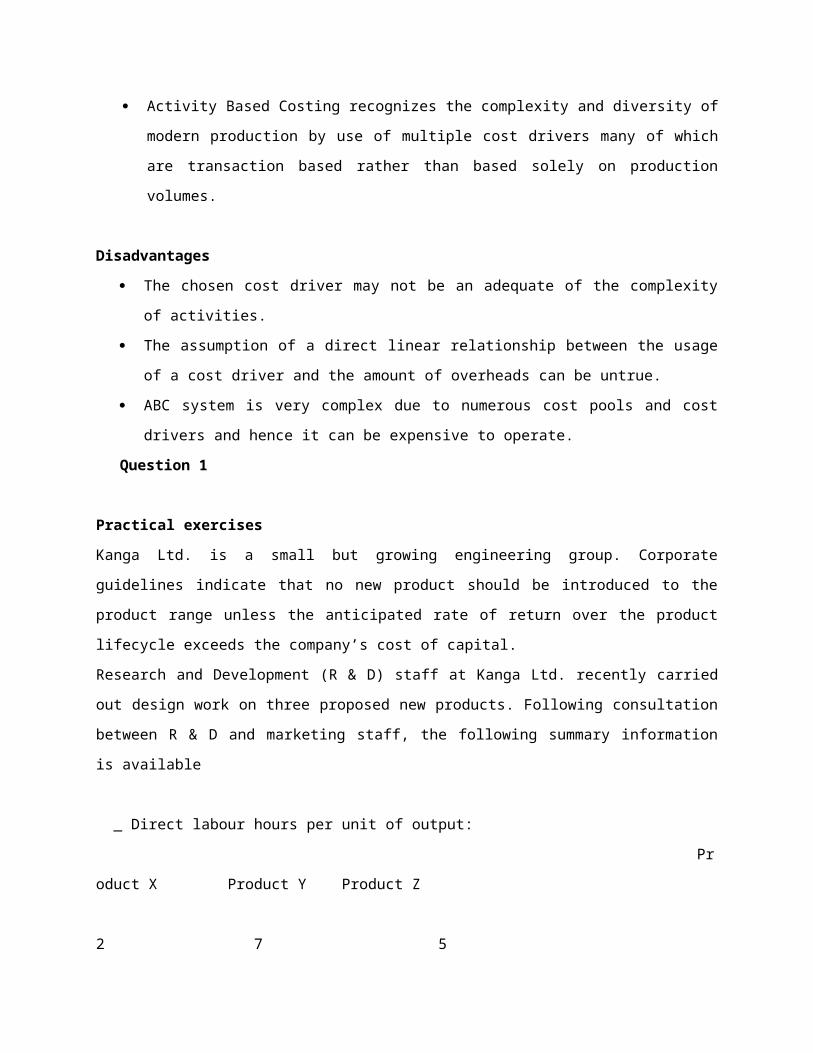
Activity Based Costing recognizes the complexity and diversity of modern production by use of multiple cost drivers many of which are transaction based rather than based solely on production volumes.
Disadvantages The chosen cost driver may not be an adequate of the complexity of
activities. The assumption of a direct linear relationship between the usage of a cost
driver and the amount of overheads can be untrue. ABC system is very complex due to numerous cost pools and cost drivers and
hence it can be expensive to operate.Question 1
Practical exercisesKanga Ltd. is a small but growing engineering group. Corporate guidelines indicate that no new product should be introduced to the product range unless the anticipated rate of return over the product lifecycle exceeds the company’s cost of capital.Research and Development (R & D) staff at Kanga Ltd. recently carried out design work on three proposed new products. Following consultation between R & D and marketing staff, the following summary information is available
_ Direct labour hours per unit of output: Product X Product Y Product Z 2 7 5_ Production and sales quantities per month:
Product X Product Y Product Z 9,500 9,000 11,000_ Total monthly overhead activity and costs in producing the three products:
Cost per month Level of cost driver activityCutting operations $12500 2500 per monthMaterials movements $9600 160 per monthProduction set-ups $7200 15 per month
A target costing team established by Kanga Ltd. reviewed the data from the R & D staff. The marketing staff warned that none of the three products will be adequately profitable, given the expected market conditions and the cost of manufacturing the products using the proposed design.In an attempt to improve profitability, the target costing team subsequently worked with the R & D staff to redesign Products Y and Z. The marketing staff confirmed that these design modifications will have no effect on demand for the finished products. The reductions in monthly activity levels as a result of these design changes are expected to be as follows: Effect of design changes: Effect of design changes: Product Y Product ZReduction in number of cutting operations 114 200Reduction in number of materials movements 30 34Reduction in number of production set-ups 2 1It was found to be impossible to make any changes to the design of Product X.REQUIRED:(a) Assume that the proposed design changes will be implemented. Calculate the resulting reduction in the unit cost of each of the company’s products in the following circumstances:_ If all overheads are traced to products using activity-based costing.

_ If all overheads are allocated to products on a direct labour hour basis. (12 marks)
(b) Explain (using the example of Kanga Ltd. to illustrate your answer) why an activity based costing system is essential for the implementation of target costing. (5 marks)
(c) A junior member of management at Kanga Ltd. has suggested that the company could expand its product range more quickly by eliminating the requirement that no new product should be introduced to the product range unless the anticipated rate of return over the product lifecycle exceeds the company’s cost of capital. Comment on this suggestion. (3 marks)[Total: 25 marks]
Question 2Renco Ltd. manufactures a range of products, most of which have short product lifecycles. Research and development staff recently designed three new products which would be manufactured in a single production cell of the company’s factory. The combined monthly manufacturing overhead costs of the three products are summarized as follows:
Production set-ups (10 per month) $2000Materials movements (400 per month) $18000Repairs (4000 per month) $30000Total manufacturing overheads per month _50000The following information is available concerning the three new products: Product A Product B Product CProduction & sales, per month 2,000 units 5,000 units 1,000 unitsDirect labour hours per unit 6 4 8
The company’s target costing task group expressed the view that the new products would not be profitable given the likely market prices and the cost of manufacturing
the products using the proposed design. In response, the product designers indicated that no design changes were possible in relation to Products A or B, but that changes in the design of Product C would bring about the following reductions in the amount of monthly activity involved in manufacturing that product without compromising either the quality or quantity of output:
Production set-ups Materials movements Repairs 2 per month 100 per month 1,000 per monthREQUIRED:
(a) Calculate the reduction in the cost per unit of each of the three products which would occur as a result of the design changes to Product C, in each of the following circumstances:
If manufacturing overheads are traced to products using activity-based costing (ABC);If manufacturing overheads are allocated to products on a direct labour hour basis.(10 marks)
(b) Discuss the view that an ABC system is essential for the implementation of target costing. Use the case of Renco Ltd. to illustrate your answer.(5 marks)
Question 3
Mhuru Ltd. manufactures plastic components which it sells to three customers. These customers are all manufacturing firms with which Mhuru has entered into long-term supply agreements. Mhuru prides itself on its ability to quickly customize products to meet specific customer requirements at short notice. In some cases the entire process of customizing and manufacturing a product can be performed on a just-in-time (JIT) basis.

Prices are set in accordance with a cost-based formula. Costs of direct labour and raw materials are traced to each customer, and marked up at rates of 60% and 70% respectively. Production overhead is marked up by 50% and then allocated to customers in proportion to direct labour cost. Because these markup percentages are slightly lower than those applied by its competitors, Mhuru Ltd. has long believed that this pricing formula should enable it to retain the loyalty of its three customers. The Marketing Director was therefore surprised recently when he learned that one customer considered prices to be too high and was seriously considering taking his business elsewhere.Production overhead costs last month were made up of the following three elements:Activity Driver Cost Determining customer requirements Number of liaison meetings _8000Making design changes Number of design changes _6000Machine set-up Number of production batches _4000Total = _18000
The following is a summary of the work carried out last month on behalf of the three customers: Customer A Customer B Customer C TotalDirect labour cost $ _2700 _5500 _3800 _12000Raw material cost $ _3200 _5000 _2800 _11000Number of liaison meetings 12 9 11 32Number of design changes 13 15 22 50
Number of production batches 7 10 3 20
REQUIRED:(a) Calculate the amount of profit which Mhuru Ltd. earned from each of its three customers last month. (16 marks)(b) Explain which customer is most likely to be unhappy with Mhuru’s pricing arrangements, and recommend what steps Mhuru Ltd. should take in order to retain this customer.(4 marks)(c) Briefly explain how the implementation of a JIT approach to manufacturing can be a major source of competitive advantage.(5 marks)[Total: 25 marks]
Activity Based Management Refers to the use of activity costing to improve management’s decisions to
satisfy customers and improve profitability. Areas include pricing and product mix decisions, cost reductions and business
re-engineering process.

Development in ABC has shown a movement away from mere collection and analysis of cost for management purposes to cost management systems whose characteristics are :
Determination of cost of resources used up on undertaking the organisation ‘major activities.
The identification and elimination of activities which do not add value to the organisation’s product and services.
A critical analysis of efficiency and effectiveness of the activities carried out in the organisation.
Identification and evaluation of new activities which can prove the overall profitability of the organisation.
THROUGHPUT ACCONTING It is the rate of conversion of raw materials and purchased components into
products sold to customers.
Constraints and Bottle necks in the system

Throughput accounting originated from the theory of constraints (TOC) which is based on the view that every system has a constrain (anything that limits our ability to achieve what you want to achieve)
If a system had no constraints, its output would be either zero or the system would continue to produce more and more without any limits.
Therefore for any system whose output is not zero, there must be a constraint that stops it from producing more output than it does.
Reasons for Constraints External factors such as limits to customer demand on products produced by
the organisation. Weaknesses in the system s controls that is weak management. Weaknesses in the system such as shortages on key resources (materials) or
capacity. In-a manufacturing system, constraints are referred to as bottlenecks. A
bottle neck is simply a constraint that limits the output of an organisation(material ,labour and capacity)
Dealing with constraints Management of the business operations should focus on dealing with key
constraints by identifying what they are. Action by management to improve operational efficiency is a waste of time
and efforts if it is applied to any area of operations which is not a constraint. The key constraints limits through put since this could be a limitation in
sales demand, inefficiency production, unreliable suppliers or shortage of key resources of production.
Godraft developed the theory of constraints .He argued that :1. Management should identify the key constraints and consider way of removing or easing the constraint so the system is able to produce more output.2. When one constraint is moved, another key constraint will take place so management must be aware of that.3. The new key constraint must be identified and management should now turn its attention to way of reducing / removing its key constraint.4. By removing constraints one by one, the output of the org will improve.
RELEVANCE OF TOC IN THROUGHPUT A/C Godratt argued that if the aim of the business is to make money and
profit ,then the appropriate method to do so are : 1. Increase the throughput 2. Reduce operating expenses3. Reduce investment [money invested in inventory-can be reduced by reducing the level of inventory] .4.Godratt argued also that the most effective way of increasing profit is to increase throughput and it can be increased by identifying bottlenecks and ease them .
THOUGHPUT ACCOUNTING
Assumptions1. In traditional marginal costing it is assumed that direct labour cost are variable costs where as in throughput it is termed a fixed cost since employees are paid on a continuous basis.2. The only variable cost is the purchase of raw materials which comes from external suppliers.3. A business makes real profit by value addition.4. Value added should be measured as the value of sales minus the variable cost of sales.
THROUGHPUT INVENTORY AND OPERATING EXPENSES Throughput accounting is based on these three (3) major items, that is,
the throughput itself, inventory and operating expenses. Therefore throughput is the rate at which the entity achieve its goal
measured in goal units : Thus throughput =sales –total variable cost (The variable cost is the sum
of materials and any other components. NB. Throughput is only created when all inventories are soldThe Operating expenses
These are the expenditures incurred to produce output and it consists of labour and any other fixed cost incurred by the organisation.
Therefore profit in throughput accounting is measured as: Throughput –operating expenses $ Sales xxx Variable cost (material) ( xx) Through put xxx Less operating expenses (x) Profit x
VALUE OF INVENTORY IN THROUGHPUT Inventories do not have value except the variable cost of the materials and
components. Work in progress and finished goods is only money invested that cost of
purchase of the raw materials is the value and nu value addition occurs until they are sold.
Thus, in throughput accounting, all inventories are valued at the cost of raw materials and components.
The variable cost should not include the cost of labour as no value addition takes place by producing but only when items are sold.
Example -Comparison of throughput and traditional costing A company produces 1000units of a product during the month of June and
sells 800units for $32000. There was no opening inventory .Cost of production were as follows:
$ Direct labour 8000 Raw materials 6000 Fixed production overheads 10 000 Other Non-production overheads 5000
Required To calculate the profit of the period using:a)absorption costing
b) Marginal costingc) Throughput accounting
NB. Assume for the absorption that the budgeted and actual overheads were the same and there are no under/over absorption of overheads.
Example
Solution Comparison of costing methods
Absorption Marginal throughput
$ $ $ Sales 32 000 32 000 32 000 Less cost of production Opening inventory - ------- ------ -------
Add production cost Direct material cost 6000 6000 6000 Direct labour 8000 8000 ----- Prime cost 14000 14000 6000 Add fixed overheads 10000 ---- --- Production cost 24000 14000 6000 Less closing inventory (200/1000*24000 4800 2800 1200 Cost of sales (19200) (11200) (4800) Profit/contribution/throughput 12800 20800 27200 Less operating expenses Other overheads (non production) (5000) (5000) (5000) Fixed production overheads ---- (10000) (10000)

Direct labour ---- ---- (8000) Profit 7800 5800 4200
Criticisms of throughput It concentrates on the short –term when a business has fixed supply of
resources and operating expenses that are largely fixed. It is more difficult to apply throughput accounting concepts to longer term
when all costs are variable and vary with the volume of production and sales or any other cost driver.
In the longer term ABC might be more appropriate for measuring and controlling performance.
How to improve throughput accounting
Increase sales price for each unit sold so as to increase throughput per unit.
Reduce total operating expenses to reduce cost per assembly. Reduce material cost per unit by changing material or switching
suppliers. Improve the productivity of the assembly workforce and reduce the
time required to make each unit of the product. Throughput per assembly hour would increase but the expenses per
assembly hour would be unchanged therefore the throughput would increase.
PERFORMANCE MEASUREMENT RATIOS IN THROUGHPUT ACCOUNTINGKEY PERFORMANCE MEASUREMENTS*net profit – total throughput minus operating expenses
Major objective is to increase net profit

*return on investment *throughput per unit of the bottleneck resource*operating expenses per unit of the bottleneck resource*throughput accounting ratio
*ROI (returns on investment)- It is measured a net profit *100% Investment
-the objective is to increase return on investment, either by increasing net profit or reducing the size of the investment.
THROUGHPUT PRODUCTIVITYIs measured as: throughput * 100% Operating expenses
The major goal is to increase throughput productivity either by increasing throughput or reducing operating expenses.
THROUGHPUT PER UNIT OF CONSTRAINTThe advantage is that labour is treated as a fixed cost. Thus in line in that where production process has been automated, directed labour costs becomes less important to total production costs. Unlike traditional approaches
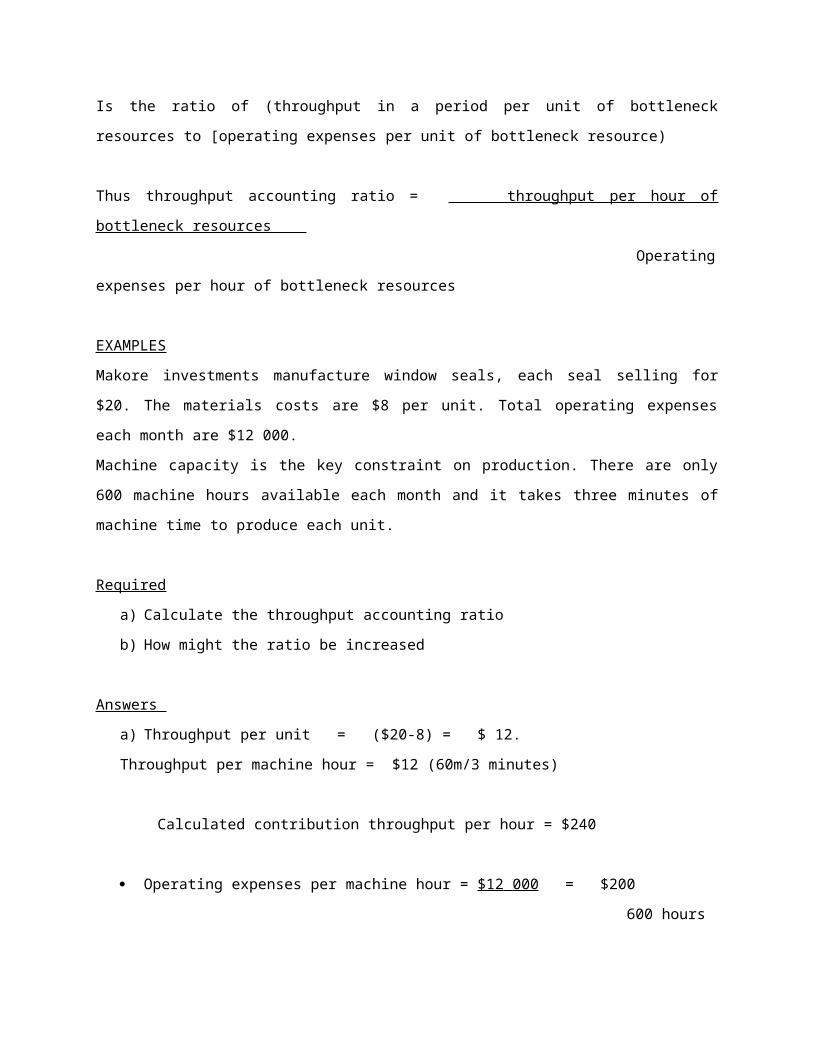
THROUGHPUT ACCOUNTING RATIOIs the ratio of (throughput in a period per unit of bottleneck resources to [operating expenses per unit of bottleneck resource)
Thus throughput accounting ratio = throughput per hour of bottleneck resources Operating expenses per hour of bottleneck resources
EXAMPLES
Makore investments manufacture window seals, each seal selling for $20. The materials costs are $8 per unit. Total operating expenses each month are $12 000.Machine capacity is the key constraint on production. There are only 600 machine hours available each month and it takes three minutes of machine time to produce each unit.
Requireda) Calculate the throughput accounting ratiob) How might the ratio be increased
Answers a) Throughput per unit = ($20-8) = $ 12. Throughput per machine hour = $12 (60m/3 minutes)
Calculated contribution throughput per hour = $240
Operating expenses per machine hour = $12 000 = $200 600 hours
Throughput accounting ratio = 240 = 1.20 200
b) To increase the throughput accounting ratio, it might be possible to: Raise the selling price for window seals for each unit sold to increase the
throughput per unit. Improve the efficiency of machine time used and so manufacture units in less
than 3 minutes. Find ways of reducing total operating expenses per machine hour.
THROUGHPUT ACCOUNTING AND DECISION MAKING When a company can make more than one product, throughput per unit of constraint factor can be used to rank products in order of priority for production.
Examples

Makudo investments manufactures a single product “chair “, for which the sales price is $35.00 per unit and the material cost per unit is $7.50Product “chair “is made in two consecutive production operations which are carried out in Department f1 and f2. The capacity per month in each department is 6 400 hours
Conversion costs per week in each department are as follows: Department f1 Department f2Conversion costs per month $ 7 360 $3 200Hours per month capacity 640 640Conversion cost per hour $ 1.5 $ 0.50
The company is operating at full capacity and it makes and sells 400 units of product “ chair “ each month .It has been offered an opportunity to make or sell 150 units of product “ bench “ each month to a large customer or, who will pay $31.00 per unit. The direct material cost per unit of product “bench “would be $ 15.00. Product “bench “would be made in department f1 and f2 and the production time required per unit would be as follows:
Product chair product bench Hours per unit hours per unitDepartment f1 16 12Department f2 16 6
On the basis of “traditional costing “, the decision would be to reject the customer order for 1 500 units of product bench per month, because product bench would appear to make loss.
Product chair product benchDirect materials 7.50 15.00Conversion costsF1 at $ 1.15 per hour 9.20 13.80F2 at $ 0.50 per hour 8.00 3.00Total costs per unit 24.70 31.80Sales price 35.00 31.00Profit/loss 10.30 (0.80)
However, this would be an incorrect decision if the goal is to maximize profit. There is currently spare capacity in department f1, but time in department f2 is a key constraint. Profit is maximized by maximizing throughput per hour worked in Department f2
Product chair product bench $ $Sales price 35.00 31.00Direct material cost 7.50 15.00Throughput per unit 27.50 16.00
Hours per unit in Department f2 16 6Throughput per f2 hour $ 1.72 $ 2. 67
The optimal production plan is to make 150 units of product “bench “ per month, and use the rest of the time to make units of product “chair”
ASSESSMENT OF CURRENT PRODUCTION PLAN “ CHAIR “

$ $Total throughput (400 * 27.50) 11 000Operating expensesDepartment f1 7 360Department f2 3 200 Total operating expenses 10 560 Net profit 440
The optimum production plan is to make 150 units of product bench, which would require (* 6 hours per unit) 900 hours per month. This would leave 5 500 hours of time in department f2 to make product “chair “, this would be sufficient time for 5 500/16 hours per unit) 343 units per month.
NB Making 150 units of bench and 343 of chair would require a total of 4 544 hours in department f1 per month. Time in department f2 is therefore still the key constraint.
Optimal production plan 150 units of bench and 343 units of chair Product bench: 150*16.00 2 400Product chair: 343 * 27.50 9 433 Total throughput 11 833
Operating expenses 10 560 Net profit 1 273
Net profit per month would increase by $ 833
LEARNING CURVES Most workers become more proficient at their task the more they do them. Learning takes place especially through the early stages of the job e.g
contractors constructing a high rise apartment building find the 20th storey that go on faster than the 8th storey.
The learning curve represents that the time spent per unit declines by a constant percentage as the number of units produced doubles.
The phenomenon has been observed where new long-term production activities are undertaker / where a long production cycle is conducted such as building construction projects, plan manufacture and ship building.
Wright law: as cumulative output doubles, the cumulative average time per unit falls to a fixed percentage [referred to as the learning rate] of the previous average time.
THE LEARNING RATE: CUMULATIVE AVERAGE TIME {C.A.T} In learning theory, the cumulative average time per unit produced is
assumed to decrease by a constant % every time total output of the product doubles.
EXAMPLES Where an 80% learning effect occurs, the cumulative average time
required /unit is reduced to 80% of the previous cumulative when output is doubling of output produces a 20% decrease in C.A.T.
EXAMPLE 1 an 80% LEARNING CURVE. The first unit of a new product requires 100hrs .An 80% learning curve
applies .Production time would be :
1 2 3 4 5Units Produced Total output Cumulative
average time Total hours [column 2x3]
Average hours additional units
1 1 100 1x100=100 1001 2 (0,8x100)=80 80x2=160 160-100=602 4 (0,8x80)=64 64x4=256 256-160=964 8 (0,8x64)=51,2 51,2x8=409,6 409,6-
256=153,68 16 0,8x51,2=40,9
640,96x16=655,36
655,36-409,6=245,7

100 60 - for extra 1 48 (96#2) for extra 2
Learning curves are also used to estimate price to be quoted on customer’s orders .The learning curve effect means that a company can afford to charge less per unit for greater quantities.
Exercise Angwa Ltd has been requested to supply 8 units of a new product to the customer’s specification .The estimated labour time for the first unit is 25hrs and the labour cost is $10/hr.a. Calculate the labour cost for the order.B.Calculate the labour cost of a second order with the same quantity (8 units).
SOLUTION
Units Produced
Total output Cum Average time Total Average Ave. hours
1 1 25 25x1=25 251 2 (0,9x25)=22,5 22,5x2=45 45-25=202 4 (0,9x22,5)=20,25 20,25x4=81 81-45=364 8 (0,9x20,25)=18,22
518,225x8=145,8
145,8-81=64,8
8 16 (0,9x18,225)=16,4025
16,4025x16=26244
a) Total labour cost for 8 units 145,8hx$10/h =$1458
b) 2nd order =(262,44x$10)-$1455

=$1166, 4
EXAMPLE 2 A company wishes to determine the price it should charge a customer for a special order .The customer has requested a quotation for 10machines but might subsequently place another order for a further 10 .Material costs are $30 per machine. It is estimated that the first batch of 10 machines will take 100hours to manufacture and an 80% learning curve is expected to apply. Labour plus variable overhead costs amount to $3 per hour. Set -up costs are $1000 regardless of the number of machines made.
a) What is the minimum price the company should quote for the initial order if there is no guarantee of further orders?
b) That is the minimum price for the following order?c) What would be the minimum price if both orders were placed together?d) Having completed the initial orders for the a total of 20 machines (price at
the minimum levels recommended in (a)and (b) the company thinks that there would be a ready market for this type of machine if its unit selling price is brought to $45.
e) At this price, what would be the profit on the first (1) 140 mass production models (that is after the first 20 machines) assuming that marketing costs totaled $250?
Solution
Initial orderMaterials [10 * $30] 300Labour and variable overhead [100 * $3] 300Set-up cost 1000Total 1600Minimum price 1600:10 =$ 160Second batch

Units produced
Total output C. A. T Total hours Average hours
1 1 100 100*1=100 100 1 2 (0,8 * 100)=80 80*2 =160 160-100=60
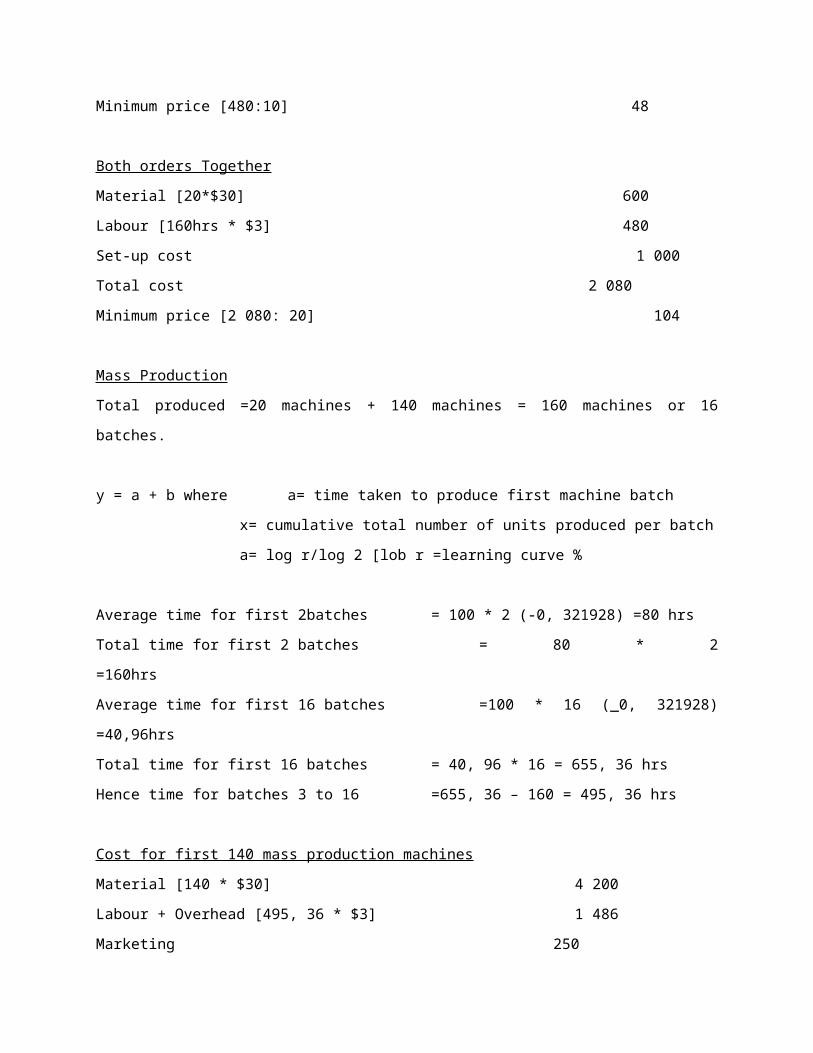
Material [10*$30] 300Labour + variables [60*$3] 180Total cost 480Minimum price [480:10] 48
Both orders TogetherMaterial [20*$30] 600Labour [160hrs * $3] 480Set-up cost 1 000 Total cost 2 080Minimum price [2 080: 20] 104
Mass ProductionTotal produced =20 machines + 140 machines = 160 machines or 16 batches.
y = a + b where a= time taken to produce first machine batchx= cumulative total number of units produced per batcha= log r/log 2 [lob r =learning curve %
Average time for first 2batches = 100 * 2 (-0, 321928) =80 hrsTotal time for first 2 batches = 80 * 2 =160hrsAverage time for first 16 batches =100 * 16 (_0, 321928) =40,96hrsTotal time for first 16 batches = 40, 96 * 16 = 655, 36 hrsHence time for batches 3 to 16 =655, 36 – 160 = 495, 36 hrs
Cost for first 140 mass production machinesMaterial [140 * $30] 4 200Labour + Overhead [495, 36 * $3] 1 486

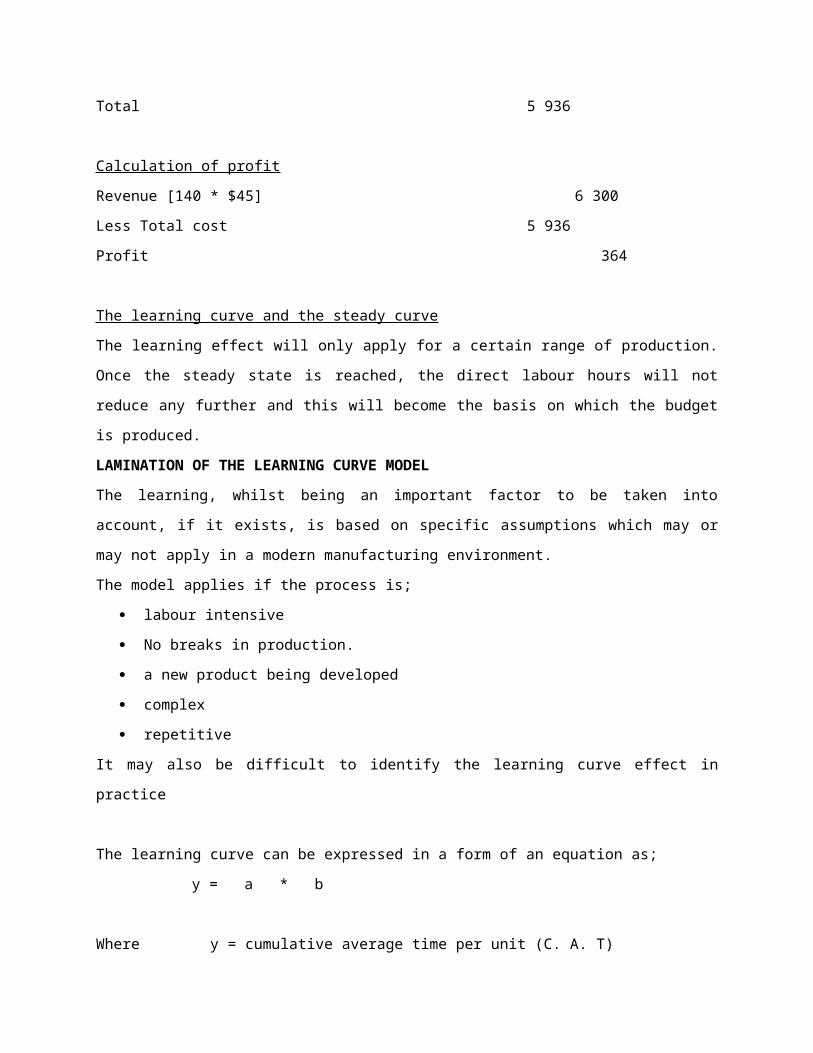
Marketing 250Total 5 936
Calculation of profitRevenue [140 * $45] 6 300Less Total cost 5 936Profit 364
The learning curve and the steady curveThe learning effect will only apply for a certain range of production. Once the steady state is reached, the direct labour hours will not reduce any further and this will become the basis on which the budget is produced.LAMINATION OF THE LEARNING CURVE MODELThe learning, whilst being an important factor to be taken into account, if it exists, is based on specific assumptions which may or may not apply in a modern manufacturing environment.The model applies if the process is;
labour intensive No breaks in production. a new product being developed complex repetitive
It may also be difficult to identify the learning curve effect in practice
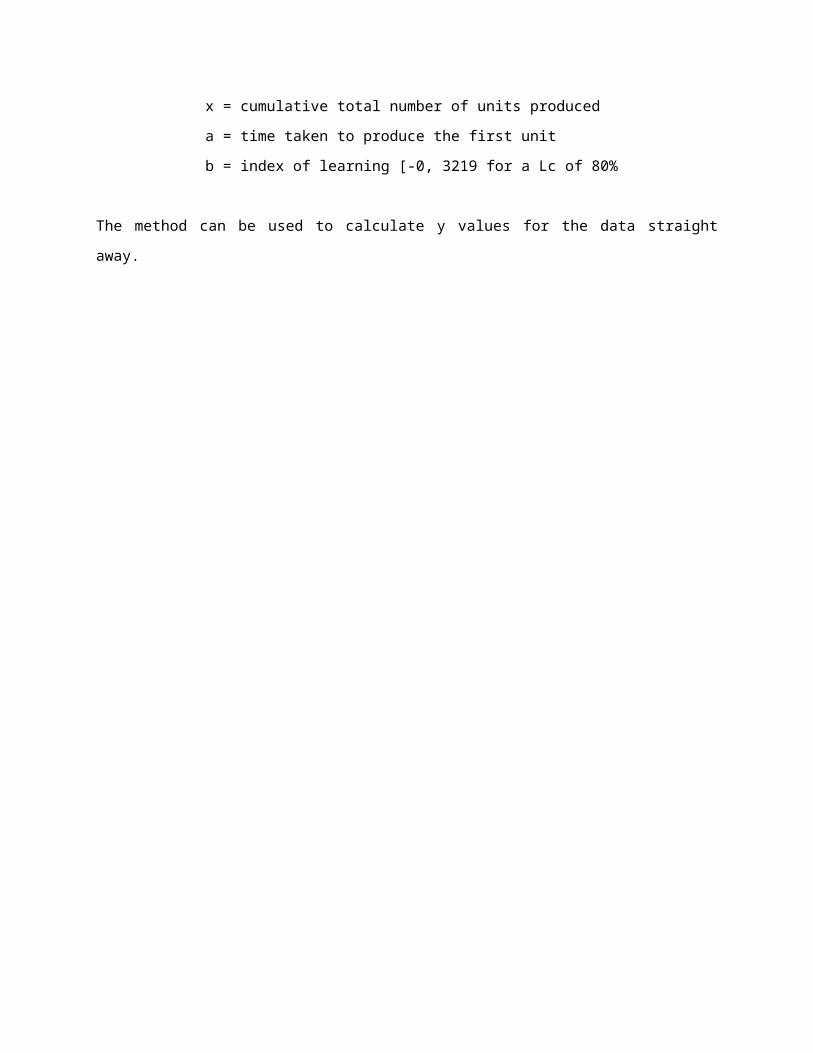
The learning curve can be expressed in a form of an equation as;y = a * b
Where y = cumulative average time per unit (C. A. T) x = cumulative total number of units produced a = time taken to produce the first unit b = index of learning [-0, 3219 for a Lc of 80%
The method can be used to calculate y values for the data straight away.

TRANSFER PRICING
In divisionalised companies, where profit or investment centers are created, interdivisional transfers of goods or services and this internal transfer create the problem of pricing.
A satisfactory system of transfer pricing is necessary for measuring the performance of transfer divisions.
A transfer price is that national value at which goods and services are transferred between divisions in decentralized organisations.
Transfer prices are set for intermediate products which are goods and services that are supplied by the selling division to the buying division.
Objective of transfer pricing
Transfer pricing should help in the accurate measurement of divisional performance (profitability) measurement.
Transfer pricing when outside suppliers are available
Selling division below capacity Using information above , Disc Tech LTD , the IT division buys from an outside
supplier ,the facilities that hardware division uses to manufacture the units would remain idle
The general economic transfer pricing rule when the seller is operating below capacity (an idle capacity ) states that the seller should set the transfer price at variable cost per unit
EXAMPLE 2Inscor LTD owns fast food restaurant and snack food and beverage manufacturing in Zimbabwe. One of the restaurant Pizza Inn serves a variety of beverages along with pizzas.One of the beverages is ginger beer which is served on tap.
The MD of Imperial beverage has approached the MD of Pizza Inn about purchasing imperial beverage’s ginger beer for sale to Pizza Inn restaurants rather than its usual brand of ginger beer. Manager at Pizza Inn agreed that the quality of their regular brand is ok; it was just a question of price. The basic facts for the divisions were as follows:
IMPERIAL B
A ginger beer production per month --- 10 000 barrels Variable cost per barrel --- $8 Fixed cost per month --- $70 000 Selling price of Imperial beverage ginger beer on outside market is $20 per
barrel.
PIZZA INN Purchase price of regular brand of ginger beer --- $18 per barrel Monthly consumption of ginger beer --- 2000 barrels
Calculatea) The selling division’s lowest acceptance transfer price.
NB. Imperial will transfer internally if their profit increases as such the transfer price cannot be below $8. In addition if Imperial has insufficient capacity to fulfill the Pizza Inn order then it will give up some of its regular sales and as such need compensation for lost contribution margin on lost sales. If the transfer price has no effect on fixed costs from the selling divisions ‘s stand point ,the transfer price must cover both the variable cost of producing the transferred units and only opportunity cost from lost sales.
Seller’s point of view
Transfer price greater than or equal to variable cost /unit + total contribution Margin on sales (lost) Number of units transferred

Purchasing Department
TP < outside supplier’s price
The purchasing determent PIZZA INN will be interested in the proposal only if its profits increase. In cases where the division has an outside supplier purchasing decision is simple-buy only from the inside supplier if the price is < the price offered by outside suppliers
a. Selling divisions with idle capacity Imperial beverages is selling 7000 barrels of ginger-beer a month on the outside market .What would be the transfer price if any would make things better off with the transfer of 2000 barrels
TP = variable cost + total contribution margin on cost sales Number of units
= 8 + 0 2000
= $8Purchaser < 18
selling division with the no idle capacity
Imperial has no idle capacity and is selling 10 000 barrels a month to an outside market at $20.What range of transfer pricing would make both divisions better off transferring 2000 barrels within the company.
TP > 8 + [selling price – variable cost] lost sales
20 - 8 (2000) 2000 > 8 + 12 > 20
Purchaser TP > 18I. Therefore in this case , no transfer price taken place as it result in loss
to the organizationII. Selling division with no idle capacityIII. Selling division with some idle capacity
Imperial beverage is selling 9000 barrels to its regular customers a month. Pizza Inn can only sale one type of ginger beer on tape .What range of transfer if any would make both divisions better off transferring within the company
PT > 8 + 20 - 8 (1000) 2000
> 8 + 6 > $14
Transfer price is possible as it is acceptable within the range.
Transfer price where there are no outside supplier .If Pizza Inn has no outside supplier the highest price the purchasing departmant will be to buy depends on how the purchasing division expect to make on transfer units excluding price .
Transfer cost
Variable cost $8Full cost $15 [8 + 70 000
10 000
No profit for selling division and profit can be shown by buying division when they sell to outside customers
Cost price do not provide incentives to control costs and will affect goal congruence
Transferring at market price

Market price is a price charged on intermediate marketIntermediate market is a market on which a transfer product or service is sold is sold its present form to outsidersIts only effective when there is no idle capacity
Transfer price in international marketObjective of transfer pricing in international market
To pay less taxes , duties and tariffsMeant to ensure that there areTo ensure better competitive positionTo align with government regulation
Practical exercisesNhongo Ltd. is a divisionalised company. Each month the company’s Chemicals Division manufactures 6000 tons of a product which it sells to external customers at a price of _$200 per ton. The fixed costs of the Chemicals Division are _$288 000 per month and the marginal costs of production and sale amount to $90 per ton. An absorption costing system is used to work out a ‘full cost per ton’ on the basis of this level of cost and activity.
Another division of the company (the Detergents Division) buys 2000 tons of a very similar chemical from an external supplier each month at a price of _$150 per ton. However, the Chemicals Division has sufficient spare capacity to enable it to supply the monthly needs of the Detergents Division. The transfer price which the Chemicals Division would charge would be the ‘full cost per ton’ as calculated on the basis of the increased level of output. The Detergents Division has indicated that this transfer price would be acceptable.
REQUIRED:(a) Calculate the transfer price proposed by the Chemicals Division, and show that this transfers pricing arrangement will motivate both divisions to act in a manner which is in the best interests of Nhongo Ltd. as a whole. (7 marks)
(b) Assume now that the two divisions cannot agree on transfer pricing arrangements for the 2000 tons. Specifically, the Chemicals Division will not accept any price lower than _$145 per ton but the Detergents Division will not agree to pay any price higher than $95 per ton.
Discuss whether, in these circumstances, the board of directors of Nhongo Ltd. should intervene to order the divisions to make the transfer at the price calculated in your answer to part (a). (9 marks)
(c) Assume now that the Detergents Division requires a further 500 tons per month (in addition to the 2000 tons), but that the Chemicals Division has no additional spare capacity and therefore these 500 tons could only be provided to the Detergents Division if the Chemicals Division were to reduce sales to its external customers by an equivalent amount.
Assume also that the marginal cost to the Chemicals Division of supplying a ton to the Detergents Division is $3 lower than the cost of supplying a ton to an external customer. What is the appropriate transfer price per ton for these 500 tons? Explain your answer.(4 marks)[Total: 25 marks]
Question 2
Mangwiro Ltd. manufactures advanced technical components for the computer hardware industry. The company’s Uhuru Division manufactures a special subcomponent at a variable cost of $70 per unit. This division’s maximum monthly production capacity is 2700 units, but its actual production each month is 2500 units. Of this actual monthly production, 1500 units are sold to external customers (at a price of $100 each) while the remaining 1000 units are transferred to the company’s Chopa Division at the same price.
The Chopa Divisions’ maximum production capacity is 1350 units per month. However, market demand for the division’s product is only 1000 units and therefore production is carried out at this level. In producing one unit of its product, Chopa Division uses one unit of the subcomponent purchased from Uhuru Division and incurs additional variable costs of $90 per unit. The selling price of Chopa Division’s product is $200 per unit.The Chopa Division recently received an enquiry from a new customer, who has offered to purchase 300 units of that division’s product each month at a price of $185 per unit.
REQUIREMENT:
(a) Prepare calculations to indicate the increase in the monthly profits of Mangwiro Ltd., if the new customer’s offer is accepted.(7 marks)
(b) Prepare calculations to indicate whether the existing transfer pricing arrangements would motivate each of the two divisions to cooperate in transferring the 300 subcomponents needed in order to manufacture the new customer’s order.(6 marks)
(c) Identify the minimum transfer prices which would be acceptable to Uhuru Division and identify the maximum transfer prices which would be acceptable to Chopa Division. Then, suggest a transfer price per unit for the 300 subcomponents which would achieve the following:
_ the incremental profits from doing business with the new customer are to be shared equally between the two divisions._ The same transfer price per unit is to apply to all units transferred.(7 marks)
Question 3

Rungano Ltd. manufactures a wide range of specialized electrical products. The company is structured along divisional lines.“Division X” manufactures a specialized motor. Monthly production is 3000 units and the marginal cost of production is _$140 per unit. Half of all output is sold to external customers at a price of _$200 per unit. The remaining output is sold within Rungano Ltd. to “Division Y”. In accordance with the company’s rules, these internal transfers are made at the same price per unit as sales to external customers (i.e. $_200).“Division Y” uses the motor as a component in the manufacture of an industrial heater, which is sold to external customers at a price of _$350 per unit. (One motor is required for each heater). “Division Y” incurs a marginal cost of $_100 per unit, in addition to the transfer price paid for the motor.A potential new customer (Kwangu Ltd.) has offered to purchase 750 units per month of the industrial heater from “Division y” at a special contract price of $275 each. “Division Y” has sufficient spare production capacity to produce these additional heaters.
REQUIRED:(a) Assume that “Division X” has sufficient spare production capacity to enable it to produce the additional motors required by “Division Y” to enable it to fulfill the Kwangu Ltd. contract.In these circumstances, explain:_ Whether it would be in the best interests of Rungano Ltd. to accept the Kwangu Ltd. contract, and_ whether the existing transfer pricing arrangements motivate the division managers to take the decisions which are in the best interests of Rungano Ltd. as a whole.(10 marks)(b) Now assume that “Division X” has no spare production capacity. If “Division X” were to produce the additional motors required by “Division Y” to enable it to fulfill the Kwangu Ltd. contract, then “Division X” would reduce its sales of motors to external customers.Explain how your answer to part (a) would differ in these circumstances.(7 marks)

(c) Critically evaluate the transfer pricing arrangements in Rungano Ltd., using your answers to parts (a) and (b) to illustrate your answer.(8marks)
(Total 25marks)
Bamaco Company is a company specializing in the manufacturer and sale of kitchen sink. Each sink consist of a main unit plus a set of kitchen fittings. The company is split into two divisions C and D. Division C manufactures the sink and Division D manufactures set of kitchen fittings. Currently, all of Division C’s sales are made externally. Division D, however, sells to Division C as well as to external customers. Both of the divisions are profit centres.
The following data is available for both divisions.
Division C
Current selling price for each sink $450.00
Cost per sink
Fittings from Division C $75.00
Other materials from external suppliers $200.00
Labour costs $45.00
Annual fixed overheads $7 440 000
Annual production on sales of sink (units) 80 000
Maximum annual market demand for sink (units) 80 000
Division C
Current external selling price per set of fittings $80
Current price for sales to Division A $75
Costs per set of fittings:
Materials $5

Labour costs $15
Annual fixed overheads $4 400 000
Maximum annual production on sales of set of fitting (units) (including Internal and External sales)
200 000
Maximum annual external demand for sets of Fittings (units) 180 000
Maximum annual internal demand for sets of fittings (units) 80 000
The transfer price charged by Division D to Division C was negotiated some years ago between the previous divisional managers, who have now both been replaced by new managers. Head Office only allows Division C to purchase its fittings from Division D, although the new manager of Division C believes that he could obtains fittings of the same quality and appearance for $65 per set. If he was given autonomy to purchase from outside the company. Division D makes no cost savings from supplying internally to Division C rather than selling externally.
Required
1. Under the current transfer pricing system, prepare a profit statement showing the profit for each of the divisions and for Bamco Company as whole. Your sales and costs figures should be split into external sales and inter-divisional transfers, where appropriate. [6 marks].
2. Head office is considering changing the transfer pricing policy to ensure maximization of company profits without demotivating either of the divisional managers. Division C will be given autonomy to buy from external suppliers and Division D to supply external customers in priority to supplying to Division C. [6 marks]
Calculate the maximum profit that could be earned by Bamco Company if transfer pricing is optimized.[8 marks]
3. Discuss the issues of encouraging divisional managers to take decisions in the interest of the company as a whole, where transfer pricing is used. Provide a reasoned recommendation of a policy Bamco Company should adopt. [6 marks]
DIVISIONAL PERFOMANCE
Management should know what they expect to achieve and they should also be in the goal-setting process. Failure results in dys function behavior which conflicts with the short term interest of the organisation.Thus, managers should know what they are achieving; this should involve the setting up and maintenance of a well co-ordinate information system.Managers should be provided with a measure of performance which is constant with their responsibilities and they should not be held accountable for the actions and course which are outside their control.
TYPES OF SEGMENTS \ BUDGET CENTERS THAT CAN BE CREATED
1. Cost centre In this unit , the manager has authority to control amount of expenses incurred but has no authority to change the resource investmentIn this centre , fin performance is measured by whether the assigned task is completed within the budgeted cost levelsManagers of cost centers are expected to minimize cost while providing the level of service or amounts of products demanded by other parts of the organisation. For example ,the manager of a product center will be evaluated at least in part by comparing actual cost as to how much should have been the actual cost for the units provided [flexed costs] for the period.
2. Revenue centre In this centre , performance is measured by whether the unit achieves budgeted levels of sales revenueThe issue of expenses incurred in generating revenue is not the responsibility of a revenue center managementZimra is atypical Zimbabwe revenue center

3. Profit center I N this centre , financial performance is measured whether the unit has
achieved its budgeted profit A profit centre manager is therefore responsible for the sales revenue and
expenses but his major aim is to promote the profit motive throughout the organisation
I n addition to the selling price based on normal arms length transaction with 3rd parties ,transfer prices have to be negotiated for intercompany sales of goods and servicesWhere negotiations are made, revenues of one department or division will constitute cost of another.CUT marketing department may be a profit center
4. Investment centre In this centre , financial performance is measured by whether the actual return on investment is equal to or exceed the budgeted returnIn addition to controlling sales revenue and cost , an investment centre manager is responsible for capital investment decisions and is able to influence the size of investmentInvestment center managers are encouraged to plan, control and make decisions for the cost, revenue and investment entrusted in them.The investment centre managers who have details of knowledge of local customers and economic conditions can use that knowledge to the advantage of their division and ultimately to the company as a whole
NB An investment centre manager does not however enjoy total control over the level of investment as he has to compete with other divisions for the scarce resources whose disbursement may be controlled by head office
MEASURE OF PERFORMANCE IN DIVISINALISEDThe rate of return for measuring managerial performance
Managers are given autonomy that the various profit and investment centers are taken as independent businesses with their managers having
about the same control over divisions as if they where running their own independent firmsWith autonomy , fierce completion developments among managers with each striving to make his segment the best in the company
KEY QUSTION How do top managers at headquarters go about deciding who gets new investing funds as soon as they become available and how do these managers in the centres decide which investment funds
Headquarter managers may use rate of return on investment [ ROI ]
The return of Investment
Defined as net operating income divided by average operating assets.The higher the ROI of a business segment, the greater the profits generated per dollar invested in the segment’s operating assets.Net operating income is profit before interest and tax , popularly known as EBITOperating assets include cash and cash equivalent, trade receivables, PPE, non-current assets and all other assets held for productive us in the organizationExcluded are assets such as land held for future development of investment held in other companiesThus average operating assets is assets at the beginning and those at end
MATOR CHALLENGER
Non-current assets debate is on what base to us cost or NBV of the assets Other advocate prefers net book value and other advocators prefer cost In calculating ,both approaches were used but yield different figure
ADVOCATES FOR NBV
They say NBV is consisted with how PPE[property plant and equipment] are reported on statement of financial position[SOFP]
NBV is also consistent with the computation of operating income which includes depreciation as an operating cost
ADVOCATE FOR COST The cost method eliminates both the age of equipment since the method of
depreciating used is factors in depreciating which is used in the computation of operating income.
Under NBV ,ROI ,tends to increase overtime as book value of assets decline due to depreciation
Cost method does not discourage replacement of old worn out equipment.
However, due to the need of maintaining consistency, most companies use book value.
CONTROLLING RATE OF RETURN
ROI = O. IA.O, A
This can be modified to ROI = operating income(margin) * 100 * Turnover
Turnover or sales 1 A.O.A
Margin is the measure of management’s ability to control operating expenses per dollar of sale, the higher he margin.
Turnover is the measure of sales that is generated for each dollar invested in operating assets.
So ROI using turnover and margin is calculated as:
ROI = MARGIN * TURNOVER
To this end, which formula now to use as both gives the same answer? The second one gives better insights about the organisation ROI forces managers to control the investment in operating assets as well as
to control the expenses and hence the margin. The DUPONT pioneered the ROI concept and recognized the importance of
looking at both margin and turnover in assessing performance of a manager. The investment manager can control the ROI in 3[three] ways;
1. Increase sales2. Reduce expenses3. Reduce assets
EXAMPLE
ABC LTD presence the following data which represents results of operations for the most recent month:
Net Operating Income 10 000Sales/Turnover 100 000Available Operating Assets 50 000
Calculate ROI in terms of margin and turnover.
SOLUTION
R. O. I = operating income * 100 * turnover salesTurnover/ sales 1 A. O. A
= 10 000 * 100 * 10 000
100 000 1 50 000
= 20%
INCREASE IN SALES
If the manager increases sales from $100 000 to $110 000 with other costs remaining constant as well as the assets. What is the new R.OI?
= 20 * 10 000
100
= $2 000
For every $10 000 increase in sales, the profit will increase by $2000
R. 0. I = 12 000 * 100 * 110 000
110 000 1 50 000
= 24%
REDUCE THE EXPENSES Assume that the manager of ABC LTD reduces expenses by $1000,
what is the new R. O.I if sales and operating income remain constant
New operating income = $11 000 [10 000 + 1000]
R. O. I = 11 000 * 100 * 100 000 100 000 1 50 000
= 22%
REDUCE ASSETS
Assume the manager can reduce assets from 50 000 to 40 000, sales and net operating income remain unchanged, what is the new R. O. I? R. O. I = 10 000 * 100 * 100 000
100 000 1 40 000
= 25%A clear understanding of the 3(three) approaches to improving R O I figure is critical to effective management of an investment centre.
OTHER MEASURES OF PERFOMANCE
1. RESUDUAL INCOME This refers to controllable contribution less cost of capital charge. For divisional purpose, residual income can be defined as divisional
contribution less cost of capital charge on total investment in assets employed by the division.
It enables managers when acting in their own best interest also to act in the best interest of the organisation.
A company has two divisions, x and y .Proposed investments in the two divisions were packed at $10 000 each for which 5he controllable contribution of x $2 000 and y is $1 300. What is the residual income if cost of capital charged is 15%?
SOLUTION
Residual income =Controllable contribution - Cost of capital charge
x = 2000 - 1 500= 500
Y = 1 300 - 1 500
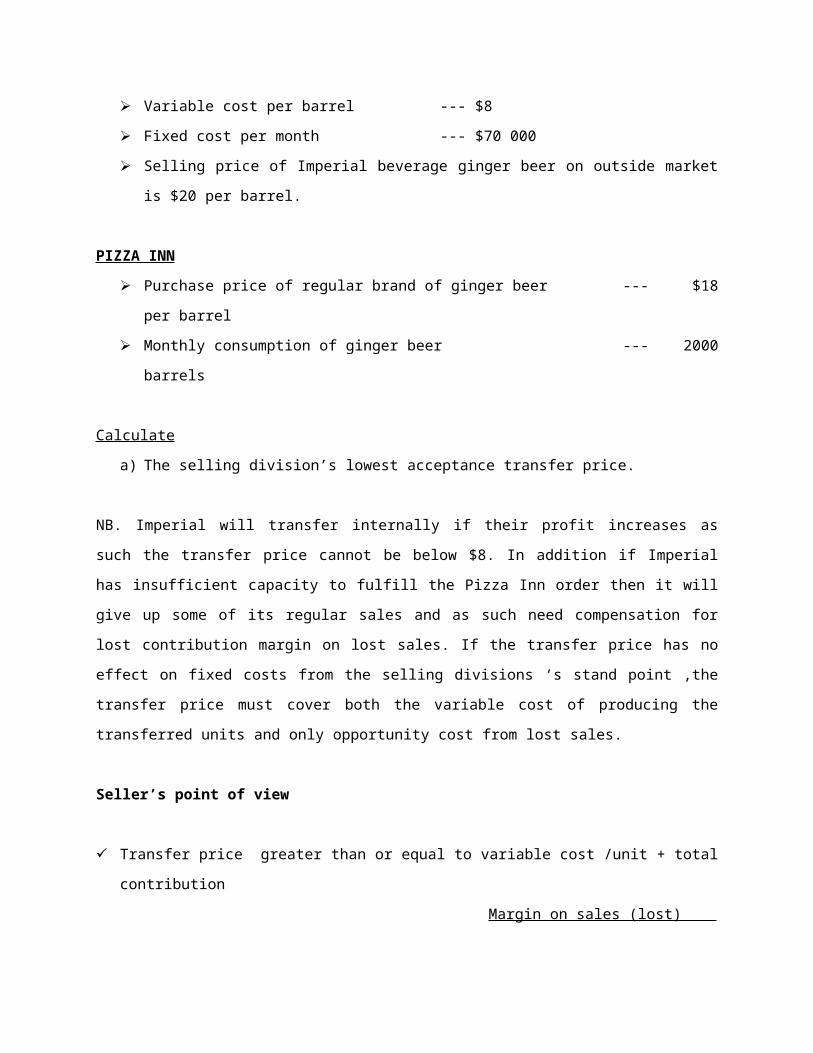
= (200)
ECONCMIC VALUE ADDED [ EVA ]
Economic profit is wealth created above the capital cost of investment. EVA prevents managers from thinking that the cost of capital is free It is therefore a measure of a company’s financial profit based on operating
profits[adjusted for taxes on a cash bases] Therefore EVA = net 0perating profit after tax[NOPAT] – The cost of capital
charge.[cost of capital being the capital - cost of capital] It therefore measures whether operating profit is sufficient enough to cover
the cost of capital. If EVA is negative, it means the firm is destroying the share holder’s wealth. EVA means real profitability.EVA focuses managers on the question, “for any
given investment, will the company generate returns above the cost of capital.
Companies that use EVA have bonus compensation skills in place that reward/ punish managers for adding/ subtracting value for the company
Practice exercises
Geddes Pharmaceuticals is a division of CAPS which was formed by acquiring a previously independent company (“Harare P”) in February 2011. The budgetary control system used in this division has remained largely unchanged since Harare P was acquired, including a form of strategic planning and control which involves the comparison on a monthly basis (against budgets) of three aggregate-level performance measures, namely:• Economic value added ™ (EVA);• Residual income (RI);• Return on investment (ROI), restated to its annual equivalent (e.g., if ROI for a given month is 1% then this is restated as 1 * 12 months = 12% annual equivalent ROI).
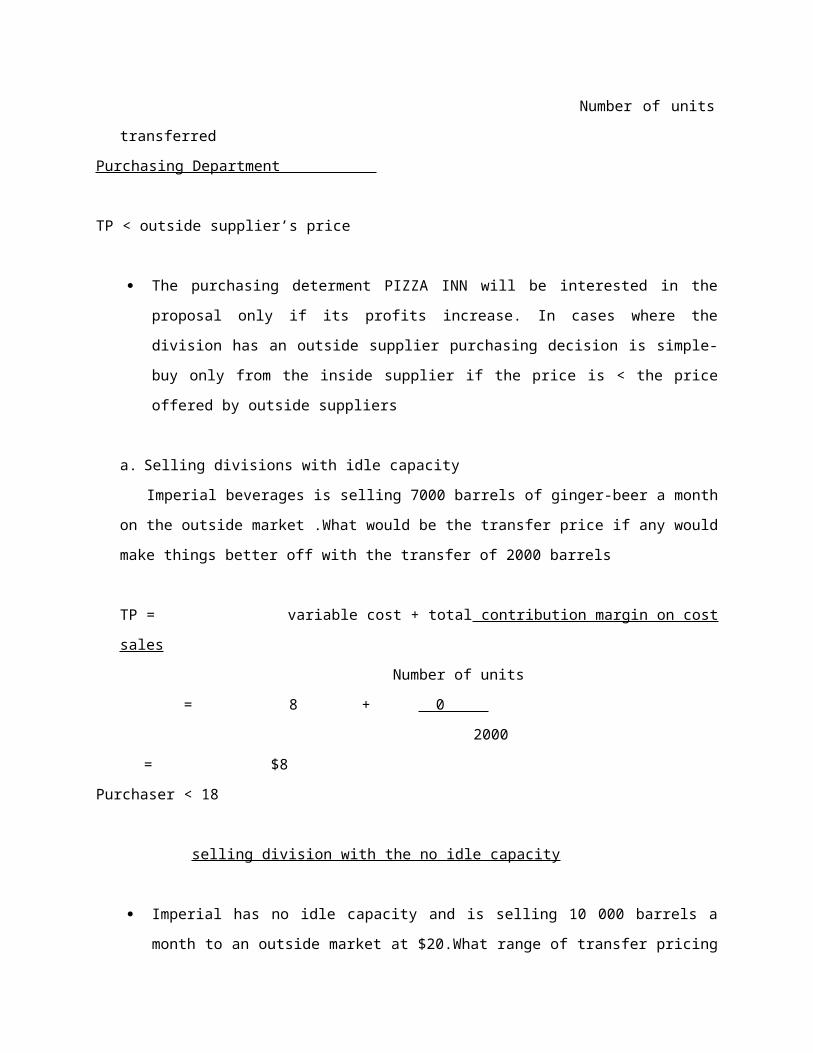
The following is the forecast of these three measures for the next six months: Sept Oct Nov Dec Jan FebEVA 850 620 950 1,170 730 500RI 750 700 1,000 1,100 700 700Annual equivalent ROI 9.6% 9.2% 10.6% 11.1% 9.5% 9.7%
REQUIRED:Prepare a report for the Group Executive in which you critically assess this approach to budgetary control, and suggest options as to how the current approach to strategic planning and control should be improved.(13 marks)
Suggested solution
To: Group ExecutiveFrom: Trainee accountantDate: 31/12/2011 Re: Assessment of Geddes Pharmaceutical’s budgetary control system.Please find enclosed a report with a critical assessment of Geddes Pharmaceutical’s budgetary control system and suggestions for improvement.
I will be pleased to provide any clarification that you may require.Yours SincerelyTrainee Accountant
Assessment of current system:
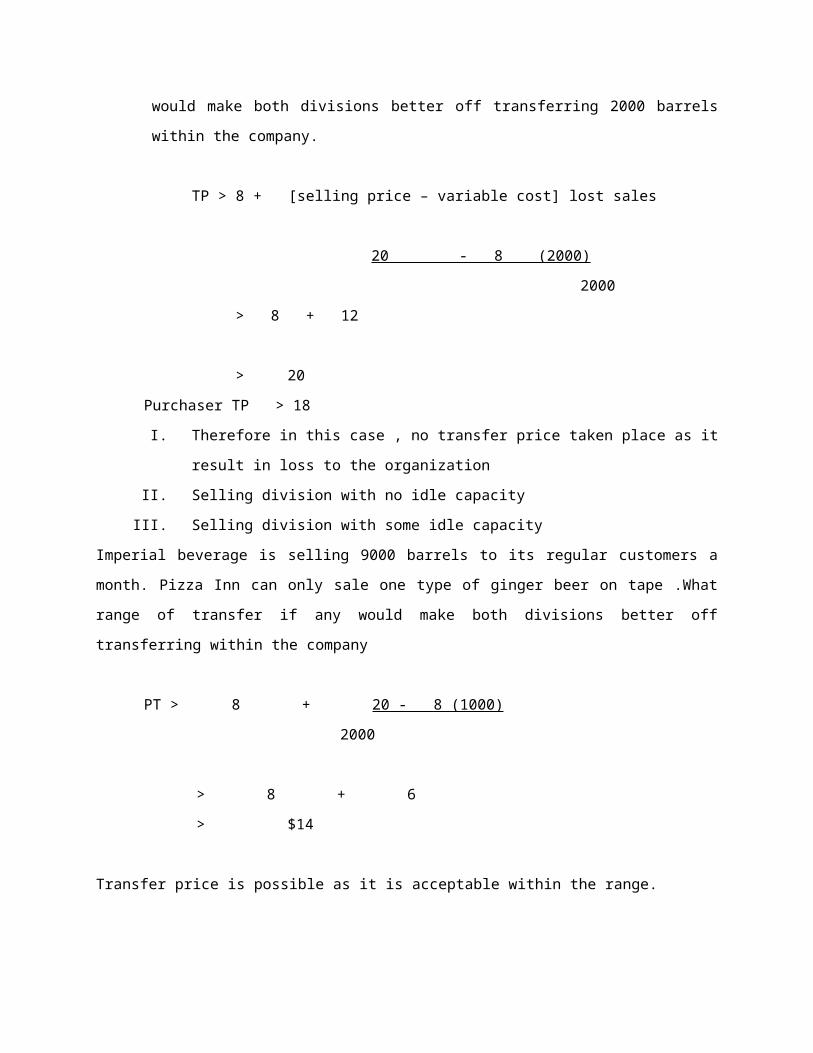
The existing system is unnecessarily complex in the sense that it uses multiple measures of what are (to a large extent) the same underlying phenomenon’s. In particular, it is evident from the data that there is a very strong correlation betweenROI and RI, and this is because they are simply different ways of capturing the same two basic pieces of information (operating profit and capital invested).
Admittedly the correlation between ROI and RI is not “perfect”, e.g., RI is exactly the same in October, January and February whereas ROI differs slightly between these months. However, this is essentially a technical difference (RI factors cost of capital into the calculation, whereas in an ROI assessment the cost of capital acts as the benchmark). The point remains that there is no strategic advantage in trying to manage with both of these variables.
Suggestion for improvement:EVA does have “extra” information content, not captured by ROI or RI. For example, a more “cyclical” trend is evident in the EVA data than in the RI data. This is due to adjustments to the income or asset measures used in calculating EVA to make the measure “economically meaningful”, such as the capitalization and amortization of intangible assets. For example, scrutiny of the data seems to suggest that this has depressed EVA in February.In essence, EVA is a more economically meaningful version of RI, and in this sense EVA may be preferred to RI as the financial performance measure to be used for strategic planning and control. However, EVA is necessarily more subjective.
It does not seem appropriate to use both RI and EVA in a budgetary control system because their information content has many fundamental similarities, some differences notwithstanding. Irrespective of the performance measure, the use of a monthly basis of budgetary control is inappropriate at the strategic level. The success (or otherwise) of a strategic investment can really only be assessed over its whole lifecycle, e.g., there may be an initial costly investment in market research or branding without any expectation of financial return until much later. At the very least, measures such as those already in use are typically applied on an annual basis because monthly assessment is at best meaningless and can at worst encourage dysfunctional behavior.

More fundamentally, the use of measures such as ROI and RI (at any fixed time interval) to represent degrees of strategic success is questionable. It is appropriate that a strategic target be broken down into manageable goals which can be tracked and measured in the short term; often in ways that are nonfinancial (e.g., rates of consumer awareness of a new product). If ROI or RI is used as “the” performance measure, then they become ends in themselves
Tapera PLC, a large multinational company, is undertaking a review of its organizational structure. Top management is concerned that the methods used for divisional performance evaluation and transfer pricing may be encouraging dysfunctional behavior by division managers.The following sample data is available concerning two of the company’s divisions for last year: Division X Division YOperating profit $15200 $7200Capital invested $160000 $57600The cost of capital is 7% for both divisions. It can be assumed that there are no intra-company transfers between Divisions X and Y.
REQUIRED:(a) Calculate the Return on Investment (ROI) and residual income for each division. Explain which of these two measures (ROI or residual income) gives the clearer indication of divisional contribution to the overall success of Tapera PLC.(8 marks)(b) Assume that ROI is used for divisional performance evaluation purposes. How would each of the two division managers react to an additional investment opportunity which would increase operating profit by $2300 but would require capital investment of $22000? Are their reactions in the best interests of the company’s shareholders? Justify your answer. (8 marks)

(c) At what cost of capital would the two divisions have the same residual income? (In answering this part, ignore the additional investment opportunity in part (b) above). (4 marks)
(d) Although there are no intra-company transfers between Divisions X and Y, there are a significant number of intercompany transfers between other divisions of Tapera PLC. Discuss the circumstances in which it is feasible and appropriate to use external market prices as the basis for setting transfer prices in such cases. (5 marks)
[Total: 25 marks]
Fanago Manufacturing PLC is a divisionalised company. Maguire is the manager of theCompany’s Textiles Division and he is considering the introduction of a new product line. This would require an immediate investment of $100000 in new fixed assets plus $50000 in additional working capital.The fixed assets would have a useful life of four years, and the product line would be discontinued at the end of that time.During each of the four years, 15000 units of the product would be produced and sold at a price of $18 each. Variable costs of production would be $12 per unit and fixed costs (other than depreciation) would amount to $50000 per annum. It is believed that a cash sum of $20000 would be received when the fixed assets are sold for scrap at the end of their four year life. However, in accordance with the company’s standard accounting practices, the full purchase cost of the fixed assets would be depreciated on a straight-line basis over their useful life (i.e. a zero residual value would be assumed in the calculation of the annual depreciation charge). The working capital investment would be recovered in full at the end of the projects life.
The performance of the Textiles Division is measured each year on the basis of Return on Investment (ROI).
For this purpose, profit is defined to include any gains or losses on fixed asset disposals and the investment base is defined as working capital investment plus the net book value of fixed assets at the beginning of the year. Maguire is paid a bonus each year which is linked to the extent by which his divisions actual ROI exceeds the divisions required (or target) ROI. The required rate of return for the Textiles Division is 10% per annum, and this is also the divisions cost of capital. Maguire’s own financial forecasts indicate that (in the absence of the proposed investment in the new product line) the Textiles Division will earn a ROI of 15% per annum for the next five years.Maquire plans to leave his current employment within the next two to three years and set up in business as a consultant to manufacturing companies who could benefit from his experience and advice.
REQUIREMENT: (a) Calculate the ROI of the proposed investment in each of the next four years. Then, explain whether or not Maguire is likely to accept this proposed investment, assuming that he acts to maximize his own self interest.(10 marks)
(b) Calculate the net present value of the proposed investment.(4 marks)
(c) The use of ROI as a performance measure does not necessarily ensure that a division manager will take decisions which are in shareholders best interests. Give three examples of why this so, using the case of Fanago Manufacturing PLC to illustrate.(6 marks)[Total: 20 marks]
BUDGETING
A BUDGET is a formal statement of a company’s future plans. It is expressed in monetary terms because the economic and financial
aspects of the business are the primary factors driving management’s decisions.
All managers should be involved in budgeting.
PURPOSE AND USES OF BUDGETS
1. Planning annual operations. Annual budgeting process leads to the refinement of previous plans since
managers must produce detailed plans for the implementation. Ensure that manager’s plan for future operations and that they consider how
conditions in the next year might change and what step they should take now to respond to these changes.
These processes encourage managers to anticipate problems before they arise and hasty decisions that are made on the spur of the moment, based on expedients rather than reasoned judgment will be minimized.
2. COORDINATION PURPOSES
The budget serves as a vehicle through which actions of different parts of an organization Nhongo Ltd. is a divisionalised company. Each month the company’s Chemicals Division manufactures 6000 tons of a product which it sells to external customers at a price of _$200 per ton. The fixed costs of the Chemicals Division are _$288 000 per month and the marginal costs of production and sale amount to $90 per ton. An absorption costing system is used to work out a ‘full cost per ton’ on the basis of this level of cost and activity.
Another division of the company (the Detergents Division) buys 2000 tons of a very similar chemical from an external supplier each month at a price of _$150 per ton. However, the Chemicals Division has sufficient spare capacity to enable it to supply the monthly needs of the Detergents Division. The transfer price which the Chemicals Division would charge would be the ‘full cost per ton’ as calculated on the basis of the increased level of output. The Detergents Division has indicated that this transfer price would be acceptable.
REQUIRED:(a) Calculate the transfer price proposed by the Chemicals Division, and show that this transfers pricing arrangement will motivate both divisions to act in a manner which is in the best interests of Nhongo Ltd. as a whole. (7 marks)
(b) Assume now that the two divisions cannot agree on transfer pricing arrangements for the 2000 tons. Specifically, the Chemicals Division will not accept any price lower than _$145 per ton but the Detergents Division will not agree to pay any price higher than $95 per ton.
Discuss whether, in these circumstances, the board of directors of Nhongo Ltd. should intervene to order the divisions to make the transfer at the price calculated in your answer to part (a). (9 marks)
(c) Assume now that the Detergents Division requires a further 500 tons per month (in addition to the 2000 tons), but that the Chemicals Division has no additional spare capacity and therefore these 500 tons could only be provided to the
Detergents Division if the Chemicals Division were to reduce sales to its external customers by an equivalent amount.
Assume also that the marginal cost to the Chemicals Division of supplying a ton to the Detergents Division is $3 lower than the cost of supplying a ton to an external customer. What is the appropriate transfer price per ton for these 500 tons? Explain your answer.(4 marks)[Total: 25 marks]
Can be brought together and be reconciled into a common plan.Budgeting compares managers to examine the relationship between their co-operation and those of other departments and in the process, identify and resolve conflicts.
3. IT ENHANCES COMMUNICATION Budgeting ensures that the definite terms of communication are laid down so
that all parts of the organization will be kept fully informed of the plans and policies which the organization expects to achieve.
It ensures that appropriate individuals are made accountable for implementation of the business.
Through the budget, top management communicates its expectations to lower level management so that all members of the organization may understand these expectations and can co-ordinate their activities to attain them. Therefore communication takes place much more during the preparation stage.
4. THEY ASSIST IN MOTIVATION Budgets produce a standard that in certain circumstances a manager may be motivated, inspired.However they can also encourage conflicts between managers

Through participation, it assists managers in managing their departments and it therefore acts as a strong motivational device which provides a challenge.
However where a budget is imposed from above it becomes a threat rather than a challenge and it can be resisted thereby doing more harm than good.
5. CONTROL
T he budget assist managers in controlling and managing activities for which they is responsible.
It promotes management by exception.
6. PERFORMANCE EVALUATION
Performance is evaluated by measuring his/her success in meeting the budgets
Bonuses may also be awarded on the basis of an employee’s ability to achieve targets specified in the periodic budgets or promotions may be partly dependent upon the manager’s budget record.
Budgets also provide a means of improving or measuring how managers are performing in meeting targets that they previously helped to set.
BEHAVIOURAL ASPECTS OF BUDGETS I ndividuals react to the demands of budgeting and budgetary control in
different ways and their behavior can damage the budget process.BEHAVIOUR PROBLEMS INCLUDES
Dysfunctional and budget stock. Dysfunctional is whereby individual managers seek to achieve their own objectives at the expense of goal congruence.
The system of targets and measures used should then encourage goal congruence
Budgets slack/bias
QUESTION 4
You have recently been appointed as an assistant management accountant in large company, Delta Beverages. When you meet the production manager, you overhear him speaking to one of his staff, saying: “Budgeting is a waste of time. I don’t see the point of it. It tells us what we can’t afford but it doesn’t keep us from buying it. It simply makes us invent new ways of manipulating figures. If all levels of management aren’t involved in the setting of the budget, they might as well not bother preparing one.
Required
4. Identify and explain six objectives of a budgeting control system. [13 marks]
5. Discuss the concept of a participative style of budgeting in terms of the six objectives identified in past (a). [12 marks]

- is a deliberate over –estimation of the expenditure and or under – estimation of revenues in the budgeting process.
This can happen because managers want easy target [for any easy life] or to ensure targets is exceeded and bonuses won or simply to pay the system.