Embed Size (px)
Citation preview
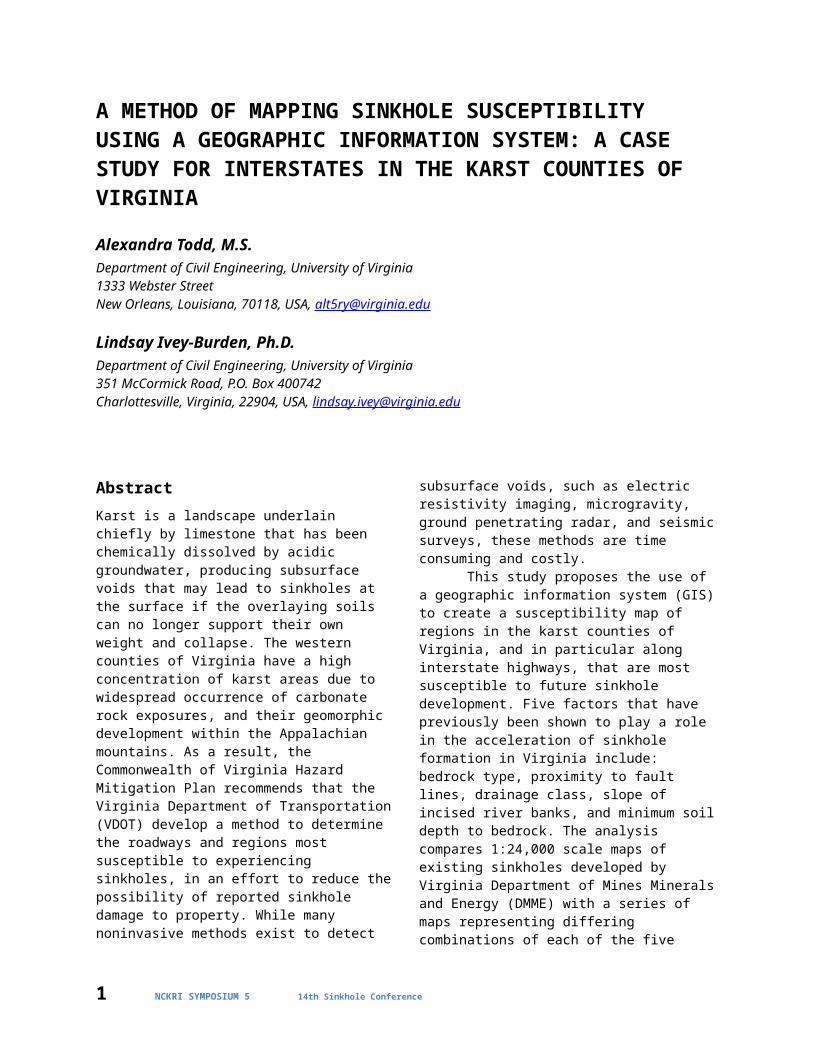
A METHOD OF MAPPING SINKHOLE SUSCEPTIBILITY USING A GEOGRAPHIC INFORMATION SYSTEM: A CASE STUDY FOR INTERSTATES IN THE KARST COUNTIES OF VIRGINIAAlexandra Todd, M.S.Department of Civil Engineering, University of Virginia1333 Webster StreetNew Orleans, Louisiana, 70118, USA, [email protected]
Lindsay Ivey-Burden, Ph.D.Department of Civil Engineering, University of Virginia351 McCormick Road, P.O. Box 400742Charlottesville, Virginia, 22904, USA, [email protected]
AbstractKarst is a landscape underlain chiefly by limestone that has been chemically dissolved by acidic groundwater, producing subsurface voids that may lead to sinkholes at the surface if the overlaying soils can no longer support their own weight and collapse. The western counties of Virginia have a high concentration of karst areas due to widespread occurrence of carbonate rock exposures, and their geomorphic development within the Appalachian mountains. As a result, the Commonwealth of Virginia Hazard Mitigation Plan recommends that the Virginia Department of Transportation (VDOT) develop a method to determine the roadways and regions most susceptible to experiencing sinkholes, in an effort to reduce the possibility of reported sinkhole damage to property. While many noninvasive methods exist to detect subsurface voids, such as electric resistivity imaging, microgravity, ground penetrating radar, and seismic surveys, these methods are time consuming and costly.
This study proposes the use of a geographic information system (GIS) to create a susceptibility map of regions in the karst counties of Virginia, and in particular along interstate highways, that are most susceptible to future sinkhole development. Five factors that have previously been shown to play a role in the acceleration of sinkhole formation in Virginia include: bedrock type, proximity to fault lines, drainage class, slope of incised river banks, and minimum soil depth to bedrock. The analysis compares 1:24,000 scale maps of existing sinkholes developed by Virginia Department of Mines Minerals and Energy (DMME) with a series of maps representing differing combinations of each of the five factors to determine which weighted combination
is most appropriate to use for a final representative sinkhole susceptibility map. The layers representing each factor are created using publicly available tabular and spatial data taken from the United States Department of Agriculture (USDA) Soil Survey Geographic (SSURGO) Database, the United States Geological Survey (USGS) National Map, the USGS Mineral Resources Online Data, and the National Weather Service. The methodology used to gather information specifically from the SSURGO database is highlighted within this paper. Data from the SSURGO database is used to create the bedrock type, drainage class, and minimum soil depth to bedrock layers. A substantial benefit to this methodology is that the new technique can be adjusted to accommodate for sinkhole susceptibility in other karst regions, by simply adjusting the input layers to consider the specific geology of a particular region.
Introduction
Karst terrain forms as acidic groundwater interacts with soluble bedrock, during which subsurface draining causes unique solutional patterns to carve into the rocks, forming cavities. The resulting voids introduce the potential to trigger land subsidence in the event that the topsoil filters into the voids, forming sinkholes (Hubbard, 2001).
The western counties of the state of Virginia contain abundant karst areas, because of the widespread occurrence of carbonate rock exposures, and their geomorphic development within the Appalachian mountains, ultimately locating the karst areas in long
1 NCKRI SYMPOSIUM 5 14th Sinkhole Conference
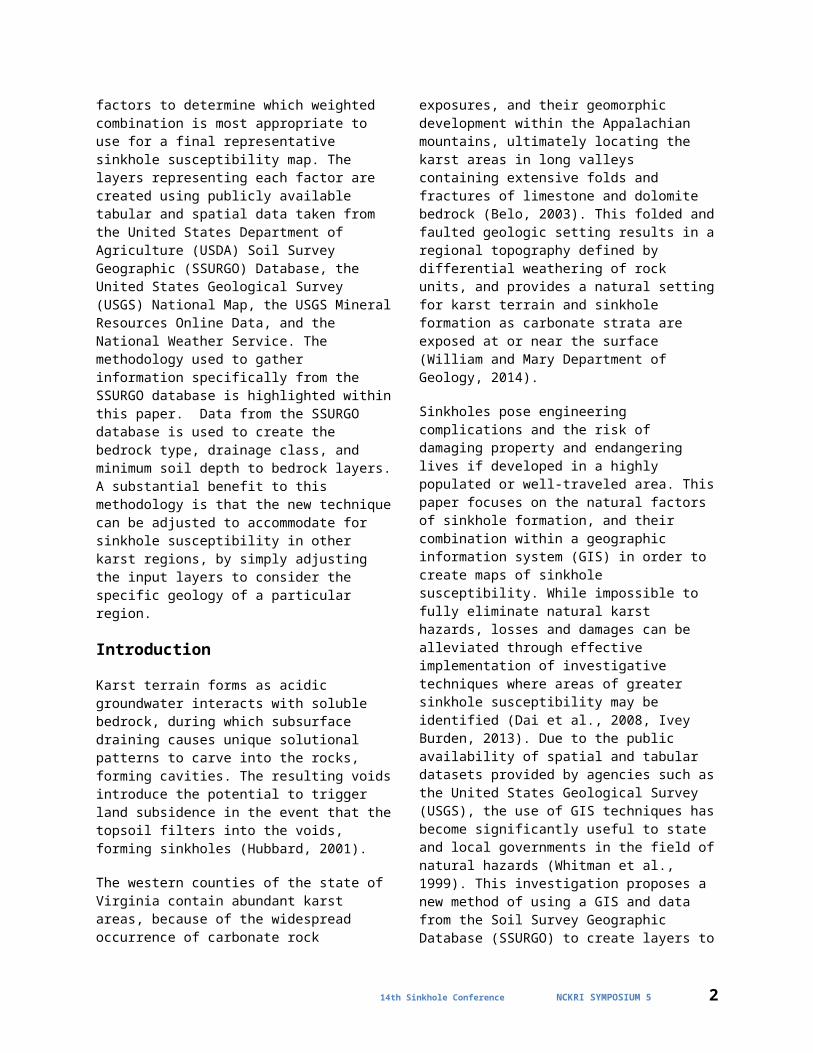
valleys containing extensive folds and fractures of limestone and dolomite bedrock (Belo, 2003). This folded and faulted geologic setting results in a regional topography defined by differential weathering of rock units, and provides a natural setting for karst terrain and sinkhole formation as carbonate strata are exposed at or near the surface (William and Mary Department of Geology, 2014).
Sinkholes pose engineering complications and the risk of damaging property and endangering lives if developed in a highly populated or well-traveled area. This paper focuses on the natural factors of sinkhole formation, and their combination within a geographic information system (GIS) in order to create maps of sinkhole susceptibility. While impossible to fully eliminate natural karst hazards, losses and damages can be alleviated through effective implementation of investigative techniques where areas of greater sinkhole susceptibility may be identified (Dai et al., 2008, Ivey Burden, 2013). Due to the public availability of spatial and tabular datasets provided by agencies such as the United States Geological Survey (USGS), the use of GIS techniques has become significantly useful to state and local governments in the field of natural hazards (Whitman et al., 1999). This investigation proposes a new method of using a GIS and data from the Soil Survey Geographic Database (SSURGO) to create layers to predict where those sinkholes might form in an effort to avoid such dangers, specifically along Virginia highways. The results provide an inexpensive and quick method of better locating proposed roadway passages to aid in avoiding impact to karst areas (Moore et al., 2008) and determining which roadways may require immediate safety evaluations, ultimately minimizing environmental threats to life and property and maximizing land use (Muckel, 2004). Additionally, factors input into the methodology developed within this study could be adjusted to consider the geology of other karst regions with similar data availability.
BackgroundThere have been few studies aiming to accurately estimate sinkhole risk due to the lack of detailed datasets, spatial analysis, and historical records on the subject. Karst maps were the sole method of assessing subsidence potential. However, the Virginia Hazard Mitigation Plan claims “a high percentage of karst geology in a jurisdiction does not necessarily [imply] that the whole locality is at risk for land subsidence” (Virginia Department of Emergency Management, 2003). Without a well-established set of guidelines that predict probabilities, a true risk determination cannot be formed.
In a study on sinkhole distribution in Virginia, Hubbard (2001) determined sinkhole locations by stereoscopic viewing and panchromatic aerial photography, field-checking any questionable sinkholes. Hubbard determined that detected sinkholes mainly occur in regions where carbonate rocks are present, where structural folds and faults exist, and where carbonate bedrock is adjacent to deeply incised rivers and tributaries (Hubbard, 2001). Additionally, it was noted that not all sinkholes can be detected by aerial stereophoto pairs, since aircraft tilt makes certain shallow sinkholes entirely unrecognizable while making other low slope regions appear as sinkholes when in fact they were none. Hubbard (2001) estimated that it would take 250 years to map every single sinkhole in Virginia’s Valley and Ridge province using solely aerial photography and field- checks. However, recent acquisitions of Light and Detection and Ranging (LIDAR) data in Virginia allow for the creation of highly accurate (sub-meter) elevation models that can be used for rapid, precise detection of sinkholes (Doctor and Young, 2013).
The growing body of sinkhole datasets has driven scientists to look further into the subject to develop trends that could be implemented into a GIS to create maps of sinkhole susceptibility across broad areas. Hyland (2005) verified that there is a correlation of sinkhole proximity with existing fault lines (Hyland, 2005).
Water flow in karst areas is not manifested on the surface in karst regions as much as in non-karst regions because it percolates into the subsurface caves and conduits. Hence a region with rapid surface drainage, or a greater hydraulic gradient and lack of surface water, might imply subsurface drainage pathways that could potentially lead to the possibility of sinkhole formation in that particular area. Smaller surface streams often do not exist or endure as voids accommodate most of the water into the network of conduits and fissures, leaving only the stronger, more heavily flowing rivers to remain above ground. Proximity to these deeply incised rivers remaining above the surface is most likely indicative of a sinkhole susceptible region, because of the steepened hydraulic gradient and the resulting increase in groundwater flow for those areas (Muckel, 2004).
Green et al. (2002) decided that sinkhole risk studies should focus on shallower regions of bedrock, concluding that the timescale for which sinkholes may develop can be hours to months for shallow depth to bedrock, where it may be decades to centuries with a thicker depth to bedrock.
14th Sinkhole Conference NCKRI SYMPOSIUM 5 2
This study aims to create a sinkhole susceptibility analysis map by combining 5 factors – bedrock type,
proximity to fault lines, drainage class, proximity to
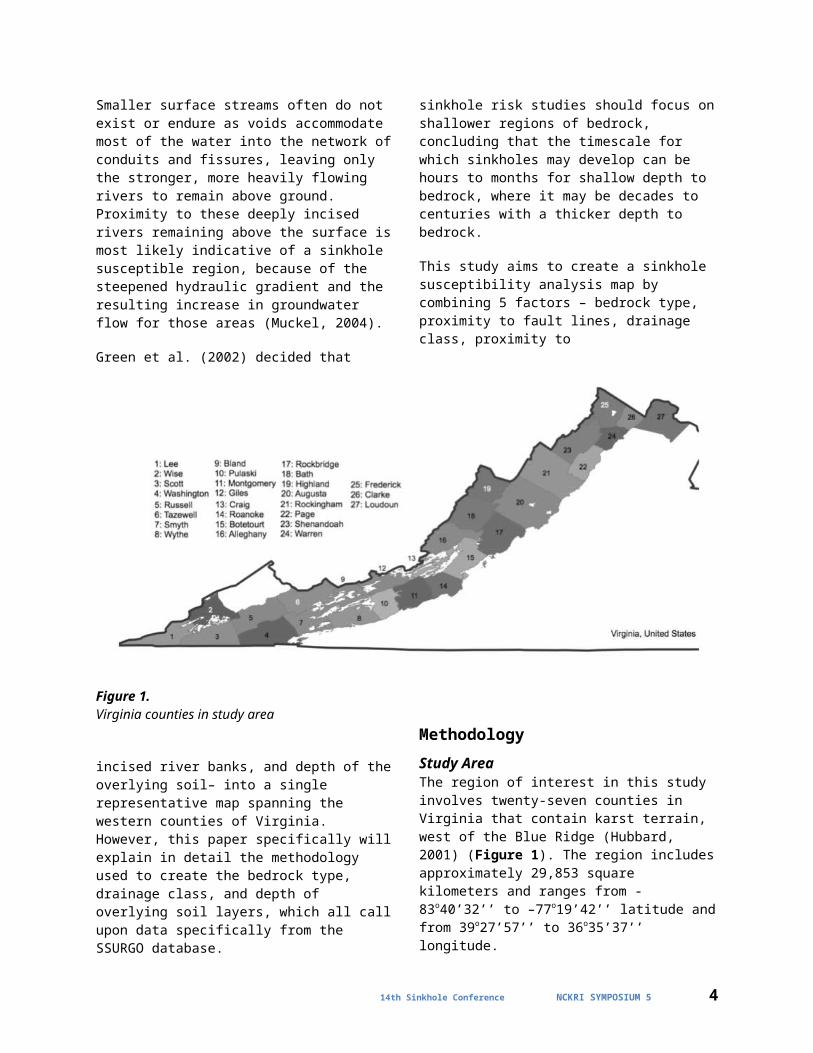
Figure 1.Virginia counties in study area
incised river banks, and depth of the overlying soil– into a single representative map spanning the western counties of Virginia. However, this paper specifically will explain in detail the methodology used to create the bedrock type, drainage class, and depth of overlying soil layers, which all call upon data specifically from the SSURGO database.
MethodologyStudy AreaThe region of interest in this study involves twenty-seven counties in Virginia that contain karst terrain, west of the Blue Ridge (Hubbard, 2001) (Figure 1). The region includes approximately 29,853 square kilometers and ranges from -83o40’32’’ to –77o19’42’’ latitude and from 39o27’57’’ to 36o35’37’’ longitude.
Data Acquisition and PreparationFor the final representative sinkhole susceptibility map, data was taken from four sources. Bedrock type, depth to bedrock, drainage classes, and county and map unit boundaries were obtained from the SSURGO database (websoilsurvey.nrcs.usda.gov), digital elevation models and the Virginia state boundary were from the USGS National Map (nationalmap.gov), fault lines were downloaded from the USGS Mineral Resources Online Spatial Data (mrdata.usgs.gov), and rivers were obtained from the National Weather Service website
(weather.gov). The analysis created a compiled ranked map determining regions of potential sinkhole formation based on five unique layers created in ArcMap 10.1. Each layer contained a map of regions assigned a ‘Sinkhole Value’ ranging from 1-15 (1 is low susceptibility and 15 is high susceptibility), representing the level of potential hazard based on the corresponding risk factor. The distinct maps were ultimately combined using weights representing the corresponding factor’s influence on predicting sinkhole regions, and then the most appropriate combination was statistically determined using a residual sum of squared errors test, for use in the final representative susceptibility map.
The main contribution of this paper, however, is the methodology created to extract relevant sinkhole layer data from the SSURGO database. This database has been created by the National Cooperative Soil Survey over many years and spatially references surface soil data at scales ranging from 1:12,000 to 1:63,360. The database offers a detailed description of the surveyed soils; however, since it is a collection of soil descriptions from various soil scientists, it is a notoriously difficult database to work with as it contains very little uniformity among entries, varying soil descriptions, and some duplicate entries. In the creation of the bedrock type, drainage class, and depth to bedrock layers for the final representative sinkhole susceptibility map produced by this study, Python codes were created to efficiently sort and gather relevant
3 NCKRI SYMPOSIUM 5 14th Sinkhole Conference
information from the SSURGO tables for the creation of the aforementioned layers. Bedrock TypeBedrock type is a contributing factor to sinkhole formation since sinkholes have proven to form in regions of relatively pure carbonate rocks. The bedrock type layer was derived from SSURGO tabular data located in the Component and the Component Parent Material (COPM) tables for each of the 27 counties of interest. Desired attributes from the individual tables were combined into a single table based on common fields through a Python script, converted to pseudo-code for simplicity:
# Loop through each county’s SSURGO database# Select the parent material field in the database for each map unit and add to a new table# Add a new column to table called “Sinkhole Value”# Loop through the table, and define the “Sinkhole Value” for every map unit depending on its parent material# Define pure limestone parent material a Sinkhole Value = 4# Define combined limestone and dolomite parent materials a Sinkhole Value = 2# Define other calcareous parent materials a Sinkhole Value = 3# Define all other parent materials a Sinkhole Value = 4
The parent material kind and origin were defined in the COPM table, where formation kind was described as “alluvium”, “colluvium”, or “residuum”, and formation origin ranged through a number of bedrock origins, such as limestone, sandstone, or shale. The Component table defined the corresponding representative component percentage. The script removed any duplicate or null entries as well as any entries where the parent material kind was alluvial, since alluvium soils rarely play a role in karst development. If a sinkhole does in fact exist in a region with alluvial deposits, it is more likely a result of one of the other factors in this study (proximity to faults or depth to bedrock, for example) rather than a result of the bedrock type (Hyland 2005).A new field called the “Unweighted Sinkhole Value” was added to the resulting table, determined by the parent material origin, assigning pure limestone origins the highest value of 4, limestones and dolomite combinations a value of 3, values containing only partial carbonate rock a value of 2, and entirely clastic and non-carbonate origins the lowest value of 1. The final table from the script was imported into Microsoft Excel, where a final weighted Sinkhole Value was calculated per map unit using the component percentage and the Unweighted Sinkhole Value:
Component1 Percentage x Unweighted Sinkhole Value1 + Component2 Percentage x Unweighted Sinkhole Value2 +... = Final Sinkhole Value for Corresponding Map Unit
While the final weighted Sinkhole Values ranged from 1-4 as non-integer values, the values were reclassified into 15 equally incremented categories to remain consistent with the next four layers. This final table was imported into a Microsoft Access Database to then be imported into ArcMap, where it could be joined spatially with the spatial map units using the “Add/Join” tool in ArcMap (Figure 2A).
Drainage ClassDrainage plays a role in predicting sinkhole risk occurrence because it provides information on how rapidly water will drain through the soil type. Drainage class (drainagecl) was a field defined in the SSURGO Component table, composed of values ranging from excessively drained to very poorly drained. A Python script was written creating a table that combined each map unit with its corresponding drainage class.
Only 7 different drainage classes were listed, so the regions with poor drainage had Sinkhole Values defined as the odd numbers ranging from 1 to 5, and regions that were excessively drained had Sinkhole Values defined as the odd numbers ranging from 9 to 15, since this most likely meant water was being absorbed into subsurface karstic drainage systems. Zero was assigned to the excess regions with no drainage class assignment. Sinkhole Value 7 had no assignment in this layer. (Figure 2C).
Depth of Overlying SoilThe timescale during which sinkholes may develop is much shorter in regions of shallow depth to bedrock. Thus a sinkhole factor layer representing depth to bedrock was created using SSURGO data found in the Mapunit Aggregated Attribute (MUAGGATT) table. The bedrock minimum depth entry for each map unit along the 27 counties was recorded into a table using a Python script, based on a common map unit key found in the Mapunit and the MUAGGATT tables.
The resulting output table was imported into ArcMap, where it was spatially joined with the map units. The depth ranges were converted to raster and were then reclassified into 15 equal intervals, defined for each 15cm increment below the surface. Shallow soil cover overlying the bedrock was assigned the highest Sinkhole Value of 15, and the deepest amount of soil cover was assigned the lowest Sinkhole Value of 1 (Figure 2E).
Proximity to Fault LinesHyland (2005) determined a correlation between sinkhole formation and proximity to existing fault lines. To create this fault risk layer in the final risk map in ArcMap, the “Multiple Ring Buffer” tool was used
14th Sinkhole Conference NCKRI SYMPOSIUM 5 4
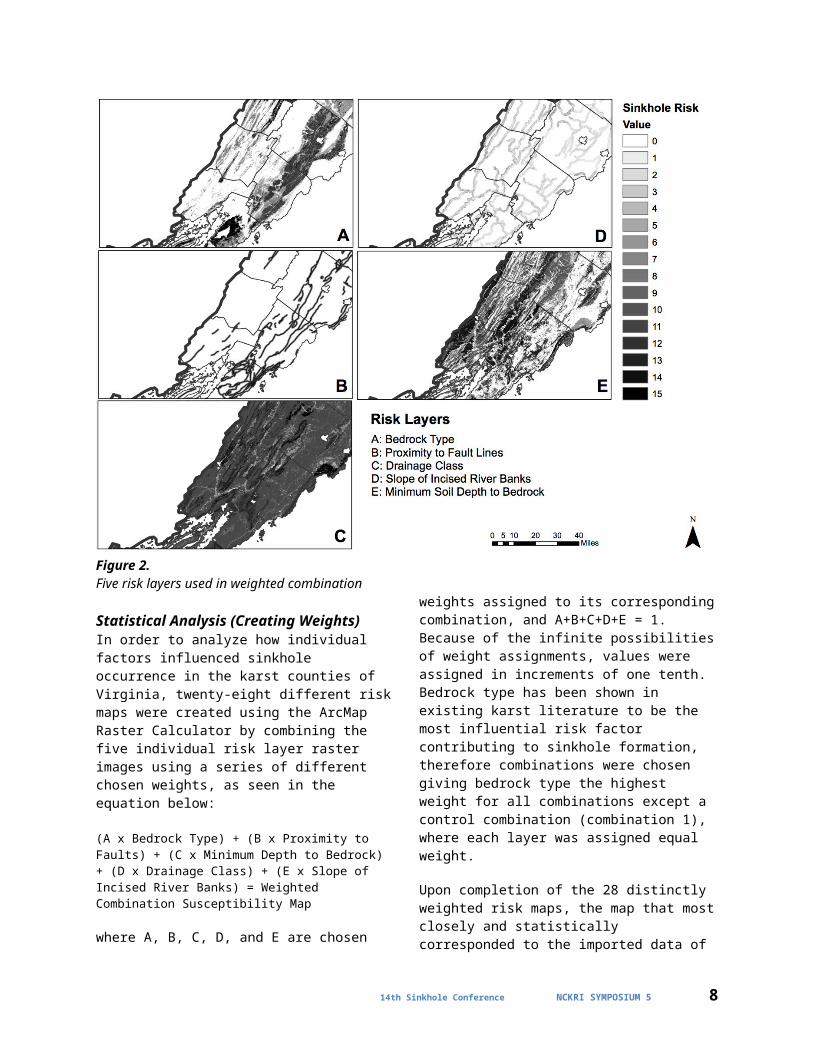
around the fault lines extracted from USGS Mineral Resources Online Spatial Data. Rings ranging from 0 – 3000 feet from the faults in increments of 200 feet were created and converted to raster, then reclassified into Sinkhole Values of 1 through 15. Values were highest at regions closest to the faults, decreasing outwardly as distance increased from faults (Figure 2B).
Slope of Incised River BanksA higher risk for sinkhole formation near incised river banks can be attributed to a higher hydraulic gradient and resulting increase in nearby groundwater flow. To determine the degree of incised rivers, Virginia rivers downloaded from USNWS geospatial data were added
to the map layer, with a buffer region constructed using the “Multiple Ring Buffer” tool in ArcMap to account for river widths. Slopes along riverbanks were identified based on digital elevation model rasters imported from the USGS National Map and clipped to only exist within half-mile buffer zones around each river. The slopes of the elevation model rasters were computed using the ArcMap “Slope” tool. The total range of slopes were split into 15 equally incremented categories and slopes of regions were reclassified into one of the 15 consequent categories, assigning low slopes in the regions surrounding rivers to a Sinkhole Value of 1 and high slopes to a Sinkhole Value of 15 (Figure 2D).
Figure 2.Five risk layers used in weighted combination
Statistical Analysis (Creating Weights)In order to analyze how individual factors influenced sinkhole occurrence in the karst counties of Virginia, twenty-eight different risk maps were created using the ArcMap Raster Calculator by combining the five individual risk layer raster images using a series of
different chosen weights, as seen in the equation below:
(A x Bedrock Type) + (B x Proximity to Faults) + (C x Minimum Depth to Bedrock) + (D x Drainage Class) + (E x Slope of Incised River Banks) = Weighted Combination Susceptibility Map
where A, B, C, D, and E are chosen weights assigned to its corresponding combination, and A+B+C+D+E = 1.
5 NCKRI SYMPOSIUM 5 14th Sinkhole Conference
Because of the infinite possibilities of weight assignments, values were assigned in increments of one tenth. Bedrock type has been shown in existing karst literature to be the most influential risk factor contributing to sinkhole formation, therefore combinations were chosen giving bedrock type the highest weight for all combinations except a control combination (combination 1), where each layer was assigned equal weight.
Upon completion of the 28 distinctly weighted risk maps, the map that most closely and statistically corresponded to the imported data of mapped sinkhole locations would be chosen. A Python script that could loop through each combination, automating the following steps, was constructed. Spatial data containing existing mapped sinkholes was added into the map. Each weighted risk map was converted from a raster image to a polygon shapefile based on its Sinkhole Level (1-15) so that it could be clipped into the boundary of the existing sinkholes. Using the “Dissolve” tool, the newly clipped risk map was condensed into fifteen total zones, based on its defined sinkhole levels. A new field was added to the attribute table of the polygon to calculate the total areas of each distinctive Sinkhole Level. In Excel, the areas of sinkholes corresponding to each Sinkhole Level, the total area of existing sinkholes, and the percentages of each individual level compared to the total sinkhole area were computed and recorded. For simplicity, the 15 Sinkhole Levels were condensed into five risk zones, defining values 1-3 as a Low Risk Zone, 4-6 as a Medium-Low Risk Zone, 7-9 as a Medium Risk Zone, 10-12 as Medium-High Risk Zone, and 13-15 as a High Risk Zone.
The ideal percentages of existing sinkhole areas per risk zone were defined so they could be statistically compared with the observed percentages using a Residual Sum of Square (RSS) error test. In an ideal situation, there would be no actual sinkholes found in the Low Risk Zone and the highest percentage of actual mapped sinkholes would be found in the High Risk Zone, with a linear relationship between those zones in between and the sum of the total percentages being 100. Hence this investigation predicted that percentages should be 0, 10, 20, 30, and 40% respectively, per increasing risk zone. Error between the actual and the ideal models exemplifies how well the experimental data fits the expected, so the goal is to minimize the RSS. RSS values for each combination were computed and ranked. Thus the combination with the lowest RSS
was the value most closely matching the ideal situation and was used for the final map.
ResultsFinal Map with InterpretationThe final map (Figure 3), created from combination 25 which had the smallest RSS when compared with the predicted model, was created using the following equation:
Weighted Map = (0.6xBedrockLayer) + (0.1xProximityToFaultLayer) + (0.2xDrainageClass) + (0xSlopeOfIncsiedRiverBanks) + (0.1xDepthToBedrockLayer)
Figure 6 also displays a USGS Karst Terrain map beside the final sinkhole risk map. Karst terrain is defined to be terrain containing subsurface fissures, caverns, and voids resulting from chemically dissolved limestone bedrock, thus if the two maps relate, we can be confident in the conclusions reached. From a visual comparison, the resulting values make sense, since the regions with karst terrain on the USGS map align with the higher risk regions on the sinkhole risk map.
Sources of ErrorThe final weights used to combine the layers into the ultimate sinkhole susceptibility map were based on a statistical comparison between the constructed predicted at risk regions and existing sinkholes. However, to make clear that his sinkholes were mapped as a guideline and not a set of perfectly defined structures, Hubbard digitized his data using a scale that was 10 times less accurate than the scale the public had requested (personal communication). Furthermore, the aerial photography used in Hubbard’s study cannot accurately detect all sinkholes due to aircraft tilt, which creates the illusion of a sinkhole where it may not exist and does not recognize shallower sinkholes at all. The incomplete or flawed representation of sinkhole locations serve as a source of error in choosing the appropriate weights for the combination of risk layers.
By using the USDA Soil Survey data, a degree of error was inevitable due to the fact that data tables from which a significant portion of the risk layers were derived were incomplete for specific factors in a majority of counties within the study. Additionally, SSURGO data contained values corresponding to Virginia counties but not all major Virginia cities, which likely have their own GIS database. This led to voids in the final map.
14th Sinkhole Conference NCKRI SYMPOSIUM 5 6
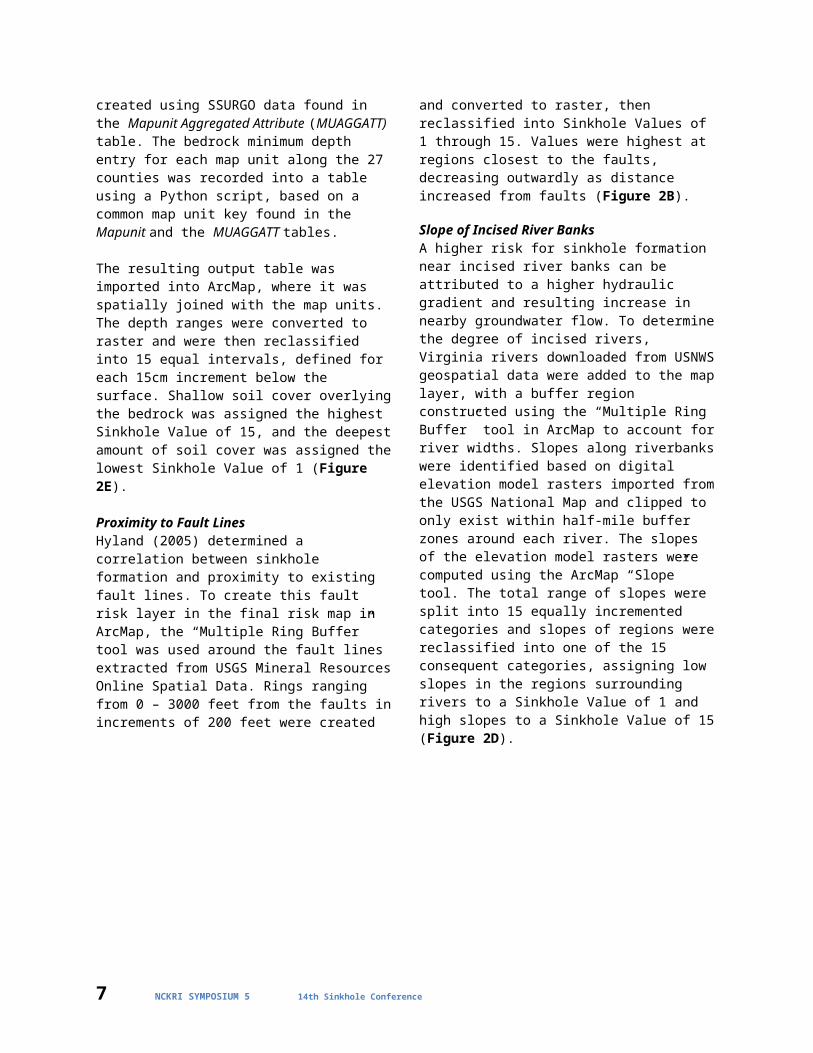
Figure 3.Comparison of USGS karst terrain with final risk map
The type of data available further limited the scope of this study. The slope of incised riverbanks risk layer was determined using digital elevation models, and raster images were created using remote sensing or based on existing topographic maps. While these are helpful for analyzing the surface topography of the region, difficulties in karst analyses arise since the directions of subsurface flow and hydrologic connections between sinkholes or subsurface aquifers are not represented in them (Taylor et al., 2008). It would be much more useful to know the direction of water flow in those surrounding incised river banks, since large slopes on the surface do not necessarily denote fast paced water travel through subsurface fissures and waterways.
Finally, risk layers compiled in creating the final map were created and assigned Sinkhole Values based on hypotheses derived from background knowledge and engineering judgment. It is always possible that a sinkhole value was assigned incorrectly.
ConclusionThis analysis used a geographic information system and readily available data from the SSURGO database to create a map that represents regions most at risk of sinkhole formation in the karst counties of Virginia.
While these results serve as a general guideline for mapping karst regions in Virginia, it is important to understand that a risk map created based on generalities cannot be substituted for a site-specific analysis. Different karst landforms relate to one another, but the combinations and behaviors of the relationship between local, hydrological, and climactic conditions are numerous (Ford et al., 1989). While this map provides a general understanding of karst terrain in Virginia, the final product and the methods taken to reach it are specific to the region of interest. In order to apply this technology to new regions, a thorough background of the geology for that region is necessary and factor layers for sinkhole formation be adjusted accordingly. However, once factors for a new region have been defined, this methodology can be applied to produce similar results.
ReferencesBelo BP. 2003. Natural Hazard Mitigation Planning
for Karst Terrains in Virginia [master’s thesis]. Virginia Polytechnic Institute and State University. 48 p.
Dai J, Lei M, Lui W, Tang S, and Lai S. 2008. An Assessment of Karst Collapse Hazards in Guilin, Guangxi Province, China. In: Yuhr LB, Alexander EC Jr, Beck BF, editors. Sinkholes
7 NCKRI SYMPOSIUM 5 14th Sinkhole Conference
and the Engineering and Environmental Impacts of Karst. Proceedings of the 11th Multidisciplinary Conference on Sinkholes and the Engineering and Environmental Impacts of Karst; 2008 Sept. 22-26; Tallahassee, FL: ASCE. p.156-164.
Doctor DH and Young JA. 2013. An Evaluation of Automated GIS Tools for Delineating Karst Sinkholes and Closed Depressions from 1-Meter LIDAR Derived Digital Elevation Data. In: Proceedings of the Thirteenth Multidisciplinary Conference on Sinkholes and the Engineering and Environmental Impacts of Karst; 2013 Sept. 22-26; Carlsbad, New Mexico: ASCE p. 449-458.
Ford DC and Williams PW. 1989. Karst Geomorphology and Hydrology. Chapman and Hall, London.
Green JA, Marken WJ, Alexander EC, and Alexander SC. 2002. Karst Unit Mapping using Geographic Information System Technology, Mower County, Minnesota, USA. Environmental Geology, 42(5): 457-461.
Hubbard DA Jr. 2001. Sinkhole Distribution of the Valley and Ridge Province, Virginia. In: Geotechnical and Environmental Applications of Karst Geology and Hydrology: Proceedings of the Eighth Multidisciplinary Conference on Sinkholes, 2001 April 1-4; Louisville, KY: ASCE. p. 33-36.
Hubbard DA Jr. 1983. Selected Karst Features of the Northern Valley and Ridge Province, Virginia. In Virginia Division of Mineral Resources, Publication 44.
Hyland SE. 2005. Analysis of Sinkhole Susceptibility and Karst Distribution in the Northern Shenandoah Valley, VA: Implications for Low Impact Development (LID) Site Suitability Model [master’s thesis]. Virginia Polytechnic Institute and State University. 62 p.
Ivey Burden L. 2013. Karst Topography: Noninvasive Geophysical Detection Methods and Construction Techniques. Virginia Council for Transportation Research and Innovation. Final Contract Report. Project UVA-2012-01. 22 p.
Moore H and McDowell L. The Development and Use of Karst Maps in the Location of Highways in
Eastern Tennessee. In: Yuhr LB, Alexander EC Jr, Beck BF, editors. Sinkholes and the Engineering and Environmental Impacts of Karst. Proceedings of the 11th Multidisciplinary Conference on Sinkholes and the Engineering and Environmental Impacts of Karst; 2008 Sept. 22-26; Tallahassee, FL: ASCE. p. 680-693.
Muckel GB, editor. 2004. Understanding Soil Risks and Hazards: Using Soil Survey to Identify Areas with Risks and Hazards to Human Life and Property. United States Department of Agriculture, Natural Resources Conservation Service, National Soil Survey Center.
Taylor CJ, Kaiser WP, and Nelson HL Jr. 2008. Application of Geographic Information System (GIS) Hydrologic Data Models to Karst Terrain. In: Yuhr LB, Alexander EC Jr, Beck BF, editors. Sinkholes and the Engineering and Environmental Impacts of Karst. Proceedings of the 11th Multidisciplinary Conference on Sinkholes and the Engineering and Environmental Impacts of Karst; 2008 Sept. 22-26; Tallahassee, FL: ASCE. p.146-155.
Valley and Ridge Province, Geology of Virginia [Internet] 2014. [Place of publication unknown]: William and Mary Department of Geology; [updated 2007 Feb 23; cited 2014 July 14] Available from: http://web.wm.edu/geology/virginia/provinces/valleyridge/valley_ridge.html.
Virginia Department of Emergency Management. 2003. Commonwealth of Virginia Hazard Mitigation Plan. Chapter 3 – Hazard Identification and Risk Assessment (HIRA): Section 3-14 – Land Subsidence (Karst). Virginia Tech Center for Geospatial Information Technology. 15 p. Available from: http://www.vaemergency.gov/webfm_send/853/Section3-14-KarstTopography.pdf
Whitman D and Gubbels TL. 1999. Applications of GIS Technology to the Triggering Phenomena of Sinkholes in Central Florida. In: Beck BF, Pettit AJ, and Herring JG, eds. Hydrogeology and Engineering Geology of Sinkholes and Karst. p. 67-73.
14th Sinkhole Conference NCKRI SYMPOSIUM 5 8