Embed Size (px)
Citation preview
2017 WELLS FARGO INVESTMENT THOUGHT LEADERSHIP FORUM December 6, 2017
www.tpvg.com
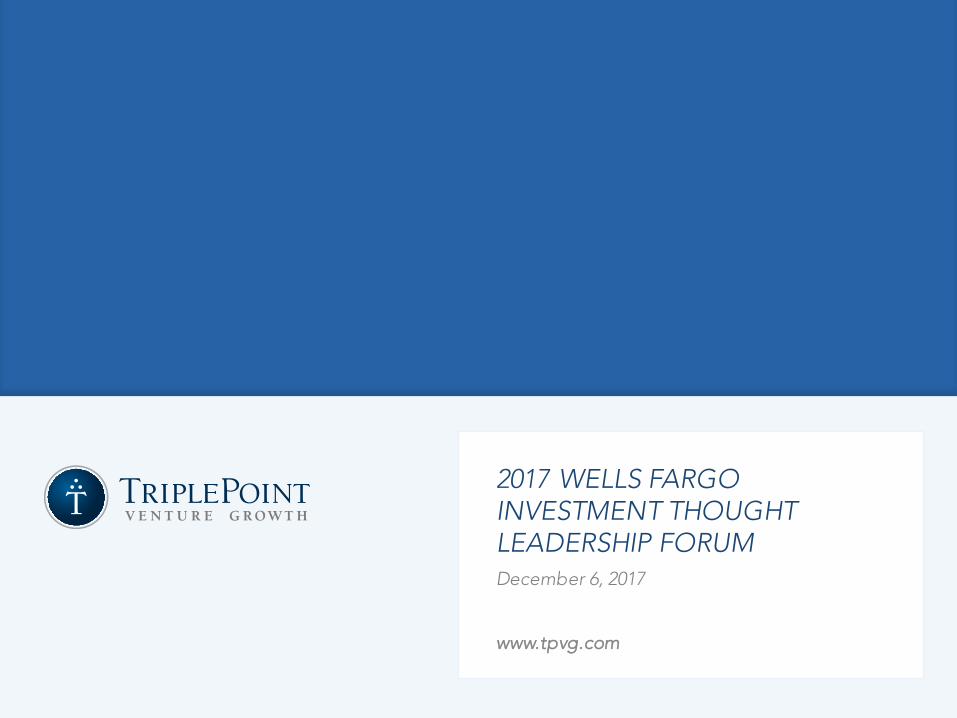
FORWARDLOOKINGSTATEMENT
Some of the statements in this presentation constitute forward-looking statements, which relate to future events or our future performance or financial condition. The forward-lookingstatements contained in this presentation involve risks and uncertainties, including statements as to: our future operating results; our business prospects and the prospects of our portfoliocompanies ; our relationships with third-parties including venture capital investors; the impact and timing of our unfunded obligations; the expected market for venture capital investments;the performance of our portfolio and other investments that we may make in the future; the impact of investments that we expect to make; actual and potential conflicts of interest withTriplePoint Capital LLC (“TriplePoint Capital”) and TPVG Advisers LLC (our “Adviser”) and its senior investment team and Investment Committee; our contractual arrangements andrelationships with third-parties; the dependence of our future success on the general economy and its impact on the industries in which we invest; the ability of our portfolio companies toachieve their objectives; our expected financings and investments; the ability of our Adviser to attract, retain and have access to highly talented professionals, including our Adviser's seniorinvestment team; our ability to qualify and maintain our qualification as a regulated investment company, or “RIC, ” and as a business development company, or “BDC;” the adequacy of ourcash resources and working capital; and the timing of cash flows, if any, from the operations of our portfolio companies.
Such forward-looking statements may include statements preceded by, followed by or that otherwise include the words “may,” “might,” “will,” “intend,” “should,” “could,” “ca n,” “would,”“expect,” “believe,” “estimate,” “anticipate,” “predict,” “potential,” “plan” or similar words.
We have based the forward-looking statements included in this presentation on information available to us on the date of this presentation, and we assume no obligation to update any suchforward-looking statements. Actual results could differ materially from those anticipated in our forward-looking statements, and future results could differ materially from historicalperformance. Although we undertake no obligation to revise or update any forward-looking statements, whether as a result of new information, future events or otherwise, you are advised toconsult any additional disclosures that we may make directly to you or through reports that we in the future may file with the Securities and Exchange Commission (“SEC”), including annualreports on Form 10-K, quarterly reports on Form 10-Q and current reports on Form 8-K. For a further discussion of factors that could cause our future results to differ materially from anyforward-looking statements, see the section entitled "Risk Factors" in the Company’s annual report on Form 10-K and other public filings.
Although we believe that the assumptions on whi ch these forward-looking statements are based are reasonable, any of those assumptions could prove to be inaccurate, and as a result, theforward-looking statements based on those assumptions also could be i naccurate. In light of these and other uncertainties, the inclusi on of a projection or forward-looking statement in thispresentation should not be regarded as a representation by us that our plans and objectives will be achieved. These risks and uncertainties include those described or identified in the “RiskFactors” section of the Company’s annual report on Form 10-K and elsewhere in our filings with the SEC. You should not place undue reliance on these forward-looking statements, whichapply only as of the date of this presentation.
This presentation contains statistics and other data that has been obtained from or compiled from information made available by third-party service providers. We have not independentlyverified such statistics or data.
These materials and any presentation of which they form a part are neither an offer to sell, nor a solicitation of an offer to purchase, an interest in the Company in any jurisdiction where theoffer or sale is not permitted or would be unlawful under the securities laws of such jurisdiction. The information presented i n this presentation is as of September 30, 2017 unless indi catedotherwise.
Page: 2
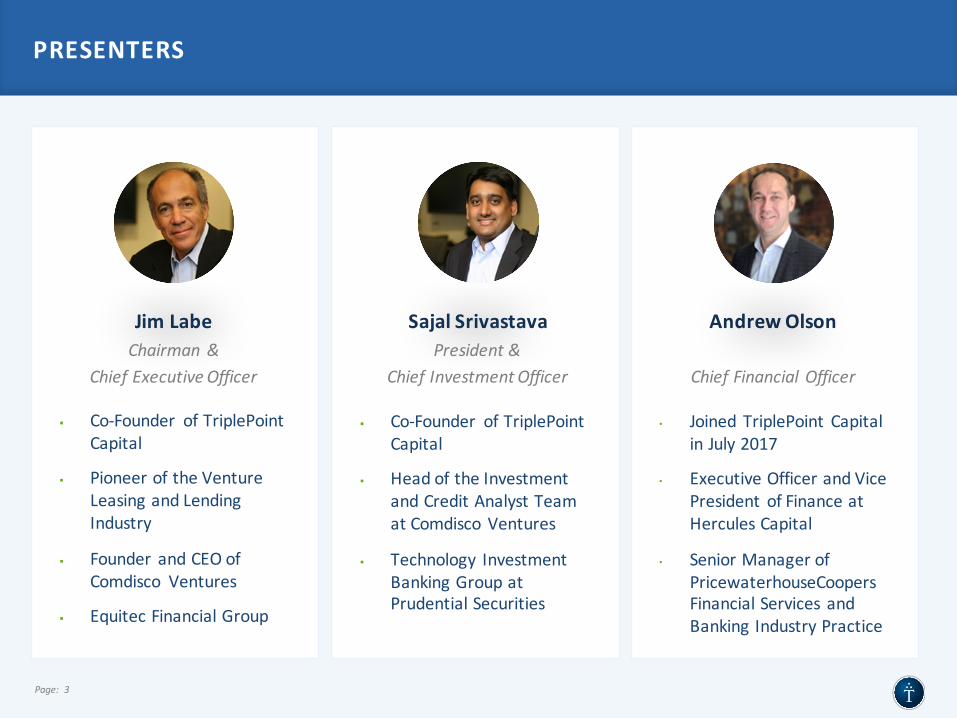
PRESENTERS
§ Co-Founder ofTriplePointCapital
§ PioneeroftheVentureLeasingandLendingIndustry
§ Founder andCEOofComdisco Ventures
§ EquitecFinancialGroup
Page: 3
§ Co-Founder ofTriplePointCapital
§ HeadoftheInvestmentandCreditAnalystTeamatComdiscoVentures
§ Technology InvestmentBankingGroupatPrudentialSecurities
JimLabeChairman&
ChiefExecutiveOfficer
SajalSrivastavaPresident&
ChiefInvestmentOfficer
• Joined TriplePoint CapitalinJuly2017
• ExecutiveOfficerandVicePresident ofFinanceatHerculesCapital
• SeniorManagerofPricewaterhouseCoopersFinancialServices andBankingIndustryPractice
AndrewOlson
ChiefFinancialOfficer

TPVGOVERVIEW
Page: 5
HIGHLYDIFFERENTIATED
BUILTFORSUCCESS
ALIGNEDWITHPUBLICSHAREHOLDERS
DELIVERINGRESULTS
- The 4 R’s -
Relationships
Reputation
References
Returns
TRIPLEPOINT VENTUREGROWTHBDCCORPOVERVIEW
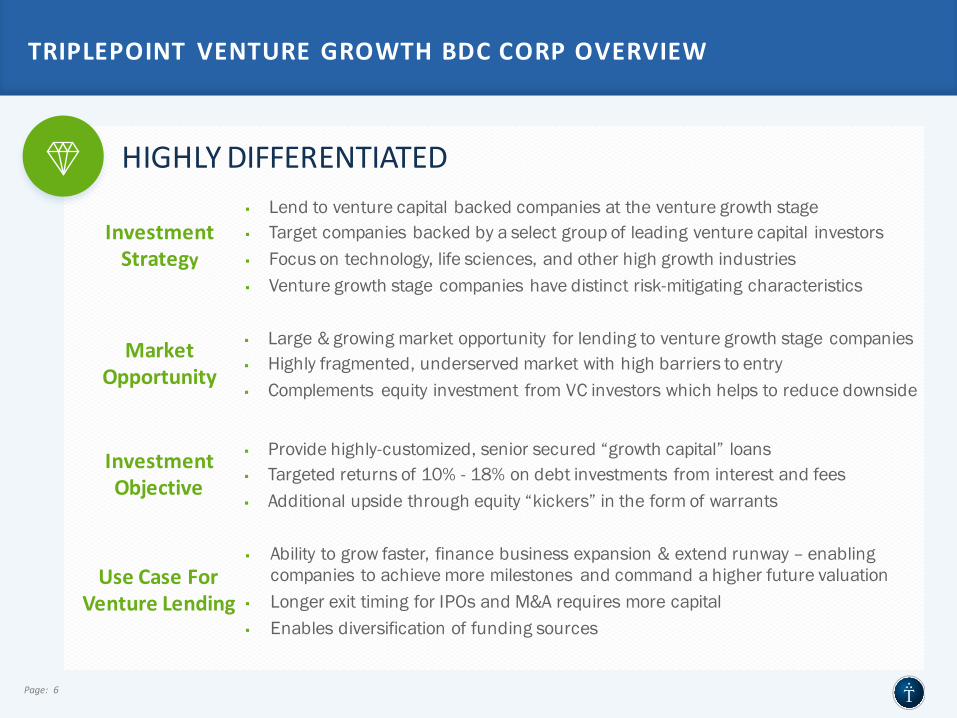
HIGHLYDIFFERENTIATED
TRIPLEPOINT VENTUREGROWTHBDCCORPOVERVIEW
§ Provide highly-customized, senior secured “growth capital” loans § Targeted returns of 10% - 18% on debt investments from interest and fees§ Additional upside through equity “kickers” in the form of warrants
§ Ability to grow faster, finance business expansion & extend runway – enabling companies to achieve more milestones and command a higher future valuation
§ Longer exit timing for IPOs and M&A requires more capital§ Enables diversification of funding sources
§ Large & growing market opportunity for lending to venture growth stage companies § Highly fragmented, underserved market with high barriers to entry§ Complements equity investment from VC investors which helps to reduce downside
InvestmentObjective
UseCaseForVentureLending
MarketOpportunity
§ Lend to venture capital backed companies at the venture growth stage § Target companies backed by a select group of leading venture capital investors§ Focus on technology, life sciences, and other high growth industries§ Venture growth stage companies have distinct risk-mitigating characteristics
InvestmentStrategy
Page: 6
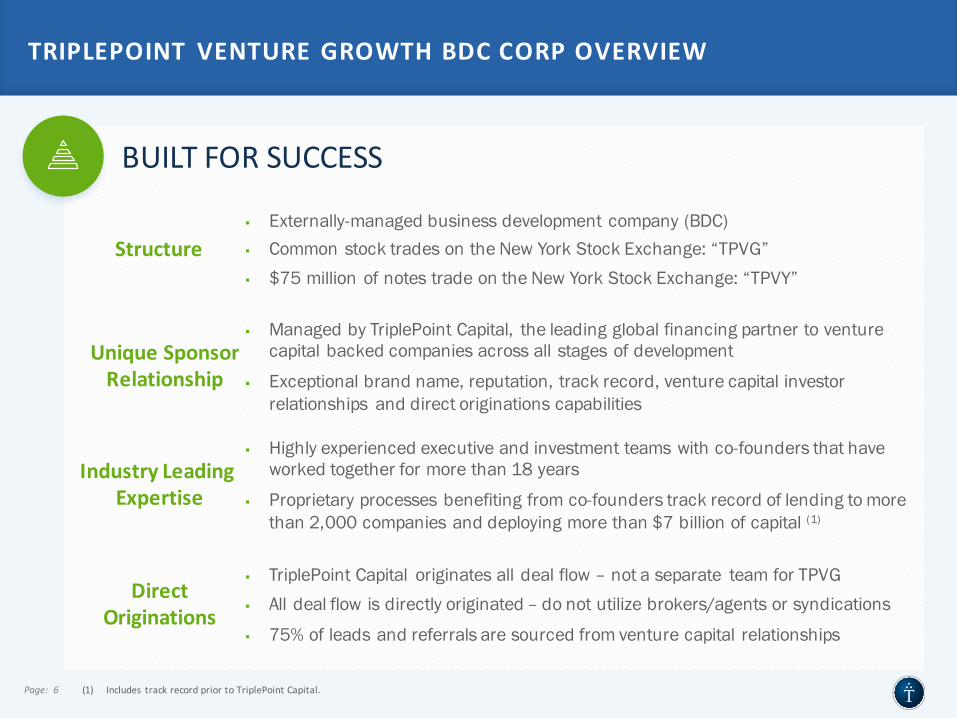
BUILTFORSUCCESS
TRIPLEPOINT VENTUREGROWTHBDCCORPOVERVIEW
§ Highly experienced executive and investment teams with co-founders that have worked together for more than 18 years
§ Proprietary processes benefiting from co-founders track record of lending to more than 2,000 companies and deploying more than $7 billion of capital (1)
§ TriplePoint Capital originates all deal flow – not a separate team for TPVG§ All deal flow is directly originated – do not utilize brokers/agents or syndications
§ 75% of leads and referrals are sourced from venture capital relationships
§ Managed by TriplePoint Capital, the leading global financing partner to venture capital backed companies across all stages of development
§ Exceptional brand name, reputation, track record, venture capital investor relationships and direct originations capabilities
IndustryLeadingExpertise
DirectOriginations
UniqueSponsorRelationship
§ Externally-managed business development company (BDC)§ Common stock trades on the New York Stock Exchange: “TPVG” § $75 million of notes trade on the New York Stock Exchange: “TPVY”
Structure
Page: 6 (1) Includes trackrecordpriortoTriplePoint Capital.
ALIGNEDWITHPUBLICSHAREHOLDERS
TRIPLEPOINT VENTUREGROWTHBDCCORPOVERVIEW
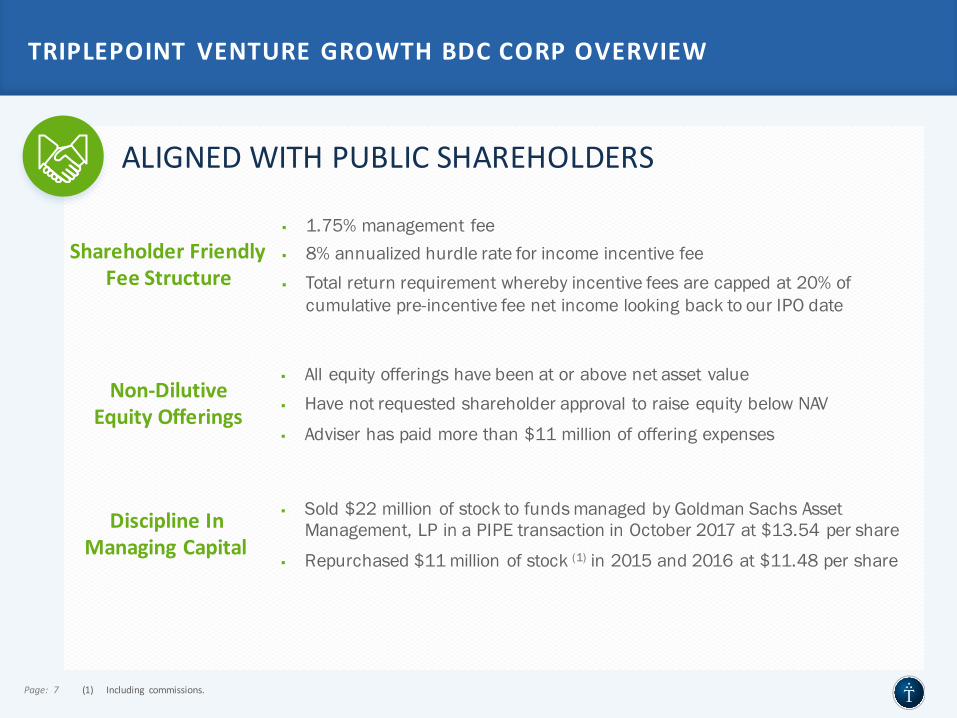
§ Sold $22 million of stock to funds managed by Goldman Sachs Asset Management, LP in a PIPE transaction in October 2017 at $13.54 per share
§ Repurchased $11 million of stock (1) in 2015 and 2016 at $11.48 per share
§ All equity offerings have been at or above net asset value§ Have not requested shareholder approval to raise equity below NAV
§ Adviser has paid more than $11 million of offering expenses
DisciplineInManagingCapital
Non-DilutiveEquityOfferings
§ 1.75% management fee§ 8% annualized hurdle rate for income incentive fee§ Total return requirement whereby incentive fees are capped at 20% of
cumulative pre-incentive fee net income looking back to our IPO date
ShareholderFriendlyFeeStructure
Page: 7 (1) Including commissions.
DELIVERINGRESULTS
Page: 8
TRIPLEPOINT VENTUREGROWTHBDCCORPOVERVIEW
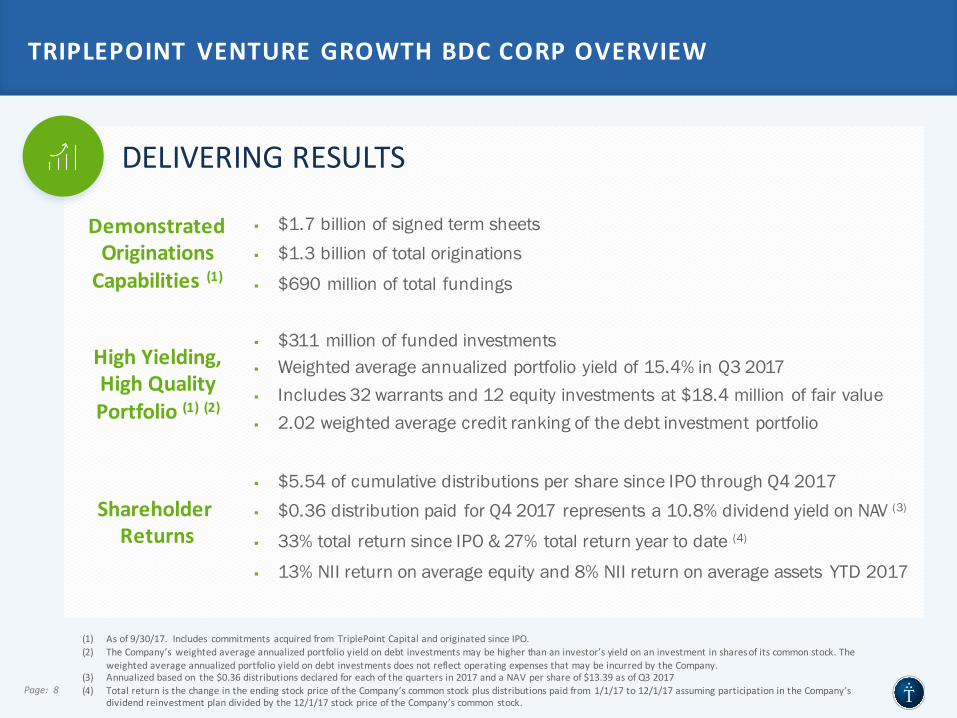
§ $5.54 of cumulative distributions per share since IPO through Q4 2017§ $0.36 distribution paid for Q4 2017 represents a 10.8% dividend yield on NAV (3)
§ 33% total return since IPO & 27% total return year to date (4)
§ 13% NII return on average equity and 8% NII return on average assets YTD 2017
§ $311 million of funded investments § Weighted average annualized portfolio yield of 15.4% in Q3 2017§ Includes 32 warrants and 12 equity investments at $18.4 million of fair value§ 2.02 weighted average credit ranking of the debt investment portfolio
ShareholderReturns
HighYielding,HighQualityPortfolio(1) (2)
§ $1.7 billion of signed term sheets§ $1.3 billion of total originations
§ $690 million of total fundings
DemonstratedOriginationsCapabilities(1)
(1) Asof9/30/17.Includes commitments acquiredfrom TriplePoint CapitalandoriginatedsinceIPO.(2) TheCompany’sweightedaverageannualizedportfolioyieldondebtinvestmentsmaybehigherthananinvestor’syieldonaninvestmentinsharesofitscommonstock.The
weightedaverageannualizedportfolioyieldondebtinvestmentsdoesnotreflectoperatingexpensesthatmaybeincurredbytheCompany.(3) Annualizedbasedon the$0.36distributionsdeclaredforeachofthequartersin2017andaNAVpershareof$13.39asofQ32017(4) TotalreturnisthechangeintheendingstockpriceoftheCompany’scommonstockplusdistributionspaidfrom 1/1/17to12/1/17assumingparticipationintheCompany’s
dividendreinvestmentplandividedbythe12/1/17stockpriceoftheCompany’scommon stock.
RECENTDEVELOPMENTS
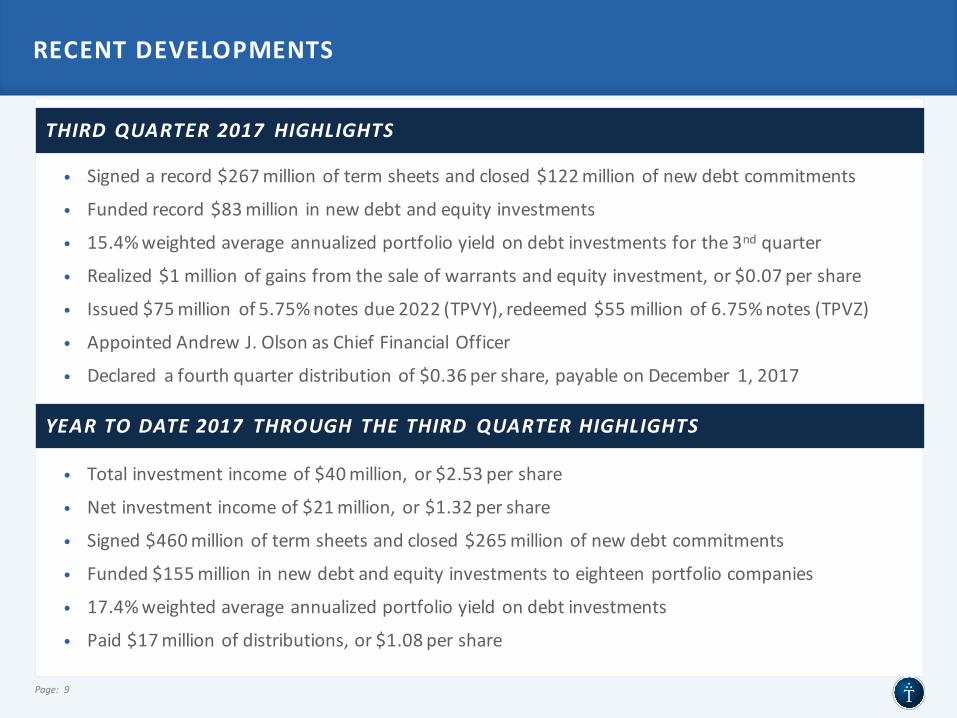
• Signedarecord$267millionoftermsheetsandclosed$122millionofnewdebtcommitments
• Fundedrecord$83million innewdebtandequityinvestments
• 15.4%weightedaverageannualizedportfolioyieldondebtinvestmentsforthe3nd quarter
• Realized$1millionofgainsfromthesaleofwarrantsandequityinvestment,or$0.07pershare
• Issued$75million of5.75%notesdue2022(TPVY),redeemed$55millionof6.75%notes(TPVZ)
• AppointedAndrewJ.OlsonasChiefFinancialOfficer
• Declared afourthquarterdistributionof$0.36pershare,payableonDecember 1,2017
• Totalinvestmentincomeof$40million,or$2.53pershare
• Netinvestmentincomeof$21million,or$1.32pershare
• Signed$460millionoftermsheetsandclosed$265millionofnewdebtcommitments
• Funded$155million innewdebtandequityinvestmentstoeighteenportfoliocompanies
• 17.4%weightedaverageannualizedportfolioyieldondebtinvestments
• Paid$17millionofdistributions,or$1.08pershare
Page: 9
THIRDQUARTER2017 HIGHLIGHTS
YEARTODATE2017 THROUGH THETHIRD QUARTERHIGHLIGHTS
RECENTDEVELOPMENTS
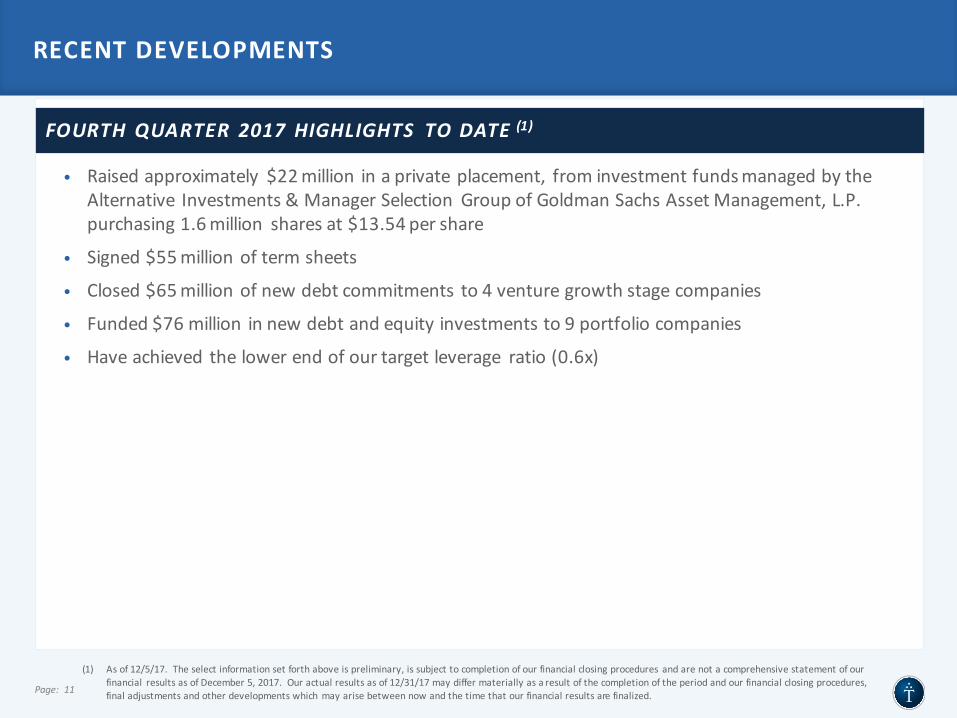
STODATE• Raisedapproximately $22million inaprivateplacement, frominvestmentfundsmanagedbythe
Alternative Investments&ManagerSelection GroupofGoldmanSachsAssetManagement,L.P.purchasing1.6million sharesat$13.54pershare
• Signed$55millionoftermsheets
• Closed$65millionofnewdebtcommitments to4venturegrowthstagecompanies
• Funded$76million innewdebtandequityinvestmentsto9portfoliocompanies
• Haveachieved thelowerendofourtargetleverage ratio(0.6x)
Page: 11
FOURTHQUARTER 2017HIGHLIGHTS TODATE(1)
(1) Asof12/5/17.Theselectinformationsetforthaboveispreliminary,issubjecttocompletionofourfinancialclosingprocedures andarenotacomprehensivestatementofourfinancial resultsasofDecember5,2017.Ouractualresultsasof12/31/17maydiffermateriallyasaresultofthecompletion oftheperiodandourfinancialclosingprocedures,finaladjustmentsandotherdevelopmentswhichmayarisebetweennowandthetimethatourfinancialresultsarefinalized.

TPVGBUSINESSHIGHLIGHTS
TRUSTEDPARTNERTOINDUSTRY LEADINGVENTUREBACKEDCOMPANIES
Page: 13(1) SelectedlistofcurrentandpastTPVGportfoliocompanies.
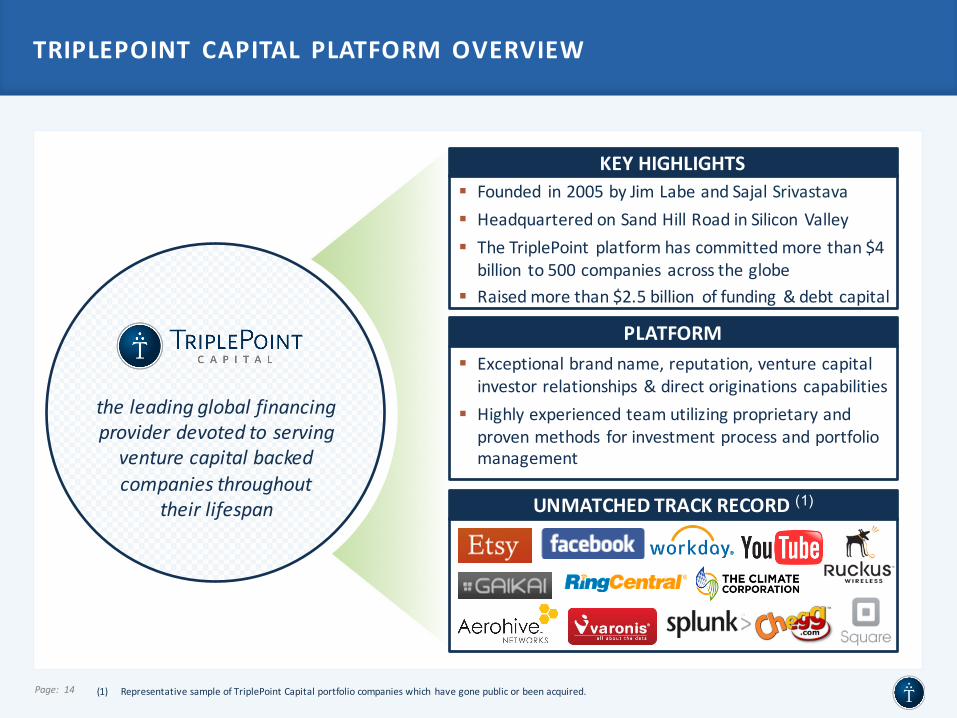
TRIPLEPOINT CAPITAL PLATFORM OVERVIEW
Page: 14
theleadingglobalfinancingproviderdevoted toservingventurecapitalbackedcompaniesthroughout
theirlifespan
(1) RepresentativesampleofTriplePoint Capitalportfoliocompanieswhich havegonepublicorbeenacquired.
KEYHIGHLIGHTS§ Founded in2005byJim LabeandSajalSrivastava§ HeadquarteredonSandHillRoadinSiliconValley§ TheTriplePoint platformhascommittedmorethan$4billion to500companies acrosstheglobe
§ Raisedmorethan$2.5billion offunding& debtcapital
PLATFORM§ Exceptionalbrandname,reputation,venturecapitalinvestorrelationships&directoriginations capabilities
§ Highlyexperiencedteamutilizingproprietaryandprovenmethods forinvestmentprocessandportfoliomanagement
UNMATCHEDTRACKRECORD(1)
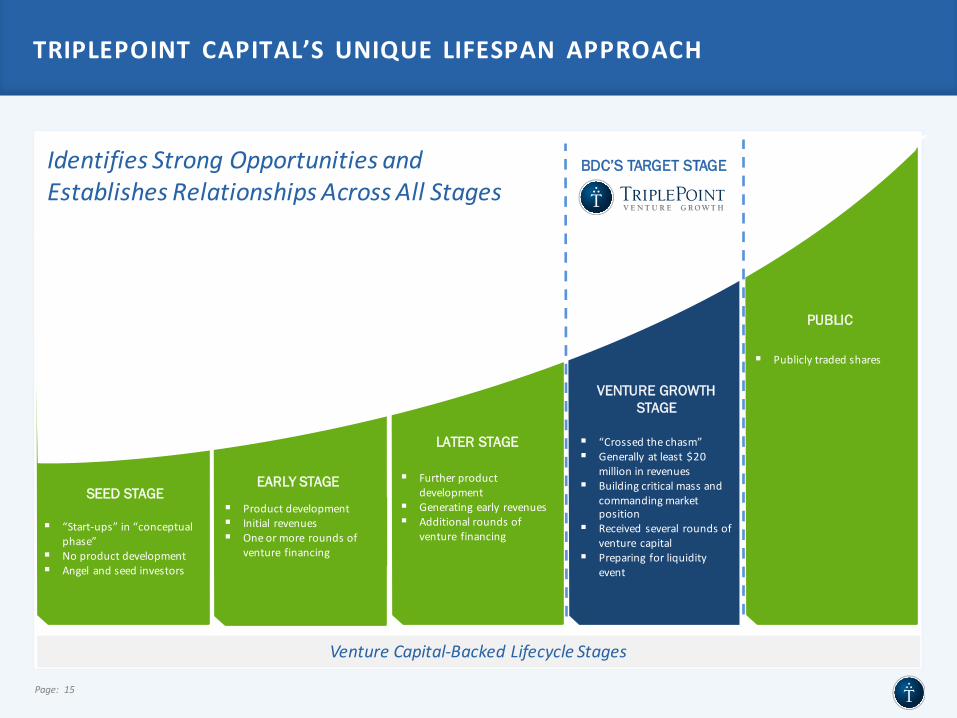
TRIPLEPOINT CAPITAL’S UNIQUE LIFESPAN APPROACH
Page: 15
SEED STAGEEARLY STAGE
LATER STAGE
VENTURE GROWTHSTAGE
PUBLIC
§ “Start-ups”in“conceptualphase”
§ Noproductdevelopment§ Angelandseedinvestors
§ Productdevelopment§ Initial revenues§ Oneormore roundsof
venture financing
§ Furtherproductdevelopment
§ Generatingearly revenues§ Additionalroundsof
venture financing
§ “Crossedthechasm”§ Generallyatleast$20
millioninrevenues§ Buildingcriticalmassand
commandingmarketposition
§ Receivedseveral roundsofventurecapital
§ Preparing forliquidityevent
§ Publiclytradedshares
VentureCapital-BackedLifecycleStages
IdentifiesStrongOpportunitiesandEstablishesRelationshipsAcrossAllStages
BDC’S TARGET STAGE
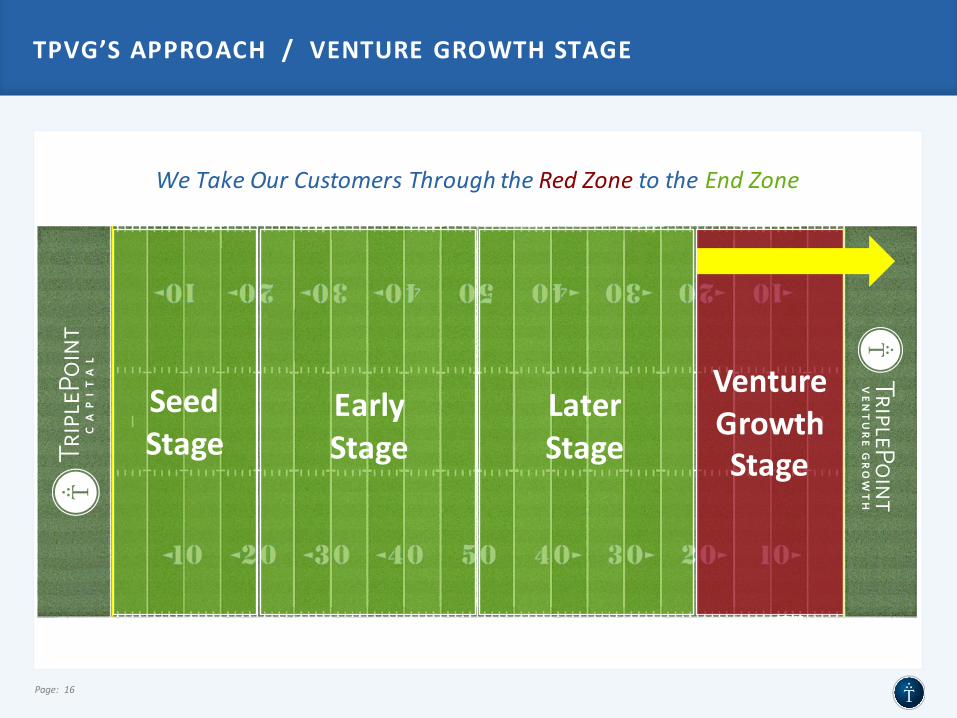
WeTakeOurCustomersThroughtheRedZonetotheEndZone
TPVG’SAPPROACH/VENTUREGROWTHSTAGE
Page: 16
VentureGrowthStage
SeedStage
EarlyStage
LaterStage
COMPELLING RELATIVE RISK-ADJUSTED RETURNS
Page: 17
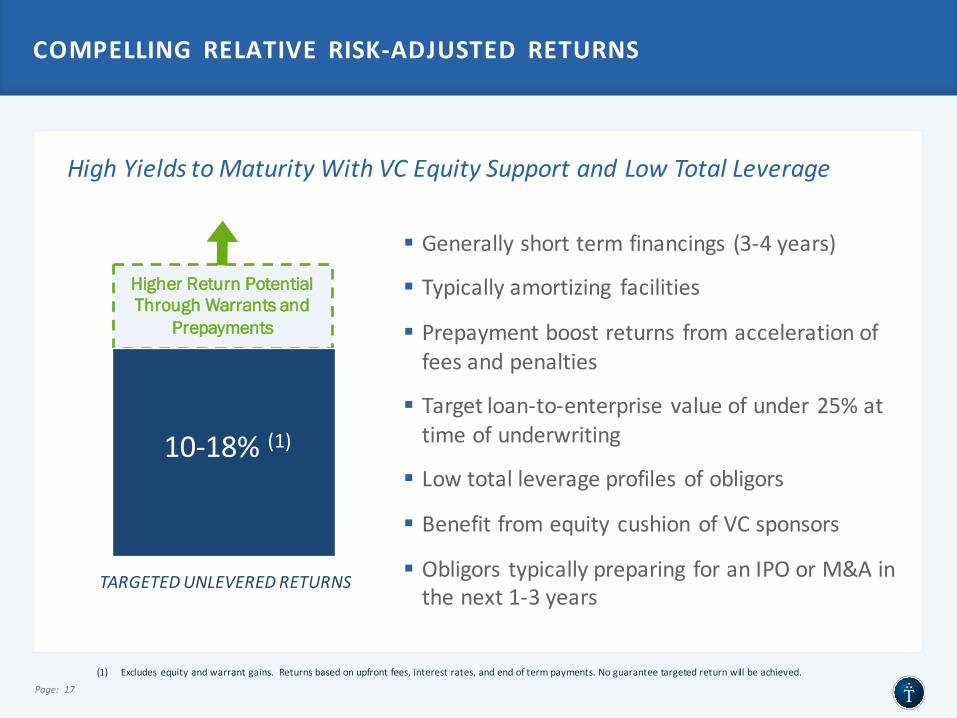
(1) Excludes equityandwarrantgains.Returnsbasedonupfrontfees,interestrates,andendoftermpayments.Noguaranteetargetedreturnwillbeachieved.
§ Generallyshorttermfinancings (3-4years)
§ Typicallyamortizing facilities
§ Prepaymentboostreturns fromaccelerationoffeesandpenalties
§ Targetloan-to-enterprisevalueofunder25%attimeofunderwriting
§ Lowtotalleverageprofilesofobligors
§ BenefitfromequitycushionofVCsponsors
§ Obligors typicallypreparing foranIPOorM&Ainthenext1-3years
HighYieldstoMaturityWithVCEquitySupportandLowTotalLeverage
10-18%(1)
Higher Return Potential Through Warrants and
Prepayments
TARGETEDUNLEVEREDRETURNS
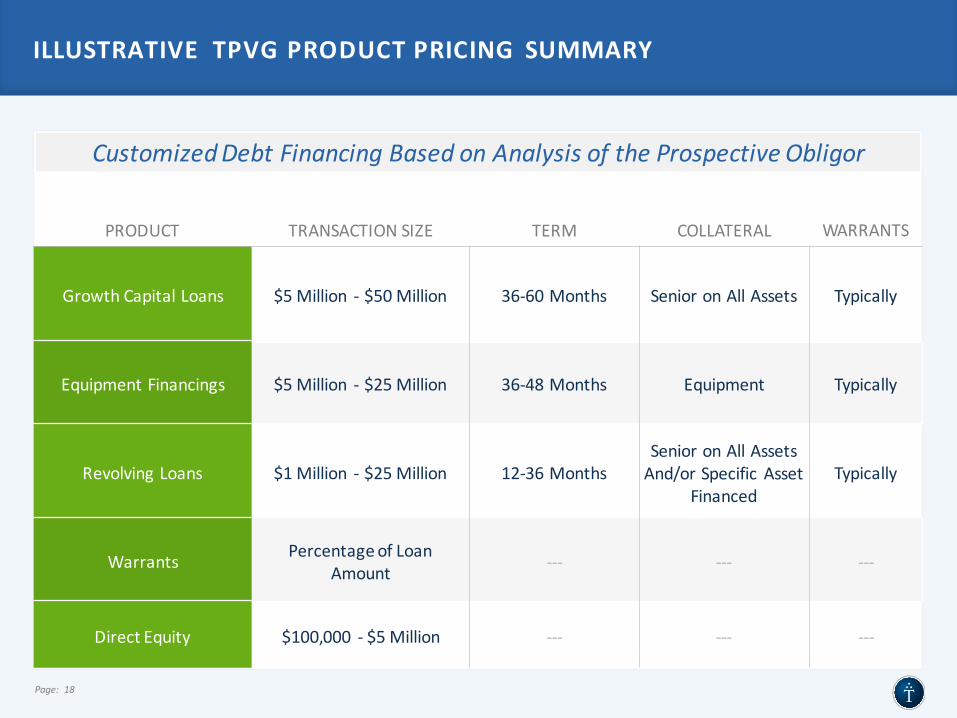
PRODUCT TRANSACTIONSIZE TERM COLLATERAL WARRANTS
GrowthCapitalLoans $5Million - $50Million 36-60Months SenioronAllAssets Typically
EquipmentFinancings $5Million - $25Million 36-48Months Equipment Typically
RevolvingLoans $1Million - $25Million 12-36MonthsSenioronAllAssetsAnd/orSpecific Asset
FinancedTypically
Warrants PercentageofLoanAmount --- --- ---
DirectEquity $100,000 - $5Million --- --- ---
CustomizedDebtFinancingBasedonAnalysisoftheProspectiveObligor
ILLUSTRATIVE TPVGPRODUCTPRICING SUMMARY
Page: 18
TIME-TESTED INVESTMENT PROCESS&PORTFOLIOMANAGEMENT
Page: 19
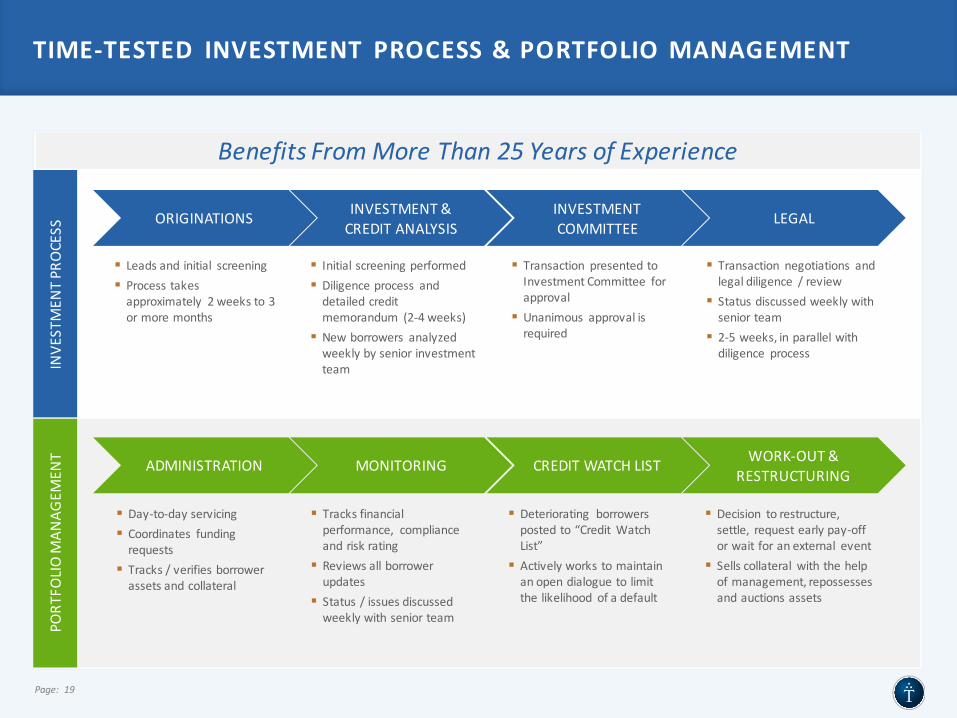
§ Leadsandinitial screening§ Processtakesapproximately 2weeksto3ormoremonths
§ Initialscreeningperformed§ Diligenceprocess anddetailedcreditmemorandum (2-4weeks)
§ Newborrowers analyzedweeklybyseniorinvestmentteam
§ Transaction presentedtoInvestmentCommittee forapproval
§ Unanimous approvalisrequired
§ Transaction negotiations andlegaldiligence /review
§ Statusdiscussedweeklywithseniorteam
§ 2-5weeks,inparallelwithdiligence process
§ Day-to-dayservicing§ Coordinates fundingrequests
§ Tracks/verifiesborrowerassetsandcollateral
§ Tracksfinancialperformance, complianceandriskrating
§ Reviewsallborrowerupdates
§ Status/issuesdiscussedweeklywithseniorteam
§ Deteriorating borrowerspostedto“CreditWatchList”
§ Activelyworkstomaintainanopendialoguetolimitthelikelihood ofadefault
§ Decision torestructure,settle, requestearlypay-offorwaitforanexternal event
§ Sellscollateral withthehelpofmanagement,repossessesandauctionsassets
INVE
STMEN
TPR
OCESS
PORT
FOLIOMAN
AGEM
ENT
BenefitsFromMoreThan25YearsofExperience
ADMINISTRATION MONITORING CREDITWATCHLIST WORK-OUT&RESTRUCTURING
ORIGINATIONS INVESTMENT&CREDITANALYSIS
INVESTMENTCOMMITTEE
LEGAL

TPVGPORTFOLIOHIGHLIGHTS
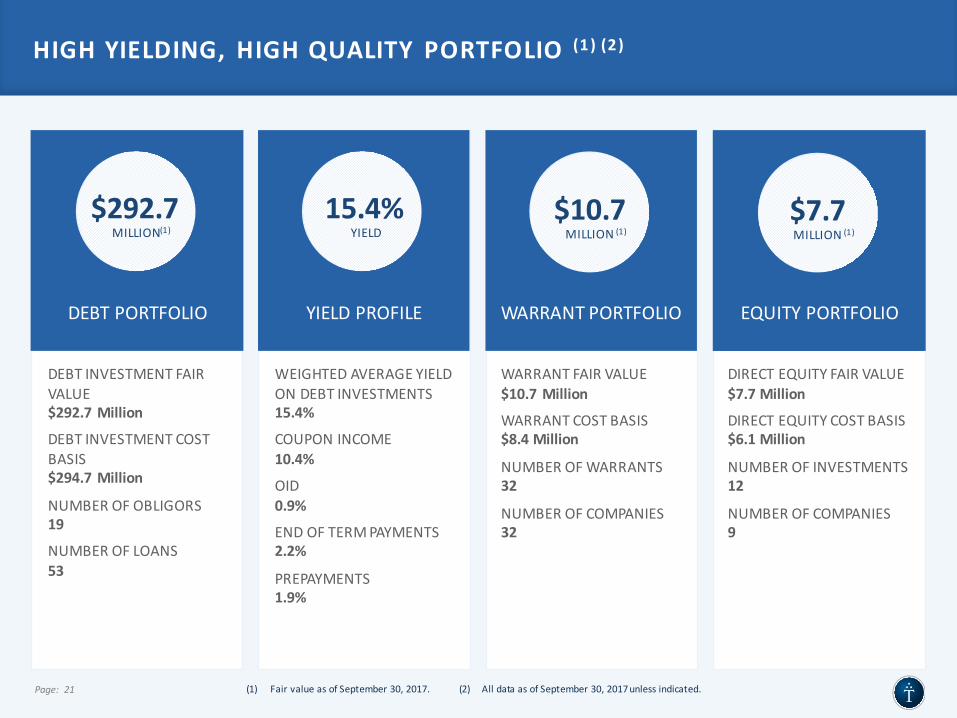
HIGHYIELDING, HIGHQUALITY PORTFOLIO (1)(2 )
Page: 21
DEBTINVESTMENTFAIRVALUE$292.7Million
DEBTINVESTMENTCOSTBASIS$294.7 Million
NUMBEROFOBLIGORS19
NUMBEROFLOANS53
(1) FairvalueasofSeptember30,2017.(2)AlldataasofSeptember30,2017unlessindicated.
DEBTPORTFOLIO
$292.7MILLION(1)
WEIGHTEDAVERAGEYIELDONDEBTINVESTMENTS15.4%
COUPONINCOME10.4%
OID0.9%
ENDOFTERMPAYMENTS2.2%
PREPAYMENTS1.9%
YIELDPROFILE
15.4%YIELD
$158.2MILLION(2)
WARRANTPORTFOLIO
$10.7MILLION(1)
$158.2MILLION(2)
EQUITYPORTFOLIO
$7.7MILLION(1)
WARRANTFAIRVALUE$10.7Million
WARRANTCOSTBASIS$8.4Million
NUMBEROFWARRANTS32
NUMBEROFCOMPANIES32
DIRECTEQUITYFAIRVALUE$7.7Million
DIRECTEQUITYCOSTBASIS$6.1Million
NUMBEROFINVESTMENTS12
NUMBEROFCOMPANIES9
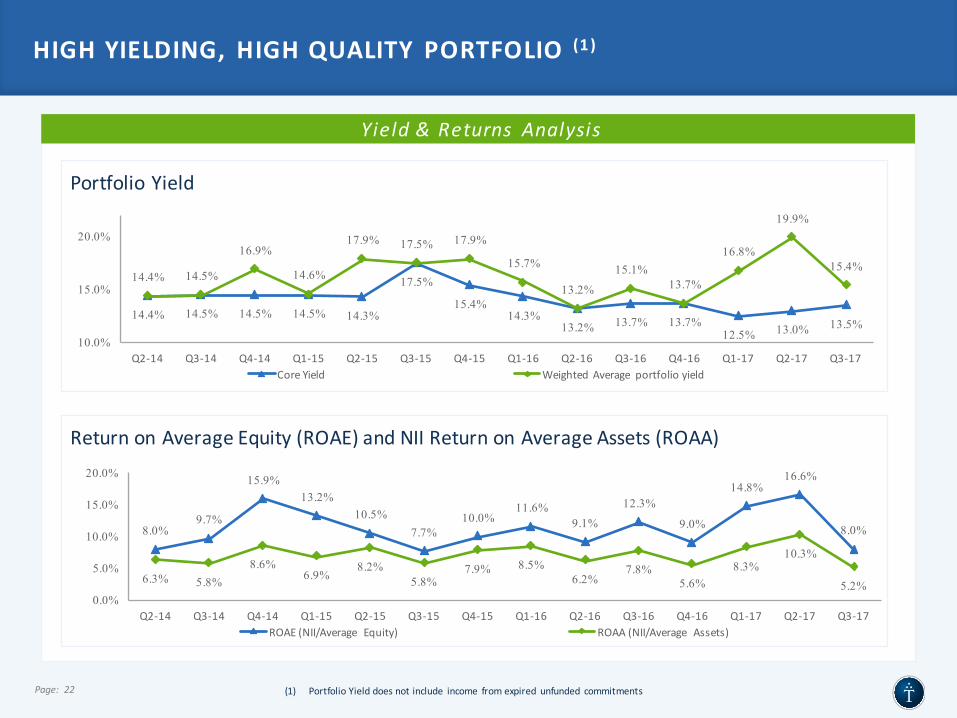
Yield&Returns Analysis
PortfolioYield
14.4% 14.5% 14.5% 14.5% 14.3%
17.5%
15.4%14.3%
13.2% 13.7% 13.7%12.5% 13.0% 13.5%
14.4% 14.5%
16.9%
14.6%
17.9% 17.5% 17.9%
15.7%
13.2%
15.1%13.7%
16.8%
19.9%
15.4%
10.0%
15.0%
20.0%
Q2-14 Q3-14 Q4-14 Q1-15 Q2-15 Q3-15 Q4-15 Q1-16 Q2-16 Q3-16 Q4-16 Q1-17 Q2-17 Q3-17CoreYield WeightedAverage portfolioyield
ReturnonAverageEquity(ROAE)andNIIReturnonAverageAssets(ROAA)
Page: 22
8.0%9.7%
15.9%13.2%
10.5%7.7%
10.0%11.6%
9.1%
12.3%
9.0%
14.8%16.6%
8.0%
6.3% 5.8%8.6%
6.9%8.2%
5.8%7.9% 8.5%
6.2%7.8%
5.6%8.3%
10.3%
5.2%0.0%
5.0%
10.0%
15.0%
20.0%
Q2-14 Q3-14 Q4-14 Q1-15 Q2-15 Q3-15 Q4-15 Q1-16 Q2-16 Q3-16 Q4-16 Q1-17 Q2-17 Q3-17ROAE(NII/Average Equity) ROAA(NII/Average Assets)
HIGHYIELDING, HIGHQUALITY PORTFOLIO (1)
(1) PortfolioYielddoesnotinclude income fromexpired unfunded commitments
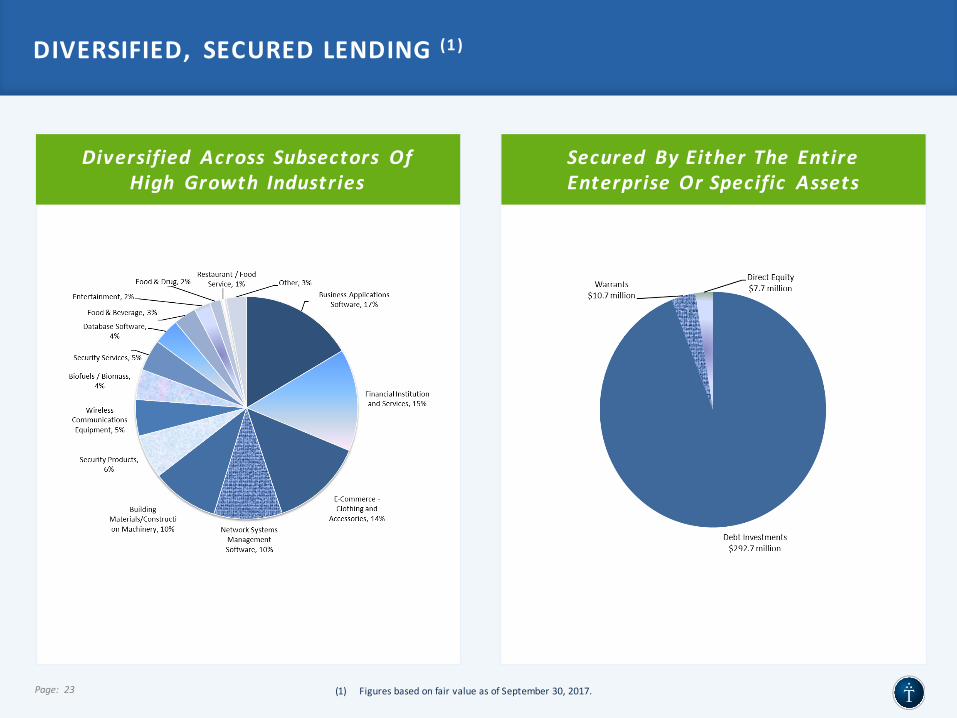
DIVERSIFIED, SECUREDLENDING (1)
Page: 23 (1) FiguresbasedonfairvalueasofSeptember30,2017.
Diversified Across Subsectors OfHigh Growth Industries
Secured ByEitherThe EntireEnterprise OrSpecific Assets
Strictly Confidential
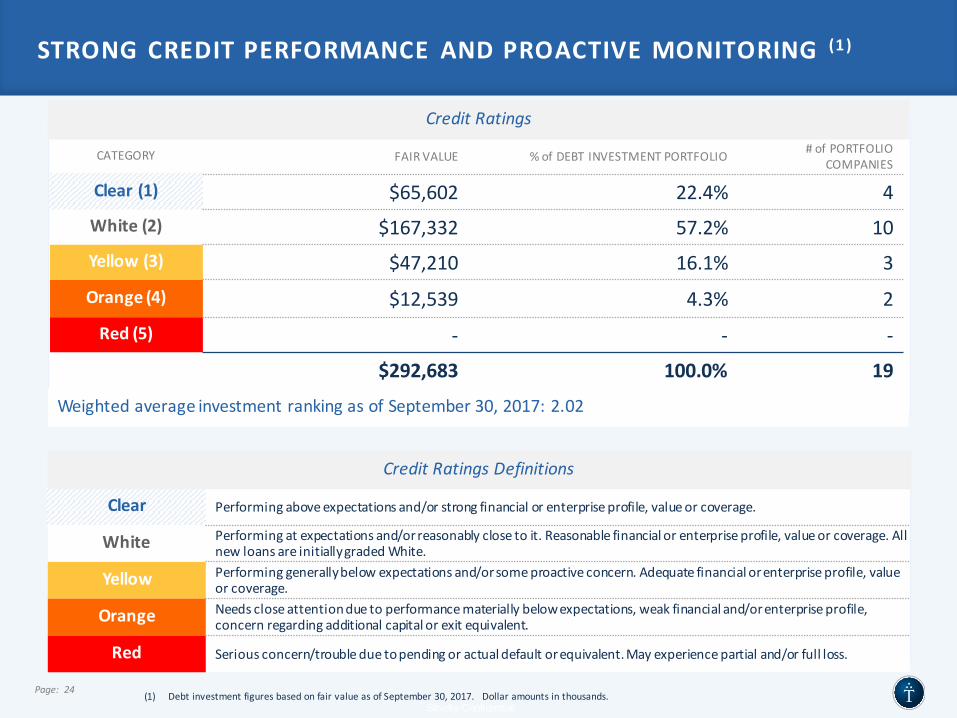
STRONGCREDITPERFORMANCE ANDPROACTIVEMONITORING (1)
Page: 24 (1) DebtinvestmentfiguresbasedonfairvalueasofSeptember30,2017.Dollaramountsinthousands.
Clear Performingaboveexpectationsand/orstrongfinancialorenterpriseprofile,valueorcoverage.
White Performingatexpectationsand/orreasonablyclosetoit.Reasonablefinancialorenterpriseprofile,valueorcoverage.AllnewloansareinitiallygradedWhite.
Yellow Performinggenerallybelowexpectationsand/orsomeproactiveconcern.Adequatefinancialorenterpriseprofile,valueorcoverage.
Orange Needscloseattentionduetoperformancemateriallybelowexpectations,weakfinancialand/orenterpriseprofile,concernregardingadditionalcapitalorexitequivalent.
Red Seriousconcern/troubleduetopendingoractualdefaultorequivalent.Mayexperiencepartialand/orfullloss.
CreditRatingsDefinitions
CATEGORY FAIRVALUE % ofDEBTINVESTMENTPORTFOLIO #ofPORTFOLIOCOMPANIES
Clear(1) $65,602 22.4% 4White(2) $167,332 57.2% 10Yellow(3) $47,210 16.1% 3Orange(4) $12,539 4.3% 2Red(5) - - -
$292,683 100.0% 19
WeightedaverageinvestmentrankingasofSeptember30,2017:2.02
CreditRatings

TPVGFINANCIALHIGHLIGHTS
Page: 26
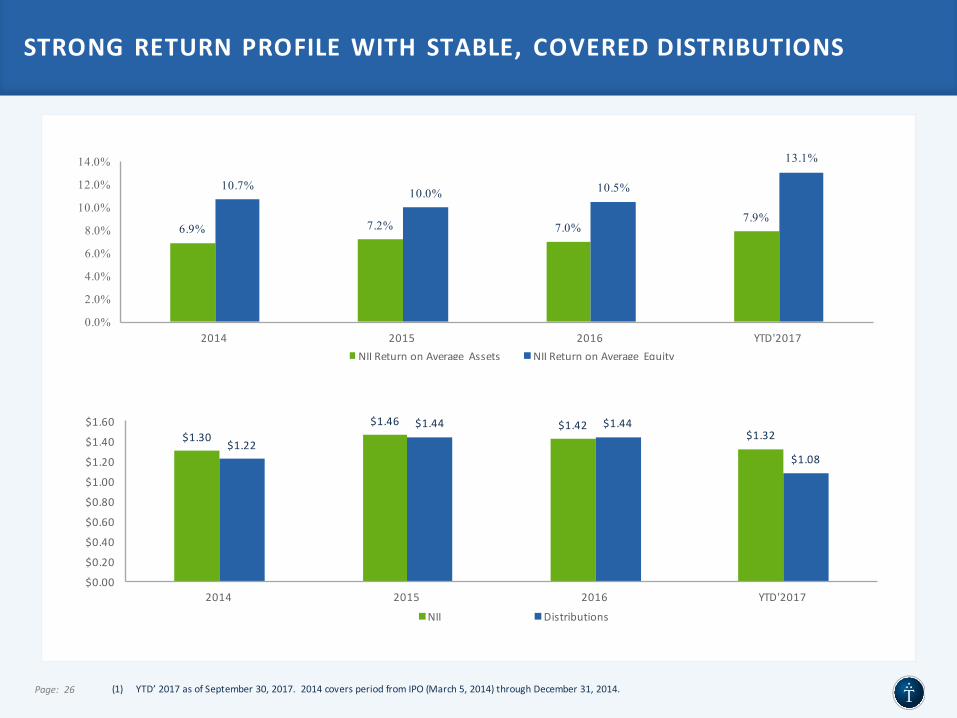
STRONGRETURNPROFILEWITHSTABLE, COVEREDDISTRIBUTIONS
(1) YTD’2017asofSeptember30,2017.2014coversperiodfromIPO(March5,2014)throughDecember31,2014.
6.9% 7.2% 7.0%7.9%
10.7%10.0% 10.5%
13.1%
0.0%
2.0%
4.0%
6.0%
8.0%
10.0%
12.0%
14.0%
2014 2015 2016 YTD'2017NIIReturnonAverage Assets NIIReturnonAverage Equity
(1)
$1.30$1.46 $1.42
$1.32$1.22
$1.44 $1.44
$1.08
$0.00
$0.20
$0.40
$0.60
$0.80
$1.00
$1.20
$1.40
$1.60
2014 2015 2016 YTD'2017
NII Distributions
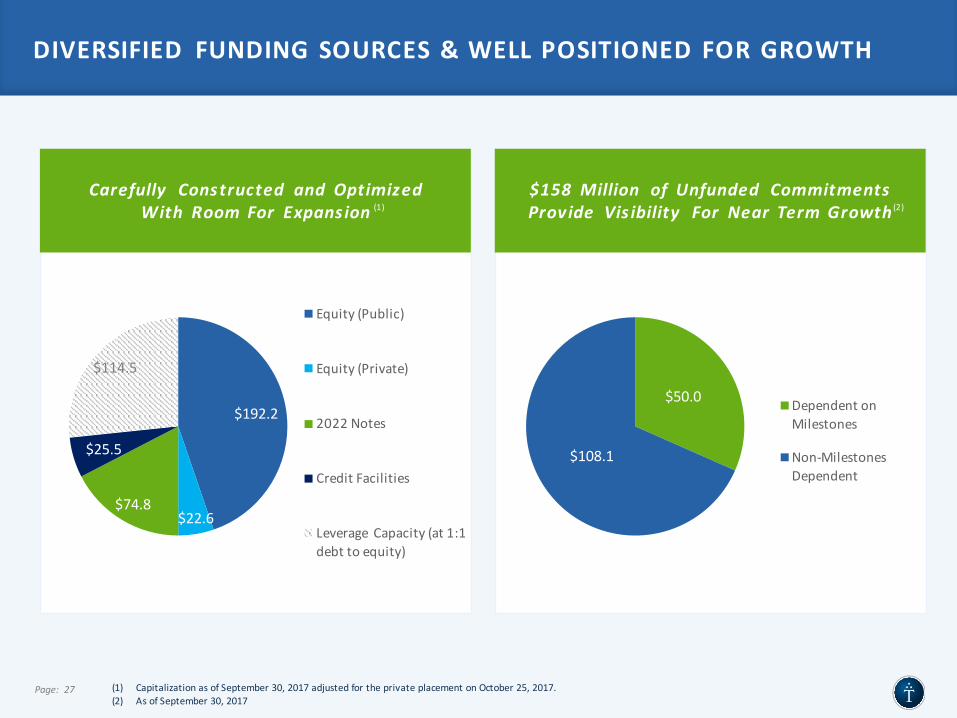
DIVERSIFIED FUNDINGSOURCES&WELLPOSITIONEDFORGROWTH
Page: 27 (1) CapitalizationasofSeptember30,2017adjustedfortheprivateplacementonOctober25,2017.(2) AsofSeptember30,2017
$192.2
$22.6$74.8
$25.5
$114.5
Equity(Public)
Equity(Private)
2022Notes
CreditFacilities
Leverage Capacity(at1:1debttoequity)
$158 Million of Unfunded Commitments Provide Vis ibility For Near TermGrowth
Carefully Constructed and OptimizedWith RoomFor Expans ion (1)
$50.0
$108.1
DependentonMilestones
Non-MilestonesDependent
(2)
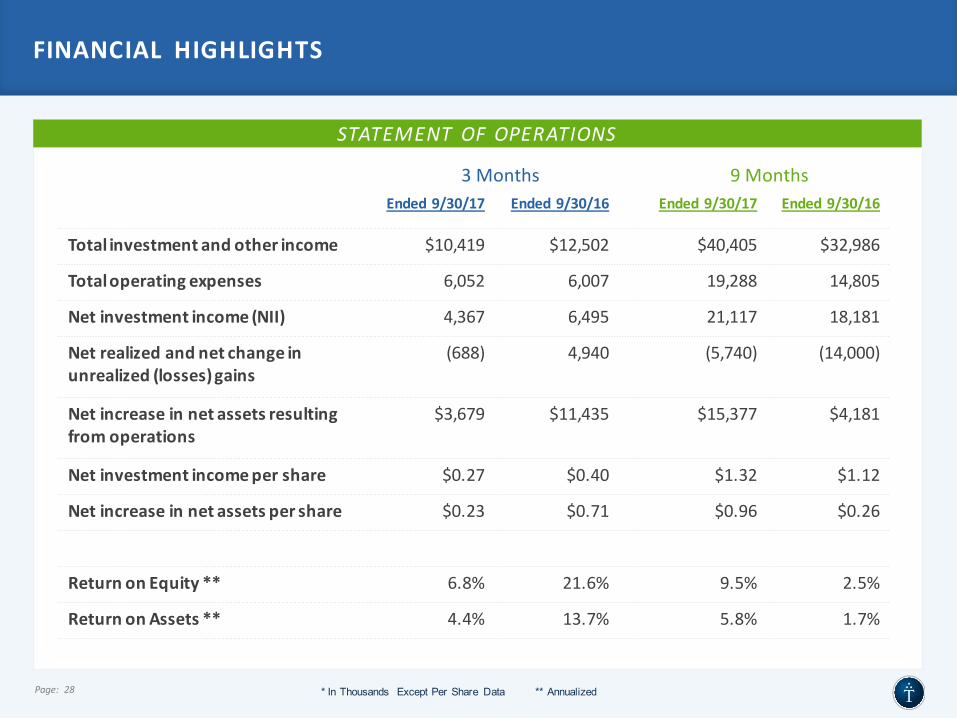
FINANCIAL HIGHLIGHTS
Page: 28
Ended9/30/17 Ended 9/30/16 Ended 9/30/17 Ended 9/30/16
Totalinvestmentand otherincome $10,419 $12,502 $40,405 $32,986
Totaloperatingexpenses 6,052 6,007 19,288 14,805
Netinvestmentincome(NII) 4,367 6,495 21,117 18,181
Netrealizedandnetchange inunrealized(losses)gains
(688) 4,940 (5,740) (14,000)
Netincreaseinnetassetsresultingfromoperations
$3,679 $11,435 $15,377 $4,181
Netinvestmentincomepershare $0.27 $0.40 $1.32 $1.12
Netincreaseinnetassetspershare $0.23 $0.71 $0.96 $0.26
ReturnonEquity** 6.8% 21.6% 9.5% 2.5%
ReturnonAssets** 4.4% 13.7% 5.8% 1.7%
* In Thousands Except Per Share Data ** Annualized
STATEMENTOFOPERATIONS
3Months 9Months
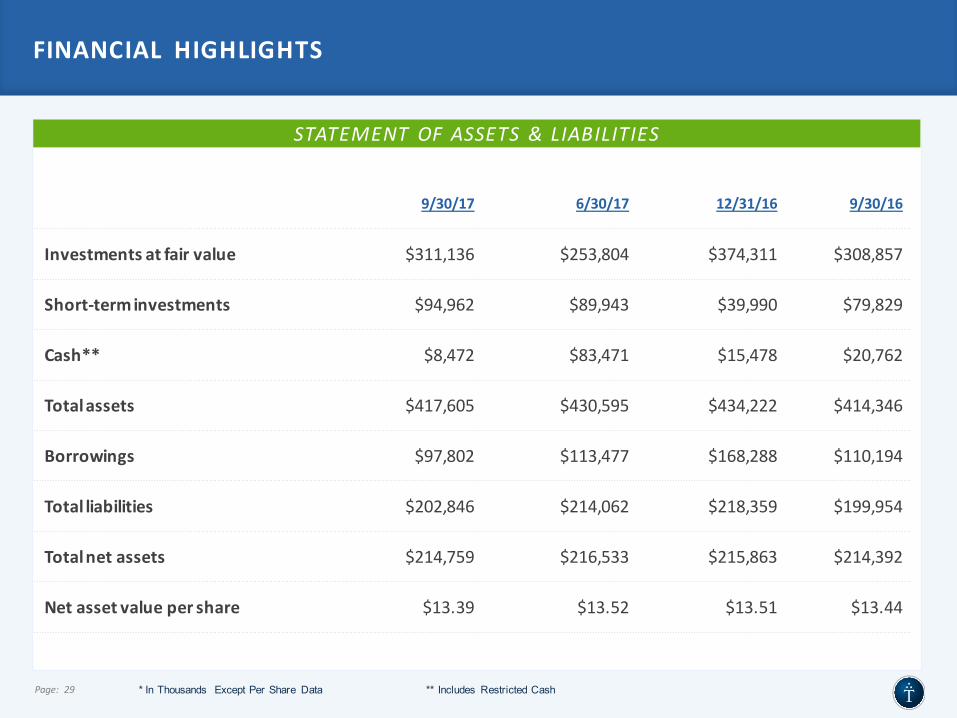
FINANCIAL HIGHLIGHTS
Page: 29 * In Thousands Except Per Share Data ** Includes Restricted Cash
9/30/17 6/30/17 12/31/16 9/30/16
Investmentsatfairvalue $311,136 $253,804 $374,311 $308,857
Short-terminvestments $94,962 $89,943 $39,990 $79,829
Cash** $8,472 $83,471 $15,478 $20,762
Totalassets $417,605 $430,595 $434,222 $414,346
Borrowings $97,802 $113,477 $168,288 $110,194
Totalliabilities $202,846 $214,062 $218,359 $199,954
Totalnetassets $214,759 $216,533 $215,863 $214,392
Netassetvaluepershare $13.39 $13.52 $13.51 $13.44
STATEMENTOF ASSETS&LIABILITIES
Page: 30
HIGHLYDIFFERENTIATED
BUILTFORSUCCESS
ALIGNEDWITHPUBLICSHAREHOLDERS
DELIVERINGRESULTS
- The 4 R’s -
Relationships
Reputation
References
Returns
TRIPLEPOINT VENTUREGROWTHBDCCORP
Strictly Confidential
RESEARCHCOVERAGE
Page: 31
MitchelPenn(410)583-5976
JonathanBock(704)410-1874
CaseyAlexander(646)452-7083

APPENDIX
FINANCIAL HIGHLIGHTS
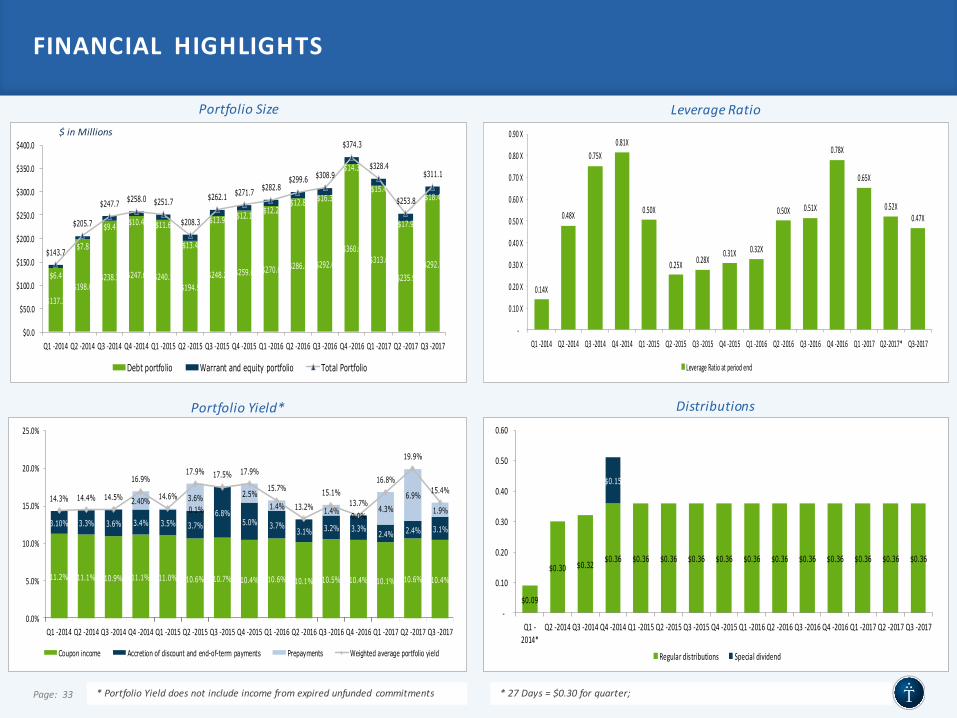
PortfolioSize LeverageRatio
PortfolioYield* Distributions
*27Days=$0.30forquarter;*PortfolioYielddoesnotincludeincomefromexpiredunfunded commitments
$137.3$198.0
$238.3 $247.6 $240.1 $194.9
$248.2 $259.6 $270.6 $286.8 $292.6
$360.0 $313.0
$235.9 $292.7
$6.4
$7.8
$9.4 $10.4 $11.6
$13.4
$13.9 $12.1 $12.2 $12.8 $16.3
$14.3
$15.4
$17.9
$18.4
$143.7
$205.7
$247.7 $258.0 $251.7
$208.3
$262.1 $271.7 $282.8 $299.6 $308.9
$374.3
$328.4
$253.8
$311.1
$0.0
$50.0
$100.0
$150.0
$200.0
$250.0
$300.0
$350.0
$400.0
Q1-2014 Q2-2014 Q3-2014 Q4-2014 Q1-2015 Q2-2015 Q3-2015 Q4-2015 Q1-2016 Q2-2016 Q3-2016 Q4-2016 Q1-2017 Q2-2017 Q3-2017
Debt portfolio Warrant and equity portfolio Total Portfolio
0.14X
0.48X
0.75X0.81X
0.50X
0.25X 0.28X0.31X 0.32X
0.50X 0.51X
0.78X
0.65X
0.52X0.47X
-
0.10X
0.20X
0.30X
0.40X
0.50X
0.60X
0.70X
0.80X
0.90X
Q1-2014 Q2-2014 Q3-2014 Q4-2014 Q1-2015 Q2-2015 Q3-2015 Q4-2015 Q1-2016 Q2-2016 Q3-2016 Q4-2016 Q1-2017 Q2-2017* Q3-2017
LeverageRatioatperiodend
$0.09
$0.30 $0.32$0.36 $0.36 $0.36 $0.36 $0.36 $0.36 $0.36 $0.36 $0.36 $0.36 $0.36 $0.36
$0.15
-
0.10
0.20
0.30
0.40
0.50
0.60
Q1-2014*
Q2-2014 Q3-2014 Q4-2014 Q1-2015 Q2-2015 Q3-2015 Q4-2015 Q1-2016 Q2-2016 Q3-2016 Q4-2016 Q1-2017 Q2-2017 Q3-2017
Regulardistributions Specialdividend
11.2% 11.1% 10.9% 11.1% 11.0% 10.6% 10.7% 10.4% 10.6% 10.1% 10.5% 10.4% 10.1% 10.6% 10.4%
3.10% 3.3% 3.6% 3.4% 3.5% 3.7%6.8%
5.0% 3.7%3.1% 3.2% 3.3% 2.4% 2.4% 3.1%
2.40%0.1%3.6% 2.5%
1.4% 1.4% 0.0%4.3%
6.9%
1.9%14.3% 14.4% 14.5%
16.9%
14.6%
17.9% 17.5% 17.9%
15.7%
13.2%
15.1%13.7%
16.8%
19.9%
15.4%
0.0%
5.0%
10.0%
15.0%
20.0%
25.0%
Q1-2014 Q2-2014 Q3-2014 Q4-2014 Q1-2015 Q2-2015 Q3-2015 Q4-2015 Q1-2016 Q2-2016 Q3-2016 Q4-2016 Q1-2017 Q2-2017 Q3-2017
Coupon income Accretion of discount and end-of-term payments Prepayments Weighted average portfolio yield
$inMillions
Page: 33
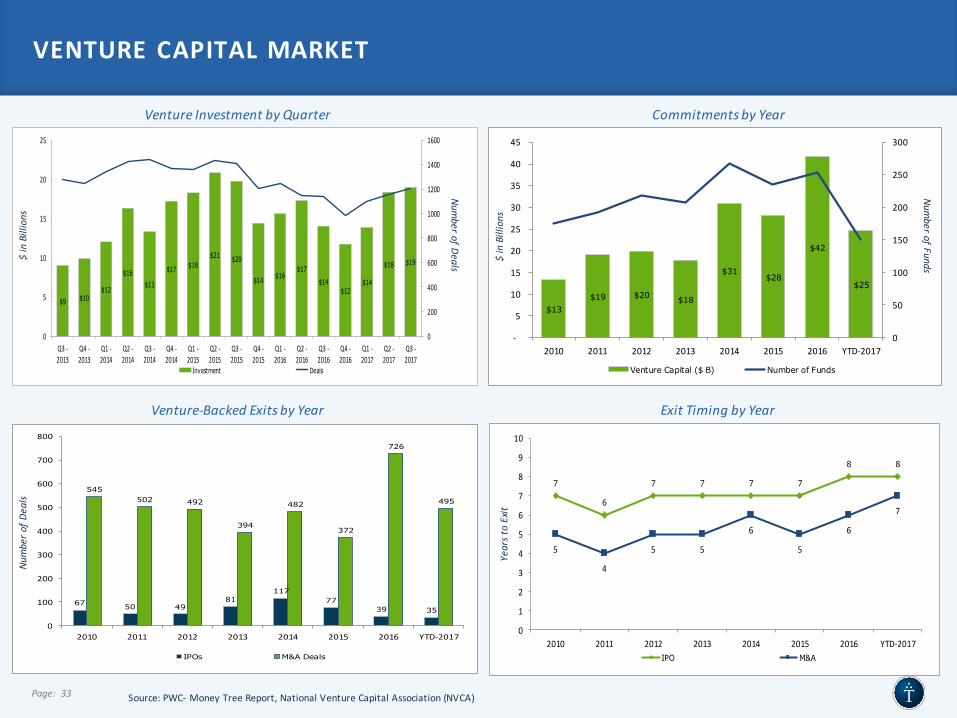
VENTURECAPITALMARKET
Page: 33
VentureInvestmentbyQuarter CommitmentsbyYear
Venture-BackedExitsbyYear ExitTimingbyYear
Source:PWC- MoneyTreeReport,NationalVentureCapitalAssociation(NVCA)
$9 $10$12
$16$13
$17 $18$21 $20
$14 $16$17
$14$12
$14
$18 $19
0
200
400
600
800
1000
1200
1400
1600
0
5
10
15
20
25
Q3-2013
Q4-2013
Q1-2014
Q2-2014
Q3-2014
Q4-2014
Q1-2015
Q2-2015
Q3-2015
Q4-2015
Q1-2016
Q2-2016
Q3-2016
Q4-2016
Q1-2017
Q2-2017
Q3-2017
Investment Deals
$inBillions
NumberofDeals
$13$19 $20 $18
$31$28
$42
$25
0
50
100
150
200
250
300
-
5
10
15
20
25
30
35
40
45
2010 2011 2012 2013 2014 2015 2016 YTD-2017
Venture Capital ($ B) Number of Funds
$inBillions
NumberofFunds
67 50 4981
11777
39 35
545502 492
394
482
372
726
495
0
100
200
300
400
500
600
700
800
2010 2011 2012 2013 2014 2015 2016 YTD-2017
IPOs M&A Deals
Numbero
fDeals
7
6
7 7 7 7
8 8
5
4
5 5
6
5
6
7
0
1
2
3
4
5
6
7
8
9
10
2010 2011 2012 2013 2014 2015 2016 YTD-2017IPO M&A
YearstoExit
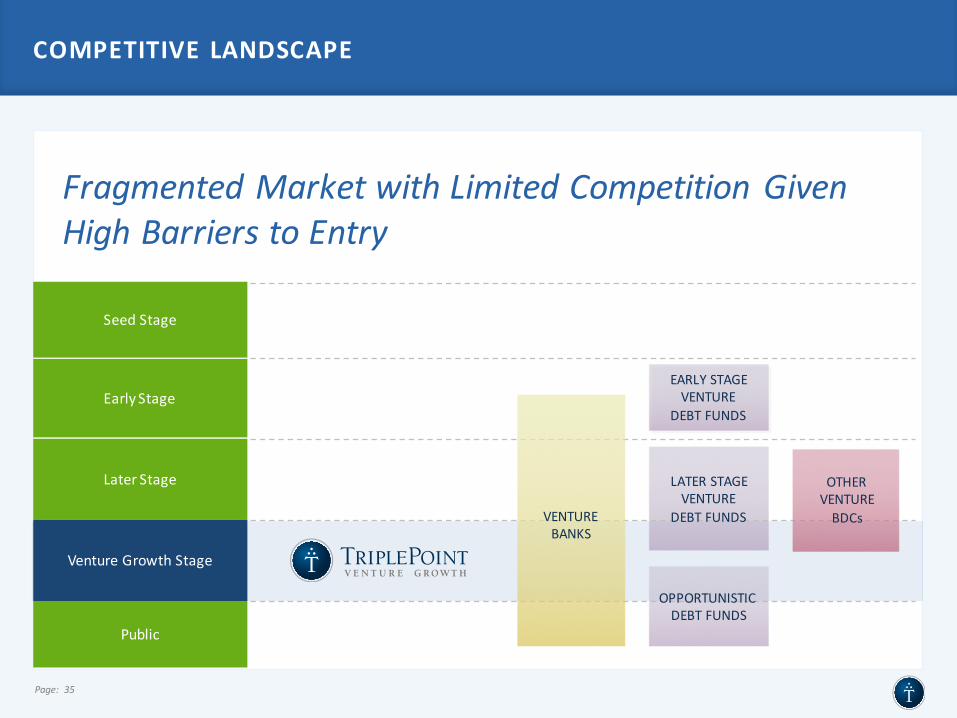
COMPETITIVE LANDSCAPE
FragmentedMarketwithLimitedCompetitionGivenHighBarrierstoEntry
Page: 35
EARLYSTAGEVENTURE
DEBTFUNDS
OTHERVENTUREBDCsVENTURE
BANKS
LATERSTAGEVENTURE
DEBTFUNDS
OPPORTUNISTICDEBTFUNDS
EarlyStage
LaterStage
Public
SeedStage
VentureGrowthStage