Embed Size (px)
Citation preview

2017 sustainability metrics

Health and safety
In 2017, we reduced the Total Recordable Case Rate (TRCR) by 8.7% (0.63)
and Days Away Case Rate (DACR) by 12% (0.22) compared to 2016.
Total Recordable Case Rate
Health and safety recordable cases are work-related injuries or illnesses as defined by the U.S. Occupational Safety and Health Administration (OSHA).
Days away cases are injuries or illnesses involving one or more days away from work as defined by OSHA.
TRCR actual rate
TRCR goal
DACR actual rate
DACR goal
Rate per 100 employeesDays Away Case Rate Rate per 100 employees
2015 2016 2017 2018
.80
.57
.69
.63
2015 2016 2017 2018
.30
.19
.25
.22
.18 goal.60 goal
EATON 2017 sustainability metrics © 2018 Eaton. All rights reserved.

Metric tons of GHG per million dollars of sales (USD)
2015 2016 2017
841
974
1,010
968
824
815
GHG generated Indexed GHG generated
2015 2016 2017
48.449.3
47.7
40.3 41.740.2
Indexed to sales, our greenhouse gas (GHG) generation decreased by 3.4% in 2017 compared to 2016. On
an absolute basis, we decreased our GHG generation by 6,000 metric tons (from 974,000 to 968,000), or 0.7%
compared to the prior year. Since 2015, we have reduced the total amount of GHG generated by our operations
from 1,010,000 metric tons to 968,000, which equals a 4.2% reduction. Indexed to sales, we decreased our
GHG emissions by 1.4% over the period.
Greenhouse gas generation
Emission rates are generated using World Resources Institute-recommended CO2 conversion factors, which account for variations by region. These conversion factors are based on typical energy generation methods, such as those using fossil fuels or other energy sources. When we compare 2017 to 2016, sales from the manufacturing plants that make up Eaton's GHG profile increased by 2.8%.
Thousand metric tons of GHG per year
48.6 goal
170 150 153 8.1 7.6 7.5
Indexed GHG indirect
Indexed GHG direct
GHG indirect
GHG direct
EATON 2017 sustainability metrics © 2018 Eaton. All rights reserved.

2015 2016 2017 2018
0.248
0.228
0.258
0.235
.237 goal
2015 2016 2017
5,164
5,093
4,773
Water consumption
Water consumedThousand cubic meters of water
Indexed water consumedCubic meters of water per $1,000 of sales (USD)
Water consumption data reported represent a majority of Eaton’s water consumption at manufacturing plants worldwide. Of the sites reporting, 16% were in Asia Pacific; 30% in Europe, the Middle East and Africa; 4% in South America; and 50% in North America. When we compare 2017 to 2016, sales from the manufacturing plants used to create Eaton’s water profile increased by 2.8%.
Indexed to sales, our water consumption decreased by 8.8% in 2017 compared to 2016. On an absolute basis,
we decreased our water consumption by 6.3% compared to the prior year. Eaton does not consume large
volumes of water, therefore the majority of the decrease relates to reduction efforts of a few targeted plants.
Since 2015, we have reduced water consumption from 5,164,000 to 4,773,000 cubic meters, which equals a 7.6%
reduction. Indexed to sales, we reduced water usage by 5.2% over the period.
Water consumed Indexed water consumed
Indexed water consumed goal
EATON 2017 sustainability metrics © 2018 Eaton. All rights reserved.

2015 2016 2017
2,568
2,4192,424
1,632
1,5881,579
Energy used Indexed energy used
Energy consumption data was compiled from a majority of Eaton’s manufacturing plants worldwide. Of the sites reporting, 17% were located in Asia Pacific; 29% in Europe, the Middle East and Africa; 3% in South America; and 51% in North America. When we compare 2017 to 2016, sales from the manufacturing plants that make up Eaton’s energy profile increased by 2.8%.
Indexed to sales, our energy use decreased by 2.5% in 2017 when compared to 2016. On an absolute basis, our
energy consumption increased by 5 million kilowatt-hours, or 0.2% compared to the prior year. Since 2015, we
have reduced the total energy used by our operations from 2,568 million to 2,424 million kilowatt-hours, which
equals a 5.6% reduction. Indexed to sales, we decreased usage by 3.3% over the period.
Energy consumption
2015 2016 2017
7880
78
123 123119
Million kilowatt-hours Kilowatt-hours per $1,000 of sales (USD)
Energy direct
Energy indirect
936 831 845
Indexed energy direct
Indexed energy indirect
45 42 42
EATON 2017 sustainability metrics © 2018 Eaton. All rights reserved.
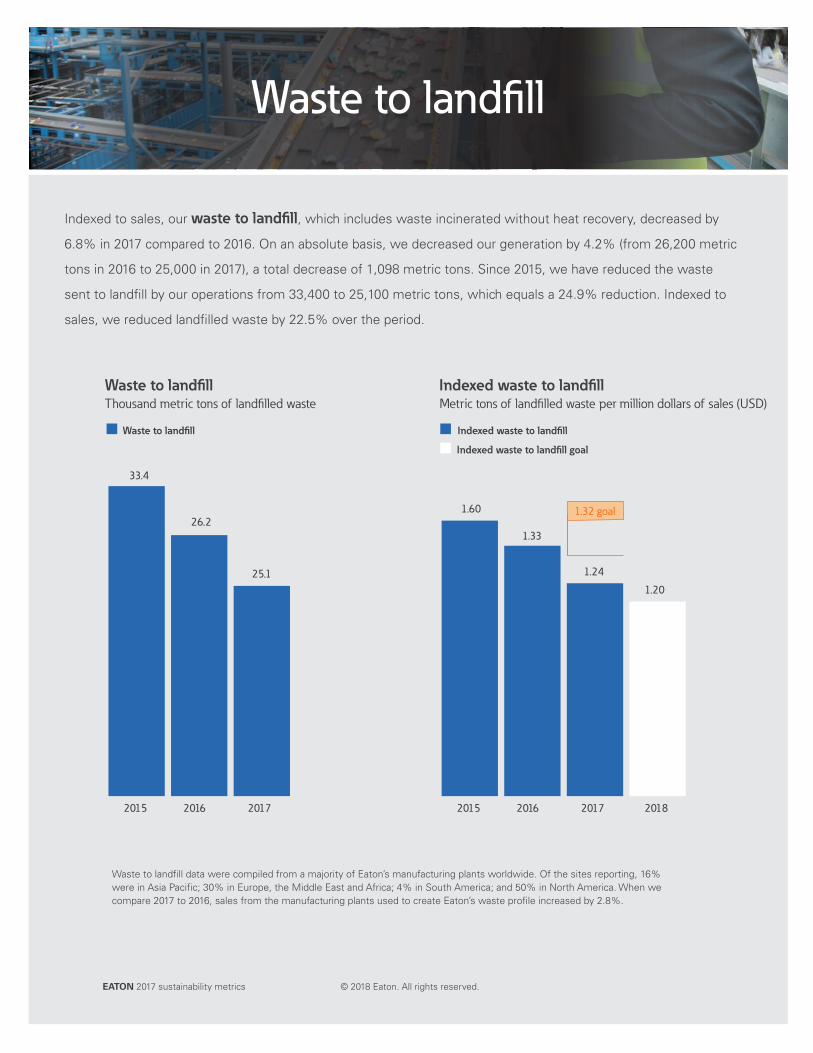
Waste to landfill data were compiled from a majority of Eaton’s manufacturing plants worldwide. Of the sites reporting, 16% were in Asia Pacific; 30% in Europe, the Middle East and Africa; 4% in South America; and 50% in North America. When we compare 2017 to 2016, sales from the manufacturing plants used to create Eaton’s waste profile increased by 2.8%.
Waste to landfill
Indexed to sales, our waste to landfill, which includes waste incinerated without heat recovery, decreased by
6.8% in 2017 compared to 2016. On an absolute basis, we decreased our generation by 4.2% (from 26,200 metric
tons in 2016 to 25,000 in 2017), a total decrease of 1,098 metric tons. Since 2015, we have reduced the waste
sent to landfill by our operations from 33,400 to 25,100 metric tons, which equals a 24.9% reduction. Indexed to
sales, we reduced landfilled waste by 22.5% over the period.
2015 2016 2017 2018
1.60
1.20
1.33
1.24
1.32 goal
2015 2016 2017
33.4
26.2
25.1
Waste to landfill Indexed waste to landfillThousand metric tons of landfilled waste Metric tons of landfilled waste per million dollars of sales (USD)
Waste to landfill Indexed waste to landfill
Indexed waste to landfill goal
EATON 2017 sustainability metrics © 2018 Eaton. All rights reserved.

Workplace, inclusion & diversity
95,696 29,926
87,607 28,289
7,481 1,520
583 112
25 5
12 3
(As of December 31, 2017)Total global
Number of women
28,733
24,116
4,171
422
24
11
U.S.total
31.3%
32.3%
20.3%
19.2%
20.0%
25.0%
Percentage of women
Executives
Board of directors
Global leadership team
Managers
All other employees
All employees 8,582 29.9%
7,829 32.5%
679 16.3%
65 15.4%
9 37.5%
3 27.3%
Number of minorities
(U.S. only)
Percentage of minorities
(U.S. only)
Bringing diversity to our leadership positions is a global priority, and in 2017 we increased the
percentage of women and minorities holding executive and manager roles.
Eaton global employment diversity
Eaton global employment by age group
19,626 20.5% 53,699 56.1% 22,371 23.4%
19,539 22.3% 48,598 55.5% 19,470 22.2%
87 1.2% 4,776 63.8% 2,618 35.0%
0 0% 318 54.5% 265 45.5%
0 0% 7 28.0% 18 72.0%
0 0% 0 0.0% 12 100%
Number under 30
Percentageof under 30
Numberof 30-50
Percentageof 30-50
Numberof over 50
Percentageof over 50
Board of directors
Global leadership team
All other employees
All employees
(As of December 31, 2017)
EATON 2017 sustainability metrics © 2018 Eaton. All rights reserved.
Executives
Managers

Small and diverse businesses fuel the economy by creating jobs and delivering innovative solutions. We believe
that encouraging these organizations to compete for our business benefits us and our communities.
In 2017, we purchased more than $1.6 billion in goods and services from small and diverse suppliers, about 12
percent of our total supplier spending. Compared to 2016 our spend with minority-owned firms increased by over
20 percent; our spend with women-owned business grew just over 3 percent; and our spend with veteran-owned
businesses declined less than one percent. Overall, we increased our combined spending with minority, women
and veteran-owned diverse businesses by almost 10 percent over the previous year.
$117
$1,078
2.4%
22.5%
$118
$991
2.0%
15.5%
$212 4.4% $205 3.4%
$257 5.4% $206 5.2%
2017actual
Percentageof 2017spend
Percentageof 2016spend
2016actual
Minority-owned business
Women-owned business
Small business(other than classified above)
Veteran-owned business
Supplier diversity
EATON 2017 sustainability metrics © 2018 Eaton. All rights reserved.
(In millions)

In 2017, our charitable contributions were $11.4 million. Of this, almost 60 percent went to health and human
services; about 17 percent went toward education; 14 percent toward arts and culture; and the remaining
supported civic and community efforts as well as global disaster relief.
Charitable contributionsCharitable contributions
Matching gift
United Way
International
Global disaster relief
U.S.
2015
2016
2017
$11.4
$11.1
$10.2
EATON 2017 sustainability metrics © 2018 Eaton. All rights reserved.
Education
Health and human services
Civic and community efforts and global disaster relief
Arts and culture

At Eaton, we believe that power is a fundamental part of just
about everything people do. Technology, transportation, energy
and infrastructure—these are things the world relies on every
day. That’s why Eaton is dedicated to helping our customers find
new ways to manage electrical, hydraulic and mechanical power
more efficiently, safely and sustainably. To improve people’s
lives, the communities where we live and work, and the planet
our future generations depend upon. Because that’s what really
matters. And we’re here to make sure it works.
See more at Eaton.com/whatmatters
*We make what matters work.*
Eaton is a registered trademark.
All other trademarks are property of their respective owners.
Follow us on social media to get the latest product and support information.
Eaton1000 Eaton BoulevardCleveland, OH 44122United StatesEaton.com
© 2018 EatonAll Rights ReservedMarch 2018


![Une nouvelle famille d'indices de dissimilarité pour la MDS · dghg-ghg ghg-ghghg-ghghghg-ghg gig ghghg-ghghg-ghghg gig ghg-g\3 x pm w ln hkt?_;ij mg/l]v yxhktayxtmyxv y l wxo ghghg-ghghghg-ghg](https://img.pdfslide.us/doc/110x75/600a42dc90da5f569a181e47/une-nouvelle-famille-dindices-de-dissimilarit-pour-la-mds-dghg-ghg-ghg-ghghg-ghghghg-ghg.jpg)