Embed Size (px)
Citation preview

www.rsc.org/advances
RSC Advances
This is an Accepted Manuscript, which has been through the Royal Society of Chemistry peer review process and has been accepted for publication.
Accepted Manuscripts are published online shortly after acceptance, before technical editing, formatting and proof reading. Using this free service, authors can make their results available to the community, in citable form, before we publish the edited article. This Accepted Manuscript will be replaced by the edited, formatted and paginated article as soon as this is available.
You can find more information about Accepted Manuscripts in the Information for Authors.
Please note that technical editing may introduce minor changes to the text and/or graphics, which may alter content. The journal’s standard Terms & Conditions and the Ethical guidelines still apply. In no event shall the Royal Society of Chemistry be held responsible for any errors or omissions in this Accepted Manuscript or any consequences arising from the use of any information it contains.
View Article OnlineView Journal
This article can be cited before page numbers have been issued, to do this please use: S. Quiles Diaz, J.
A. Gimenez Mañogil and A. Garcia-Garcia, RSC Adv., 2015, DOI: 10.1039/C4RA15595E.
1
Catalytic performance of CuO/Ce0.8Zr0.2O2 loaded over SiC-DPF in
NOx-assisted combustion of diesel soot.
Susana Quiles-Díaz, Javier Giménez-Mañogil and Avelina García-García*
MCMA Group, Department of Inorganic Chemistry. Faculty of Sciences.
University of Alicante. Ap.99 E-03080 Alicante. SPAIN. ([email protected]).
Abstract
This work presents a comparative study between the catalytic performance of the
2%CuO/ceria-zirconia powder catalyst and the same catalyst supported on silicon
carbide DPF (Diesel Particulate Filter) towards NO oxidation reaction and soot
combustion reaction.
The ceria-zirconia catalyst was prepared by the co-precipitation method and 2
wt% copper was incorporated by the incipient wetness impregnation method. The
catalyst was incorporated onto the ceramic support using a simple and organic solvent-
free procedure by a simple dipping of the DPF in an aqueous solution of the catalyst.
The powder catalyst has been characterized using N2 adsorption at -196ºC, XRD and
Raman Spectroscopy; whereas the catalytic coating morphology has been evaluated by
SEM and the mechanical stability by an adherence test. Both catalysts configuration
were tested for NO oxidation to NO2 and for soot combustion under NOx/O2.
The results revealed that incorporation of very active copper/ceria-zirconia
catalyst onto a SiC-DPF has been successfully achieved by a simple coating procedure.
Furthermore, the catalytic coating has shown a suitable mechanical, chemical and
thermal stability. A satisfactory catalytic performance of the catalytic-coated filter was
reached towards the NO oxidation reaction. Moreover, it was proved that the catalytic
coating is stable and the corresponding coated DPF can be reused in several cycles of
NO oxidation without a significant decrease in its activity.
Finally, it was verified that the loose-contact mode is a good choice to simulate
the catalytic performance of this active phase in a real Diesel Particulate Filter.
*Corresponding author. Tel.: +34 965909419; e-mail: [email protected]
Fax: +34 96590 3454
Page 1 of 38 RSC Advances
RS
CA
dvan
ces
Acc
epte
dM
anus
crip
t
Publ
ishe
d on
02
Febr
uary
201
5. D
ownl
oade
d by
Uni
vers
idad
de
Alic
ante
on
09/0
2/20
15 0
8:00
:05.
View Article OnlineDOI: 10.1039/C4RA15595E

2
1. Introduction
The majority of the environmental pollutants released to the atmosphere come
from fossil fuels’ inefficient combustion1. Diesel engines are one of the main sources of
air pollution in urban areas2, since they generate contaminants such as nitrogen oxides
(NOx) and particulate matter (PM)3. Currently, environmental catalysis is especially
focused on developing improved technologies to control the emissions of these
pollutants, owing to the ever growing concern related to their harmful effects over both
environment and human health4. The implement of a more stringent legislation for soot
emissions has motivated the development of diverse strategies to control the emissions
released by diesel engines5. These strategies can be classified in three groups: (i)
modifications in the diesel engine designs, (ii) modifications of the fuel formulations
and (iii) the use of filtering after-treatment devices6. Since it is foreseen that in order to
accomplish the incoming legislation for regulating soot emissions neither the (i) nor the
(ii) strategies would be enough7, several after-treatment technologies have been
proposed6.
Among the most effective after-treatment technologies developed to reduce the
amount of soot released to the atmosphere, the use of DPFs (Diesel Particulate Filters)
is found8. It is a wall-flow type monolith
6,9 which reduces particles emissions into the
environment, minimizing the environmental hazards caused by diesel engines. The
characteristic geometry of the DPF consists of half of the channels open at one extreme,
whereas these open channels in one edge are closed at the opposite extreme. Therefore,
the arrangement of the edge cross section looks like a checkerboard10
. These filters
provide channels into which the gas flows, but blocked ends force the incoming gases to
pass through porous channel walls before they can exit the filter11
. The constant
filtration of the exhaust gases generates a progressive accumulation of soot, being
required the filter regeneration by combustion of the retained soot5,12
. The ignition of
diesel particulate matter usually happens at 600 ºC and the temperature of diesel exhaust
gases ranges from 250 ºC to 450 ºC under normal working conditions, which is too low
to begin the soot combustion spontaneously5,8,12
. An extended regeneration strategy is
the commercial CRT (Continuously Regeneration Trap) system13,14
. This one consists of
a DPF located downstream a Pt-containing DOC (Diesel Oxidation Catalyst). In the
DOC the NO is oxidized to NO2 and a continuous DPF regeneration takes place by the
action of the NO2, as NO2 is more oxidant than O215
. An alternative and promising way
Page 2 of 38RSC Advances
RS
CA
dvan
ces
Acc
epte
dM
anus
crip
t
Publ
ishe
d on
02
Febr
uary
201
5. D
ownl
oade
d by
Uni
vers
idad
de
Alic
ante
on
09/0
2/20
15 0
8:00
:05.
View Article OnlineDOI: 10.1039/C4RA15595E

3
to carry out the filter regeneration is using particulate filters containing a suitable
catalyst to promote soot combustion6,13,16
. Currently, one of the great challenges of the
environmental catalysis is the development of a noble metal-free catalyst able to reduce
the onset temperature of soot combustion, being ceria-based materials among the most
promising active phases17
. The key to understand the operation of these materials is
based on their ability to release and store oxygen due to the redox couple Ce3+
/Ce4+
.
Furthermore, the oxygen mobility in its lattice can be enhanced by inclusion of other
cations, like zirconium or praseodymium, forming substitutional solid solutions, which
can lead to non-stoichiometric mixed oxides. One of the most commonly used mixed
oxides is ceria-zirconia (CexZr1-xO2-δ). The importance of these mixed oxides as
catalysts has raised several studies for application to different oxidation reactions18-25
.
An enhancement of the catalytic properties of the cerium-based catalysts is achieved
with the incorporation or dispersion of copper. Actually, cerium-based catalysts doped
with copper have shown an exceptional activity, comparable to those exhibited by
precious metals, towards some relevant reactions from a technological point of view;
such as CO oxidation at low temperature, CO preferential oxidation in H2-rich streams
(CO-PROX) or the methanol synthesis from CO and H221, 26-31
. Recent studies point out
an enhancement in terms of activity and selectivity in reactions such as NO oxidation to
NO2 and soot combustion when copper-doped cerium-based catalysts are used25,32
.
The overall aim of this research is double: on the one hand, the feasibility in the
incorporation of the active phase (2%CuO/Ce0.8Zr0.2O2) to a commercial lab-scale diesel
particulate filter (SiC-DPF) will be analyzed by using an alternative impregnation
technique. It consists of achieving a well-adherent deposit of the catalyst directly on the
ceramic structure (thus avoiding the adoption of intermediary washcoat) by using an
environmentally-friendly impregnation technique, as it prescinds from surfactants or pH
regulator agents. On the other hand, the catalytic activity of the catalyst supported onto
the DPF towards NO oxidation and soot combustion reaction will be evaluated, being
both key reactions in the framework of diesel decontamination. The reason for the
addition of copper to the ceria-zirconia support, the choice of the particular formulation
2%CuO/Ce0.8Zr0.2O2 and its influence both on the soot combustion activities and on the
mechanism were properly described elsewhere25,33,34
.
Page 3 of 38 RSC Advances
RS
CA
dvan
ces
Acc
epte
dM
anus
crip
t
Publ
ishe
d on
02
Febr
uary
201
5. D
ownl
oade
d by
Uni
vers
idad
de
Alic
ante
on
09/0
2/20
15 0
8:00
:05.
View Article OnlineDOI: 10.1039/C4RA15595E

4
2. Experimental
Powder catalyst synthesis, characterization and testing.
The 2%CuO/Ce0.8Zr0.2O2 powder catalyst has been synthesized following a
procedure based on the synthesis of Ce0.8Zr0.2O2 mixed oxide and subsequent addition
of the proper amount of copper by incipient wetness impregnation. A detailed
description of the experimental procedure followed is described in the literature by
Giménez-Mañogil et al. 25
. The actual copper content on the catalyst was close to the
nominal value, as verified by XRF technique.
Ce0.8Zr0.2O2 and Ce0.8Zr0.2O2-supported copper catalysts were then
characterized. The specific surface areas of the samples were determined by the BET
method. N2 adsorption-desorption isotherms were obtained at -196 ºC in an automatic
volumetric system (Autosorb-6B form Quantachrome) after degassing the samples at
250 ºC for 4 h. The specific pore volume was calculated from the desorption branch of
the isotherm at P/P0 = 0.98 following the criteria used by Moretti et al. 35
Powder XRD patterns were recorded in a Bruker D8 advance diffractometer,
using the CuKα radiation (λ=0.15418 nm). Diffractograms were recorded between 10º
and 60º (2θ) with a step size of 0.05º and measuring for 3 s at each step. Indexation and
calculation of the unit cell parameter was performed by using the position of line (111)
and Bragg’s law, considering cubic system for ceria fluorite structure. The average
crystal size estimation was carried out using Scherrer’s equation. In order to improve
accuracy, crystal sizes were estimated as an average value from those obtained from
three representative fluorite reflections ((111), (220) and (311)).
Raman spectra were performed in a Bruker RFS 100/S Fourier Transform
Raman Spectrometer with a variable power Nd:YAG laser source (1064 nm), 64 scans
at 85 mW laser power (70 mW on the sample) were recorded and no heating of the
sample was observed under these conditions.
The catalytic tests were performed in a tubular quartz reactor vertically
positioned and coupled to specific NDIR-UV gas analyzers (Fisher-Rosemount, models
BINOS 100, 1004, 1001) for CO, CO2, NO, NO2 and O2 monitoring. For the NO
oxidation tests, 80 mg of catalyst were diluted with 320 mg of SiC to avoid pressure
drop. The gas mixture used comprised 500 ppm NOx, 5% O2 and balance N2; the gas
flow was fixed at 500 mL/min (GHSV = 30,000 h-1
). The experimental set-up has been
designed in order to ensure that the proportion of NO2 in the NO+O2 mixture fed to the
Page 4 of 38RSC Advances
RS
CA
dvan
ces
Acc
epte
dM
anus
crip
t
Publ
ishe
d on
02
Febr
uary
201
5. D
ownl
oade
d by
Uni
vers
idad
de
Alic
ante
on
09/0
2/20
15 0
8:00
:05.
View Article OnlineDOI: 10.1039/C4RA15595E

5
reactor is negligible, thus being similar to the proportion in the diesel exhaust. Catalytic
tests consisted of Temperature Programmed Reactions (TPRs), where the temperature
was increased from room temperature up to 700 ºC at 10 ºC/min under the reactive
atmosphere, with the purpose of quantifying the NO to NO2 oxidation capacity of the
catalyst.
The NO2 production profiles were determined in relation to the total amount of
NOx as a function of temperature.
The catalytic activity towards soot combustion was analyzed by means of
Temperature Programmed Reactions (TPRs), which were carried out under identical
experimental conditions than those used for the NO oxidation tests (but with soot).
Additionally, the same gas mixture used for NO oxidation measurements was used for
soot combustion tests. Soot conversion profiles were determined from the CO and CO2
evolved. 80 mg of catalyst were mixed with the proper amount of Printex-U soot
(supplied by Evonik-Degussa). As different soot-catalyst ratios were tested (1:6, 1:5,
1:4 and 1:3), both components were mixed in order to get both loose contact conditions
(very gentle mixture of soot and catalyst with a spatula for 2-3 minutes) and tight
contact conditions (intimate mixture of soot and catalyst in an agate mortar for 5-6
minutes), and they were diluted with the required amount of SiC to reach a final mass of
400 mg in the mixture.
Supported catalyst preparation, characterization and testing.
The 2%CuO/Ce0.8Zr0.2O2 was supported on lab-scale DPFs. The SiC wall-flow
filters, which were used for this purpose, present the following geometrical
characteristics: 7.5 cm in length, 2.5 cm of diameter, 300 cpsi, and an average porosity
of 42%; they were provided by Céramiques Techniques et Industrielles. Before using
them, the as-received DPFs were washed with water and acetone, dried at 110 ⁰C and
calcined at 700 ⁰C for 2 h.
The catalyst incorporation on the surface of the filter channel inner walls was
done using an easy and organic solvent-free procedure.
The ceramic support was vertically dipped in a dilute aqueous suspension of the
as-prepared powder catalyst. The filter-suspension system was placed in an ultrasonic
Page 5 of 38 RSC Advances
RS
CA
dvan
ces
Acc
epte
dM
anus
crip
t
Publ
ishe
d on
02
Febr
uary
201
5. D
ownl
oade
d by
Uni
vers
idad
de
Alic
ante
on
09/0
2/20
15 0
8:00
:05.
View Article OnlineDOI: 10.1039/C4RA15595E

6
bath during 90 min. It must be noted that, taking into consideration the particular
geometry of the substrate, the ceramic supports were turned upside down after waving
the samples for the first 45 min. After the immersion, the samples were dried at 110 ºC
for 12 h and calcined at 600 ºC for 2 h. The amount of catalyst loaded onto the DPF was
determined by gravimetric difference.
One of the main advantages of this technique is that it is much greener than
some others described in the literature, since water is used as solvent and it is devoid of
surfactants and pH-regulators agents, which are chemicals that imply environmental
concerns36-42
.
In order to study the morphology of the catalyst anchored to the DPF walls,
Scanning Electron Microscopy (SEM) was performed in a HITACHI S-3000N
microscope with a secondary electron detector, a retrodispersed electron detector and X-
ray detector (XFlash 3001 de Bruker) for microanalysis and chemical mapping.
Previous to SEM characterization, a bare and a coated filter were cut into different
pieces to examine the inner channel walls and cross sections.
The adherence of 2%CuO/Ce0.8Zr0.2O2 coating on ceramic filters was evaluated
by stressing the samples in an ultrasonic bath at ambient temperature. The coated filters
were immersed in acetone inside a glass vessel, which was placed in an ultrasonic bath
(Ultrasons P-selecta, 50-60 Hz) for 1 h40
. After this treatment, the samples were dried
overnight at 110 ºC. In all cases, the coating adherence was determined by loss weight
measurement.
The catalytic tests were performed using the same gas analyzers described for
the powder catalysts. In this case, the employed reactor was a tubular stain steel reactor,
3 cm of inner diameter, and it was horizontally placed inside the furnace. The catalytic
tests consisted of Temperature Programmed Reactions, where the temperature was
increased from room temperature up to 700 ºC at 10 ºC/min under the reactive
atmosphere, with the purpose of quantifying the NO to NO2 oxidation capacity of the
catalyst. In order to study the thermal and chemical stability of the catalytic coating,
after the first TPR run, the structured catalyst was cooled down in air and its catalytic
capacity was evaluated again following the same procedure, which was repeated four
consecutive times for the same coated DPF.
Page 6 of 38RSC Advances
RS
CA
dvan
ces
Acc
epte
dM
anus
crip
t
Publ
ishe
d on
02
Febr
uary
201
5. D
ownl
oade
d by
Uni
vers
idad
de
Alic
ante
on
09/0
2/20
15 0
8:00
:05.
View Article OnlineDOI: 10.1039/C4RA15595E

7
The catalyst’s activity towards soot combustion once supported onto the DPF
was analyzed by means of Temperature Programmed Reactions, which were carried out
under identical experimental conditions than those used for the NO oxidation tests (but
with soot).
Previously, the filters were impregnated with soot by immersion into a soot-
methanol suspension (7000 ppm) under vigorous stirring39
. It must be noted that
previous to the soot incorporation, the substrates were wrapped with Teflon to avoid the
soot deposition onto the outside walls41
. Finally, samples were dried at room
temperature for 12 h. The soot loaded was gravimetrically determined. The average soot
loaded over a coated filter was 0.075 ± 0.015 g, whereas an average of 0.090 ± 0.020 g
of soot was incorporated over a bare filter.
3. Results and discussion
Powder catalyst characterization
Surface area values (SBET) are shown in Table 1. The area of the copper
containing catalyst is lower than that of the parent Ce0.8Zr0.2O2 support. This lower
value is in accordance with previous works related to samples prepared with the same
procedure25,43
.
The specific pore volume (Vs), calculated from the isotherms as described for
this kind of materials, diminishes when copper is added35
. These results indicate a
certain ceria-zirconia’s pores blocking upon copper incorporation on its surface.
Figure 1 displays the X-ray diffractograms of the catalysts. Diffraction peaks
attributable to cubic fluorite phase of ceria are observed in both samples. The diffraction
peaks, characteristic of CuO phase (tenorite), were not detected, indicating that bulk
CuO crystallites are not formed on this catalyst.
The symmetrical peaks of Ce0.8Zr0.2O2 suggested formation of single ceria-
zirconia solid solution (peak splitting would be expected if two phases were
segregated). Table 1 lists lattice constants and average crystal sizes. As collected in
Table 1, the lattice parameter estimated for the copper-containing catalyst is close to
that of the support. This suggests that copper remains essentially on the surface, and it is
Page 7 of 38 RSC Advances
RS
CA
dvan
ces
Acc
epte
dM
anus
crip
t
Publ
ishe
d on
02
Febr
uary
201
5. D
ownl
oade
d by
Uni
vers
idad
de
Alic
ante
on
09/0
2/20
15 0
8:00
:05.
View Article OnlineDOI: 10.1039/C4RA15595E

8
not significantly incorporated into the fluorite structure, as could be promoted by other
synthesis routes (e.g. micro emulsion-precipitation)30,35,43
.
The XRD patterns also showed very broad main peaks, suggesting, a priori,
small crystal sizes. The determination of the crystal sizes can be approached by means
of Scherrer’s equation in agreement with Zhang et al44
.
The mentioned average crystal sizes are also listed in Table 1, revealing that the
value obtained for the copper-containing catalyst (6.4 nm) remains close to that of the
parent ceria-zirconia support (5.5 nm).
The XRD results are well complemented by the Raman study. Figure 2 shows
the Raman spectra of the samples, all with a main band at 473.5 cm-1
ascribed to the F2g
vibration mode of the fluorite structure of ceria. The intensity of this band decreases
with the loading of copper, which could be related to the optical absorption of copper,
as discussed elsewhere25
. However, it must be taken into account that the presence of
copper neither affects the F2g band position at 473.5 cm-1
nor the band broadening
(Table 1). Results reveal that copper is not inserted into the ceria-zirconia lattice or
there is a small incorporation of copper at surface or subsurface positions of the lattice;
which might not be detected by Raman spectroscopy for this catalyst. Copper
incorporation into the lattice would have been detected by red shift and broadening of
the main F2g mode, as published by Gamarra et al43
.
Finally, very low intensity Raman bands have been found at ≈ 120 cm-1
and 292
cm-1
for the ceria-zirconia support, which can be associated to Zr incorporation into the
ceria lattice with the consequent distortion of the framework symmetry. Additionally,
the weak and broad band extending between 560 and 650 cm-1
can be associated to the
presence of oxygen vacancies43, 45-46
.
Incorporation of the active phase to the DPF substrate
As described previously, the main goal of this research is to study the catalytic
performance of 2%CuO/Ce0.8Zr0.2O2 once supported on a Diesel Particulate Filter.
Therefore, a preceding step consisting of incorporating the active phase onto a DPF
substrate is required. The impregnation procedure carried out must ensure a simple,
controlled and reproducible incorporation of the as-prepared catalyst. Another
Page 8 of 38RSC Advances
RS
CA
dvan
ces
Acc
epte
dM
anus
crip
t
Publ
ishe
d on
02
Febr
uary
201
5. D
ownl
oade
d by
Uni
vers
idad
de
Alic
ante
on
09/0
2/20
15 0
8:00
:05.
View Article OnlineDOI: 10.1039/C4RA15595E

9
parameter to take into consideration is the amount of catalyst incorporated, since it
should be optimum, thus yielding a satisfactory catalytic activity without blocking the
porosity of the channel walls.
The designed procedure to carry out the incorporation of the active phase onto
the DPF is based on using an aqueous solution as impregnation agent. This
impregnation procedure was accomplished over nine DPFs.
The obtained results point out a satisfactory impregnation reproducibility, as the
gained weight average value over those 9 DPFs is 0.4425 g (approximately 1.4% DPF
weight), with a standard deviation of 7.2%. It must be noted that this amount of catalyst
does not block the channel wall pores, as proved by forcing a gas flow of 500 ml/min to
go through the loaded DPF and checking that this gas flow did not diminish at the DPF
exit. It can be concluded that pressure drop will not be relevant during the catalytic
tests.
Supported catalyst characterization
The Scanning Electron Microscopy technique allows us the study of the active
phase’s morphology. In order to analyze the distribution of the active phase on the
channel walls, SEM images of an active phase-coated DPF were compared with those
obtained from a bare DPF. Previous to SEM characterization, both coated and uncoated
DPFs were cut into different pieces for two reasons: the whole DPF exceeds the sample
size that can be analyzed by the available equipment and to obtain images from the
channel inner walls of the DPF.
Figure 3 schematizes the different DPF pieces obtained in order to be analyzed
by SEM. As seen in Figure 3b and c, two consecutive cross sections (1 cm thickness)
were cut, corresponding to the DPF edge and the immediately adjacent cross section.
The longitudinal section of the remaining DPF piece was analyzed as well, as
schematized in Figure 3d.
Figure 4 shows micrographs of the bare substrate (from the longitudinal section,
see Figure 3d). The wall surface can be seen in detail in Figure 4a, and the wall cross
section in Figure 4c. Both images exhibit a globular morphology, leading to a high
porosity between SiC grains. The comparison between Figures 4a and 4c allows us to
Page 9 of 38 RSC Advances
RS
CA
dvan
ces
Acc
epte
dM
anus
crip
t
Publ
ishe
d on
02
Febr
uary
201
5. D
ownl
oade
d by
Uni
vers
idad
de
Alic
ante
on
09/0
2/20
15 0
8:00
:05.
View Article OnlineDOI: 10.1039/C4RA15595E

10
observe a higher porosity in the wall cross section regarding the wall surface. As seen in
Figure 4c the pores are well-connected among them, being observed the characteristic
flow-pass structure inside the wall, which is required to achieve a high filtration
efficiency of the diesel exhaust.
Figure 5 shows micrographs obtained from the most external cross section (see
Figure 3b) of a coated DPF. As observed, the active phase was incorporated to the DPF
through the DPF open channel. A more abundant agglomeration of active phase is
observed at the corners of the channel, as previously observed by other authors41
. Figure
5c shows in more detail an accumulation of active phase deposited on the channel walls.
Figure 6 shows SEM images obtained from the inner cross section of a loaded
DPF corresponding to the cut showed in Figure 3c. As observed in Figure 6b, all the
channels are open, as it is the inner cross section. It was assumed that the impregnation
process of the substrate was governed by action of both capillarity and gravity37,39
.
Moreover, as the designed impregnation process is based on the filters’ immersion in an
aqueous solution, followed by a 180º rotation of the DPF position regarding its
longitudinal axis and subsequent immersion, it is expectable the presence of active
phase anchored onto all the DPF’s channels. In this sense, it is reasonable to find a
lower active phase concentration near the DPF’s closed edges, as in these regions the
catalyst solution will only arrive by gravity effect. To state that hypothesis, it was
assumed that the aqueous suspension ascent through the channels by capillarity action is
more disfavored than the suspension descent by gravity effect.
The rotation step during the impregnation process was performed to ensure an
equivalent catalyst loading over the open channels, independently on the DPF extreme,
and the same in the case of the closed channels. Taking into account the former
hypothesis, it is expected to obtain a higher concentration of active phase in those
regions closer to the open channels’ edge. As seen in Figure 6b, there is active phase
anchored in every channel. As expected, a higher concentration of active phase is
observed in alternate channels, which correspond to the open channels. On these
channels the catalyst-containing solution is arriving through two different mechanisms,
capillarity and gravity. However, for the channels whose edges are closed, the active
phase will only arrive by gravity action, since the path to be followed by the solution is
much longer than that followed by capillarity action. In conclusion, the active phase
Page 10 of 38RSC Advances
RS
CA
dvan
ces
Acc
epte
dM
anus
crip
t
Publ
ishe
d on
02
Febr
uary
201
5. D
ownl
oade
d by
Uni
vers
idad
de
Alic
ante
on
09/0
2/20
15 0
8:00
:05.
View Article OnlineDOI: 10.1039/C4RA15595E

11
distribution, for the same channel, differs significantly between the open and the closed
edge, being higher the active phase concentration onto the open edge than that on the
closed one.
Figures 7a and 8a show the same micrograph of the channel inner walls of two
consecutive channels (observed from the longitudinal section, see Figure 3d). Figure 7
is focused on the left channel (Figure 7a), which shows a higher concentration of active
phase since this channel is near the open edge of the filter. Figure 8 is focused on the
right channel (Figure 8a), which shows a lower concentration of active phase since this
channel is near the closed edge of the filter. It was verified a higher catalyst loading at
the open channels regarding the closed ones, as a consequence of the particular
geometry and design of the substrate. As seen, the catalyst is well-spread along the
channel walls, nevertheless it is not forming a continuous layer, since the incorporated
catalyst mass is too low to cover all the DPF channels’ surface.
SEM-chemical mapping shown in Figures 9 and 10 was performed over the
channel with the highest loading of active phase and the consecutive channel with a
lower content of active phase, respectively. It is useful to analyze the distribution of the
different components of the coating after being anchored onto the substrate. Figure 9a
exhibits a SEM micrograph of the channel on the right side (shown in Figure 7a).
Additionally, the Ce distribution, which has been selected as representative element of
the active phase, and the Si distribution, selected as representative element of the silicon
carbide substrate, are also included in Figure 9c and 9d, respectively. The distribution of
Si (red), Ce (green) and Zr (blue) were also included in Figure 9b. For comparative
purposes, Figure 10 shows the same representative images for the channel on the left
shown in Figure 7a.
It is observable that there is active phase onto both channels, hence it can be
concluded that the active phase was incorporated onto all the channels. However, if
Figures 9 and 10 are compared, a poorer distribution of cerium and zirconium over the
channel with a lower loading of active phase is observed.
Mechanical stability
Page 11 of 38 RSC Advances
RS
CA
dvan
ces
Acc
epte
dM
anus
crip
t
Publ
ishe
d on
02
Febr
uary
201
5. D
ownl
oade
d by
Uni
vers
idad
de
Alic
ante
on
09/0
2/20
15 0
8:00
:05.
View Article OnlineDOI: 10.1039/C4RA15595E

12
These coated substrates are proposed to be used in the vehicles’ exhaust pipes;
consequently, it is essential to have a good mechanical stability. In order to analyze the
mechanical stability of the catalytic coating, the weight loss was measured after
stressing the samples 60 min in an ultrasonic bath (which allows simulating engine
vibrations under operation). This coating adherence test was performed over three
different coated DPFs. After drying the samples, a weight loss lower than 4% of the
2%CuO/Ce0.8Zr0.2O2 amount was observed for all the cases.
The satisfactory coating adherence can be related to the high external porosity
and roughness of the substrate walls (with an average porosity value of 42.6%), which
provides many sites for the catalytic coating anchoring37
.
Catalytic oxidation of NO to NO2
Figure 11 shows the NO2 production profiles obtained in the catalytic tests
performed without soot. In order to analyze the catalytic behavior of 2%CuO/Ceria-
zirconia/DPF catalyst in the NO oxidation reaction, the activity of this sample was
compared with a bare DPF (non-catalyzed reaction) and 2%CuO/ceria-zirconia powder
catalyst.
As observed in Figure 11, in presence of catalyst, the NO oxidation to NO2 is
improved with regard to the non-catalyzed reaction, decreasing the onset reaction
temperature and shifting the maximum oxidation temperature towards lower values.
Concerning the catalyzed/SiC-DPF reaction, a maximum value around 40% NO2 was
found at 400 ºC, while this value was 6 % at 470 ºC for the bare DPF. The results show
a very high activity of the active phase-loaded DPF towards the NO oxidation reaction,
pointing out a satisfactory catalytic performance of the catalytic-coated filter, despite
the non-continuous dispersion of the catalyst along the channel walls.
The evaluation of the catalytic coating stability was performed by successive NO
oxidation cycles. Therefore, the catalytic coating capacity for being reused and the
possible deactivation of catalytic system were studied. As seen in Figure 11, there are
small differences from the first to the fourth NO2 production cycle, with a slight
increment in the NO2 production for the second cycle regarding the first one, trend not
followed by the third and fourth cycles, which are very similar. The general pattern of
Page 12 of 38RSC Advances
RS
CA
dvan
ces
Acc
epte
dM
anus
crip
t
Publ
ishe
d on
02
Febr
uary
201
5. D
ownl
oade
d by
Uni
vers
idad
de
Alic
ante
on
09/0
2/20
15 0
8:00
:05.
View Article OnlineDOI: 10.1039/C4RA15595E

13
these NO oxidation profiles is composed of: i) a minor contribution of NO2 desorption
at low temperatures (in the range of 100-200 ºC) due to oxidation/desorption of
previous ad-NOx species on solid’s surface at low temperatures and ii) the NO2
production profile controlled by the thermodynamic equilibrium of NO oxidation (gas
phase) at high temperatures.
A minor detail which should be commented is the irregular profile appearing at
300 °C in the first cycle (as a “kink”) and becoming much more attenuated for the
subsequent cycles. A tentative explanation for that could be an accentuated and punctual
production of NO2 by an abrupt decomposition of nitrites/nitrates47
and/or
decarbonation of the ceria-based solid48
followed by fast production and decomposition
of NO2-forming species. It is important to remember that the amount of catalyst is
higher for the experiment with the coated DPF than that with the powder catalyst (400
mg versus 80 mg) and that it is dealing with the fresh catalyst in the first cycle. This last
idea could tentatively account for the slight increase in NO2 production from the first to
the second cycle. Minimum drop from the second to the third area could be attributed to
slight lowering in BET surface area because of the temperature cycles.
As a brief summary, the TPR results indicate that there is no catalytic
deactivation during the different cycles. Hence, this catalytic system can be reused in
several cycles without a significant loss in activity at least up to 700 °C.
On the other hand, the active phase must fulfill some requirements if this
catalytic system, consisting of a coated DPF, is meant to be used as an after-treatment
device in diesel engines. In this regard, the catalytic coating must show a high thermal
and chemical stability. Some authors have evidenced that the temperature inside the
DPF can increase up to 1000-1100 ºC during the DPF regeneration, as a consequence of
the highly exothermal soot combustion process49
; consequently, a high thermal shock
resistance should be achieved by this catalytic system. Some authors suggest
temperature gradients of 100 ºC/cm along both radial and longitudinal directions of the
DPF49
. Successive NO oxidation cycles allow us the evaluation of thermal and chemical
stability and also thermal shock resistance; as the sample is being heated progressively,
using a high heating rate (10 ºC/min), in the presence of a highly oxidant atmosphere.
Based on the similitude among the four successive NO2 production cycles, it can be
concluded that a high thermal and chemical stability characterizes this catalytic system.
Page 13 of 38 RSC Advances
RS
CA
dvan
ces
Acc
epte
dM
anus
crip
t
Publ
ishe
d on
02
Febr
uary
201
5. D
ownl
oade
d by
Uni
vers
idad
de
Alic
ante
on
09/0
2/20
15 0
8:00
:05.
View Article OnlineDOI: 10.1039/C4RA15595E

14
Even though the NO2 production profile showed by the powder catalyst has been
included in the same figure, a direct comparison among these profiles is not possible,
due to the differences between gas space velocities (GHSV) when different catalyst
configurations are employed, as the catalyst bed volume is not equal in both cases.
However, the powder catalyst profile is included in Figure 11 to establish a comparison
between the profiles’ shapes. The absence of significant differences between both
profiles, independently on the catalyst configuration, points out a satisfactory catalytic
activity towards NO oxidation reaction of the coated DPF, even when there are dramatic
differences between both catalytic configurations.
It is worthwhile to evaluate the NO oxidation capacity of the catalytic coating,
since this reaction plays a key role in the beginning and continuity of soot combustion
reaction, as previously reported by some authors19,50
.
Catalytic soot combustion
The aims of this section are: firstly, to verify the catalytic performance of the
supported catalyst onto the DPF towards the soot combustion reaction; secondly, to
study the contact extent established between soot and catalyst after their incorporation
onto the DPF. In order to achieve the latter aim, two contact modes between the soot
and the powder catalyst were employed, loose and tight. Afterwards, the soot
combustion profile obtained with the supported catalyst will be compared with those
obtained from both contact modes (powder catalyst-soot).
It should be noted that there are dramatic differences in the gas space velocities
(GHSV) between both reactor catalyst configurations, since a real scale-up is not
possible owing to the own limitations of the experimental set-up. Therefore, in an
attempt to conduct a proper comparison between the soot combustion profiles, an
identical soot/catalyst ratio must be established in all the experiments. Consequently, a
preliminary study of the influence of the soot/catalyst ratio over the soot combustion
rate was performed. Hence, soot combustion experiments under TPR conditions were
carried out with the powder catalyst, using mixtures with different soot/catalyst ratios.
All the experiments were performed using the same amount of catalyst (80 mg) under
loose contact conditions.
Page 14 of 38RSC Advances
RS
CA
dvan
ces
Acc
epte
dM
anus
crip
t
Publ
ishe
d on
02
Febr
uary
201
5. D
ownl
oade
d by
Uni
vers
idad
de
Alic
ante
on
09/0
2/20
15 0
8:00
:05.
View Article OnlineDOI: 10.1039/C4RA15595E

15
Figure 12 illustrates the soot combustion curves, being included the inset zoom
at low/medium temperatures and low values of conversion. It is interesting to note that
the soot/catalyst ratios of 1:6, 1:5 and 1:4 show very close T50 values among each other.
However, the curve obtained with the 1:3 ratio is shifted to higher temperatures.
Therefore, the soot/catalyst ratio selected to perform the experiment has an influence
over the soot combustion curve. This influence is not observed for the whole range of
soot/catalyst ratios; in fact, the results depicted in Figure 12 show that only for the
highest soot/catalyst ratio the soot combustion curve shifts towards higher temperatures,
thus showing a lower catalytic activity. These results are in accordance with those
previously published in the literature by Peralta et al.51
. They suggested that not all the
soot particles are in complete contact with the catalyst particles, so at a certain point of
soot conversion there is an important loss in the extent of the soot-catalyst contact,
being more critical at high soot/catalyst ratios and therefore a lower reaction rate is
observed.
Taking into consideration the previous results, soot/catalyst ratios higher than
1:4 should be avoided as they lead to lower catalytic activities. The chosen soot/catalyst
ratio to carry out all the experiments is 1:5.
Figure 13 shows the TPR experiments carried out with the catalyst in both
configurations: powder and supported. The soot conversion profile obtained for the bare
DPF is plotted in the same figure.
The soot conversion curve shows a significant shift towards lower temperatures
when the supported catalyst is used (regarding the non-catalyzed reaction with a bare
DPF), as depicted in Figure 13. These results revealed a high activity shown by the
loaded DPF if compared with the unloaded DPF. The in-depth analysis of the soot
combustion profiles points out that at low temperatures a better soot-catalyst contact
degree is established in the DPF comparing the powder mixture, as the onset
temperature is lower when the supported catalyst is used (161 ºC) if compared with the
powder catalyst (262 ºC), and the same trend is observed at high temperatures. A
possible hypothesis to explain this behavior is that the catalyst supported onto the DPF
is well-spread along the DPF channel walls, leading to a more favorable contact
between catalyst and soot than that established when the powder catalyst is employed.
Based on these results, it is proved that for carrying out the elimination of soot at low
Page 15 of 38 RSC Advances
RS
CA
dvan
ces
Acc
epte
dM
anus
crip
t
Publ
ishe
d on
02
Febr
uary
201
5. D
ownl
oade
d by
Uni
vers
idad
de
Alic
ante
on
09/0
2/20
15 0
8:00
:05.
View Article OnlineDOI: 10.1039/C4RA15595E
16
temperature, the supported catalyst configuration is more favorable than the powder
catalyst configuration.
On the other hand, the study of the catalytic results gained when the powder
catalyst is employed, revealed that the temperature at which the profiles appear is
strongly influenced by the contact degree between catalyst and soot. It can be seen that
when soot and catalyst are very gently mixed (with a spatula), the soot combustion
profile is shifted to higher temperatures than when soot and catalyst are mixed
intimately (in an agate mortar), with a T50 value of 406 ºC in tight contact mode and 532
ºC when loose contact is employed; being the degree of contact between soot and
catalyst critical in the context of this reaction.
In order to shed some light on the contributions of NO2-assisted soot combustion
and “active oxygen”-assisted soot combustion, Figure 14 depicts the NO2 slip
percentage in terms of temperature for the configurations compiled in Figure 13. This
parameter reflects (at least if the NO ↔ NO2 recycling efficiency is not very high) how
NO2 is specifically used for the soot combustion reaction. As can be observed, the soot-
catalyst degree of contact strongly influences the NO2 slip profiles. Due to the synergy
between the above-mentioned mechanisms, and as a consequence of the combustion
progress (soot surface is becoming more and more populated of oxygen surface groups),
NO2 is used more efficiently for the soot combustion under the tight contact mode
(complete NO2 removal at 400 °C, when combustion rate is high, and only NO2
emerges when soot has been practically consumed). Conversely, the other two
configurations exhibit “parallel” NO2 slip profiles and whatever the reaction
temperature, NO2 always slips, thus revealing that under these both situations (coated
DPF and loose-contact) NO2 production is not the rate-limiting step. These results are in
agreement with those previously published by the authors19,50,52
concerning the
prevalence and synergies of both mechanisms in the soot combustion context.
It should be remarked that the soot combustion profile obtained with the powder
catalyst under loose contact conditions is quite similar to that obtained with the loaded
filter; being verified the good choice of conducting catalytic experiments under loose
contact conditions when the powder catalyst is used, in order to simulate the
performance of this type of catalysts in a diesel particulate filter. On the contrary, the
soot conversion profile obtained under tight contact conditions is very far from those
Page 16 of 38RSC Advances
RS
CA
dvan
ces
Acc
epte
dM
anus
crip
t
Publ
ishe
d on
02
Febr
uary
201
5. D
ownl
oade
d by
Uni
vers
idad
de
Alic
ante
on
09/0
2/20
15 0
8:00
:05.
View Article OnlineDOI: 10.1039/C4RA15595E

17
mentioned above, and, consequently, does not simulate the real physical contact
achieved in a diesel particulate filter. These results are in accordance with those
previously published by Neyertz et al.39
.
4. Conclusion
This research was dedicated to the incorporation of the active phase onto a diesel
particulate filter following a simple and green procedure, and the study of the catalytic
activity of 2%CuO/ceria-zirconia catalyst supported onto a DPF. The general
conclusions that were drawn are the following:
The catalyst incorporation onto the diesel particulate filters was successfully
achieved by using a simple and green procedure. Furthermore, the amount of
catalyst incorporated is controllable and reproducible.
An important feature of the synthesized catalyst is its high coating adherence, a
needed requirement that must be fulfilled if these coated substrates are going to be
integrated in exhaust pipes.
The morphology adopted by the supported catalyst onto the DPF is a non-
continuous deposit over the channel inner walls. Therefore, this non-homogeneous
distribution avoids the channels porosity blocking. In addition, the catalytic coating
showed a satisfactory activity towards NO oxidation reaction and soot combustion
reaction.
The catalytic coating exhibited an excellent thermal and chemical stability towards
NO oxidation reaction. Consequently, the same coated DPF can be reused in
several oxidation cycles without a significant loss in its catalytic activity.
It was checked a satisfactory catalytic activity of the supported catalysts towards
soot combustion. It was verified that loose-contact mode is a good choice to
simulate the catalytic performance of this active phase in a Diesel Particulate Filter,
as well.
Page 17 of 38 RSC Advances
RS
CA
dvan
ces
Acc
epte
dM
anus
crip
t
Publ
ishe
d on
02
Febr
uary
201
5. D
ownl
oade
d by
Uni
vers
idad
de
Alic
ante
on
09/0
2/20
15 0
8:00
:05.
View Article OnlineDOI: 10.1039/C4RA15595E

18
Acknowledgements
The authors gratefully acknowledge the financial support of Generalitat Valenciana
(PROMETEOII/2014/010 project), the Spanish Ministry of Economy and
Competitiveness (CTQ2012-30703 project, UE-FEDER funding). S.Q.D. wishes to
thank VIDI-University of Alicante her Master Thesis Grant.
Page 18 of 38RSC Advances
RS
CA
dvan
ces
Acc
epte
dM
anus
crip
t
Publ
ishe
d on
02
Febr
uary
201
5. D
ownl
oade
d by
Uni
vers
idad
de
Alic
ante
on
09/0
2/20
15 0
8:00
:05.
View Article OnlineDOI: 10.1039/C4RA15595E

19
5. References
1 J. Fenger, Atmos. Environ., 1999, 33, 4877-4900.
2 J.-H. Tsai, S.-Y. Chang and H.-L. Chiang, Atmos. Environ., 2012, 61, 499-506.
3 J. P.A. Neeft, M. Makkee and J.A. Moulijn, Fuel Process. Technol., 1996, 47, 1-69.
4 A. Setiabudi. Ph.D. Thesis, Technological University of Delft, 2004.
5 D.Fino, Sci. Technol. Adv. Mat., 2007, 8, 93-100.
6 D. Fino and V Specchia, Powder Technol., 2008, 180, 64-73.
7 M.V. Twigg, Catal. Today, 2011, 163, 33-41.
8 M. Jeguirim, V. Tschamber and J. F. Brilhac, J. Chem. Technol. Biotechnol., 2009,
84, 770-776.
9 J.M. Trichard, Stud. Surf. Sci. Catal., 2007, 171, 211-233.
10 M.A. Mokhri, N.R. Abdullah, S.A. Abdullah, S. Kasalong and R, Mamat, Procedia
Eng., 2012, 41, 1750-1755.
11 A.P. Walker, Top. Catal., 2004, 28, 1-4.
12 B.A.A.L. van Setten, M. Makkee and J.A. Moulijn, Catal. Rev., 2001, 44, 489-564.
13 M.V. Twigg, Appl. Catal. B, 2007, 70, 2-15.
14 M.V. Twigg, Catal. Today, 2006, 117, 407-418.
15 M. Valencia, E. López, S. Andrade, N. Guillén-Hurtado, V. Rico-Pérez, A. García-
García, C. Salinas Martínez de Lecea and A. Bueno-López, Top. Catal., 2013, 56, 452-
456.
16 P. Zelenka, W. Cartellieri and P. Herzog, Appl. Catal. B, 1996, 10, 3-28.
17 A. Bueno-López, Appl. Catal. B, 2014, 146, 1-11.
18 A. Trovarelli, Catalysis by Ceria and Related Materials, ed. Catalytic Science
Series, Imperial College Press, 2002, vol. 2.
19 N. Guillén-Hurtado, A. Bueno-López and A. García-García, Appl. Catal. A, 2012,
437-438, 166-172.
20 N. Guillén-Hurtado, A. Bueno-López and A. García-García, J. Mater. Sci., 2012, 47,
3204-3213.
21 E. Aneggi, C. de Leitenburg and A. Trovarelli, Catal. Today, 2012, 181, 108-115.
22 L. Liu, Z. Yao, B. Liu and L. Dong, J. Catal., 2010, 275, 45-60.
23 A.E. Nelson and K.H. Schulz, Appl. Surf. Sci., 2013, 210, 206-221.
24 N. Guillén-Hurtado, I. Atribak, A. Bueno-López and A. García-García, J. Mol. Catal.
A-Chem., 2010, 323, 52-58.
Page 19 of 38 RSC Advances
RS
CA
dvan
ces
Acc
epte
dM
anus
crip
t
Publ
ishe
d on
02
Febr
uary
201
5. D
ownl
oade
d by
Uni
vers
idad
de
Alic
ante
on
09/0
2/20
15 0
8:00
:05.
View Article OnlineDOI: 10.1039/C4RA15595E

20
25 J. Giménez-Mañogil, A. Bueno-López and A. García-García, Appl. Catal. B, 2014,
152-153, 99-107.
26 A. Jia, G. Hu, L. Meng, Y. Xie, J. Lu and M. Luo, J. Catal., 2012, 289, 199-209.
27 A. Martínez-Arias, M. Fernández-García, J. Soria and J.C. Conesa, J. Catal., 1999,
182, 367-377.
28 A. Martínez-Arias, D. Gamarra, M. Fernández-García, X.Q. Wang, J.C. Hanson and
J.A. Rodríguez, J. Catal., 2006, 240, 1-71.
29 A. Martínez-Arias, A.B. Hungría, M. Fernández-García, J.C. Conesa and G. Munera,
J. Phys. Chem. B, 2004, 108, 17983-17991.
30 A. Martínez-Arias, D. Gamarra, M. Fernández-García, A. Hornés, P. Bera, Z.
Koppány and Z. Schay, Catal. Today, 2009, 143, 211-217.
31 Z.Y. Pu, X.S. Liu, A.P. Jia, Y.L. Xie and J.Q. Lu, J. Phys. Chem. C, 2008, 112,
15045-15051.
32 F. Lin, X. Wu and D. Weng, Catal. Today, 2011, 175, 124-132.
33 N. Guillén-Hurtado. Ph.D. Thesis, University of Alicante, 2013.
34 J. Giménez-Mañogil and A. García-García, Fuel Process. Technol., 2015, 129, 227-
235.
35 E. Moretti, L. Storaro, A. Talon, M. Lenarda, P. Riello, R. Frattini, M. Martinez de
Yuso, A. Jiménez-López, E. Rodríguez-Castellón, F. Ternero, A. Caballero and J.P.
Holgado, Appl. Catal. B, 2011, 102, 627-637.
36 D. Mescia, J.C. Caroca, N. Russo, N. Labhsetwar, D. Fino, G. Saracco and V.
Specchia, Catal. Today, 2008, 137, 300-305.
37 S. Biamino, P. Fino, D. Fino, N. Russo and C. Badini, Appl. Catal. B, 2005, 61, 297-
305.
38 V. Rico-Pérez, S. Parres-Esclapez, M.J. Illán-Gómez, C. Salinas-Martínez de Lecea
and A. Bueno-López, Appl. Catal. B, 2011, 107, 18-25.
39 C.A. Neyertz, E.E. Miró and C.A. Querini, Chem. Eng. J., 2012, 181-182, 93-102.
40 C.A. Neyertz, E.D. Banús, E.E. Miró and C.A.Querini, Chem. Eng. J., 2014, 248,
394-405.
41 E.D. Banús, V.G. Milt, E.E. Miró and M.A. Ulla, Appl. Catal. B, 2013, 132-133,
479-486.
42 L.E. Gómez, I.S. Tiscornia, A.V. Boix and E.E. Miró, Int. J. Hydrogen Energ., 2012,
37, 14812-14819.
Page 20 of 38RSC Advances
RS
CA
dvan
ces
Acc
epte
dM
anus
crip
t
Publ
ishe
d on
02
Febr
uary
201
5. D
ownl
oade
d by
Uni
vers
idad
de
Alic
ante
on
09/0
2/20
15 0
8:00
:05.
View Article OnlineDOI: 10.1039/C4RA15595E

21
43 D. Gamarra, G. Munuera, A.B. Hungría, M. Fernández-García, J.C. Conesa, P.A.
Midgley, X.Q. Wang, J.C. Hanson, J.A. Rodríguez and A. Martínez-Arias, J. Phys.
Chem. C, 2007, 111, 11026-11038.
44 F. Zhang, Q. Jin and S. Chan, J. Appl. Phys., 2004, 95, 4319-4326.
45 J.L. Ayastuy, A. Gurbani, M.P. Gónzalez-Marcos and M.A. Gutiérrez-Ortiz, Int. J.
Hydrogen Energ., 2012, 37, 1993-2006.
46 J.L. Ayastuy, A. Gurbani, M.P. Gónzalez-Marcos and M.A. Gutiérrez-Ortiz, Int. J.
Hydrogen Energ., 2010, 35, 1232-1244.
47 I. Atribak, A. Bueno-López and A. García-García, Appl. Catal. B, 2009, 92, 126-
137.
48 I. Atribak, A. Bueno-López, A. García-García and B. Azambre, Phys. Chem. Chem.
Phys., 2010, 12, 13770-13779.
49 N. Miyakawa, H. Sato, H. Maeno and H. Takahashi, JSAE Rev., 2003, 24, 269-276.
50 I. Atribak, F.E. López-Suárez, A. Bueno-López and A. García-García, Catal. Today,
2011, 176, 404-408
51 M.A. Peralta, M.S. Gross, B.S. Sánchez and C.A. Querini, Chem. Eng. J, 2009, 152,
234-241.
52 N. Guillén-Hurtado, F.E. López-Suárez, A. Bueno-López and A. García-García,
React. Kinet. Mech. Catal., 2014, 111, 167-182.
Page 21 of 38 RSC Advances
RS
CA
dvan
ces
Acc
epte
dM
anus
crip
t
Publ
ishe
d on
02
Febr
uary
201
5. D
ownl
oade
d by
Uni
vers
idad
de
Alic
ante
on
09/0
2/20
15 0
8:00
:05.
View Article OnlineDOI: 10.1039/C4RA15595E
22
List of Tables
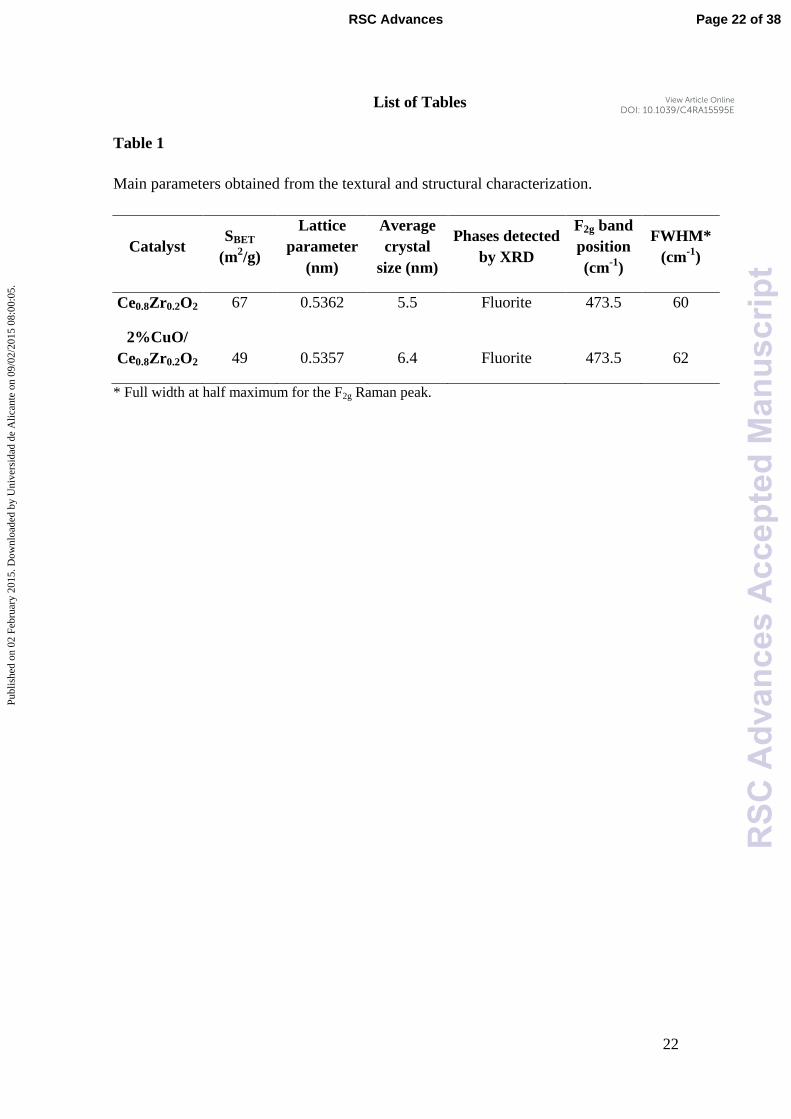
Table 1
Main parameters obtained from the textural and structural characterization.
Catalyst SBET
(m2/g)
Lattice
parameter
(nm)
Average
crystal
size (nm)
Phases detected
by XRD
F2g band
position
(cm-1
)
FWHM*
(cm-1
)
Ce0.8Zr0.2O2 67 0.5362 5.5 Fluorite 473.5 60
2%CuO/
Ce0.8Zr0.2O2 49 0.5357 6.4 Fluorite 473.5 62
* Full width at half maximum for the F2g Raman peak.
Page 22 of 38RSC Advances
RS
CA
dvan
ces
Acc
epte
dM
anus
crip
t
Publ
ishe
d on
02
Febr
uary
201
5. D
ownl
oade
d by
Uni
vers
idad
de
Alic
ante
on
09/0
2/20
15 0
8:00
:05.
View Article OnlineDOI: 10.1039/C4RA15595E

23
List of Figures
Fig. 1. XRD patterns for the catalysts (fluorite phase reflections are shown in
parentheses).
Fig. 2. Raman spectra of the catalysts (inset: zoom for 2%CuO/Ce0.8Zr0.2O2 sample
spectrum).
Fig. 3. Pictures (a) Whole filter, previous to its fragmentation. (b) External cross section
of the filter. (c) Inner cross section of the filter. (d) Longitudinal cross section of the
remaining filter.
Fig. 4. Micrographs of the structured substrate: (a) 250x, (b) 45x and (c) 250x.
Fig. 5. Micrographs of the external cross section of a loaded DPF: (a) 70x , (b) 250x
and (c) 2000x.
Fig. 6. Micrographs of the inner cross section of a loaded DPF: (a) 35x, (b) 90x and (c)
90x.
Fig. 7. Morphology of the coated catalyst. View of the channel surface: (a) 45x, (b)
100x and (c) 1000x.
Fig. 8. Morphology of the coated catalyst. View of the channel surface: (a) 45x, (b)
100x and (c) 1000x.
Fig. 9. SEM-chemical mapping analysis of the left channel showed in Figure 7a and 8a:
(a) SEM picture, (b) Si (red)-Ce (green)-Zr (blue) analysis, (c) Ce analysis (green) and
(d) Si analysis (red).
Fig. 10. SEM-chemical mapping analysis of the right channel showed in Figure 7a and
8a: (a) SEM picture, (b) Si (red)-Ce (green)-Zr (blue) analysis, (c) Ce analysis (green)
and (d) Si analysis (red).
Fig. 11. NO2 production profiles under TPR conditions. Solid lines: successive cycles
with the same loaded DPF (1st – 4
th).
Fig. 12. Soot combustion curves versus temperature for different soot/catalyst ratios
(inset: the detail at low and medium temperatures).
Page 23 of 38 RSC Advances
RS
CA
dvan
ces
Acc
epte
dM
anus
crip
t
Publ
ishe
d on
02
Febr
uary
201
5. D
ownl
oade
d by
Uni
vers
idad
de
Alic
ante
on
09/0
2/20
15 0
8:00
:05.
View Article OnlineDOI: 10.1039/C4RA15595E

24
Fig. 13. Soot combustion curves versus temperature under TPR conditions for different
catalytic configurations (soot/catalyst ratio 1:5).
Fig. 14. NO2 slip profiles in TPR soot combustion experiments.
Page 24 of 38RSC Advances
RS
CA
dvan
ces
Acc
epte
dM
anus
crip
t
Publ
ishe
d on
02
Febr
uary
201
5. D
ownl
oade
d by
Uni
vers
idad
de
Alic
ante
on
09/0
2/20
15 0
8:00
:05.
View Article OnlineDOI: 10.1039/C4RA15595E

25
Figure 1.
Page 25 of 38 RSC Advances
RS
CA
dvan
ces
Acc
epte
dM
anus
crip
t
Publ
ishe
d on
02
Febr
uary
201
5. D
ownl
oade
d by
Uni
vers
idad
de
Alic
ante
on
09/0
2/20
15 0
8:00
:05.
View Article OnlineDOI: 10.1039/C4RA15595E

26
Figure 2.
Page 26 of 38RSC Advances
RS
CA
dvan
ces
Acc
epte
dM
anus
crip
t
Publ
ishe
d on
02
Febr
uary
201
5. D
ownl
oade
d by
Uni
vers
idad
de
Alic
ante
on
09/0
2/20
15 0
8:00
:05.
View Article OnlineDOI: 10.1039/C4RA15595E

27
Figure 3.
1 cm a
b
1 cm
c
1 cm
Left edge of the
DPF
Right edge of the
DPF
d
1 cm
Page 27 of 38 RSC Advances
RS
CA
dvan
ces
Acc
epte
dM
anus
crip
t
Publ
ishe
d on
02
Febr
uary
201
5. D
ownl
oade
d by
Uni
vers
idad
de
Alic
ante
on
09/0
2/20
15 0
8:00
:05.
View Article OnlineDOI: 10.1039/C4RA15595E

28
Figure 4.
200 μm
a
200 μm
c
1 mm
b
Page 28 of 38RSC Advances
RS
CA
dvan
ces
Acc
epte
dM
anus
crip
t
Publ
ishe
d on
02
Febr
uary
201
5. D
ownl
oade
d by
Uni
vers
idad
de
Alic
ante
on
09/0
2/20
15 0
8:00
:05.
View Article OnlineDOI: 10.1039/C4RA15595E

29
Figure 5.
20 μm
c
200 μm
b
500 μm
a
Page 29 of 38 RSC Advances
RS
CA
dvan
ces
Acc
epte
dM
anus
crip
t
Publ
ishe
d on
02
Febr
uary
201
5. D
ownl
oade
d by
Uni
vers
idad
de
Alic
ante
on
09/0
2/20
15 0
8:00
:05.
View Article OnlineDOI: 10.1039/C4RA15595E

30
Figure 6.
500 μm
a
500 μm
c
1 mm
b
Page 30 of 38RSC Advances
RS
CA
dvan
ces
Acc
epte
dM
anus
crip
t
Publ
ishe
d on
02
Febr
uary
201
5. D
ownl
oade
d by
Uni
vers
idad
de
Alic
ante
on
09/0
2/20
15 0
8:00
:05.
View Article OnlineDOI: 10.1039/C4RA15595E

31
Figure 7.
50 μm
c
500 μm
b
1 mm
a
Page 31 of 38 RSC Advances
RS
CA
dvan
ces
Acc
epte
dM
anus
crip
t
Publ
ishe
d on
02
Febr
uary
201
5. D
ownl
oade
d by
Uni
vers
idad
de
Alic
ante
on
09/0
2/20
15 0
8:00
:05.
View Article OnlineDOI: 10.1039/C4RA15595E

32
Figure 8.
50 μm
c
500 μm
b
1 mm
a
Page 32 of 38RSC Advances
RS
CA
dvan
ces
Acc
epte
dM
anus
crip
t
Publ
ishe
d on
02
Febr
uary
201
5. D
ownl
oade
d by
Uni
vers
idad
de
Alic
ante
on
09/0
2/20
15 0
8:00
:05.
View Article OnlineDOI: 10.1039/C4RA15595E

33
Figure 9.
c d
a b
Page 33 of 38 RSC Advances
RS
CA
dvan
ces
Acc
epte
dM
anus
crip
t
Publ
ishe
d on
02
Febr
uary
201
5. D
ownl
oade
d by
Uni
vers
idad
de
Alic
ante
on
09/0
2/20
15 0
8:00
:05.
View Article OnlineDOI: 10.1039/C4RA15595E

34
Figure 10.
a b
c d
Page 34 of 38RSC Advances
RS
CA
dvan
ces
Acc
epte
dM
anus
crip
t
Publ
ishe
d on
02
Febr
uary
201
5. D
ownl
oade
d by
Uni
vers
idad
de
Alic
ante
on
09/0
2/20
15 0
8:00
:05.
View Article OnlineDOI: 10.1039/C4RA15595E

35
Figure 11.
Page 35 of 38 RSC Advances
RS
CA
dvan
ces
Acc
epte
dM
anus
crip
t
Publ
ishe
d on
02
Febr
uary
201
5. D
ownl
oade
d by
Uni
vers
idad
de
Alic
ante
on
09/0
2/20
15 0
8:00
:05.
View Article OnlineDOI: 10.1039/C4RA15595E

36
Figure 12.
Page 36 of 38RSC Advances
RS
CA
dvan
ces
Acc
epte
dM
anus
crip
t
Publ
ishe
d on
02
Febr
uary
201
5. D
ownl
oade
d by
Uni
vers
idad
de
Alic
ante
on
09/0
2/20
15 0
8:00
:05.
View Article OnlineDOI: 10.1039/C4RA15595E

37
Figure 13.
Page 37 of 38 RSC Advances
RS
CA
dvan
ces
Acc
epte
dM
anus
crip
t
Publ
ishe
d on
02
Febr
uary
201
5. D
ownl
oade
d by
Uni
vers
idad
de
Alic
ante
on
09/0
2/20
15 0
8:00
:05.
View Article OnlineDOI: 10.1039/C4RA15595E

38
Figure 14.
Page 38 of 38RSC Advances
RS
CA
dvan
ces
Acc
epte
dM
anus
crip
t
Publ
ishe
d on
02
Febr
uary
201
5. D
ownl
oade
d by
Uni
vers
idad
de
Alic
ante
on
09/0
2/20
15 0
8:00
:05.
View Article OnlineDOI: 10.1039/C4RA15595E