Embed Size (px)
Citation preview

VIETNAM MACRO ECONOMICS
VietNamAssociationofSecuritiesBusiness– VASBHieu Nguyen – Head of Surveillance Committee
Tokyo, Nov 2017

2
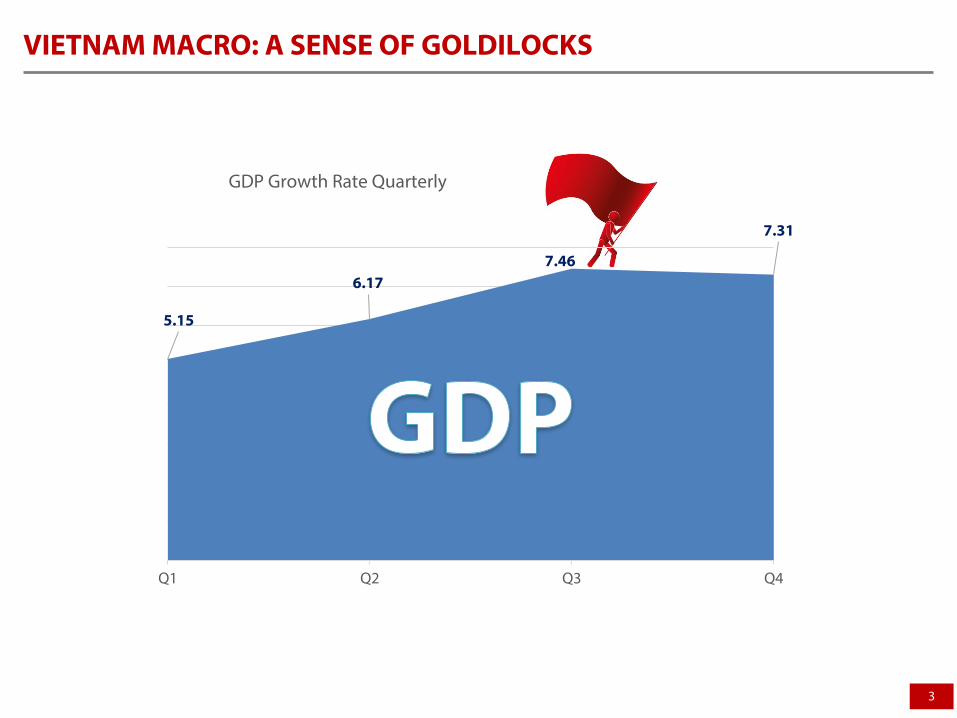
VIETNAM MACRO: A SENSE OF GOLDILOCKS
8.48
6.18
5.32
6.78
5.89
5.035.42
5.986.68
6.21
2007 2008 2009 2010 2011 2012 2013 2014 2015 2016
3
VIETNAM MACRO: A SENSE OF GOLDILOCKS
5.15
6.177.46
7.31
Q1 Q2 Q3 Q4
GDP Growth Rate Quarterly

4
VIETNAM MACRO: A SENSE OF GOLDILOCKS
1.9
0.6
4.7
4 4
2014 2015 2016 2017F 2018F
CPI
21405
22540 22790 2290023400
20000
21000
22000
23000
24000
2014 2015 2016 2017F 2018F
FX RATE

5
VIETNAM MACRO: A SENSE OF GOLDILOCKS
- The government supports private sector
- Policy consistency:
• Monetary policy
• Faster NPL resolution.
• Push SOE reform.
• Encourage technology and innovation.
• Infrastructure development
• FDI increasing
• Positive growth in consumer spending

6
GROWTH DRIVERSFDI: Boost Economic Growth
Source: Customs, GSO, RongViet Research
- 5.0
10.0
15.0
20.0
25.0
2011
2012
2013
2014
2015
2016
9M20
17
FDI Commitments (USD bn)
Implemented capital Registered capital
Registered: USD 25,4 bil. Disbursed: USD 12,5 bil.
Korea 6.31 Japan
5.91Singapore
4.14

7
GROWTH DRIVERSFDI: Temporary Solution to Boost Economic Growth
Vietnam Openness
Exports
Investment
Labors
FDI
+21.4%
+15.0%
+7.5%
Domestic
+17.5%
+16.2%
1.6%
SOE
na
+6.1%
-3.6%
%YoY
Source: GSO, Customs, RongViet Research
Growth of Each Sectors in 9M2017
Trade/GDP (%) Export/GDP (%) Import/GDP (%)%Contribution of
FDI to Export%Contribution of FDI to Investment
%Contribution of FDI to GDP
%Contribution of FDI to Labors
2014 160.2 80.5 79.7 62.7 21.7 16.4 3.92015 169.9 83.9 86.0 68.3 23.3 17.0 4.22016 174.5 87.6 86.9 70.1 23.4 18.0 4.3

8
GROWTH DRIVERS
Source: GSO, Customs, RongViet Research* Decree No. 19 on solutions to improve the business environment and enhance Vietnam’s competitive capacity from 2016 to 2017 with a vision to 2020.
Private Sector
0%
10%
20%
30%
40%
2010 2011 2012 2013 2014 2015 2016 9M2017
Investment GrowthState capital Private capital
0
2
4
6
8
10
12
-
20000.0
40000.0
60000.0
80000.0
100000.0
120000.0
2012 2013 2014 2015 2016 9M2017
Business Activities
New established (LHS) Avg. registered capital (VND bn)
New Established 94.000 Shut down 58.000 Re - Established 21.100

9
GROWTH DRIVERS
Vietnam Rubber GroupNatural Rubber
Q4/2017
Binh Son RefineryOil&Gas11/2017
PV PowerUtility
12/2017
PV Oil Oil&GasQ4/2017
VinaFood 2Agriculture
2017
ConstructionSong Da CorpConstruction
2017
Power Generation CorpUtility2017
Vietnam Mobile Telecom ServicesTelecom
2018
A holding company 04/2018
VinamilkConsumer Goods
10/2017
Hanoi Beer JSCConsumer Goods
Q4/2017
Saigon Beer JSCConsumer Goods
Q4/2017
SOE Reform:• Vietnam aims to equitize 137 additional SOEs in 2017-2020, Divestment from SOEs will get USD11 billion.

10
Key Macro Indicators
Source: GSO, RongViet Research
2014 2015 2016 2017F 2018F
ECONOMIC GROWTH 5.98% 6.68% 6.21% 6.40% 6.60%
TRADE BALANCE (USD B) +1.5 -4.1 +1.5 -5.2 -7.6
EXPORT GROWTH 11.6% 8.1% 9.0% 20.0% 13.2%
IMPORT GROWTH 15.9% 12.0% 5.3% 24.0% 14.0%
INFLATION 1.9% 0.6% 4.7% 4.0% 4.0%
REFINANCING RATE 6.5% 6.5% 6.5% 6.25% 6.25%
M2 GROWTH 16.0% 14.5% 18.4% 16.0% 16.0%
CREDIT GROWTH 12.6% 17.3% 18.3% 20.0% 18.0%
BUDGET DEFICIT/GDP 4.7% 4.6% 3.9% 3.5% 3.5%
EXCHANGE RATE 21,405 22,540 22,790 22,900 23,400

11
Challenges
High Public Debt #65% GDP Low Productivity External impacts

12
Key Macro Indicators
Source: GSO, RongViet Research
2014 2015 2016 2017F 2018F
ECONOMIC GROWTH 5.98% 6.68% 6.21% 6.40% 6.60%
TRADE BALANCE (USD B) +1.5 -4.1 +1.5 -5.2 -7.6
EXPORT GROWTH 11.6% 8.1% 9.0% 20.0% 13.2%
IMPORT GROWTH 15.9% 12.0% 5.3% 24.0% 14.0%
INFLATION 1.9% 0.6% 4.7% 4.0% 4.0%
REFINANCING RATE 6.5% 6.5% 6.5% 6.25% 6.25%
M2 GROWTH 16.0% 14.5% 18.4% 16.0% 16.0%
CREDIT GROWTH 12.6% 17.3% 18.3% 20.0% 18.0%
BUDGET DEFICIT/GDP 4.7% 4.6% 3.9% 3.5% 3.5%
EXCHANGE RATE 21,405 22,540 22,790 22,900 23,400

THANK YOU!