Embed Size (px)
Citation preview

Chapter 17
Viet Nam Country Report
September 2016
This chapter should be cited as
Bao, N. (2016), ‘Republic of Korea Country Report’ in Kimura, S. and P. Han
(eds.) in Energy Outlook and Energy Saving Potential in East Asia 2016. ERIA
Research Project Report 2015-5, Jakarta: ERIA, pp.337-354.

C h a p t e r 1 7
Viet Nam Country Report
NGUYEN MINH BAO, CENTER FOR RENEWABLE ENERGY, INSTITUTE OF ENERGY,
VIET NAM
1. Background
iet Nam has a total land area of about 331,111 square kilometres and is
located in the centre of Southeast Asia. In 2013, Viet Nam had a population
of 89.7 million and a gross domestic product (GDP) of US$92.3 billion in 2005 US$
terms. The commercial sector contributed most to Viet Nam’s GDP (43.8 percent),
followed by the industry sector (38.6 percent), and agriculture (17.6 percent). GDP
per capita was US$1,029 in 2005 US$ terms in 2013.
Viet Nam possesses considerable indigenous energy resources. It has 3,390
million tons of proven recoverable reserves of coal, 460 million cubic meters of
crude oil reserves, and 610 billion cubic meters of gas reserves.
Viet Nam’s primary energy supply was 60.1 Mtoe in 2013. Oil represented the
largest share of Viet Nam’s primary energy supply at 27.3 percent; coal was
second at 26.9 percent, followed by natural gas (14.9 percent), hydro (8.2
percent), and ‘others’1 (22.7 percent). Viet Nam is a net exporter of crude oil and
coal but is an importer of petroleum products because of capacity limitations at
the Dung Quat oil refinery (6.5 million tons a year), which is able to meet around
45 percent of domestic demand.
1 ‘Others’ consists of biomass, solar, wind, ocean resources, biofuels, as well as electricity.
V

338
Energy Outlook and Energy Saving Potential in East Asia
Coal is mainly used in the industry sector, with consumption of 16.2 million tons
of oil equivalent (Mtoe) in 2013, whereas natural gas is largely used for electricity
generation.
Viet Nam had around 30.6 GW of installed generating capacity and generated
127.3 TWh of electricity in 2013. Most of Viet Nam’s electricity generation comes
from thermal sources (coal, natural gas, and oil), accounting for 55.2 percent of
total generation, with hydro accounting for 44.7 percent and others for 0.1
percent.
2. Modelling Assumptions
In this outlook, Viet Nam’s GDP is assumed to grow at an average annual rate of
6.0 percent from 2013 to 2040. Growth is projected to be faster in the first part of
the outlook period, increasing by 6.8 percent per year between 2013 and 2020.
For the remaining periods of 2020–2030 and 2030–2040, the country’s economic
growth will be slightly reduced at annual rates of 6.2 percent per year and 5.2
percent per year, respectively. Population growth is projected to increase at the
much slower rate of 0.7 percent per year between 2013 and 2040.
The share of electricity generated from coal-fired power plants is projected to
increase considerably, at the expense of other energy types (thermal and hydro).
Viet Nam is expected to increase its imports of electricity, particularly from Lao
PDR and China.
The use of nuclear energy is assumed to start in 2028, in line with Viet Nam’s
revised nuclear power development plan. In the Business-as-Usual scenario (BAU),
it is assumed that the first unit of nuclear power with a capacity of 1,200 MW will
be installed in 2028 and will be followed by a second unit and a third unit of
nuclear power with total capacity of 2,300 MW and 3,500 MW in 2029 and 2030,
respectively.

339
Viet Nam Country Report
Viet Nam’s energy saving goals are estimated at 3–5 percent of total energy
consumption, equivalent to 5 Mtoe, between 2006 and 2010, and 5–8 percent of
total energy consumption, equivalent to 13.1 Mtoe, between 2010 and 2015, in
line with the national target on energy efficiency and conservation (EEC). Beyond
2015, Viet Nam’s energy saving goals are assumed to follow the trend of earlier
periods.
The energy savings goals are expected to be attained through the
implementation of energy efficiency programmes in the industry, transport,
residential, and commercial sectors on the demand side.
On the supply side, energy efficiency improvement in power generation,
development of nuclear power, and renewable energy technologies, particularly
small hydro, wind, and biomass are expected to come online intensively since
2014, in line with the master plan on renewable energy development.
From the above analysis, the Alternative Policy Scenarios (APS) proposed are as
follows: the EEC scenario (APS1); improvement of energy efficiencies in power
generation (APS2); development of renewable energy (APS3); and further
development of nuclear power plants (APS4).
APS1: EEC Scenarios on the demand side, including:
o EEC1: Using EEC measures in the industrial sector to achieve 5–8 percent of
energy reduction from 2013 to 2015 and 12 percent by 2040.
o EEC2: Switching from diesel oil to compressed natural gas (CNG) in
transportation and using efficient motorbikes in road transport.
o EEC3: Replacing inefficient devices with efficient devices in the residential
sector, such as improved coal cooking stoves, compact fluorescent lamp in
lighting, and efficient refrigerators and air conditioners in residential
cooling.
o EEC4: Using EEC measures in the commercial sector to reduce electricity
consumption by 12 percent by 2040.
APS2: Improvement of energy efficiency in thermal power plants:

340
Energy Outlook and Energy Saving Potential in East Asia
It assumes that efficiencies of coal, natural gas, and residue fuel oil thermal
power plants will increase to 42 percent, 45 percent, and 37 percent,
respectively, by 2040, compared with 37 percent, 40 percent, and 32 percent,
respectively, in the BAU, while natural gas with combined cycle gas turbine
technologies will increase to 55 percent by 2040 compared with 52 percent in
the BAU.
APS3: Development of renewable energy technologies:
Installed electricity generating capacity from renewable energy is assumed to
reach 35,800 MW in 2040, with solar PV contributing 16,000 MW, wind 10,000
MW, small hydro 5,600 MW, biomass 4,000 MW, and biogas 200 MW.
Moreover, Viet Nam has considered the use of biofuels to reduce dependency
on oil and curb carbon dioxide (CO2) emissions. According to the Prime
Minister’s decision 177/2007/QD–TTg approving the master plan on biofuel
development, Viet Nam is assumed to produce 1.8 million tons and 2.0 million
tons of biofuels in 2035 and in 2040, respectively.
APS4: Maximum nuclear power development:
The installed capacity of nuclear power plants is expected to reach a further
9,500 MW and 15,500 MW under the APS scenario by 2035 and 2040,
respectively, compared with only 3,500 by 2030 in the BAU.
APS5: Combining all APSs from APS1 to APS4.
3. Outlook Results
3.1. Business-as-Usual (BAU) Scenario
3.1.1. Final energy consumption
Viet Nam’s final energy consumption increased at an average annual rate of 5.1
percent from 1990 to 2013, from 16.1 Mtoe to 50.5 Mtoe. The fastest growth
occurred in the transport sector (9.2 percent per year), followed by the industrial
sector (6.5 percent), and the residential/commercial (‘others’) sector (2.8 percent).
Non-energy use increased at an average rate of 19.6 percent per year.

341
Viet Nam Country Report
From 2013 to 2040, final energy consumption is projected to increase at an
average rate of 4.2 percent per year under the BAU, driven by strong economic
growth, assumed to average 6.0 percent per year, and population growth of 0.7
percent per year. The strongest growth in consumption is projected to occur in
the industry sector, increasing by 5.1 percent per year, followed by the
transportation sector (4.6 percent), and the residential/commercial (‘others’)
sector (2.3 percent). Non-energy use is expected to increase by 5.7 percent per
year (Figure 17-1).
Figure 17-1. Final Energy Consumption by Sector, BAU
BAU = Business-as-Usual scenario; Mtoe = million tons of oil equivalent.
Source: Author’s calculation.
The bulk of the country’s energy consumption, or about 63.0 percent in 1990,
comes from the residential/commercial (‘others’) sector, where biomass fuel used
for residential cooking takes the dominant share of the sector. This share is on a
strongly decreasing trend, to 37.5 percent by 2013 and 22.8 percent by 2040 due
to the substitution of biomass fuels by commercial fuels with higher efficiency.
The decreasing share of the sector is also due in part to the growing economy.
The impact of economic growth will translate to an improvement in standards of
living, thus promoting the transition from biomass fuels to the commercial fuels.
From 2013 to 2040, the industrial sector tends to be the largest consuming sector
in Viet Nam. The share of energy consumption in the industrial sector will
increase from 38.4 percent in 2013 to 49.1 percent in 2040. The second biggest
-
20.00
40.00
60.00
80.00
100.00
120.00
140.00
160.00
1990 2000 2013 2020 2030 2040
Mto
e
Industry Transportation Others Non-energy
342
Energy Outlook and Energy Saving Potential in East Asia
consumer is the transport sector, although its share will increase slowly from 20.7
percent in 2013 to 23.1 percent in 2040.
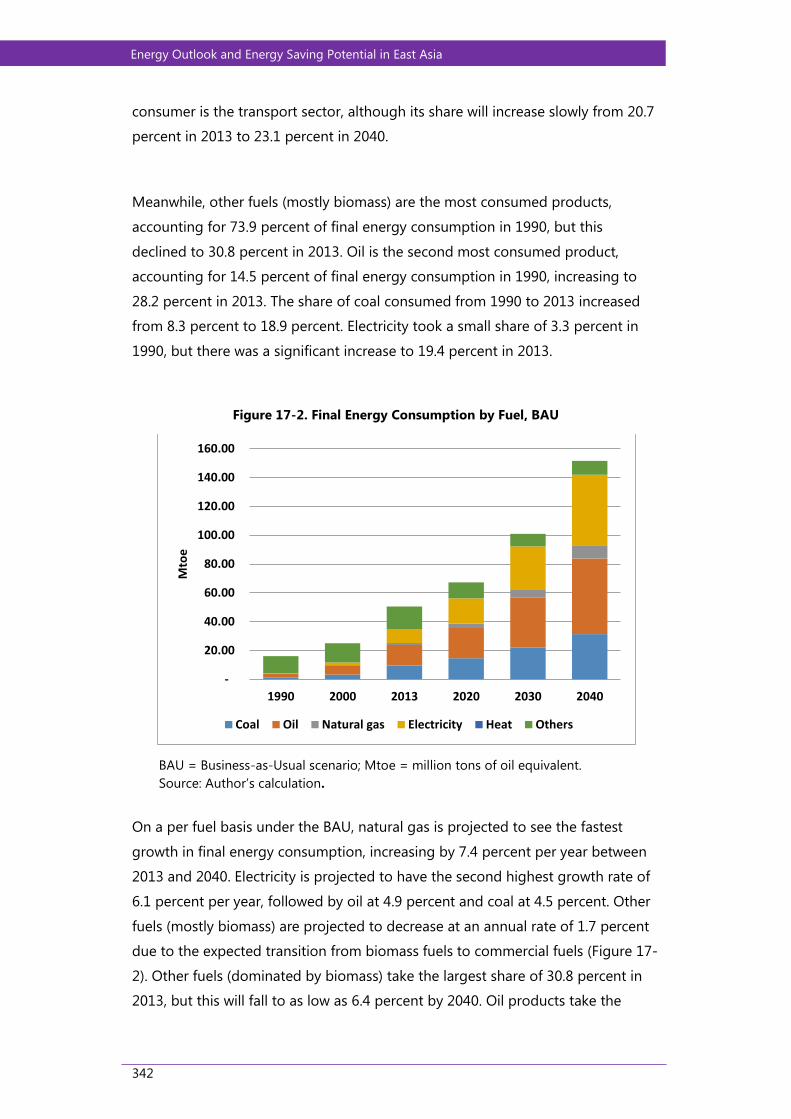
Meanwhile, other fuels (mostly biomass) are the most consumed products,
accounting for 73.9 percent of final energy consumption in 1990, but this
declined to 30.8 percent in 2013. Oil is the second most consumed product,
accounting for 14.5 percent of final energy consumption in 1990, increasing to
28.2 percent in 2013. The share of coal consumed from 1990 to 2013 increased
from 8.3 percent to 18.9 percent. Electricity took a small share of 3.3 percent in
1990, but there was a significant increase to 19.4 percent in 2013.
Figure 17-2. Final Energy Consumption by Fuel, BAU
BAU = Business-as-Usual scenario; Mtoe = million tons of oil equivalent.
Source: Author’s calculation.
On a per fuel basis under the BAU, natural gas is projected to see the fastest
growth in final energy consumption, increasing by 7.4 percent per year between
2013 and 2040. Electricity is projected to have the second highest growth rate of
6.1 percent per year, followed by oil at 4.9 percent and coal at 4.5 percent. Other
fuels (mostly biomass) are projected to decrease at an annual rate of 1.7 percent
due to the expected transition from biomass fuels to commercial fuels (Figure 17-
2). Other fuels (dominated by biomass) take the largest share of 30.8 percent in
2013, but this will fall to as low as 6.4 percent by 2040. Oil products take the
-
20.00
40.00
60.00
80.00
100.00
120.00
140.00
160.00
1990 2000 2013 2020 2030 2040
Mto
e
Coal Oil Natural gas Electricity Heat Others

343
Viet Nam Country Report
second largest share of 28.2 percent in 2013 and this share is projected to
increase to 34.6 percent in 2040. The third largest share of demand is electricity,
which is projected to increase from 19.4 percent in 2013 to 32.2 percent in 2040.
Coal and natural gas are used primarily in the industry sector with shares of 18.9
percent and 2.7 percent, respectively, in 2013; and their shares are expected to
increase to 20.7 percent and 6.1 percent, respectively, in 2040.
3.1.2. Primary energy supply
Primary energy supply in Viet Nam grew at a faster rate than final energy
consumption, increasing by 5.4 percent per year or by 3.4 times from 17.9 Mtoe
in 1990 to 60.1 Mtoe in 2013. Among the major energy sources, the fastest
growing were natural gas, hydro, coal, and oil. Natural gas consumption grew at
an average annual rate of 41.6 percent from 1990 to 2013, whereas hydro, coal,
and oil grew at 10.8 percent, 9.0 percent, and 8.1 percent per year, respectively.
In the BAU, Viet Nam’s primary energy supply is projected to increase at an
average annual rate of 4.8 percent or by 3.5 times from 60.1 Mtoe in 2013 to
212.9 Mtoe in 2040. The fastest growth is expected in natural gas, increasing at an
annual average rate of 6.5 percent between 2013 and 2040, followed by coal, oil,
and hydro at 6.3 percent, 5.1 percent, and 2.9 percent, respectively, whereas other
fuels (mostly biomass) will decrease strongly, by 4.7 percent per year (Figure 17-
3). Oil accounted for the largest share 27.3 percent, of the primary energy supply
in 2013 and this is projected to increase slightly to 29.5 percent in 2040.
The share of coal was 26.9 percent in 2013 and will increase to 39.3 percent in
2040. Natural gas accounted for a share of 14.9 percent in 2013 and is projected
to increase to 23.1 percent in 2040. These growth rates are due to the projected
decline of hydro and ‘others,’ the shares of which are projected to decline from
8.2 percent to 5.0 percent and from 22.7 percent to 1.8 percent, respectively.

344
Energy Outlook and Energy Saving Potential in East Asia
Figure 17-3. Primary Energy Supply, BAU
BAU = Business-as-Usual scenario; Mtoe = million tons of oil equivalent.
Source: Author’s calculation.
3.1.3. Power generation
Power generation output increased by 12.4 percent per year or by 14.7 times,
from 8.7 TWh in 1990 to 127.3 TWh in 2013. The fastest growth occurred in
natural gas power generation (47.1 percent per year), followed by coal (12.0 per
cent), and hydropower (10.8 percent). These high growth rates are due to the
decrease of oil by 3.8 percent per year. (Figure 17-4)
To meet electricity demand under the BAU, power generation is projected to
increase at an average rate of 5.9 percent per year, or by 4.7 times, from 2013 to
2040. The fastest growth will be in coal power generation (8.2 percent per year),
followed by ‘others’ (mostly small hydropower generation) (6.9 percent), natural
gas (6.6 per cent), and hydro-power generation (2.9 percent).
By the end of 2013, most of the country’s power requirement was met by
hydropower, which comprised about 44.7 percent of the total power generation
mix. The share of natural gas power generation was around 33.7 percent, and the
rest was from coal and oil power generation.
-
50.00
100.00
150.00
200.00
250.00
1990 2000 2013 2020 2030 2040
Mto
e
Coal Oil Natural gas Nuclear Hydro Geothermal Others

345
Viet Nam Country Report
Figure 17-4. Power Generation by Type of Fuel, BAU
BAU = Business-as-Usual scenario; TWh = terawatt-hour.
Source: Author’s calculation.
In the BAU, natural gas will be the major fuel for power generation from 2030 to
2040, with its share projected to increase from 33.3 percent in 2030 to 39.8
percent in 2040, whereas the share of hydro in total power generation will decline
from 32.9 percent to around 20.8 percent.
3.1.4. Energy indicators
Viet Nam’s energy intensity was on a decreasing trend from 1990 to 2013. Both
primary and final energy intensities fell from 1,006 and 905 toe/million 2005 US$
in 1990 to 651 and 547 toe/million 2005 US$ in 2013, respectively. This was
mainly due to high economic growth, which resulted in significant reductions in
biomass fuels used for cooking in the residential sector, although the energy
requirement in the industrial sector and transport sector increased strongly
during that period. The final energy intensity under the BAU is estimated to
continue its decreasing trend, falling from 547 to 338 toe/million 2005 US$ by
2040, which provides a good indication that energy for economic development
will be used efficiently in the forecast period.
-
100.00
200.00
300.00
400.00
500.00
600.00
700.00
1990 2000 2013 2020 2030 2040
TWh
Coal Oil Natural gas Nuclear Hydro Geothermal Others

346
Energy Outlook and Energy Saving Potential in East Asia
Primary energy per capita increased from 0.27 toe/person in 1990 to 0.67
toe/person in 2013 and is forecast to increase to 1.99 toe/person in 2040. This
indicates that people’s living standards and incomes will increase, resulting in an
increase in primary energy supply per capita.
Regarding greenhouse gas (GhG) emissions, CO2 intensity and CO2 per unit of
energy increased from 1990 to 2013, from 265 t-C/million 2005 US$ and 0.26 t-
C/toe in 1990 to 389 t-C/million 2005 US$ and 0.6 t-C/toe in 2013, respectively. In
the BAU, CO2 intensity and CO2 per unit of energy are also forecast to increase up
to 2020, to 400 t-C/million 2005 US$ and 0.69 t-C/toe, respectively. Beyond 2020,
CO2 intensity will decline to 376 t-C/million 2005 US$ in 2040, whereas CO2 per
energy will maintain its slight increase reaching around 0.79 t-C/toe. CO2 per
capita remains on an increasing trend due to energy demand increasing faster
than the population (Figure 17-5).
Figure 17-5. Energy Indicators
CO2 = carbon dioxide.
Source: Author’s calculation.
347
Viet Nam Country Report
3.2. Energy Saving and CO2 Emissions Reduction Potential
3.2.1. Final energy consumption
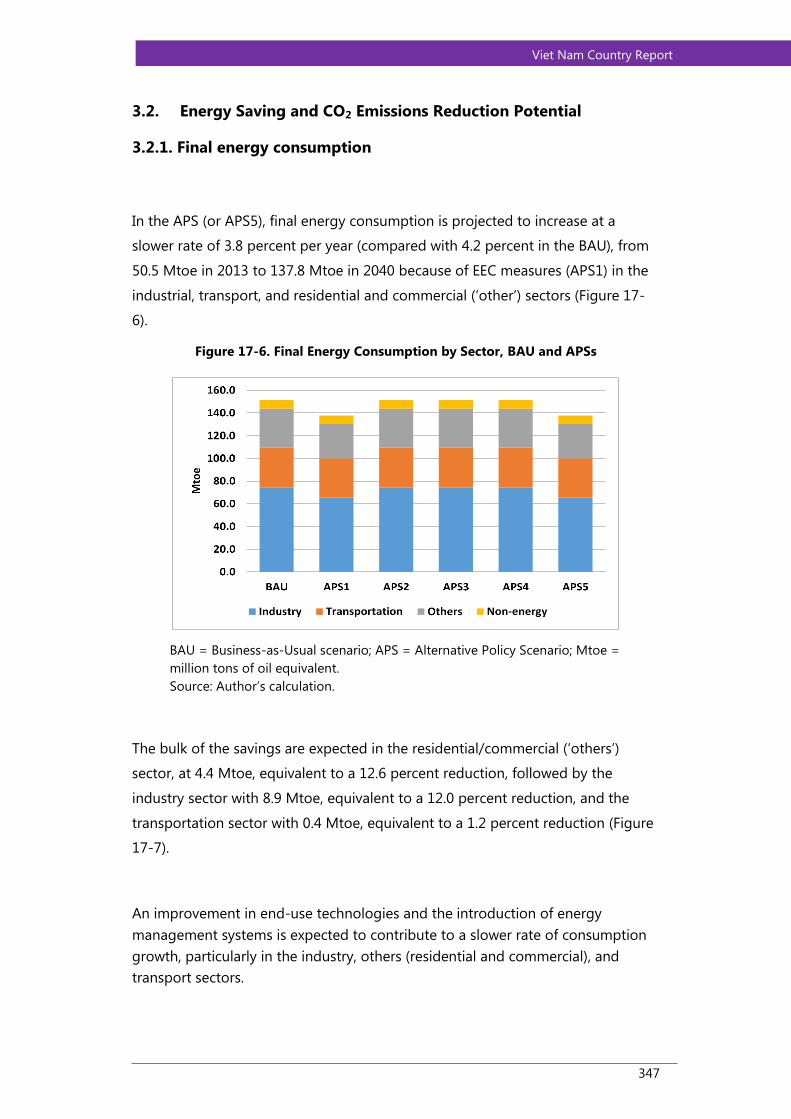
In the APS (or APS5), final energy consumption is projected to increase at a
slower rate of 3.8 percent per year (compared with 4.2 percent in the BAU), from
50.5 Mtoe in 2013 to 137.8 Mtoe in 2040 because of EEC measures (APS1) in the
industrial, transport, and residential and commercial (‘other’) sectors (Figure 17-
6).
Figure 17-6. Final Energy Consumption by Sector, BAU and APSs
BAU = Business-as-Usual scenario; APS = Alternative Policy Scenario; Mtoe =
million tons of oil equivalent.
Source: Author’s calculation.
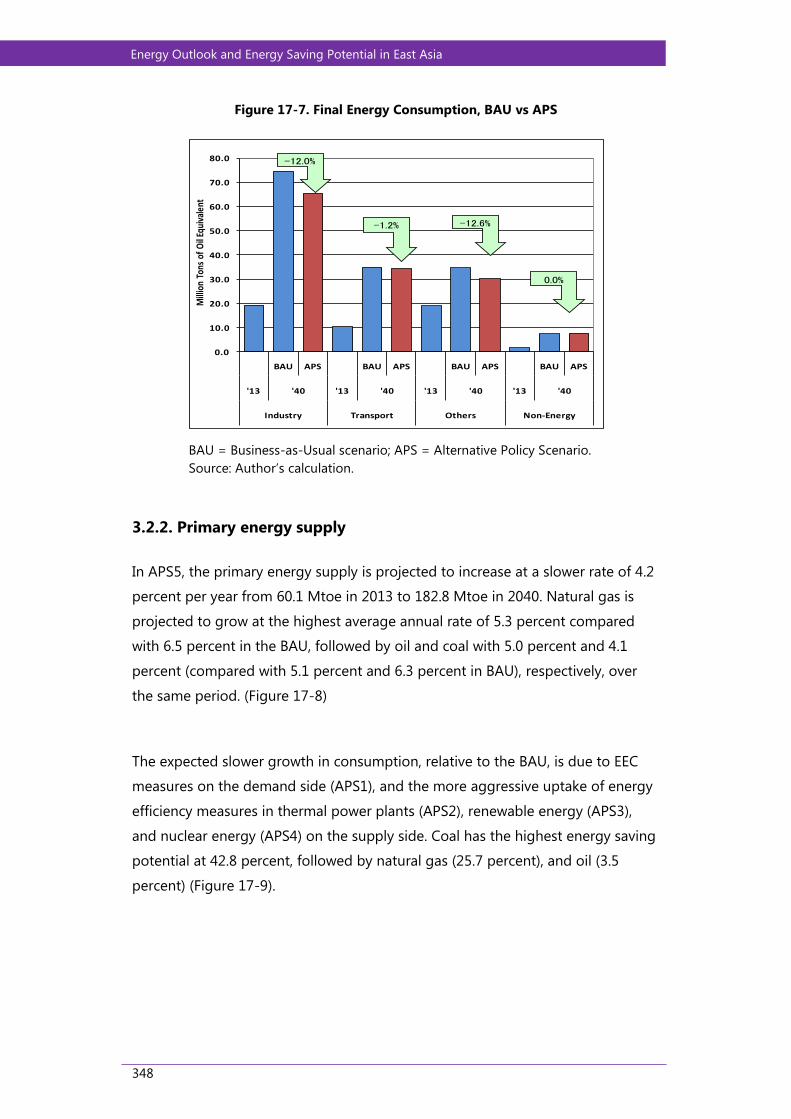
The bulk of the savings are expected in the residential/commercial (‘others’)
sector, at 4.4 Mtoe, equivalent to a 12.6 percent reduction, followed by the
industry sector with 8.9 Mtoe, equivalent to a 12.0 percent reduction, and the
transportation sector with 0.4 Mtoe, equivalent to a 1.2 percent reduction (Figure
17-7).
An improvement in end-use technologies and the introduction of energy
management systems is expected to contribute to a slower rate of consumption
growth, particularly in the industry, others (residential and commercial), and
transport sectors.
348
Energy Outlook and Energy Saving Potential in East Asia
Figure 17-7. Final Energy Consumption, BAU vs APS
BAU = Business-as-Usual scenario; APS = Alternative Policy Scenario.
Source: Author’s calculation.
3.2.2. Primary energy supply
In APS5, the primary energy supply is projected to increase at a slower rate of 4.2
percent per year from 60.1 Mtoe in 2013 to 182.8 Mtoe in 2040. Natural gas is
projected to grow at the highest average annual rate of 5.3 percent compared
with 6.5 percent in the BAU, followed by oil and coal with 5.0 percent and 4.1
percent (compared with 5.1 percent and 6.3 percent in BAU), respectively, over
the same period. (Figure 17-8)
The expected slower growth in consumption, relative to the BAU, is due to EEC
measures on the demand side (APS1), and the more aggressive uptake of energy
efficiency measures in thermal power plants (APS2), renewable energy (APS3),
and nuclear energy (APS4) on the supply side. Coal has the highest energy saving
potential at 42.8 percent, followed by natural gas (25.7 percent), and oil (3.5
percent) (Figure 17-9).
0.0
10.0
20.0
30.0
40.0
50.0
60.0
70.0
80.0
BAU APS BAU APS BAU APS BAU APS
'13 '40 '13 '40 '13 '40 '13 '40
Industry Transport Others Non-Energy
Mill
ion
Tons
of
Oil
Equi
vale
nt
-12.0%
-1.2% -12.6%
0.0%

349
Viet Nam Country Report
The total savings are expected to amount to 30.1 Mtoe, equivalent to 14.2
percent of Viet Nam’s total primary energy supply in 2040 (Figure 17-10).
Figure 17-8. Primary Energy Supply by Fuel, BAU and APSs
BAU = Business-as-Usual scenario; APS = Alternative Policy Scenario; Mtoe = million
tons of oil equivalent.
Source: Author’s calculation.
Figure 17-9. Primary Energy Saving Potential by Fuel, BAU vs APS
BAU = Business-as-Usual scenario; APS = Alternative Policy Scenario.
Source: Author’s calculation.
0.0
50.0
100.0
150.0
200.0
250.0
BAU APS1 APS2 APS3 APS4 APS5
Mto
e
Coal Oil Natural gas Nuclear Hydro Geothermal Others
0.0
10.0
20.0
30.0
40.0
50.0
60.0
70.0
80.0
90.0
BAU APS BAU APS BAU APS BAU APS
'13 '40 '13 '40 '13 '40 '13 '40
Coal Oil Gas Others
Mill
ion
Tons
of
Oil
Equi
vale
nt
118.1%
-3.5%
-25.7%
-42.8%

350
Energy Outlook and Energy Saving Potential in East Asia
Figure 17-10. Evolution of Primary Energy Supply, BAU and APS
BAU = Business-as-Usual scenario; APS = Alternative Policy Scenario; Mtoe =
million tons of oil equivalent.
Source: Author’s calculation.
3.2.3. CO2 reduction potential
CO2 emissions from energy consumption under the BAU are projected to increase
by 5.9 percent per year from 35.9 million metric ton of carbon (Mt-C) in 2013 to
168.2 Mt-C in 2040. In APS5, the annual increase in CO2 emissions between 2013
and 2040 is projected to be 4.5 percent a year, which is 1.4 percentage points
lower than in the BAU.
The expected CO2 emission reduction is derived mostly from EEC measures on
the demand side (APS1). Moreover, improvement of energy efficiency in thermal
power plants (APS2), development of renewable energy technologies (APS3), and
maximum nuclear power development (APS4) also contributed significantly to the
projected CO2 reduction (Figure 17-11).
0.0
50.0
100.0
150.0
200.0
250.0
BAU APS
1990 2013 2040
Mill
ion
To
ns
of O
il Eq
uiv
alen
t
30.1Mtoe,-14.2%

351
Viet Nam Country Report
Figure 17-11. CO2 Emissions by Fuel, BAU and APSs
CO2 = carbon dioxide; BAU = Business-as-Usual scenario; APS = Alternative Policy
Scenario; Mtoe = million tons of oil equivalent; Mt-C = million tons of carbon.
Source: Author’s calculation.
CO2 emissions under the APS will be around 49.7 Mt-C lower, equal to a 29.6
percent reduction, in 2040, indicating that Viet Nam’s energy saving goals and
action plans are very effective in reducing CO2 emissions (Figure 17-12).
Figure 17-12. Evolution of CO2 Emissions, BAU and APS
BAU = Business-as-Usual scenario; APS = Alternative Policy Scenario; Mt-C =
million tons of carbon.
Source: Author’s calculation.
0.0
50.0
100.0
150.0
200.0
BAU APS1 APS2 APS3 APS4 APS5
Mt-
C
Coal Oil Natural Gas
0.0
20.0
40.0
60.0
80.0
100.0
120.0
140.0
160.0
180.0
BAU APS
1990 2013 2040
Mill
ion
To
ns
of C
arb
on
49.7Mt-C,-29.6%

352
Energy Outlook and Energy Saving Potential in East Asia
4. Key Findings and Policy Implications
The above analysis of Viet Nam’s energy saving potential generates the following
key findings:
Energy demand in Viet Nam is expected to continue to grow at a significant
rate, driven by robust economic growth, industrialisation, urbanisation, and
population growth. EEC measures have the potential to contribute to meeting
expected higher demand in a sustainable manner.
Viet Nam’s energy intensity, which is among the highest in the world,
indicates a high saving potential. However, the energy saving potential
derived from Viet Nam’s EEC goals (30.1 Mtoe) seems to be modest
compared with its potential.
Electricity demand will increase with the highest annual growth rate of 6.1
percent in the BAU, whereas it is projected to decline by 5.6 percent in the
APS. This decline is an indication that the planned EEC measures will be
effective in reducing electricity demand. However, the electricity saving
potential is still large, particularly in the residential and commercial sectors.
Coal thermal power plants will be the major power generators in Viet Nam in
the coming years. Their share of total of power generation output is expected
to increase continuously from 21.1 percent in 2013 to 37.4 percent in 2040 in
the BAU. This is the area with the largest energy saving and GhG mitigation
potential in Viet Nam.
EEC scenarios on the demand side are most effective compared with other
proposed scenarios on energy saving as is GhG emissions reduction.
Based on the above findings, the following actions are recommended for effective
implementation of EEC measures in Viet Nam:
Establishment of new targets and a road map for EEC
implementation: Energy demand in Viet Nam in the BAU is expected to
continue to grow at a significant rate in the coming years and EEC
scenarios on the demand side are most effective compared with other
proposed scenarios on energy saving as well as GhG emissions reduction.
Therefore, EEC activities need to be strengthened through updating and
setting new overall targets for individual sectors for 2016–2025 for the

353
Viet Nam Country Report
national EEC programme, as well as preparation of specific road maps to
achieve these targets.
Compulsory energy labelling for electrical appliances: Annual growth
of electricity demand is projected at the second highest rate of 6.1
percent in the BAU, especially demand for electricity in the residential and
commercial (others) sectors. Therefore, compulsory energy labelling for
electrical appliances is an effective management measure for energy
saving.
Priority for development of advanced coal thermal power
technology: Coal thermal power plants will be the major power
generators in Viet Nam up to 2040. Therefore, the existing thermal power
plants needs to be retrofitted to improve the efficiency of power
generation and energy-efficient technologies should be prioritised for
new coal thermal power plants development.
Priority for renewable energy development: Coal power generation is
projected to have the dominant share in the coming years, which will
make Viet Nam reliant on coal imports for power generation. Renewable
energy technology-based power generation is an important factor in
achieving energy independence, energy security, and GhG abatement.
Therefore, it is necessary to put in place support policies and mechanisms
to promote renewable energy development.

354
Energy Outlook and Energy Saving Potential in East Asia
References
General Statistic Office (2013), Statistical Yearbook of Viet Nam, 2013.
Law on Energy Savings and Conservation, 2010.
General Statistics Office (2011), Viet Nam Population Forecasts 2009–2049.
Institute of Energy (2015), Revised Power Development Plan for the Period of 2011–2020
with Perspective to 2030.
Decision 79/2006/QD–TTg dated 14 April 2006 of the Prime Minister Approving the
National Target Program on Energy Savings and Conservation.
Decision 177/2007/QD–TTg dated 20 November 2007 of the Prime Minister
Approving the Master Plan on Biofuel Development Until 2015 with
Perspective of 2025.