Embed Size (px)
Citation preview
CSIT6910A Independent Project
Fall 2011
Video Gallery Visualization
Based on HTML5
Student: ZHAO Yue
Email:[email protected]
Supervisor: Prof. David Rossiter
Video Gallery Visualization Based on HTML5
Contents 1. Introduction ................................................................................................................................... 3
2. Background ................................................................................................................................... 3
3. Visualization .................................................................................................................................. 4
3.1 Still frames to ‘real’ motion ................................................................................................ 4 3.2 Sorting algorithm to animation ........................................................................................... 4
4. Implementation ............................................................................................................................. 6
4.1 Overview ............................................................................................................................. 6 4.2 Architecture of the program ................................................................................................ 7 4.3 Specific Details ................................................................................................................... 8
4.3.1 Browser Support ...................................................................................................... 8 4.3.2 Interactive audios ..................................................................................................... 8 4.3.3 Partial sorting ........................................................................................................... 8 4.3.4 Transition playback .................................................................................................. 9
5. Shortcut ....................................................................................................................................... 10
6. Conclusions ................................................................................................................................. 11
7. References ................................................................................................................................... 12
8. Appendix:Minutes .................................................................................................................... 13
Video Gallery Visualization Based on HTML5
1. Introduction
Human machine interaction has fundamentally changed the way that people think about
computation. It’s about patterns, not bits. To discover trends inside massive data, both human
knowledge and computer calculation play as factors. On the other hand, making media much
more tangible is becoming a challenging goal as user experience plays such a paramount role
in cutting-edge product design. One awesome concept in this area is visualizing information.
The application we implement provides users interactive video summaries in web pages.
The remaining chapters in the beginning illustrate some background germane to user interface
and HTML5, secondly discuss the methods applied to visualize the progress of sorting videos
by different principles, then in chapter 3 we depicts the requirements of setting up the system
and related operation, the last chapter describes the scenarios which can make use of this
project and concludes the improvement and limitation.
2. Background
Surrounded by overload information, people nowadays need powerful tools to tease out
essence of data. Moreover, statistics are complicated and arduous. When it comes to how to
let clients get engaged, it is the insightful perspectives the system offers that may make a
difference. Traditional analytic tools, in general, create diagrams to give a brief view of the
distribution. Compared to numbers and characters, pictures are able to convey messages and
there are a lot of cheerful research results.
For instance, Microsoft Silverlight Pivot Viewer Control [1] is released as a stunning way to
browse web database. Each metadata is displayed in the form of high-resolution content and
Video Gallery Visualization Based on HTML5
interaction model allows users explore large quantities of information with natural transition.
Another example is a website called WebVizBench, which created experience to let music
fans search historical airplay data while putting HTML5’s fabulous features to the test.
There is no doubt that audience get longer engagement when viewing visual dataset. Actually,
we can push it further by replacing the images with videos. Compared with a playlist form, a
diagram of pictures is compelling, and a wall of moving video previews is tremendously
gorgeous.
The difficulty is that most video players do not provide flexible position attributes, thus we
need to build new controls for drawing pixels instead of using existed APIs. Thanks to
HTML5 canvas [3], this idea is feasible.
3. Visualization
3.1 Still frames to ‘real’ motion
For video data, there is no need to insert middle samples because the eye system cannot detect
the intervals in time as long as the number of frames is greater than or equal to 12. Due to this
illusion, our application copy one frame from the video file to the canvas at a time and update
the canvas 25 times per second. The parameter 25 is adjusted to the frame rate of the video.
3.2 Sorting algorithm to animation
In computer science, there are plenty of sorting algorithms. But they are designed in the way
Video Gallery Visualization Based on HTML5
of how machines operate memory units, not close to the way of how human brains rank
elements intuitively. Suppose there are a mount of cards, computers permute them by reading
the input list and doing some calculation to work out the output list; we human normally
move disordered card to its target position and job done. Our steps of combining these two
ways together are as follows:
1) Record the origin coordinates of every item
2) Let the computer finish reordering and map the output list to a target coordinates list
3) Divide the difference of target coordinates and origin coordinates by transition rate, the
result is an offset vector which leads the item to its target position.
4) Add the vector to the current coordinates when the canvas refreshes
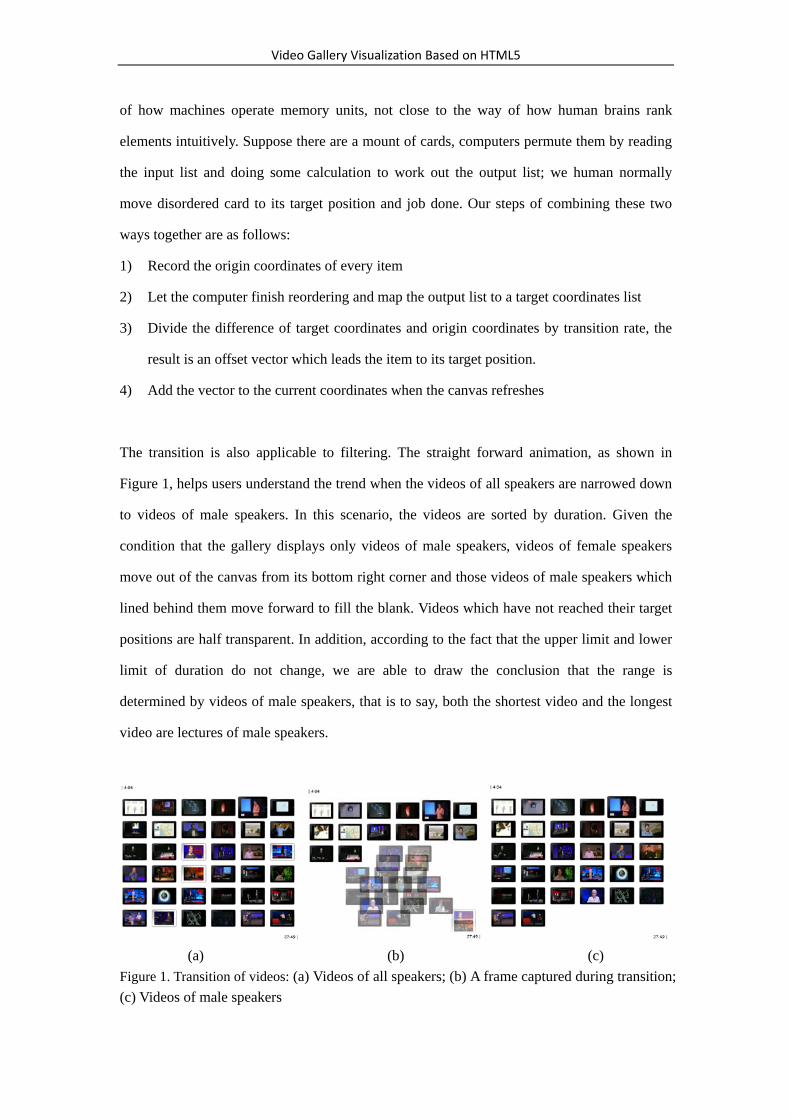
The transition is also applicable to filtering. The straight forward animation, as shown in
Figure 1, helps users understand the trend when the videos of all speakers are narrowed down
to videos of male speakers. In this scenario, the videos are sorted by duration. Given the
condition that the gallery displays only videos of male speakers, videos of female speakers
move out of the canvas from its bottom right corner and those videos of male speakers which
lined behind them move forward to fill the blank. Videos which have not reached their target
positions are half transparent. In addition, according to the fact that the upper limit and lower
limit of duration do not change, we are able to draw the conclusion that the range is
determined by videos of male speakers, that is to say, both the shortest video and the longest
video are lectures of male speakers.
(a) (b) (c)
Figure 1. Transition of videos: (a) Videos of all speakers; (b) A frame captured during transition; (c) Videos of male speakers
Video Gallery Visualization Based on HTML5
Besides, photo frames or tags can be placed on the videos to distinguish different categories.
Videos related to female speakers are in white iPad frame, while videos related to male
speakers are in black iPad frame. By doing so, even if the camera turned to slides or audience,
users can identify the gender of the speaker.
4. Implementation
4.1 Overview
Generally, the website needs a webpage for layout, a java script for functions and media files.
Static database can be included in the script, while dynamic database requires complex access
methods. Cascading Style Sheets is optional for presentation.
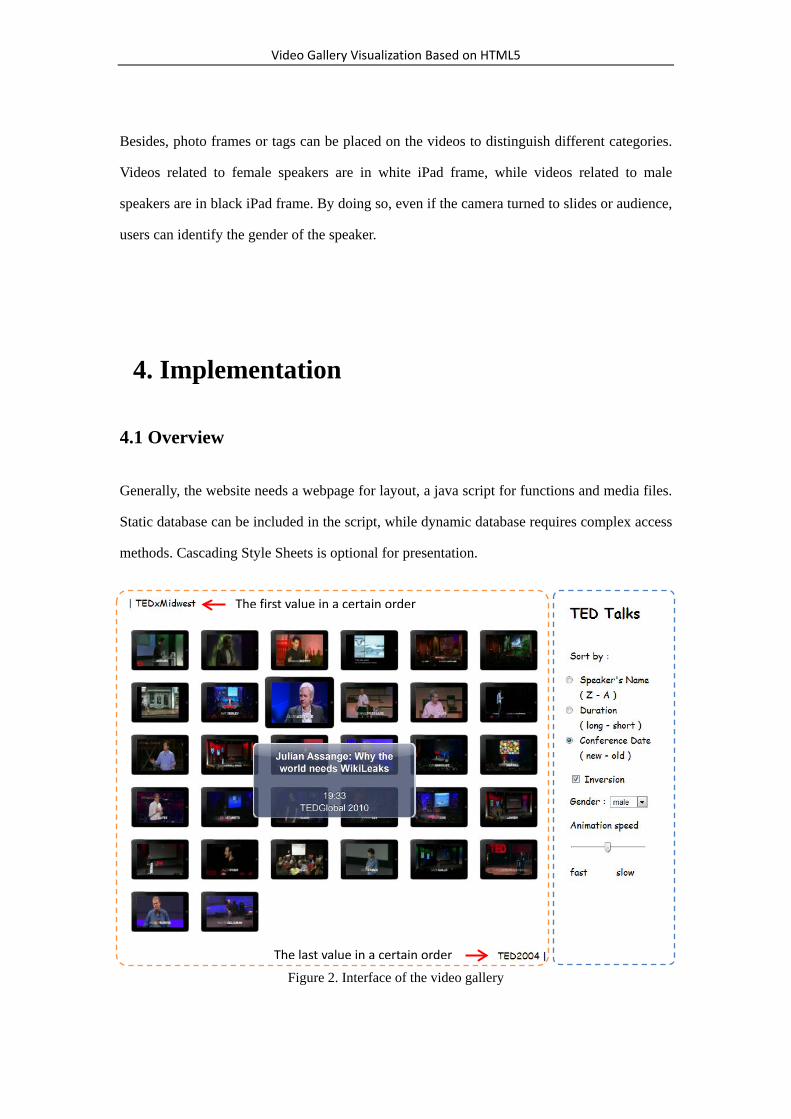
Figure 2. Interface of the video gallery
The last value in a certain order
The first value in a certain order
Video Gallery Visualization Based on HTML5
Figure 2 shows the main user interface, it consists of two parts, video displaying area and info
exploring panel. The former is in charge of providing visual playlist and plaintext details,
while the latter is in charge of offering sorting and filtering controls. The detail of an item will
pops up when we hold the item.
4.2 Architecture of the program
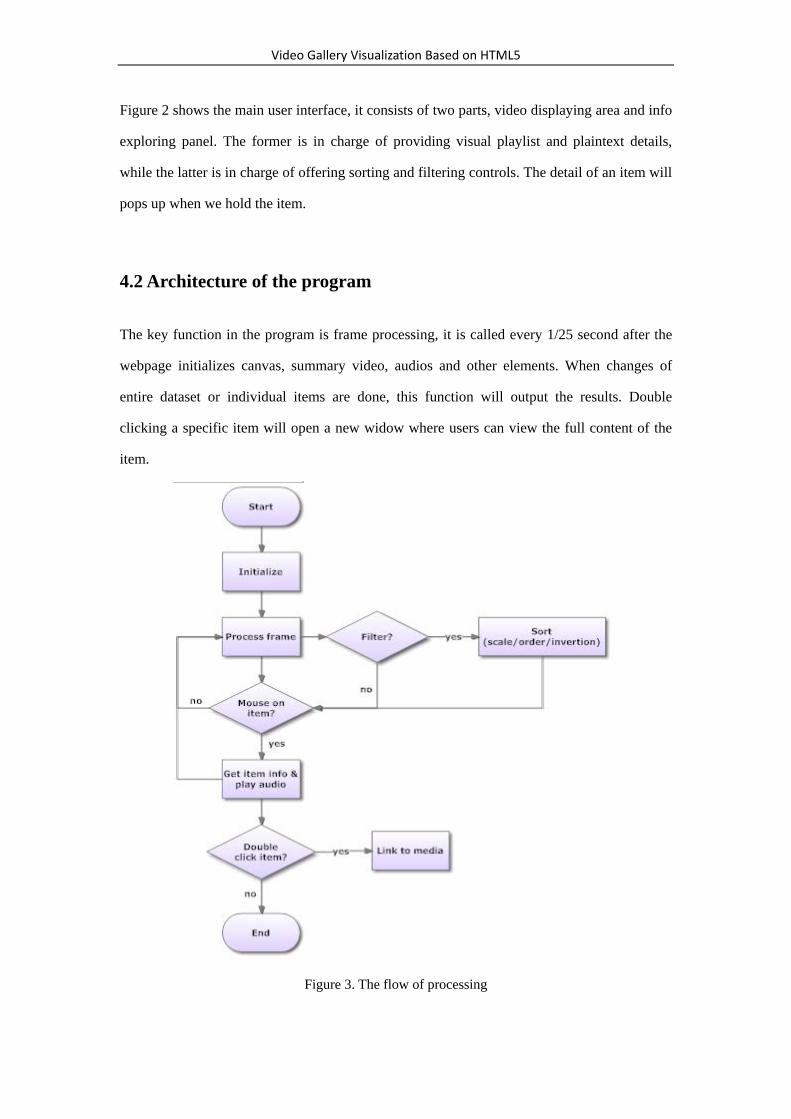
The key function in the program is frame processing, it is called every 1/25 second after the
webpage initializes canvas, summary video, audios and other elements. When changes of
entire dataset or individual items are done, this function will output the results. Double
clicking a specific item will open a new widow where users can view the full content of the
item.
Figure 3. The flow of processing
Video Gallery Visualization Based on HTML5
4.3 Specific Details
4.3.1 Browser Support
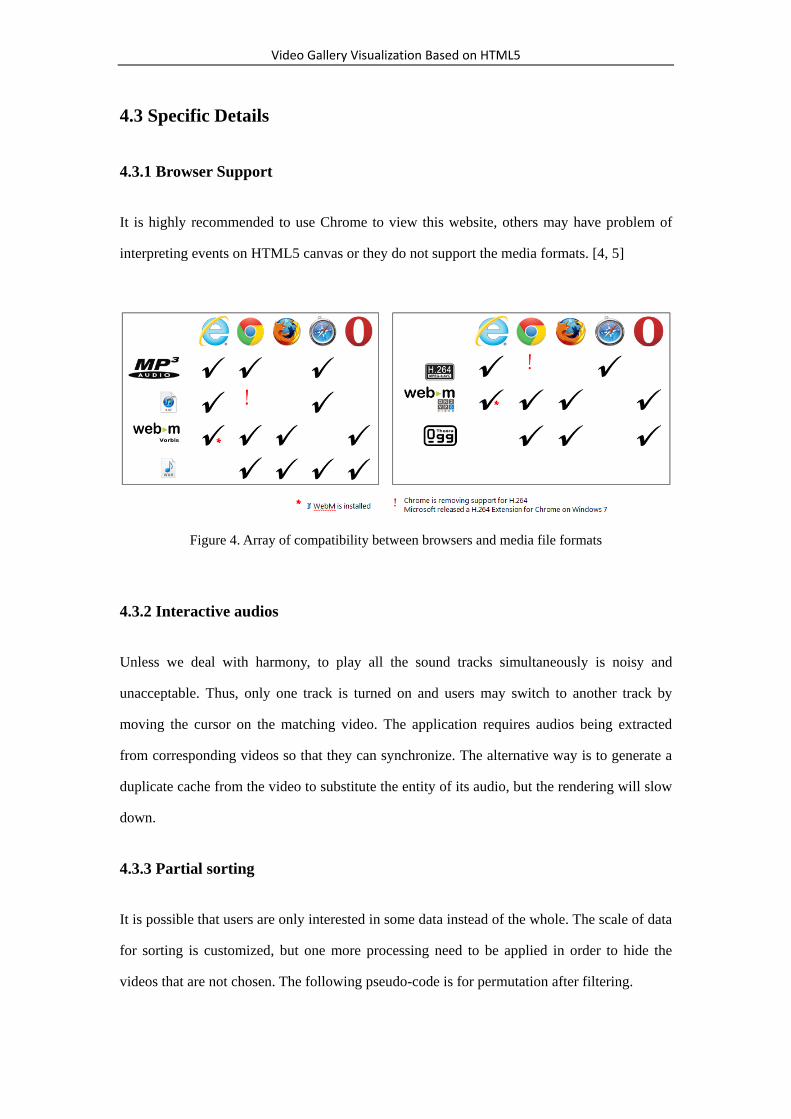
It is highly recommended to use Chrome to view this website, others may have problem of
interpreting events on HTML5 canvas or they do not support the media formats. [4, 5]
Figure 4. Array of compatibility between browsers and media file formats
4.3.2 Interactive audios
Unless we deal with harmony, to play all the sound tracks simultaneously is noisy and
unacceptable. Thus, only one track is turned on and users may switch to another track by
moving the cursor on the matching video. The application requires audios being extracted
from corresponding videos so that they can synchronize. The alternative way is to generate a
duplicate cache from the video to substitute the entity of its audio, but the rendering will slow
down.
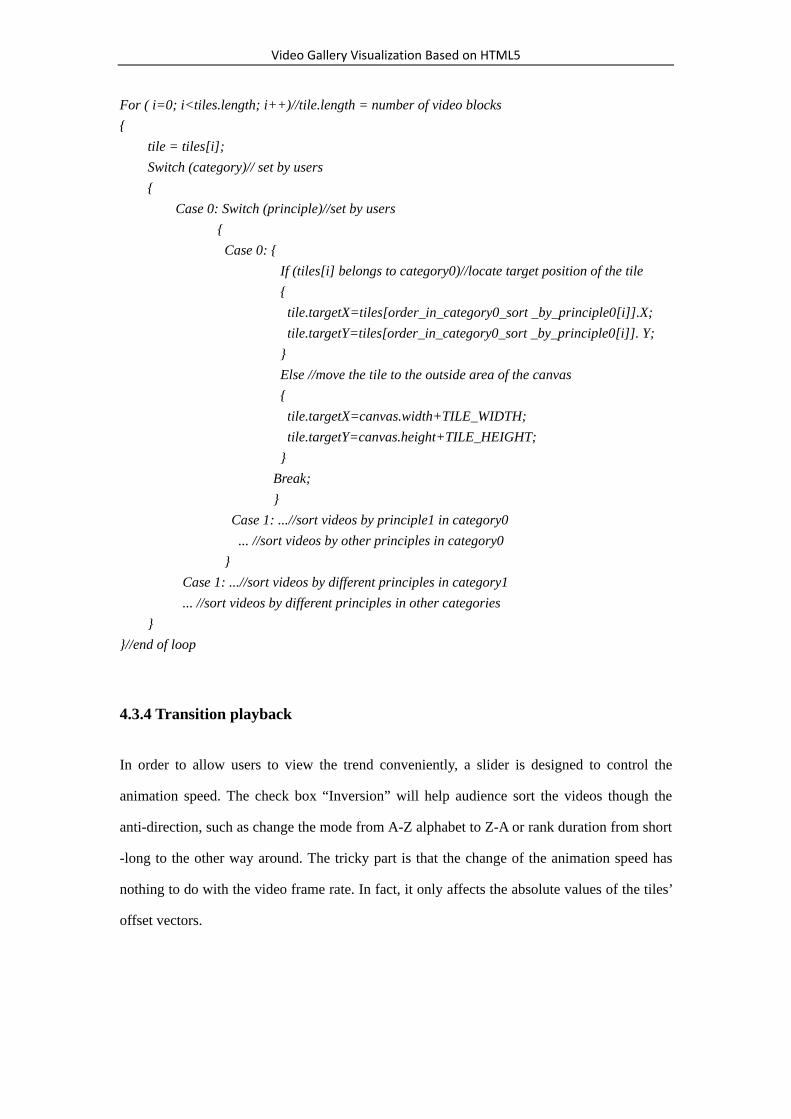
4.3.3 Partial sorting
It is possible that users are only interested in some data instead of the whole. The scale of data
for sorting is customized, but one more processing need to be applied in order to hide the
videos that are not chosen. The following pseudo-code is for permutation after filtering.
Video Gallery Visualization Based on HTML5
For ( i=0; i<tiles.length; i++)//tile.length = number of video blocks { tile = tiles[i]; Switch (category)// set by users
{ Case 0: Switch (principle)//set by users
{ Case 0: {
If (tiles[i] belongs to category0)//locate target position of the tile {
tile.targetX=tiles[order_in_category0_sort _by_principle0[i]].X; tile.targetY=tiles[order_in_category0_sort _by_principle0[i]]. Y;
} Else //move the tile to the outside area of the canvas {
tile.targetX=canvas.width+TILE_WIDTH; tile.targetY=canvas.height+TILE_HEIGHT; } Break; }
Case 1: ...//sort videos by principle1 in category0 ... //sort videos by other principles in category0
} Case 1: ...//sort videos by different principles in category1 ... //sort videos by different principles in other categories } }//end of loop
4.3.4 Transition playback
In order to allow users to view the trend conveniently, a slider is designed to control the
animation speed. The check box “Inversion” will help audience sort the videos though the
anti-direction, such as change the mode from A-Z alphabet to Z-A or rank duration from short
-long to the other way around. The tricky part is that the change of the animation speed has
nothing to do with the video frame rate. In fact, it only affects the absolute values of the tiles’
offset vectors.
Video Gallery Visualization Based on HTML5
5. Shortcut
This project is a proof of a concept and we need to take real world limitations into
consideration. The performance of rendering engine limits the quantity of videos playing
simultaneously. It is not feasible to ask users to upgrade their hardware and network.
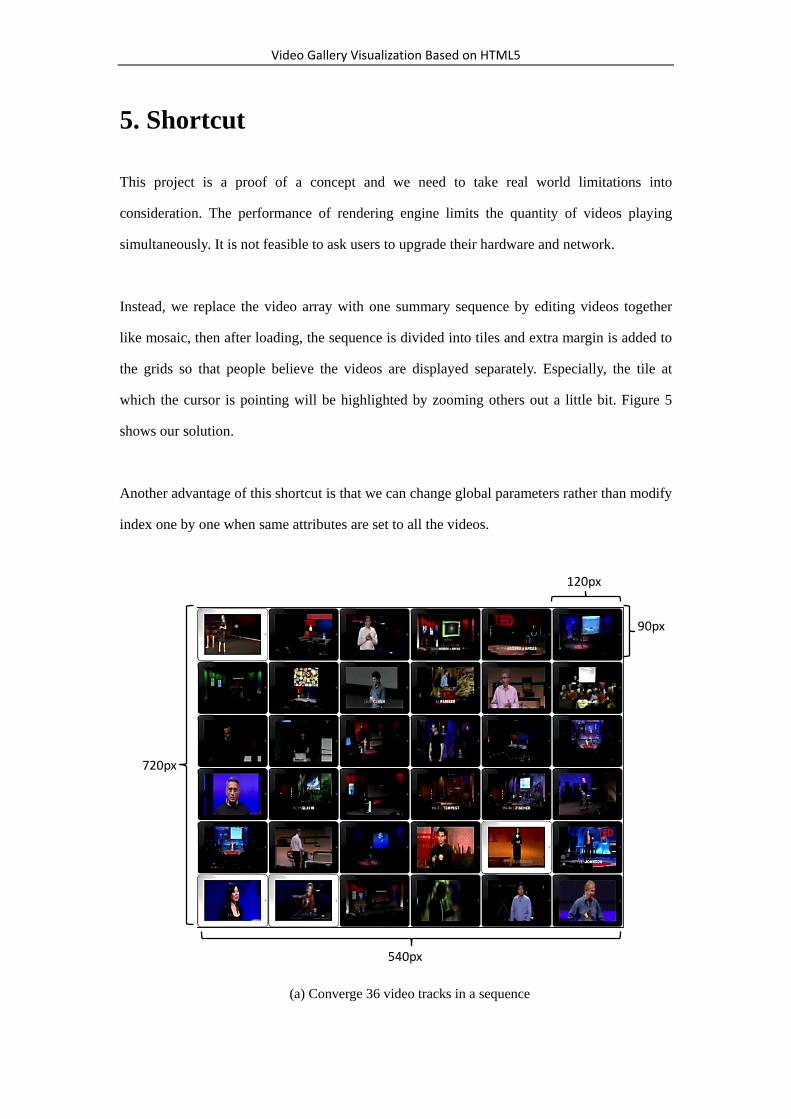
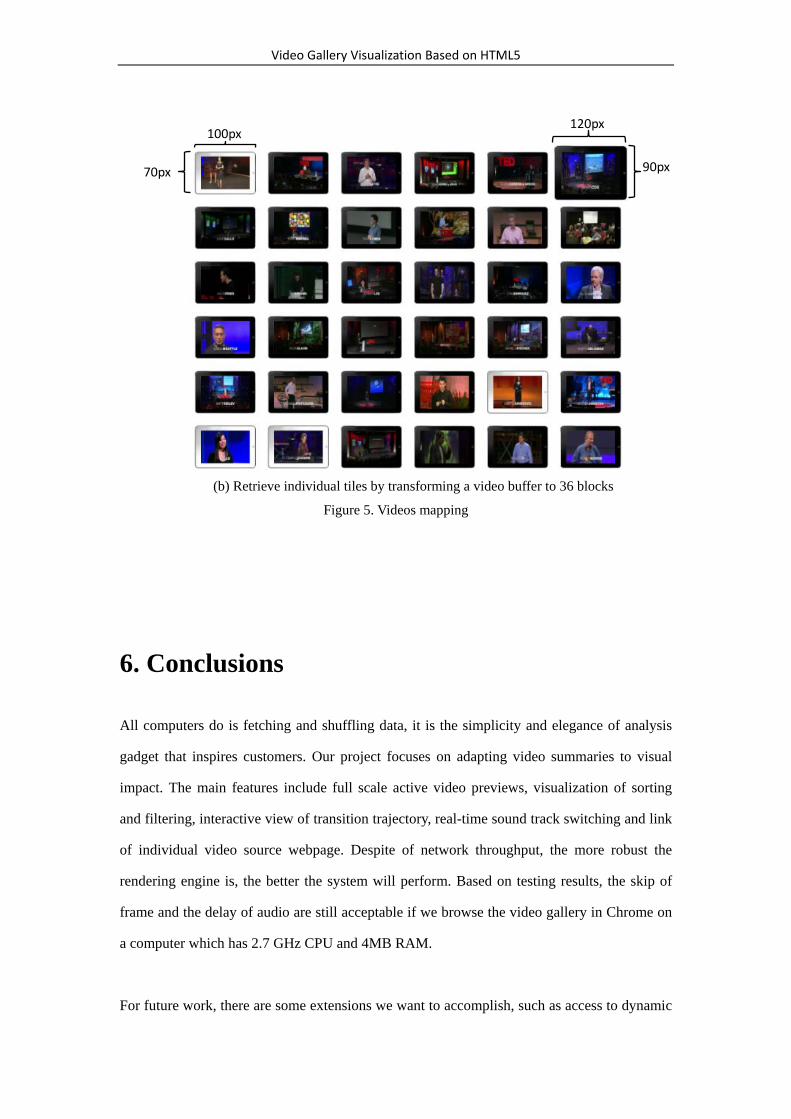
Instead, we replace the video array with one summary sequence by editing videos together
like mosaic, then after loading, the sequence is divided into tiles and extra margin is added to
the grids so that people believe the videos are displayed separately. Especially, the tile at
which the cursor is pointing will be highlighted by zooming others out a little bit. Figure 5
shows our solution.
Another advantage of this shortcut is that we can change global parameters rather than modify
index one by one when same attributes are set to all the videos.
(a) Converge 36 video tracks in a sequence
720px
540px
120px
90px
Video Gallery Visualization Based on HTML5
(b) Retrieve individual tiles by transforming a video buffer to 36 blocks
Figure 5. Videos mapping
6. Conclusions
All computers do is fetching and shuffling data, it is the simplicity and elegance of analysis
gadget that inspires customers. Our project focuses on adapting video summaries to visual
impact. The main features include full scale active video previews, visualization of sorting
and filtering, interactive view of transition trajectory, real-time sound track switching and link
of individual video source webpage. Despite of network throughput, the more robust the
rendering engine is, the better the system will perform. Based on testing results, the skip of
frame and the delay of audio are still acceptable if we browse the video gallery in Chrome on
a computer which has 2.7 GHz CPU and 4MB RAM.
For future work, there are some extensions we want to accomplish, such as access to dynamic
120px
90px
100px
70px
Video Gallery Visualization Based on HTML5
database, extracting previews from videos automatically, manipulating angles and depths of
moving tiles, adding different video effects to help classifying, and hopefully, merging
multi-touch technology with our optimized application to bring the interaction to a whole new
level.
7. References
[1] Pivot Viewer. http://www.silverlight.net/learn/data-networking/pivot-viewer. Retrieved on
November 20, 2011.
[2] WebVizBench. http://webvizbench.com/Default.htm. Retrieved on November 20, 2011.
[3] WIKIPEDIA. http://en.wikipedia.org/wiki/HTML5_canvas. Retrieved on November 20,
2011.
[4] MIX. http://live.visitmix.com/. Retrieved on November 20, 2011.
[4] Peter Lubbers, Brian Albers and Frank Salim. Pro HTML5 programming: powerful APIs
for richer Internet application development. Apress. 2010
[5] Bill Sanders. Smashing HTML5. John Wiley & Sons. 2011
Video Gallery Visualization Based on HTML5
8. Appendix:Minutes
Minutes of the 1st Project Meeting
Date: 26 Sep, 2011 (Monday) Time: 11:00 am Place: Rm. 3512 Attending: Zhao Yue
Prof. David Rossiter Absent: None Recorder: ZHAO Yue 1 Approval of minutes The further target of the project needs to be determined, while the first stage is profiled. With respect to average capability of computers and browsers, the number of the videos displaying at one time is limited up to 100. Since there are few restrictions of HTML 5 audio and video elements, MPEG 4 is selected as the video format and MP3 as the audio format in this case. Animation is designed to show the transmission of video items when sorting method is changed so that some hidden trends are visible. This visual effect will help users discover the pattern that numbers or characters are not able to convey. 2 Discussion Items Things to do: Build the framework of the website in 2 weeks, including a video container, canvas and
sorting methods. Explore potentials of multimedia technology to make the project more impressive. Search for appropriate video resource. 3 Meeting adjournment The meeting was adjourned at 11:25 am.

Video Gallery Visualization Based on HTML5
Minutes of the 2nd Project Meeting
Date: 7 Oct, 2011 (Friday) Time: 10:00 am Place: Rm. 3512 Attending: Zhao Yue
Prof. David Rossiter Absent: None Recorder: ZHAO Yue 1. Approval of minutes The final goal is to complete summaries of talking portraits like the moving pictures gallery at Hogwarts in the film Harry Potter. Each video clip plays a part of the whole mosaic, and every piece can relocate by moving gradually to their target positions. The basic framework and transmission algorithm is generally done, while video URL change should be in progress. Documents also need to be recorded for writing report. 2. Discussion Items Things to do: Edit video clips together as media source for the application. Add more features to enrich user Experience. Test how the limit of bandwidth affects the performance of the project. 3. Meeting adjournment The meeting was adjourned at 10:25 am.
Video Gallery Visualization Based on HTML5
Minutes of the 3rd Project Meeting
Date: 21 Oct, 2011 (Friday) Time: 10:00 am Place: Rm. 3512 Attending: Zhao Yue
Prof. David Rossiter Absent: None Recorder: ZHAO Yue 1. Approval of minutes The web browser support for HTML5 varies. It is not feasible to implement application compatible to all in short term. Some browsers may interpret the control element differently, but the mechanism is identical, so what matters depends on the result not the input format, nor the output format. In a nutshell, Chrome is chosen as the first preference according to relatively better performance. The total size of video and audios is around 1.5 gigabytes. The duration of each track does not to be the same as long as the bottleneck is greater or equal to the duration of the video. This project include no library, the algorithm will be much simple if functions are not encapsulated. 2. Discussion Items Things to do: Adapt the interface to users’ viewing habit. Try to find optimal parameters for the application. Seek for advanced development of the project. 3. Meeting adjournment The meeting was adjourned at 10:25 am.
Video Gallery Visualization Based on HTML5
Minutes of the 4th Project Meeting
Date: 16 Nov, 2011 (Wednesday) Time: 1:30 am Place: Rm. 3512 Attending: Zhao Yue
Prof. David Rossiter Absent: None Recorder: ZHAO Yue 1. Approval of minutes The jump of active detail information makes the application less clever, the words need to be break in a smart way. A few phrases are not appropriate and can mislead users, it is important to express the ideas clearly. To demonstrate the flow of the video diagram, there should be a new section to instruct what real world limitations are. So that the proposed solution manages to cut some corners and react properly to the original display problem. 2. Discussion Items Things to do: Improve the layout of dynamic text. Add proof of concepts to the report. Prepare for the presentation. 3. Meeting adjournment The meeting was adjourned at 1:50 pm.

Video Gallery Visualization Based on HTML5
Minutes of the 5th Project Meeting
Date: 2 Dec, 2011 (Friday) Time: 12:20 am Place: Rm. 3512 Attending: Zhao Yue
Prof. David Rossiter Absent: None Recorder: ZHAO Yue 1. Approval of minutes The project and report are almost finished. The webpage works on different computers using browser Google Chrome, the most updated version is 15.0. The presentation compared the project with other parallel research and slides are straightforward. More details should be provided in the user guide section, so that clients can understand the pattern of the videos and take advantage of the interaction. 2. Discussion Items Things to do: Attach meeting minutes to the report. Add proof of concepts to the report. Make backup files. 3. Meeting adjournment The meeting was adjourned at 12:45 pm.