Embed Size (px)
Citation preview

The U.S. Digital Video BenchmarkADOBE DIGITAL INDEX | Q4 2013

ADOBE DIGITAL INDEX | The U.S. Digital Video Benchmark - Q4 2013
Key takeawaysOnline video viewing• Smartphones overtook tablets for online video
streaming in December 2012, and usage is up 86% year-over-year.
• The introduction of Xbox One and PS4 have streaming from gaming consoles on the rise, up 365% year-over-year.
• Sports video streaming is up 640% year-over-year.
• Over one fourth of video streams on large annual and bi-annual sporting events come from mobile devices.
Social referred video starts• Facebook leads the way with social referred
video starts.
• Half of visits referred from Facebook or Tumblr to sports related sites result in a video view.
TV Everywhere authenticated content• The majority of TV Everywhere content is viewed
on mobile devices, with tablets producing the most at 42%.
• 37% of TV Everywhere content streams are for sporting events.
• iPads, iPhones®, and iPods produce nearly 50% of play requests for TV Everywhere content.
• iPad and iPod users are watching the most TV Everywhere video, consuming over 10 videos per visitor per month, which is two times that of PC users.

ADOBE DIGITAL INDEX | The U.S. Digital Video Benchmark - Q4 2013
Video growth led by mobileOnline video viewing continues to proliferate to mobile, gaming consoles, and apps. The explosion of TV Everywhere authenticated content, integration of video into social channels, and increase of mobile video viewing has created a unique opportunity to reach new viewers who can’t be found on traditional TV channels. Understanding the metrics and trends behind this growth will help advertisers and publishers stay on the cutting edge of online video development and delivery.
Social-referred viewing06 Social media referrals
07 View rates
08 Methodology
09 Appendix
TV Everywhere streams03 Market share
04 Content viewing
05 Audience engagement
Online video consumption01 Mobile share
02 Starts for sporting events
Table of contents

ADOBE DIGITAL INDEX | The U.S. Digital Video Benchmark - Q4 2013
Mobile continues to gain share of video streaming, comprising over 20% in Q4 2013. Smartphones have become the device of choice for mobile video viewing, due in part to the trend of watching sporting highlights in snippets on small screens.
The findings:• Smartphones overtook tablets in early Q1 2013
and are up 86% year-over-year.
• Tablets are growing slower than smartphones, but are still up 23% year-over-year.
• The introduction of Xbox One and PS4 have Gaming consoles on the rise up 365% year-over-year.
The opportunity:With smartphones outpacing tablets for online video viewing , marketers need to ensure that video content is optimized for smartphones.
1
ONLINE VIDEO CONSUMPTION
Mobile share
DECEMBER2013
DECEMBER2012
MOBILE GROWTH OF VIDEO STARTS(DECEMBER 2012 – DECEMBER 2013)
Smartphonevideo starts UP
86% YoY.
Tablets are UP
23% YoY.
MOBILE SHARE OF VIDEO STARTS(Q4 2012 – Q4 2013)
Gaming consoles UP365% YoY.
Q4 2013Q4 2012
7.2%
12.8%
SMARTPHONE
7.3%9.2%
TABLET
.01% .03%
GAMING CONSOLE

ADOBE DIGITAL INDEX | The U.S. Digital Video Benchmark - Q4 2013 2
Video stream growth is being driven by sporting events in the winter and fall. Mobile viewing for annual sporting events, like playoffs and championship games, spikes for both smartphones and tablets during these seasons.
The findings:• Sports video streams are up 640% year-over-year.
• Over 25% of online viewing on special sporting event days occurs on a mobile device, and mobile viewing is up 73% year-over-year.
• Smartphones are the device of choice for large annual or bi-annual sporting events.
The opportunity:Mobile sports viewing provides great opportunities for advertisers to target audiences with branded content and ads that stand out.
Starts for sporting eventsONLINE VIDEO CONSUMPTION
75%
50%
25%
VIDEO STARTS GROWTH BY MEDIA TYPE(Q4 2012 – Q4 2013)
INDEXAT 100%
TOTAL VIDEO STARTS NON–SPORTS RELATEDSPORTS RELATED MEDIA
Q1 ‘13 Q2 ‘13 Q3 ‘13 Q4 ‘13
Sports video streams are UP
640% YoY.
+440%
+190%
MOBILE VIDEO STARTSFOR SPORTS DAYS
(2013)
TABLETSMARTPHONE
ALL
ON
LIN
E SP
ORT
S VI
EWIIN
G
BASESPORTS
DAY
9.3%
10.2%
ANNUALSPORTING
EVENTS
13.4%
14.4%
Smartphonesbeat tablets foronline sports
events.

ADOBE DIGITAL INDEX | The U.S. Digital Video Benchmark - Q4 2013 3
TV Everywhere content continues to grow at rapid rates. Adobe measured the streams and identified an increase from 222.5 million in 2012 to 574.2 million in 2013.
The findings:• The majority of TV Everywhere streams are viewed on mobile
devices, with tablets producing the most views at 42%.
• Tablet share has increased 110% year-over-year.
• The percent of TV Everywhere content viewed on mobile devices is up 9% year-over-year.
The opportunity:The growth of TV Everywhere is an opportunity for advertisers and publishers to reach viewers with targeted ads that are more engaging than traditional TV content.
Market shareTV EVERYWHERE STREAMS
Tablets are usedthe most at 42%.
UP 110% YoY
Q4 2013Q4 2012
Mobileviews UP6% YoY.
SHARE OF AUTHENTICATED STREAMS(Q4 2012 – Q4 2013)
67%73%
MOBILE
26%22%
PC
3% 3%
GAMING CONSOLE
2% 2%
CONNECTED TV/SET TOP BOX
Q4 2013Q4 2012
SHARE OF TV EVERYWHERE CONTENT(Q4 2012 – Q4 2013)
47%
31%
SMARTPHONE
20%
42%
TABLET
29%22%
PC
1% 3%
GAMING CONSOLE
2% 2%
CONNECTED TV/SET TOP BOX

ADOBE DIGITAL INDEX | The U.S. Digital Video Benchmark - Q4 2013 4
TV Everywhere audiences are tuning in primarily for sporting events—and the majority of them are watching from their Apple devices.
The findings:• 37% of TV Everywhere streams are for sporting events.
• 28% of TV Everywhere streams are for TV shows.
• iPad, iPhone®, and iPod produce nearly 50% of play requests for TV Everywhere content.
• Roku and Gaming Consoles produce 5% of play requests.
The opportunity:With over 50% of traffic coming from Apple devices and desktops, advertisers can target ads toward the more affluent crowd that uses these products.
Content viewingTV EVERYWHERE STREAMS
ROKUOTHER
GAMINGCONSOLE
MACPCANDROID™iPODiPHONE®iPAD
TV EVERYWHERE STREAMBY CONTENT TYPE
(Q4 2013)
SPORTS
37%
TV SHOWS
28%
NEWS
32%
OTHER
3%
TV EVERYWHERE PLAYREQUESTS BY OS/DEVICE
(Q4 2013)
Sportingevents are themost streamed
videos.Gaming
consoles andRoku make up
5% of plays.
28%
14%
5%13%
21%
7%
3%7%
2%
Apple devicesproduce nearly halfof TV Everywhere’s
play requests.

ADOBE DIGITAL INDEX | The U.S. Digital Video Benchmark - Q4 2013 5
TV Everywhere audiences are watching streams on their iPads more than any other device. Surprisingly, iPods are a close second.
The findings:• iPad and iPod® users are watching the most TV Everywhere
video, consuming over 10 videos per visitor, per month, which is two times that of PC users.
• Engagement for iOS® and Android™ are down, while Flash is up year-over-year.
The opportunity:Advertisers and publishers can look to provide more engaging ad packages to those on iPads and iPods, since they are viewing the most video clips per month.
Audience engagementTV EVERYWHERE STREAMS
MOBILE ENGAGEMENT FOR VIDEO STARTSPLAYS/UNIQUE VISITOR
(Q4 2012 – Q4 2013)
Q4 2013Q4 2012
14.1
10.1
iOS
8.2 8.13
ANDROID™
3.55.04
PC
TV EVERYWHERE STREAMENGAGEMENT BY DEVICE TYPE
PLAYS/UNIQUE VISITOR (Q4 2013)
iPAD
12.53
iPHONE®
7.23
iPOD
10.01
ANDROID™
8.13
PC
5.04
iPads and iPods arewatched two times
more than PCs.
5.04 YoYPC
8.13 YoYANDROID™

ADOBE DIGITAL INDEX | The U.S. Digital Video Benchmark - Q4 2013 6
Social is referring more than 6% of video starts, with Facebook growing the fastest.
The findings:• The majority of video starts come from direct traffic to a branded site. • Facebook leads the way with social referred video starts.
The opportunity:Media companies who promote videos on Facebook will likely see it continuing to grow as a viable outlet for engaging consumers.
Social media referralsSOCIAL-REFERRED VIEWING
SHARE OF SOCIAL REFERRED(Q4 2013)
80.6%
11.8%
4.1%
OTHER SOCIAL
3.5%
58%20%
16%
4%
1%
OTHER SOCIALTWITTERFACEBOOKAFFILIATESEARCHDIRECT
REFERRED VIDEO START TRAFFIC SHARE(Q4 2013)
Most video startscome directly from
branded sites.

ADOBE DIGITAL INDEX | The U.S. Digital Video Benchmark - Q4 2013 7
Facebook, Tumblr, and YouTube are producing the highest video view rates among social networks.
The findings:• Tumblr and Facebook are producing nearly identical video view
rates with over one third of referred visits producing a video start. • Half of visits referred from Facebook or Tumblr to sports-related
sites result in a video view.
The opportunity:To improve overall consumer engagement, brands should continue to incorporate video into Facebook and other niche social sites like Tumblr.
View ratesSOCIAL-REFERRED VIEWING
Tumblr andFacebook havenearly identical
view rates.
SOCIAL REFERRED VIDEO VIEW RATE(Q4 2013)
SPORTS VIDEO VIEW RATEAVG. VIDEO VIEW RATE
39%
50%
39%
56%
TUMBLR
35%44%
38% 39%
YOUTUBE
19%25%
56% ofTumblr’s sports-related referrals
lead to avideo start.
ADOBE DIGITAL INDEX | The U.S. Digital Video Benchmark - Q4 2013
ADOBE DIGITAL INDEX
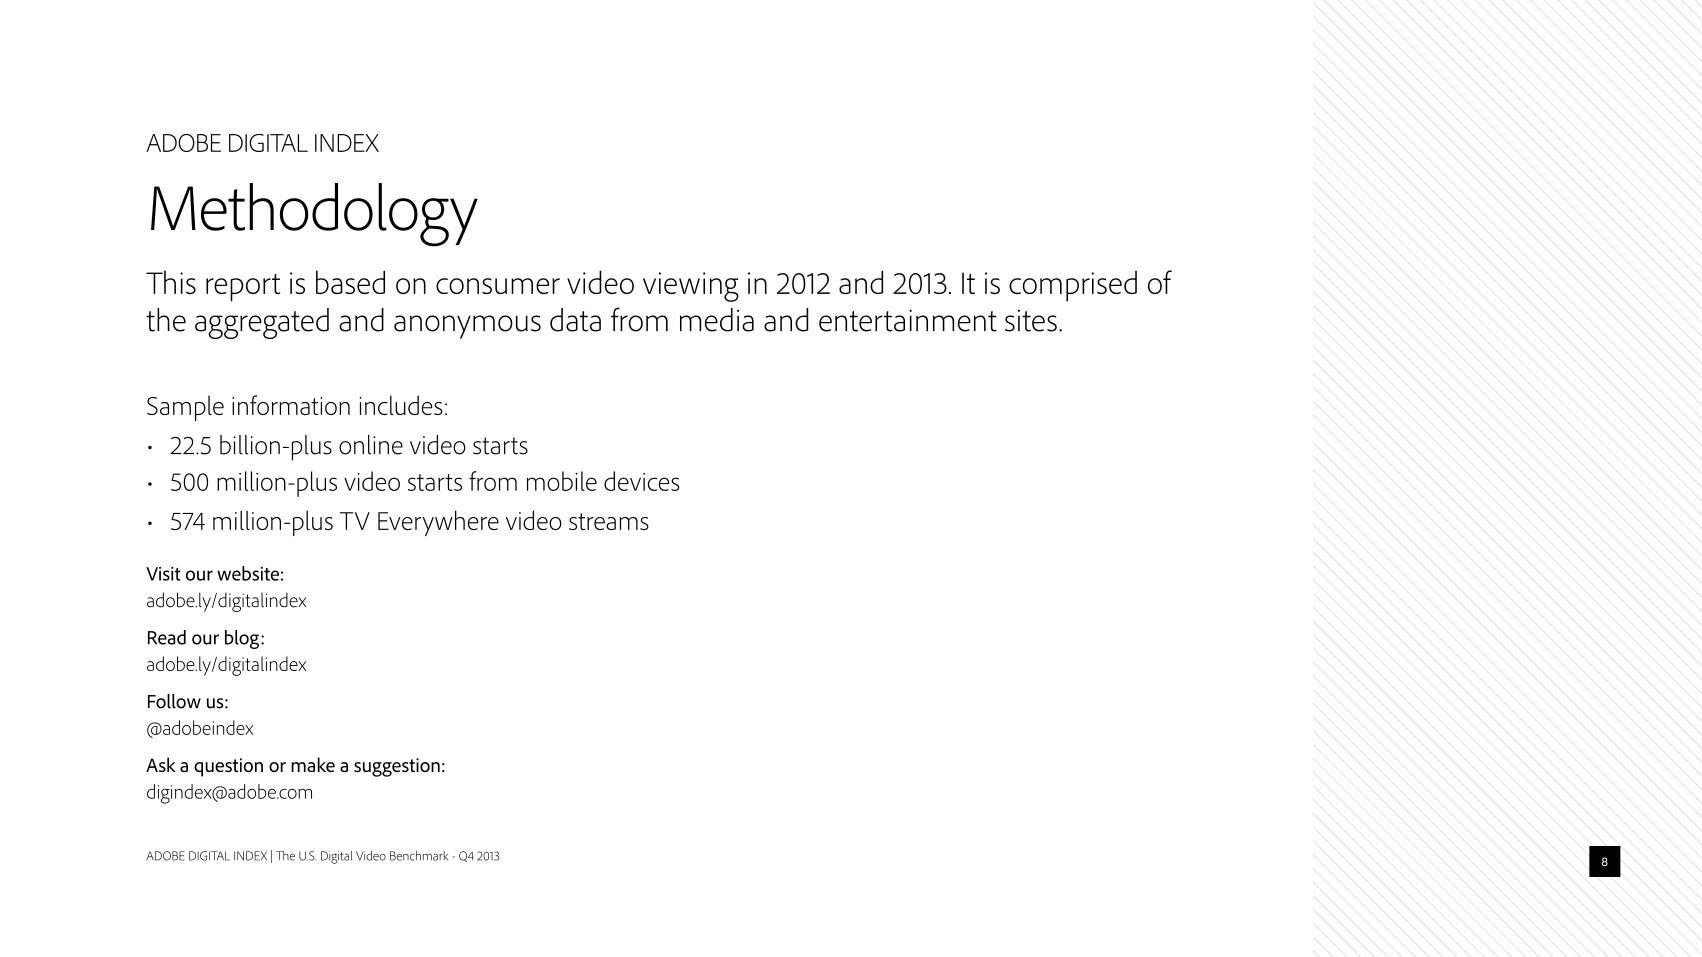
MethodologyThis report is based on consumer video viewing in 2012 and 2013. It is comprised of the aggregated and anonymous data from media and entertainment sites.
Sample information includes:• 22.5 billion-plus online video starts• 500 million-plus video starts from mobile devices• 574 million-plus TV Everywhere video streams
Visit our website: adobe.ly/digitalindex
Read our blog:adobe.ly/digitalindex
Follow us:@adobeindex
Ask a question or make a suggestion:[email protected]
8

ADOBE DIGITAL INDEX | The U.S. Digital Video Benchmark - Q4 2013
ADOBE DIGITAL INDEX
Appendix
9
©2014 Adobe Systems Incorporated. All rights reserved. Adobe and the Adobe logo are either registered trademarks or trademarks of Adobe Systems Incorporated in the United States and/or other countries. Android is a trademark of Google Inc. Windows is either a registered trademark or a trademark of Microsoft Corporation in the United States and/or other countries. iOS and iPhone are trademarks of Apple Inc, registered in the US and other countries. All other trademarks are the property of their respective owners.
% of Video Starts by Device
Dec 2012 Jan 2013 Feb 2013 Mar 2013 Apr 2013 May 2013 Jun 2013 Jul 2013 Aug 2013 Sept 2013 Oct 2013 Nov 2013 Dec 2013Smartphone 7.0% 8.4% 9.6% 9.0% 9.5% 9.2% 8.8% 9.6% 10.1% 11.1% 12.3% 12.9% 13.1%
Tablet 7.8% 7.9% 8.0% 7.9% 7.4% 7.8% 8.0% 8.5% 8.6% 8.7% 8.5% 9.3% 9.6%
PC 84.6% 83.0% 81.8% 82.6% 82.6% 82.5% 82.4% 80.9% 80.5% 79.7% 78.8% 77.3% 76.7%
Video Starts Growth
Dec 2012 Jan 2013 Feb 2013 Mar 2013 Apr 2013 May 2013 Jun 2013 Jul 2013 Aug 2013 Sept 2013 Oct 2013 Nov 2013 Dec 2013Total Video Starts 100% 244% 222% 271% 259% 218% 166% 151% 165% 246% 322% 410% 540%
Sports Related Media 100% 330% 350% 447% 420% 295% 201% 159% 188% 354% 568% 670% 739%
Non Sports Related 100% 114% 115% 118% 117% 120% 113% 120% 128% 140% 180% 210% 290%
Mobile Share of Video Starts by Device
Q4 2012 Q4 2013Smartphone 7% 12.8%
Tablet 7.8% 9.2%
Gaming Console 0.01% 0.03%
Referred Video Start Traffic Share
Q4 2013Direct 58%
Search 20%
Affiliate 16%
Facebook 4%
Twitter 1%
Other Social 1%
Engagement (Plays/Unique Visitor) by Device (Q4 2013)
Q4 2013iPad 12.53
iPhone 7.23
iPod 10.01
Android 8.13
PC 5.04
Social Referred Video View Rate (Q4 2013)
Avg. Video View Rate
Sports Video View Rate
Facebook 39% 50%
Tumblr 39% 56%
Reddit 35% 44%
Blogspot 28% 25%
Twitter 19% 25%Share of Authenticated Streams Growth
Q4 2012 Q4 2013Mobile 71% 73%
PC 26% 22%
Game Console 3% 3%
TV/Set Top Box 2% 2%
TV Everywhere Stream Play Requests by OS/Device
Q4 Play RequestsiPad 28%
PC 21%
iPhone 14%
Android 13%
Mac 7%
Other 7%
iPod 5%
Gaming Console 3%
Roku 2%
Base Sports Day vs. Annual Sporting Events
Base Sports Day Ann. Sporting EventsSmartphone 10.2% 14.4%
Tablet 9.3% 13.4%
Share of Social Referred Video Starts
Q4 2012 Q4 2013Facebook 80% 81%
Twitter 11% 12%
Reddit 5% 4%
Other Social 4% 4%
% of TV Everywhere Streams
% of Play RequestsSports 37%
TV Shows 28%
News 32%
Other 3%
Share of TV Everywhere Starts by Device
Q4 2012 Q4 2013Tablet 20% 43%
Smartphone 47% 31%
PC 29% 22%
Gaming Console 1% 3%
TV/Set Top Box 2% 2%