Embed Size (px)
Citation preview

FURTHER MATHEMATICSWritten examination 1
Friday 28 October 2016 Reading time: 2.00 pm to 2.15 pm (15 minutes) Writing time: 2.15 pm to 3.45 pm (1 hour 30 minutes)
MULTIPLE-CHOICE QUESTION BOOK
Structure of bookSection Number of
questionsNumber of questions
to be answeredNumber of modules
Number of modulesto be answered
Number of marks
A – Core 24 24 24B – Modules 32 16 4 2 16
Total 40
• Studentsarepermittedtobringintotheexaminationroom:pens,pencils,highlighters,erasers,sharpeners,rulers,oneboundreference,oneapprovedtechnology(calculatororsoftware)and,ifdesired,onescientificcalculator.CalculatormemoryDOESNOTneedtobecleared.Forapprovedcomputer-basedCAS,fullfunctionalitymaybeused.
• StudentsareNOTpermittedtobringintotheexaminationroom:blanksheetsofpaperand/orcorrectionfluid/tape.
Materials supplied• Questionbookof33pages.• Formulasheet.• Answersheetformultiple-choicequestions.• Workingspaceisprovidedthroughoutthebook.
Instructions• Checkthatyourname and student numberasprintedonyouranswersheetformultiple-choice
questionsarecorrect,andsignyournameinthespaceprovidedtoverifythis.• Unlessotherwiseindicated,thediagramsinthisbookarenotdrawntoscale.
At the end of the examination• Youmaykeepthisquestionbookandtheformulasheet.
Students are NOT permitted to bring mobile phones and/or any other unauthorised electronic devices into the examination room.
©VICTORIANCURRICULUMANDASSESSMENTAUTHORITY2016
Victorian Certificate of Education 2016
2016FURMATHEXAM1 2
THIS PAgE IS BLANK
3 2016FURMATHEXAM1
SECTION A – continuedTURN OVER
SECTION A – Core
Instructions for Section AAnswerallquestionsinpencilontheanswersheetprovidedformultiple-choicequestions.Choosetheresponsethatiscorrectforthequestion.Acorrectanswerscores1;anincorrectanswerscores0.Markswillnotbedeductedforincorrectanswers.Nomarkswillbegivenifmorethanoneansweriscompletedforanyquestion.Unlessotherwiseindicated,thediagramsinthisbookarenot drawntoscale.
Data analysis
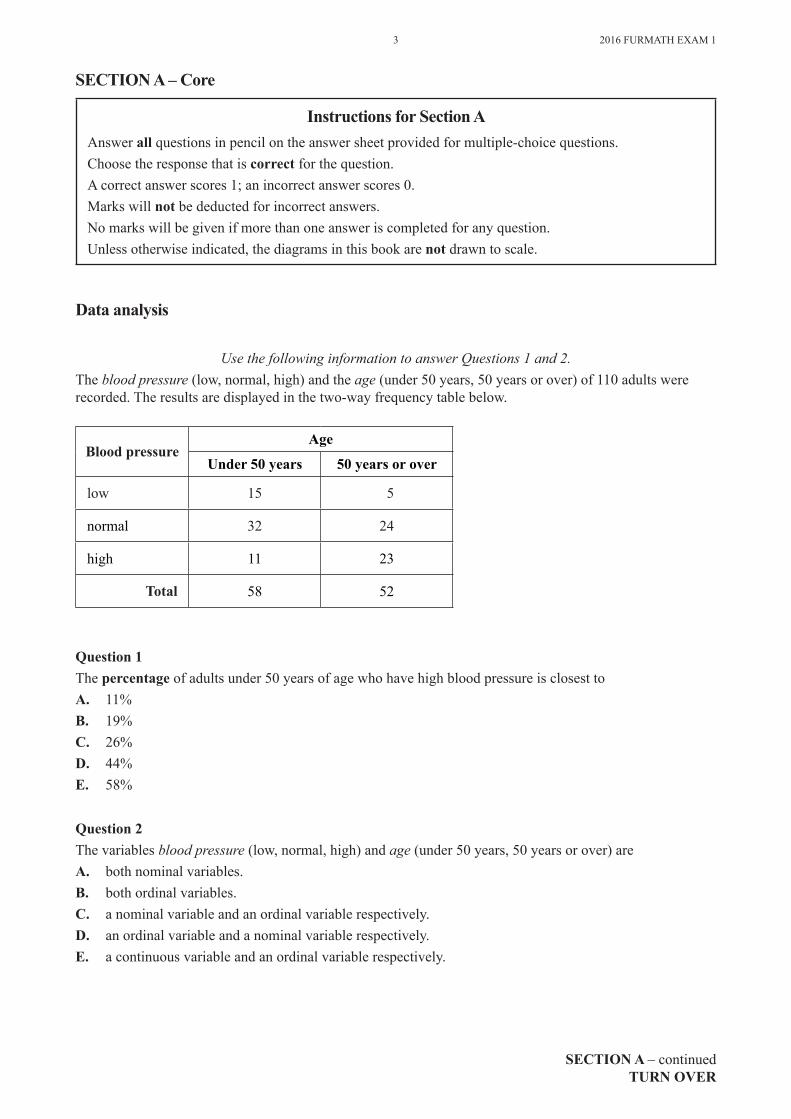
Use the following information to answer Questions 1 and 2.Theblood pressure(low,normal,high)andtheage(under50years,50yearsorover)of110adultswererecorded.Theresultsaredisplayedinthetwo-wayfrequencytablebelow.
Blood pressureAge
Under 50 years 50 years or over
low 15 5
normal 32 24
high 11 23
Total 58 52
Question 1Thepercentageofadultsunder50yearsofagewhohavehighbloodpressureisclosesttoA. 11%B. 19%C. 26%D. 44%E. 58%
Question 2Thevariablesblood pressure(low,normal,high)andage(under50years,50yearsorover)areA. bothnominalvariables.B. bothordinalvariables.C. anominalvariableandanordinalvariablerespectively.D. anordinalvariableandanominalvariablerespectively.E. acontinuousvariableandanordinalvariablerespectively.

2016FURMATHEXAM1 4
SECTION A – continued
Question 3Thestemplotbelowdisplays30temperaturesrecordedataweatherstation.
temperature key:2|2=2.2°C
2 2 2 4 4
2 5 7 8 8 8 8 8 8 9 9 9 9
3 1 2 3 3 4 4 4
3 5 6 7 7 7 7
4 1
ThemodaltemperatureisA. 2.8°CB. 2.9°CC. 3.7°CD. 8.0°CE. 9.0°C
Use the following information to answer Questions 4 and 5.Theweightsofmaleplayersinabasketballcompetitionareapproximatelynormallydistributedwithameanof78.6kgandastandarddeviationof9.3kg.
Question 4Thereare456maleplayersinthecompetition.Theexpectednumberofmaleplayersinthecompetitionwithweightsabove60kgisclosesttoA. 3B. 11C. 23D. 433E. 445
Question 5BrettandSanjeevabothplayinthebasketballcompetition.Whentheweightsofallplayersinthecompetitionareconsidered,Bretthasastandardisedweightof z =–0.96andSanjeevahasastandardisedweightofz =–0.26Whichoneofthefollowingstatementsisnot true?A. BrettandSanjeevaarebothbelowthemeanweightforplayersinthebasketballcompetition.B. SanjeevaweighsmorethanBrett.C. IfSanjeevaincreaseshisweightby2kg,hewouldbeabovethemeanweightforplayersinthe
basketballcompetition.D. Brettweighsmorethan68kg.E. Morethan50%oftheplayersinthebasketballcompetitionweighmorethanSanjeeva.
5 2016FURMATHEXAM1
SECTION A – continuedTURN OVER
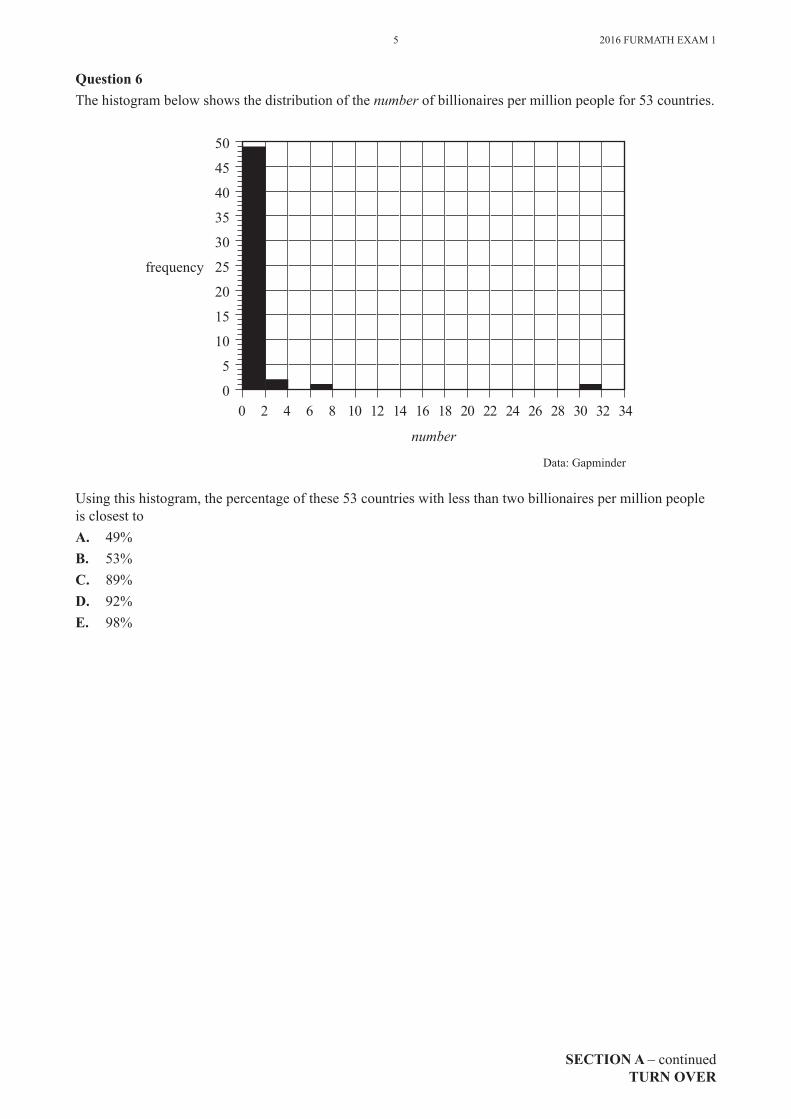
Question 6Thehistogrambelowshowsthedistributionofthenumberofbillionairespermillionpeoplefor53countries.
50
45
40
35
30
25frequency
20
15
10
5
00 2 4 6 8 10 12 14 16
number
18 20 22 24 26 28 30 32 34
Data:Gapminder
Usingthishistogram,thepercentageofthese53countrieswithlessthantwobillionairespermillionpeopleisclosesttoA. 49%B. 53%C. 89%D. 92%E. 98%
2016FURMATHEXAM1 6
SECTION A – continued
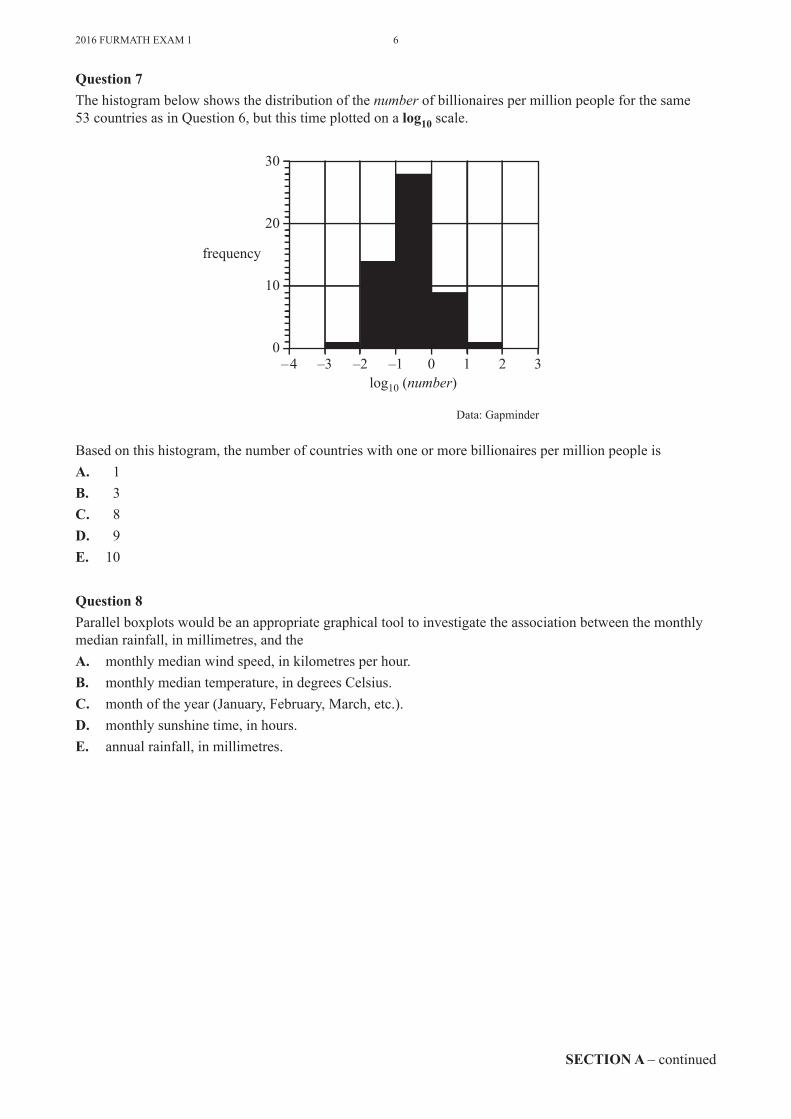
Question 7Thehistogrambelowshowsthedistributionofthenumberofbillionairespermillionpeopleforthesame 53countriesasinQuestion6,butthistimeplottedonalog10scale.
30
20
frequency
10
0–4 –3 –2 –1
log10 (number)0 1 2 3
Data:Gapminder
Basedonthishistogram,thenumberofcountrieswithoneormorebillionairespermillionpeopleisA. 1B. 3C. 8D. 9E. 10
Question 8Parallelboxplotswouldbeanappropriategraphicaltooltoinvestigatetheassociationbetweenthemonthlymedianrainfall,inmillimetres,andtheA. monthlymedianwindspeed,inkilometresperhour.B. monthlymediantemperature,indegreesCelsius.C. monthoftheyear(January,February,March,etc.).D. monthlysunshinetime,inhours.E. annualrainfall,inmillimetres.
7 2016FURMATHEXAM1
SECTION A – continuedTURN OVER
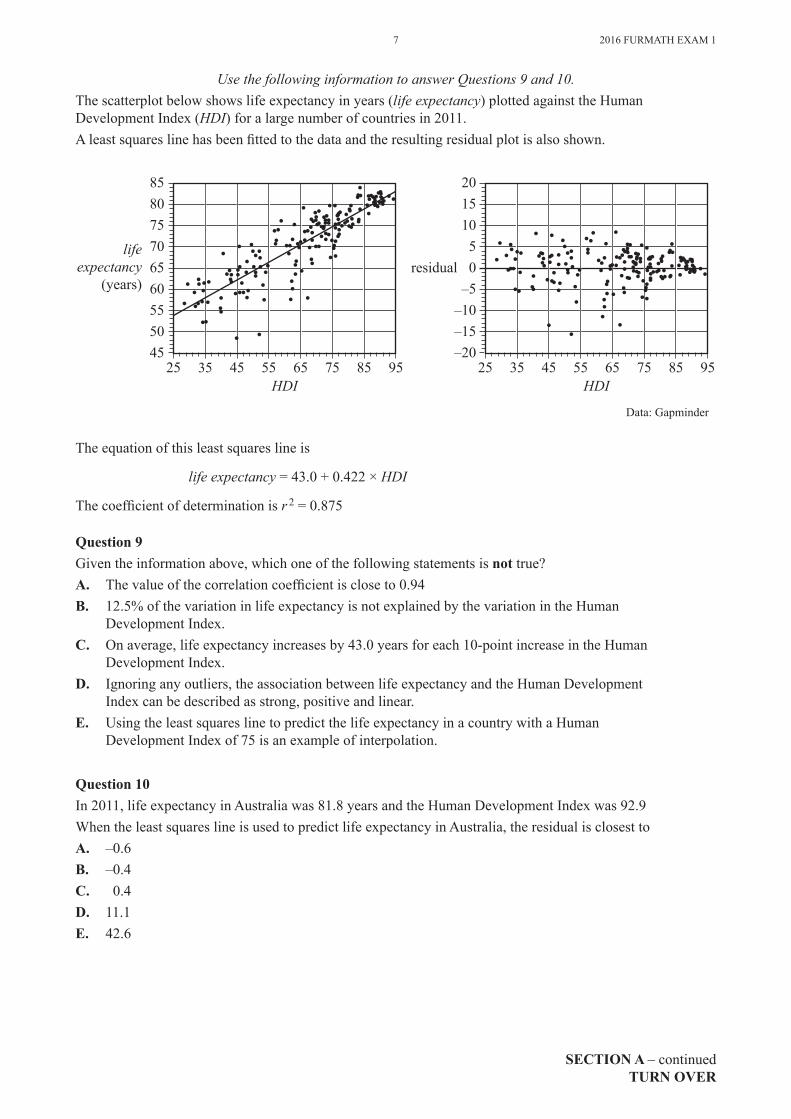
Use the following information to answer Questions 9 and 10.Thescatterplotbelowshowslifeexpectancyinyears(life expectancy)plottedagainsttheHumanDevelopmentIndex(HDI)foralargenumberofcountriesin2011.Aleastsquareslinehasbeenfittedtothedataandtheresultingresidualplotisalsoshown.
8580757065
lifeexpectancy
(years) 60555045
25 35 45 55HDI
65 75 85 95
20151050residual
–5–10–15–20
25 35 45 55HDI
65 75 85 95
Data:Gapminder
Theequationofthisleastsquareslineis
life expectancy=43.0+0.422×HDI
Thecoefficientofdeterminationisr 2=0.875
Question 9Giventheinformationabove,whichoneofthefollowingstatementsisnot true?A. Thevalueofthecorrelationcoefficientiscloseto0.94B. 12.5%ofthevariationinlifeexpectancyisnotexplainedbythevariationintheHuman
DevelopmentIndex.C. Onaverage,lifeexpectancyincreasesby43.0yearsforeach10-pointincreaseintheHuman
DevelopmentIndex.D. Ignoringanyoutliers,theassociationbetweenlifeexpectancyandtheHumanDevelopment
Indexcanbedescribedasstrong,positiveandlinear.E. UsingtheleastsquareslinetopredictthelifeexpectancyinacountrywithaHuman
DevelopmentIndexof75isanexampleofinterpolation.
Question 10In2011,lifeexpectancyinAustraliawas81.8yearsandtheHumanDevelopmentIndexwas92.9WhentheleastsquareslineisusedtopredictlifeexpectancyinAustralia,theresidualisclosesttoA. –0.6B. –0.4C. 0.4D. 11.1E. 42.6
2016FURMATHEXAM1 8
SECTION A – continued
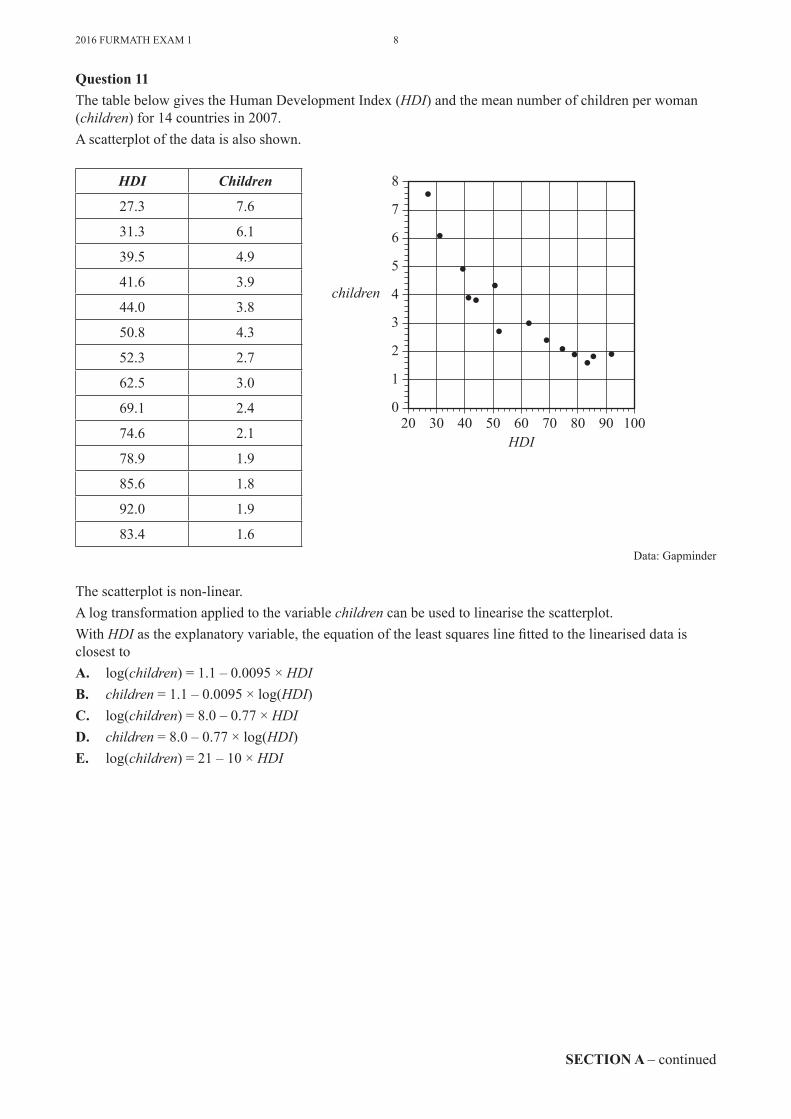
Question 11ThetablebelowgivestheHumanDevelopmentIndex(HDI)andthemeannumberofchildrenperwoman(children)for14countriesin2007.Ascatterplotofthedataisalsoshown.
HDI Children
27.3 7.6
31.3 6.1
39.5 4.9
41.6 3.9
44.0 3.8
50.8 4.3
52.3 2.7
62.5 3.0
69.1 2.4
74.6 2.1
78.9 1.9
85.6 1.8
92.0 1.9
83.4 1.6
8
7
6
5
4children
3
2
1
020 30 40 50 60
HDI70 80 90 100
Data:Gapminder
Thescatterplotisnon-linear.Alogtransformationappliedtothevariablechildrencanbeusedtolinearisethescatterplot.WithHDIastheexplanatoryvariable,theequationoftheleastsquareslinefittedtothelineariseddataisclosesttoA. log(children)=1.1–0.0095×HDIB. children=1.1–0.0095×log(HDI)C. log(children)=8.0–0.77×HDID. children=8.0–0.77×log(HDI)E. log(children)=21–10×HDI

9 2016FURMATHEXAM1
SECTION A – continuedTURN OVER
Question 12 Thereisastrongpositiveassociationbetweenacountry’sHumanDevelopmentIndexanditscarbondioxideemissions.Fromthisinformation,itcanbeconcludedthatA. increasingacountry’scarbondioxideemissionswillincreasetheHumanDevelopmentIndexofthe
country.B. decreasingacountry’scarbondioxideemissionswillincreasetheHumanDevelopmentIndexofthe
country.C. thisassociationmustbeachanceoccurrenceandcanbesafelyignored.D. countriesthathavehigherhumandevelopmentindicestendtohavehigherlevelsofcarbondioxide
emissions.E. countriesthathavehigherhumandevelopmentindicestendtohavelowerlevelsofcarbondioxide
emissions.
Question 13Considerthetimeseriesplotbelow.
30
25
20
15mean temperature
10
5
00 12 24
month number36 48
Data:CommonwealthofAustralia,BureauofMeteorology
ThepatterninthetimeseriesplotshownaboveisbestdescribedashavingA. irregularfluctuationsonly.B. anincreasingtrendwithirregularfluctuations.C. seasonalitywithirregularfluctuations.D. seasonalitywithanincreasingtrendandirregularfluctuations.E. seasonalitywithadecreasingtrendandirregularfluctuations.

2016FURMATHEXAM1 10
SECTION A – continued
Use the following information to answer Questions 14–16.Thetablebelowshowsthelong-termaverageofthenumberofmealsservedeachdayatarestaurant.AlsoshownisthedailyseasonalindexforMondaythroughtoFriday.
Day of the week
Monday Tuesday Wednesday Thursday Friday Saturday Sunday
Long-term average 89 93 110 132 145 190 160
Seasonal index 0.68 0.71 0.84 1.01 1.10
Question 14TheseasonalindexforWednesdayis0.84Thistellsusthat,onaverage,thenumberofmealsservedonaWednesdayisA. 16%lessthanthedailyaverage.B. 84%lessthanthedailyaverage.C. thesameasthedailyaverage.D. 16%morethanthedailyaverage.E. 84%morethanthedailyaverage.
Question 15LastTuesday,108mealswereservedintherestaurant.ThedeseasonalisednumberofmealsservedlastTuesdaywasclosesttoA. 93B. 100C. 110D. 131E. 152
Question 16TheseasonalindexforSaturdayisclosesttoA. 1.22B. 1.31C. 1.38D. 1.45E. 1.49
11 2016FURMATHEXAM1
SECTION A – continuedTURN OVER
Recursion and financial modelling
Question 17Considertherecurrencerelationbelow.
A0=2, An+1=3An+1
ThefirstfourtermsofthisrecurrencerelationareA. 0,2,7,22…B. 1,2,7,22…C. 2,5,16,49…D. 2,7,18,54…E. 2,7,22,67…
Question 18Thevalueofanannuity,Vn,afternmonthlypaymentsof$555havebeenmade,canbedeterminedusingtherecurrencerelation
V0=100000, Vn+1=1.0025Vn–555
ThevalueoftheannuityafterfivepaymentshavebeenmadeisclosesttoA. $97225B. $98158C. $98467D. $98775E. $110224
Question 19Thepurchasepriceofacarwas$26000.Usingthereducingbalancemethod,thevalueofthecarisdepreciatedby8%eachyear.Arecurrencerelationthatcanbeusedtodeterminethevalueofthecarafternyears,Cn,isA. C0=26000, Cn+1=0.92Cn
B. C0=26000, Cn+1=1.08Cn
C. C0=26000, Cn+1=Cn+8
D. C0=26000, Cn+1=Cn–8
E. C0=26000, Cn+1=0.92Cn–8
Question 20Considertherecurrencerelationbelow.
V0=10000, Vn+1=1.04Vn+500
ThisrecurrencerelationcouldbeusedtomodelA. areducingbalancedepreciationofanassetinitiallyvaluedat$10000.B. areducingbalanceloanwithperiodicrepaymentsof$500.C. aperpetuitywithperiodicpaymentsof$500fromtheannuity.D. anannuityinvestmentwithperiodicadditionsof$500madetotheinvestment.E. aninterest-onlyloanof$10000.
2016FURMATHEXAM1 12
SECTION A – continued
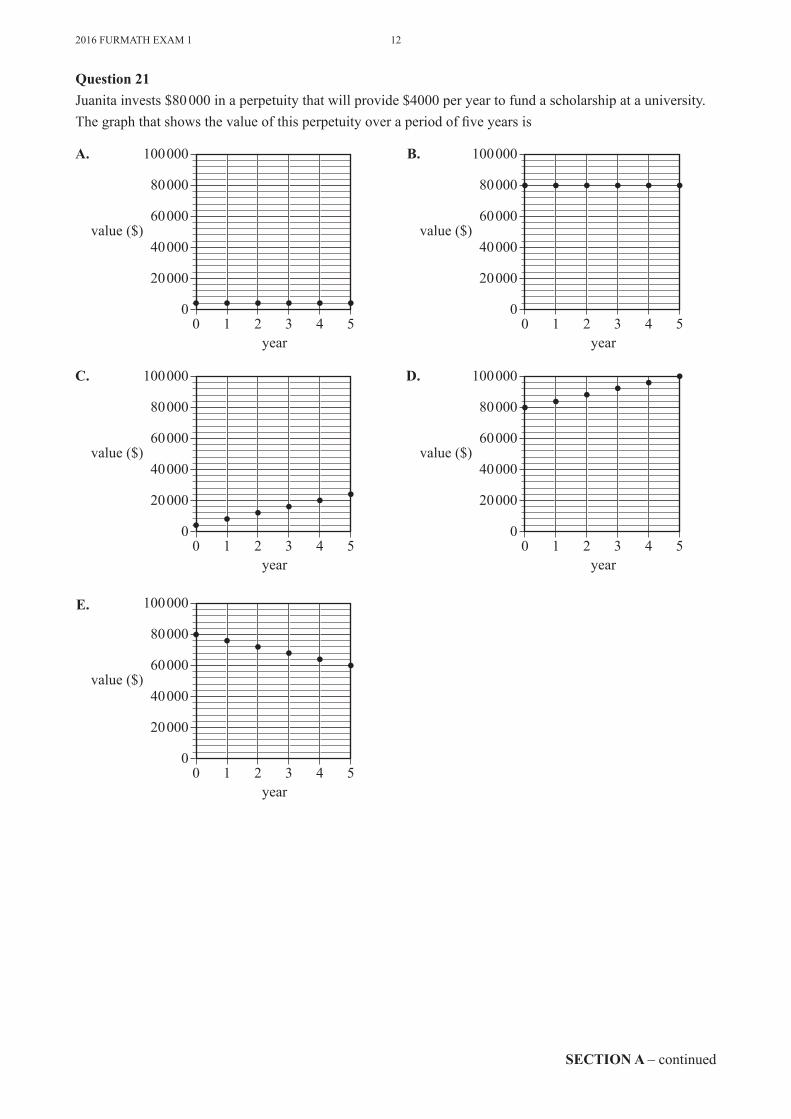
Question 21Juanitainvests$80000inaperpetuitythatwillprovide$4000peryeartofundascholarshipatauniversity.Thegraphthatshowsthevalueofthisperpetuityoveraperiodoffiveyearsis
100000
80000
60000value ($)
40000
20000
00 1 2 3
year4 5
100000
80000
60000value ($)
40000
20000
00 1 2 3
year4 5
100000
80000
60000value ($)
40000
20000
00 1 2 3
year4 5
100000
80000
60000value ($)
40000
20000
00 1 2 3
year4 5
100000
80000
60000value ($)
40000
20000
00 1 2 3
year4 5
A. B.
C. D.
E.
13 2016FURMATHEXAM1
END OF SECTION ATURN OVER
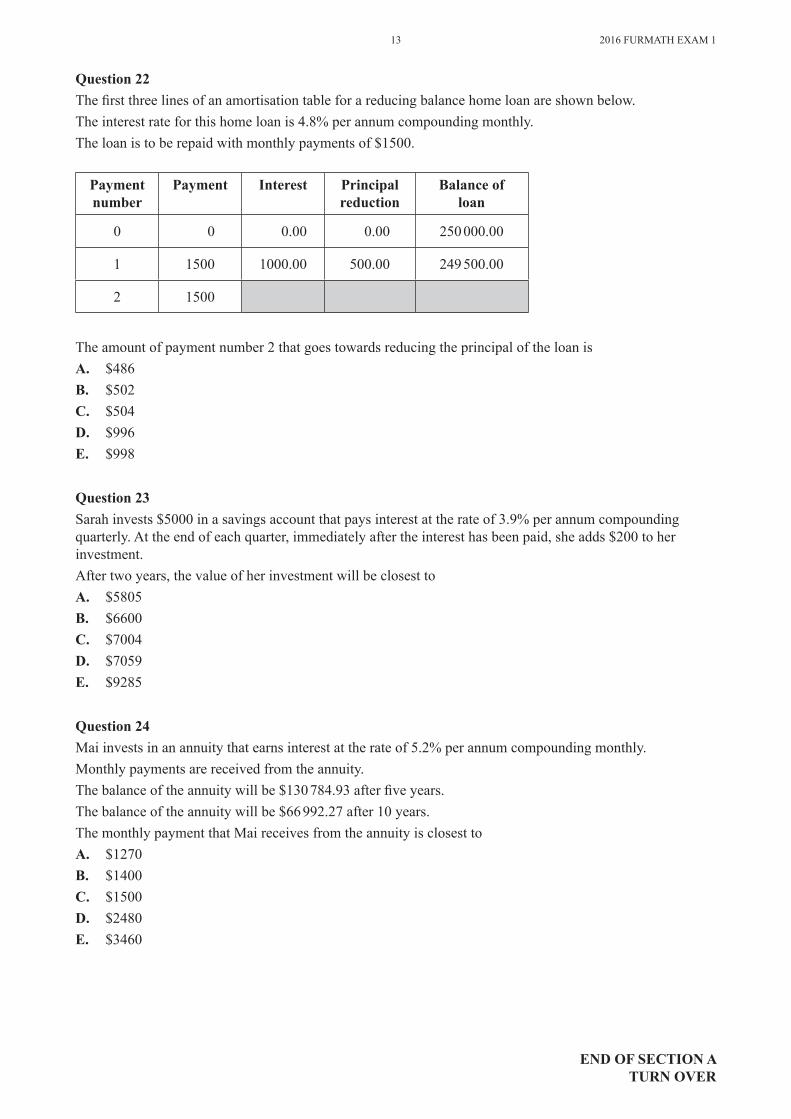
Question 22Thefirstthreelinesofanamortisationtableforareducingbalancehomeloanareshownbelow.Theinterestrateforthishomeloanis4.8%perannumcompoundingmonthly.Theloanistoberepaidwithmonthlypaymentsof$1500.
Payment number
Payment Interest Principal reduction
Balance of loan
0 0 0.00 0.00 250000.00
1 1500 1000.00 500.00 249500.00
2 1500
Theamountofpaymentnumber2thatgoestowardsreducingtheprincipaloftheloanisA. $486B. $502C. $504D. $996E. $998
Question 23Sarahinvests$5000inasavingsaccountthatpaysinterestattherateof3.9%perannumcompoundingquarterly.Attheendofeachquarter,immediatelyaftertheinteresthasbeenpaid,sheadds$200toherinvestment.Aftertwoyears,thevalueofherinvestmentwillbeclosesttoA. $5805B. $6600C. $7004D. $7059E. $9285
Question 24Maiinvestsinanannuitythatearnsinterestattherateof5.2%perannumcompoundingmonthly.Monthlypaymentsarereceivedfromtheannuity.Thebalanceoftheannuitywillbe$130784.93afterfiveyears.Thebalanceoftheannuitywillbe$66992.27after10years.ThemonthlypaymentthatMaireceivesfromtheannuityisclosesttoA. $1270B. $1400C. $1500D. $2480E. $3460

2016FURMATHEXAM1 14
SECTION B –continued
SECTION B – Modules
Instructions for Section BSelecttwomodulesandanswerallquestionswithintheselectedmodulesinpencilontheanswersheetprovidedformultiple-choicequestions.Showthemodulesyouareansweringbyshadingthematchingboxesonyourmultiple-choiceanswersheetandwritingthenameofthemoduleintheboxprovided.Choosetheresponsethatiscorrectforthequestion.Acorrectanswerscores1;anincorrectanswerscores0.Markswillnotbedeductedforincorrectanswers.Nomarkswillbegivenifmorethanoneansweriscompletedforanyquestion.Unlessotherwiseindicated,thediagramsinthisbookarenotdrawntoscale.
Contents Page
Module1–Matrices......................................................................................................................................15
Module2–Networksanddecisionmathematics.......................................................................................... 19
Module3–Geometryandmeasurement.......................................................................................................25
Module4–Graphsandrelations................................................................................................................... 29
15 2016FURMATHEXAM1
SECTION B – Module 1 – continuedTURN OVER
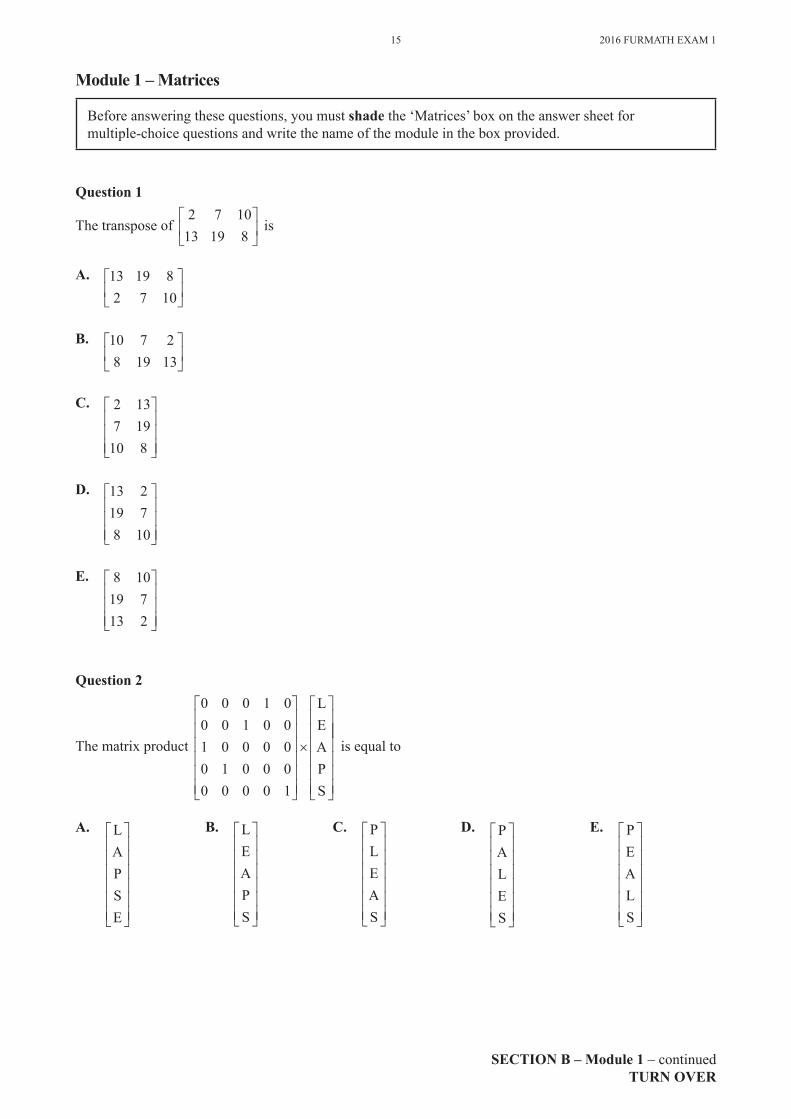
Question 1
Thetransposeof2 7 10
13 19 8
is
A. 13 19 82 7 10
B. 10 7 28 19 13
C. 2 137 19
10 8
D. 13 219 78 10
E. 8 1019 713 2
Question 2
Thematrixproduct
0 0 0 1 00 0 1 0 01 0 0 0 00 1 0 0 00 0 0 0 1
×
LEAPS
isequalto
A. LAPSE
B. LEAPS
C. PLEAS
D. PALES
E. PEALS
Module 1 – Matrices
Beforeansweringthesequestions,youmustshadethe‘Matrices’boxontheanswersheetfor multiple-choicequestionsandwritethenameofthemoduleintheboxprovided.
2016FURMATHEXAM1 16
SECTION B – Module 1 – continued
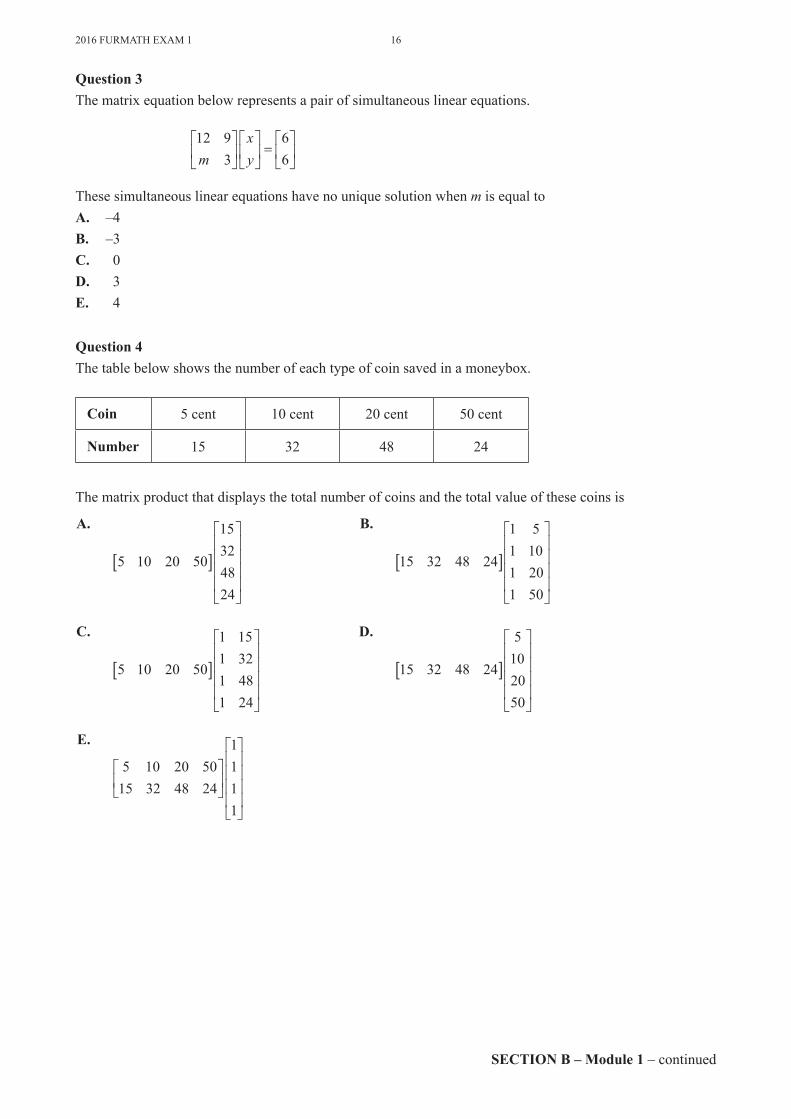
Question 3Thematrixequationbelowrepresentsapairofsimultaneouslinearequations.
12 93
66m
xy
=
ThesesimultaneouslinearequationshavenouniquesolutionwhenmisequaltoA. –4B. –3C. 0D. 3E. 4
Question 4Thetablebelowshowsthenumberofeachtypeofcoinsavedinamoneybox.
Coin 5cent 10cent 20cent 50cent
Number 15 32 48 24
Thematrixproductthatdisplaysthetotalnumberofcoinsandthetotalvalueofthesecoinsis
A.
5 10 20 50
15324824
[ ]
B.
15 32 48 24
1 51 101 201 50
[ ]
C.
5 10 20 50
1 151 321 481 24
[ ]
D.
15 32 48 24
5102050
[ ]
E.
5 10 20 5015 32 48 24
1111
17 2016FURMATHEXAM1
SECTION B – Module 1 – continuedTURN OVER
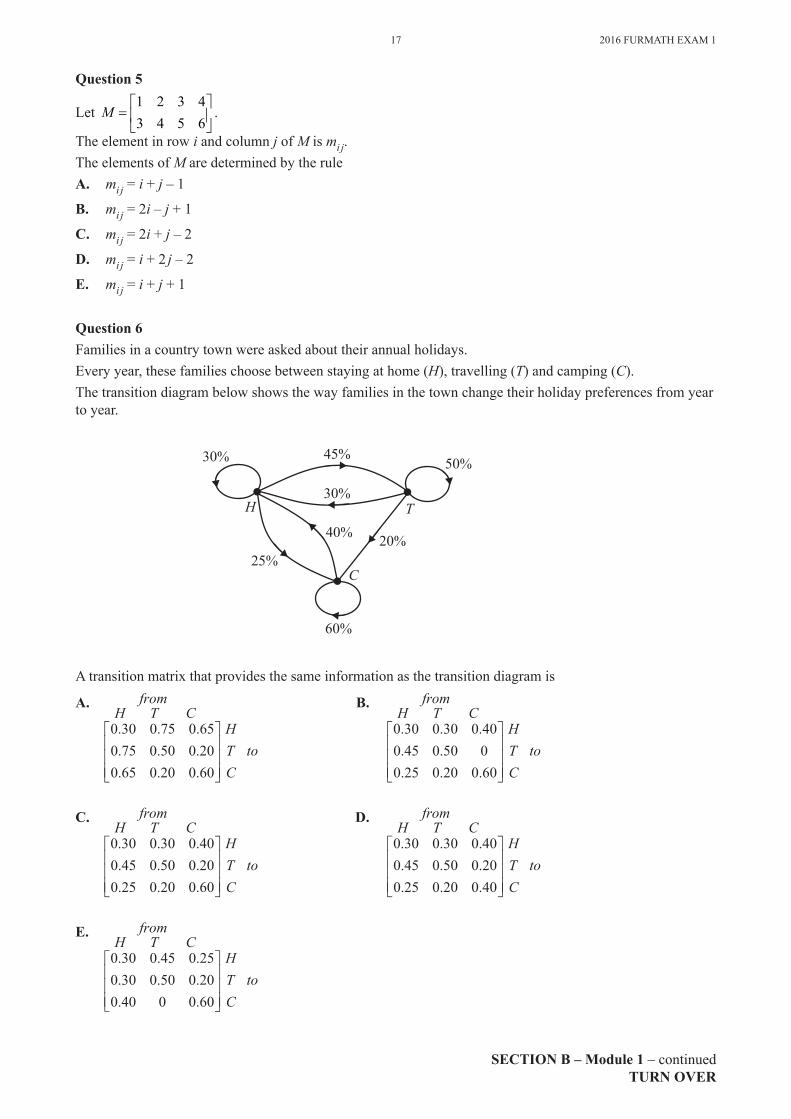
Question 5
Let1 2 3 43 4 5 6
M =
.
TheelementinrowiandcolumnjofMismi j.TheelementsofMaredeterminedbytheruleA. mi j=i+j – 1
B. mi j=2i – j+1
C. mi j=2i+j – 2
D. mi j=i+2j – 2
E. mi j=i+j+1
Question 6Familiesinacountrytownwereaskedabouttheirannualholidays.Everyyear,thesefamilieschoosebetweenstayingathome(H),travelling(T)andcamping(C).Thetransitiondiagrambelowshowsthewayfamiliesinthetownchangetheirholidaypreferencesfromyeartoyear.
30%
25%
45%
60%
30%
40%
50%
20%
H T
C
Atransitionmatrixthatprovidesthesameinformationasthetransitiondiagramis
A. fromH T C
HTCto
0 30 0 75 0 650 75 0 50 0 200 65 0 20 0 60
. . .
. . .
. . .
B. fromH T C
HTCto
0 30 0 30 0 400 45 0 50 00 25 0 20 0 60
. . .
. .
. . .
C. fromH T C
HTCto
0 30 0 30 0 400 45 0 50 0 200 25 0 20 0 60
. . .
. . .
. . .
D. fromH T C
HTCto
0 30 0 30 0 400 45 0 50 0 200 25 0 20 0 40
. . .
. . .
. . .
E. fromH T C
HTCto
0 30 0 45 0 250 30 0 50 0 200 40 0 0 60
. . .
. . .
. .

2016FURMATHEXAM1 18
End of Module 1 – SECTION B–continued
Question 7Eachweek,the300studentsataprimaryschoolchooseart(A),music(M)orsport(S)asanafternoonactivity.Thetransitionmatrixbelowshowshowthestudents’choiceschangefromweektoweek.
thisweekA M S
TAMSnext w=
0 5 0 4 0 10 3 0 4 0 40 2 0 2 0 5
. . .
. . .
. . .eeek
Basedontheinformationabove,itcanbeconcludedthat,inthelongtermA. nostudentwillchoosesport.B. allstudentswillchoosetostayinthesameactivityeachweek.C. allstudentswillhavechosentochangetheiractivityatleastonce.D. morestudentswillchoosetodomusicthansport.E. thenumberofstudentschoosingtodoartandmusicwillbethesame.
Question 8Thematrixbelowshowstheresultofeachmatchbetweenfourteams,A,B,CandD,inabowlingtournament.Eachteamplayedeachotherteamonceandtherewerenodraws.
loserA B C D
winner
ABCD
0 0 1 01 0 0 10 1 0 11 0 0 0
Inthistournament,eachteamwasgivenarankingthatwasdeterminedbycalculatingthesumofitsone-stepandtwo-stepdominances.Theteamwiththehighestsumwasrankednumberone(1).Theteamwiththesecond-highestsumwasrankednumbertwo(2),andsoon.Usingthismethod,teamCwasrankednumberone(1).TeamAwouldhavebeenrankednumberone(1)ifthewinnerofonematchhadlostinstead.ThatmatchwasbetweenteamsA. AandB.B. AandD.C. BandC.D. BandD.E. CandD.

19 2016FURMATHEXAM1
SECTION B – Module 2 – continuedTURN OVER
Question 1Lee,Mandy,Nola,OscarandPieterareeachtobeallocatedoneparticulartaskatwork.Thebipartitegraphbelowshowswhichtask(s),1–5,eachpersonisabletocomplete.
Task 1
Task 2
Task 3
Task 4
Lee
Mandy
Nola
Oscar
Pieter Task 5
Worker Task
Eachpersoncompletesadifferenttask.Task4mustbecompletedbyA. Lee.B. Mandy.C. Nola.D. Oscar.E. Pieter.
Module 2 – Networks and decision mathematics
Beforeansweringthesequestions,youmustshadethe‘Networksanddecisionmathematics’boxontheanswersheetformultiple-choicequestionsandwritethenameofthemoduleintheboxprovided.

2016FURMATHEXAM1 20
SECTION B – Module 2 – continued
Question 2Thefollowingdirectedgraphshowstheflowofwater,inlitresperminute,inasystemofpipesconnectingthesourcetothesink.
4
6 8
2
10source sink
Themaximumflow,inlitresperminute,fromthesourcetothesinkisA. 10B. 14C. 18D. 20E. 22
Question 3Thefollowinggraphwithfiveverticesisacompletegraph.
Edgesareremovedsothatthegraphwillhavetheminimumnumberofedgestoremainconnected.ThenumberofedgesthatareremovedisA. 4B. 5C. 6D. 9E. 10
21 2016FURMATHEXAM1
SECTION B – Module 2 – continuedTURN OVER
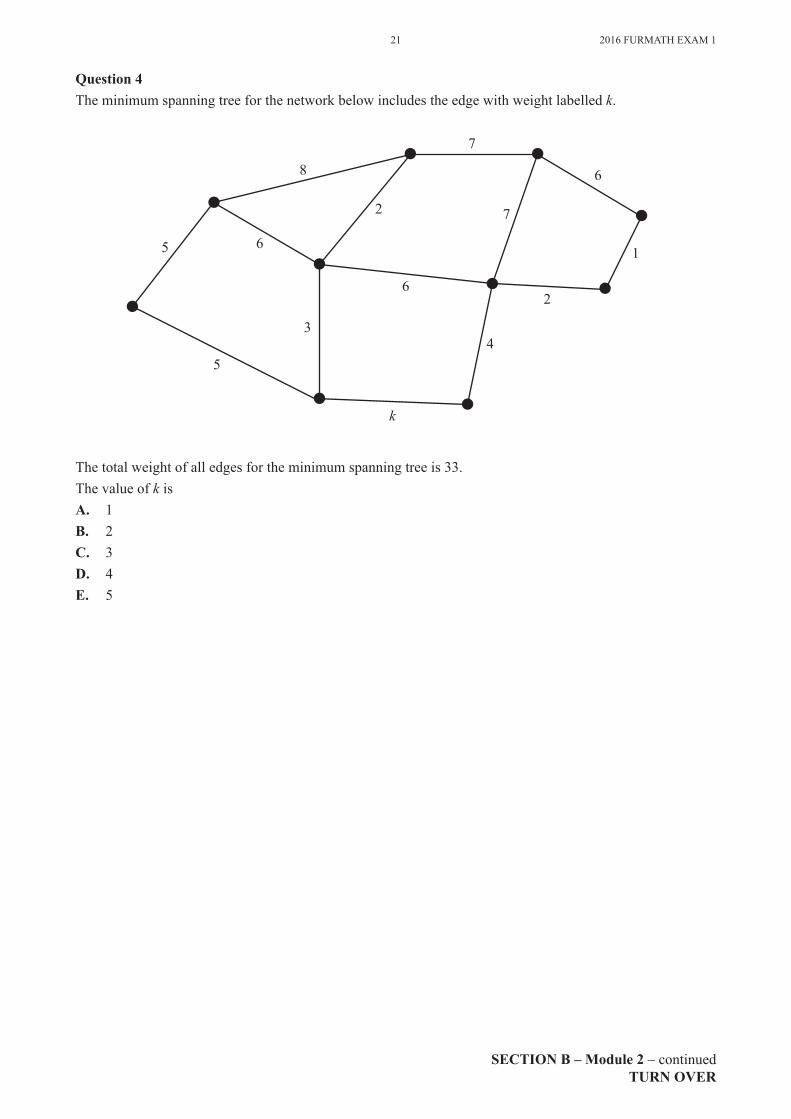
Question 4Theminimumspanningtreeforthenetworkbelowincludestheedgewithweightlabelledk.
5 6
8
7
6
1
72
62
4
k
3
5
Thetotalweightofalledgesfortheminimumspanningtreeis33.ThevalueofkisA. 1B. 2C. 3D. 4E. 5
2016FURMATHEXAM1 22
SECTION B – Module 2 – continued
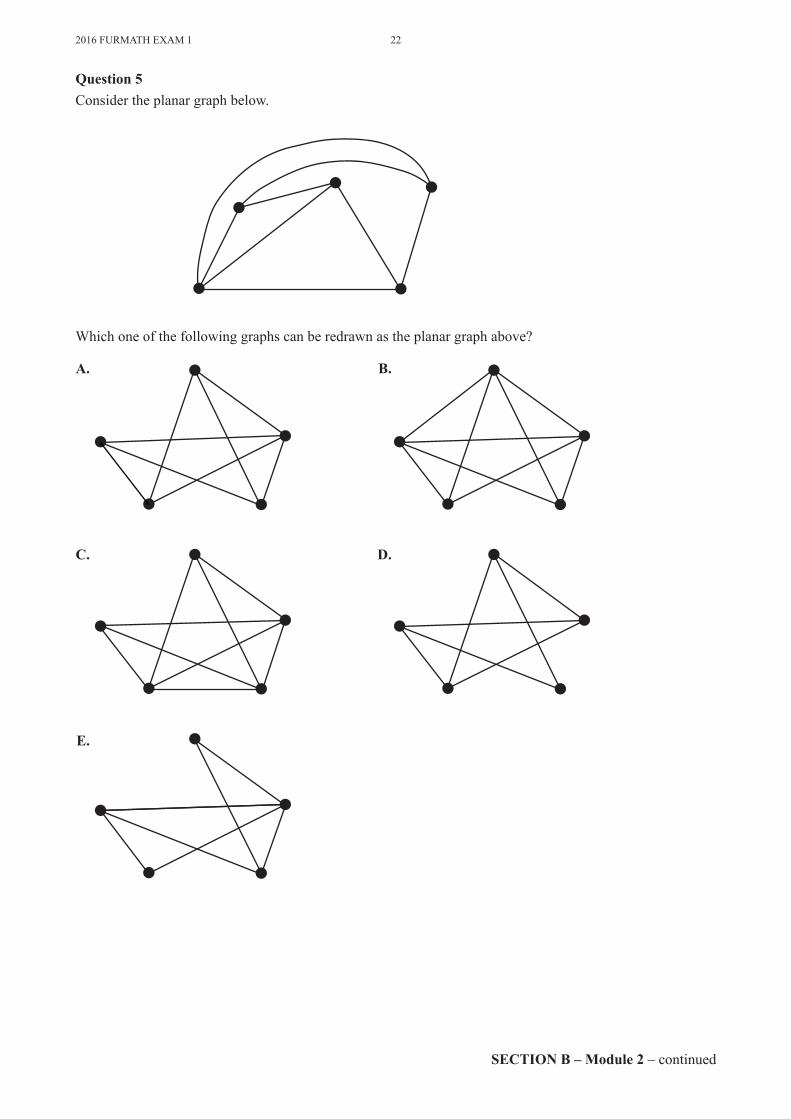
Question 5Considertheplanargraphbelow.
Whichoneofthefollowinggraphscanberedrawnastheplanargraphabove?
A. B.
C. D.
E.
23 2016FURMATHEXAM1
SECTION B – Module 2 – continuedTURN OVER
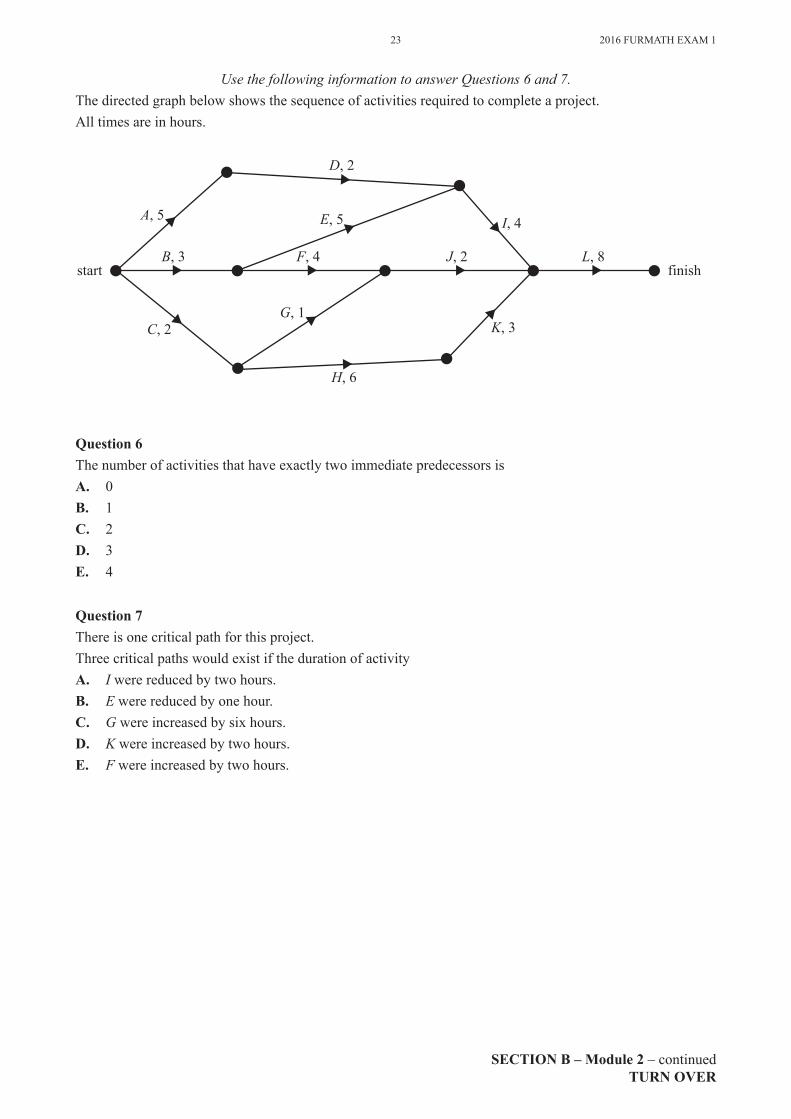
Use the following information to answer Questions 6 and 7.Thedirectedgraphbelowshowsthesequenceofactivitiesrequiredtocompleteaproject.Alltimesareinhours.
D, 2
I, 4
L, 8
K, 3
J, 2
E, 5
F, 4
G, 1
H, 6
B, 3
A, 5
C, 2
start finish
Question 6ThenumberofactivitiesthathaveexactlytwoimmediatepredecessorsisA. 0B. 1C. 2D. 3E. 4
Question 7Thereisonecriticalpathforthisproject.ThreecriticalpathswouldexistifthedurationofactivityA. Iwerereducedbytwohours.B. Ewerereducedbyonehour.C. Gwereincreasedbysixhours.D. Kwereincreasedbytwohours.E. Fwereincreasedbytwohours.
2016FURMATHEXAM1 24
End of Module 2 – SECTION B–continued
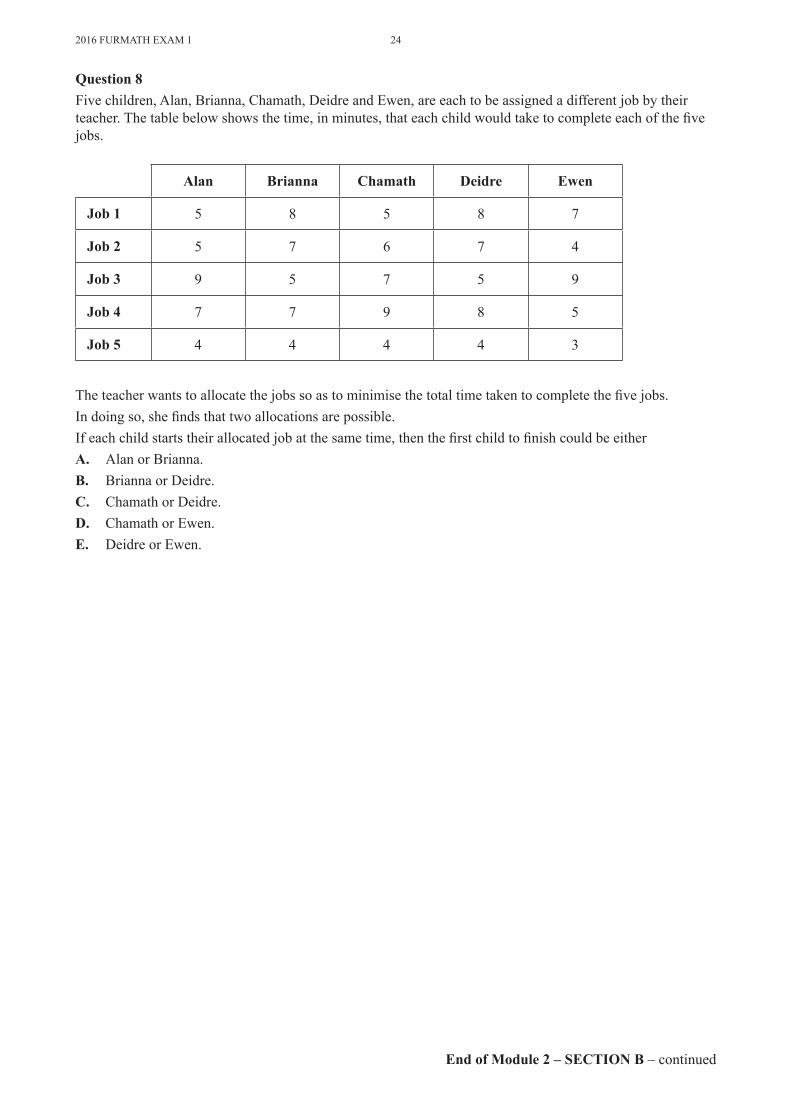
Question 8Fivechildren,Alan,Brianna,Chamath,DeidreandEwen,areeachtobeassignedadifferentjobbytheirteacher.Thetablebelowshowsthetime,inminutes,thateachchildwouldtaketocompleteeachofthefivejobs.
Alan Brianna Chamath Deidre Ewen
Job 1 5 8 5 8 7
Job 2 5 7 6 7 4
Job 3 9 5 7 5 9
Job 4 7 7 9 8 5
Job 5 4 4 4 4 3
Theteacherwantstoallocatethejobssoastominimisethetotaltimetakentocompletethefivejobs.Indoingso,shefindsthattwoallocationsarepossible.Ifeachchildstartstheirallocatedjobatthesametime,thenthefirstchildtofinishcouldbeeitherA. AlanorBrianna.B. BriannaorDeidre.C. ChamathorDeidre.D. ChamathorEwen.E. DeidreorEwen.

25 2016FURMATHEXAM1
SECTION B – Module 3 – continuedTURN OVER
Question 1Considerthediagrambelow.
10 cm
12 cm
5 cm
5 cm
Theshadedarea,insquarecentimetres,isA. 35B. 45C. 60D. 85E. 95
Question 2TriangleABCissimilartotriangleDEF.
B
CA
2.4 cm
3.6 cm
E
D F
1.8 cm
ThelengthofDF,incentimetres,isA. 0.9B. 1.2C. 1.8D. 2.7E. 3.6
Module 3 – geometry and measurement
Beforeansweringthesequestions,youmustshadethe‘Geometryandmeasurement’boxontheanswersheetformultiple-choicequestionsandwritethenameofthemoduleintheboxprovided.
2016FURMATHEXAM1 26
SECTION B – Module 3 – continued
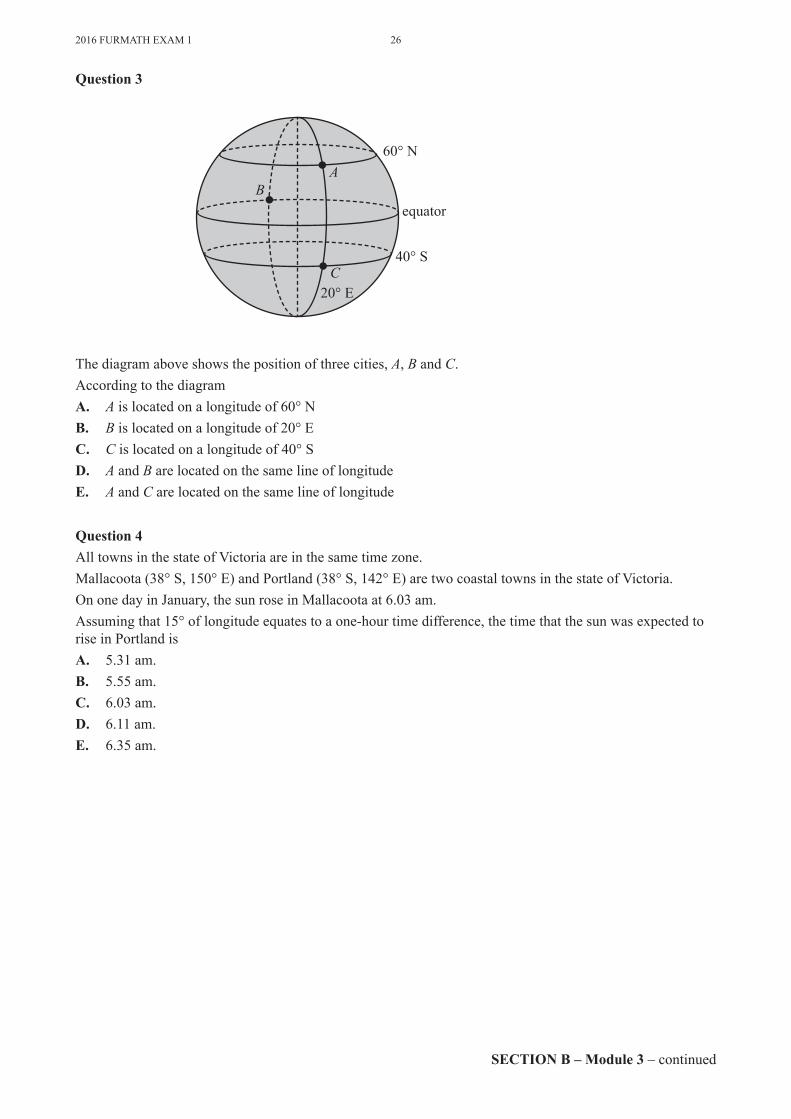
Question 3
60° N
40° S
equator
AB
C20° E
Thediagramaboveshowsthepositionofthreecities,A,BandC.AccordingtothediagramA. Aislocatedonalongitudeof60°NB. Bislocatedonalongitudeof20°EC. Cislocatedonalongitudeof40°SD. AandBarelocatedonthesamelineoflongitudeE. AandCarelocatedonthesamelineoflongitude
Question 4 AlltownsinthestateofVictoriaareinthesametimezone.Mallacoota(38°S,150°E)andPortland(38°S,142°E)aretwocoastaltownsinthestateofVictoria.OnonedayinJanuary,thesunroseinMallacootaat6.03am.Assumingthat15°oflongitudeequatestoaone-hourtimedifference,thetimethatthesunwasexpectedtoriseinPortlandisA. 5.31am.B. 5.55am.C. 6.03am.D. 6.11am.E. 6.35am.

27 2016FURMATHEXAM1
SECTION B – Module 3 – continuedTURN OVER
Question 5Awatertankintheshapeofacylinderwithahemisphericaltopisshownbelow.
2 m2 m
5 m
Thevolumeofwaterthatthistankcanhold,incubicmetres,isclosesttoA. 80B. 88C. 96D. 105E. 121
Question 6Marcusisontheoppositesideofalargelakefromahorseanditsstable.Thestableis150mdirectlyeastofthehorse.Marcusisonabearingof170°fromthehorseandonabearingof205°fromthestable.
north
horse stable
Marcus
Thestraight-linedistance,inmetres,betweenMarcusandthehorseisclosesttoA. 45B. 61C. 95D. 192E. 237
2016FURMATHEXAM1 28
End of Module 3 – SECTION B–continued
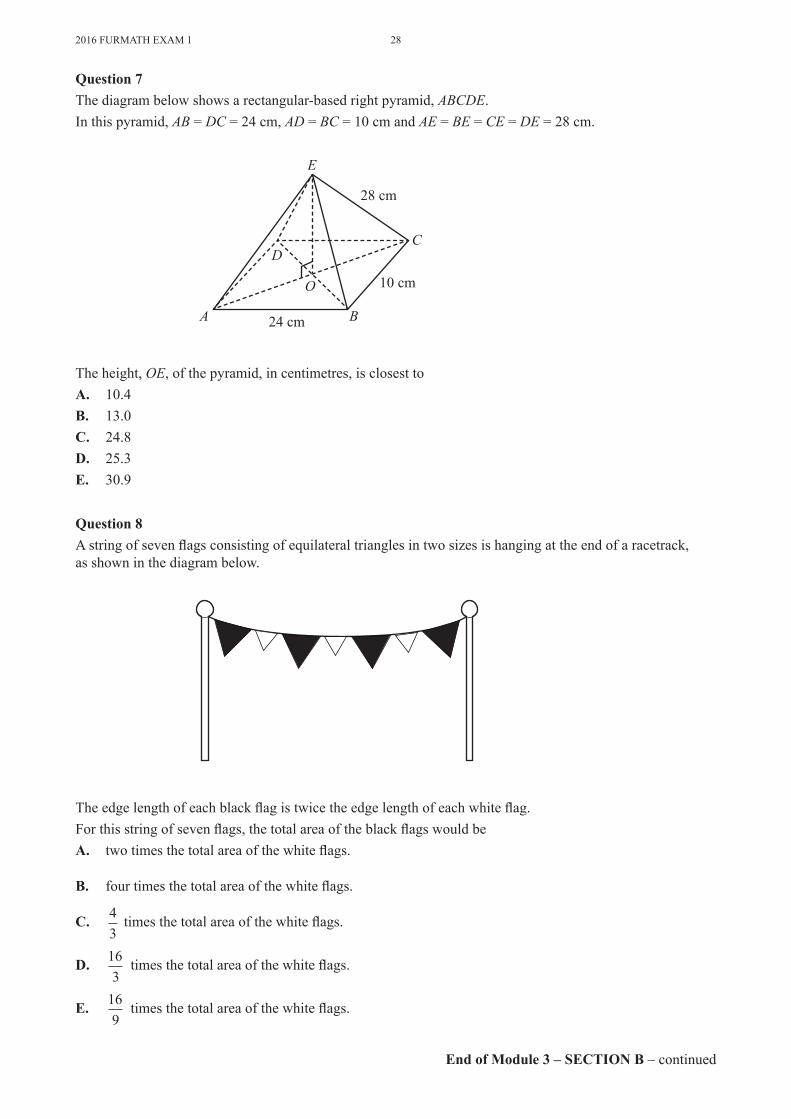
Question 7Thediagrambelowshowsarectangular-basedrightpyramid,ABCDE.Inthispyramid,AB=DC=24cm,AD=BC=10cmandAE=BE=CE=DE=28cm.
E
A B
CD
28 cm
10 cmO
24 cm
Theheight,OE,ofthepyramid,incentimetres,isclosesttoA. 10.4B. 13.0C. 24.8D. 25.3E. 30.9
Question 8Astringofsevenflagsconsistingofequilateraltrianglesintwosizesishangingattheendofaracetrack, asshowninthediagrambelow.
Theedgelengthofeachblackflagistwicetheedgelengthofeachwhiteflag.Forthisstringofsevenflags,thetotalareaoftheblackflagswouldbeA. twotimesthetotalareaofthewhiteflags.
B. fourtimesthetotalareaofthewhiteflags.
C. 43timesthetotalareaofthewhiteflags.
D. 163timesthetotalareaofthewhiteflags.
E. 169timesthetotalareaofthewhiteflags.
29 2016FURMATHEXAM1
SECTION B – Module 4 – continuedTURN OVER
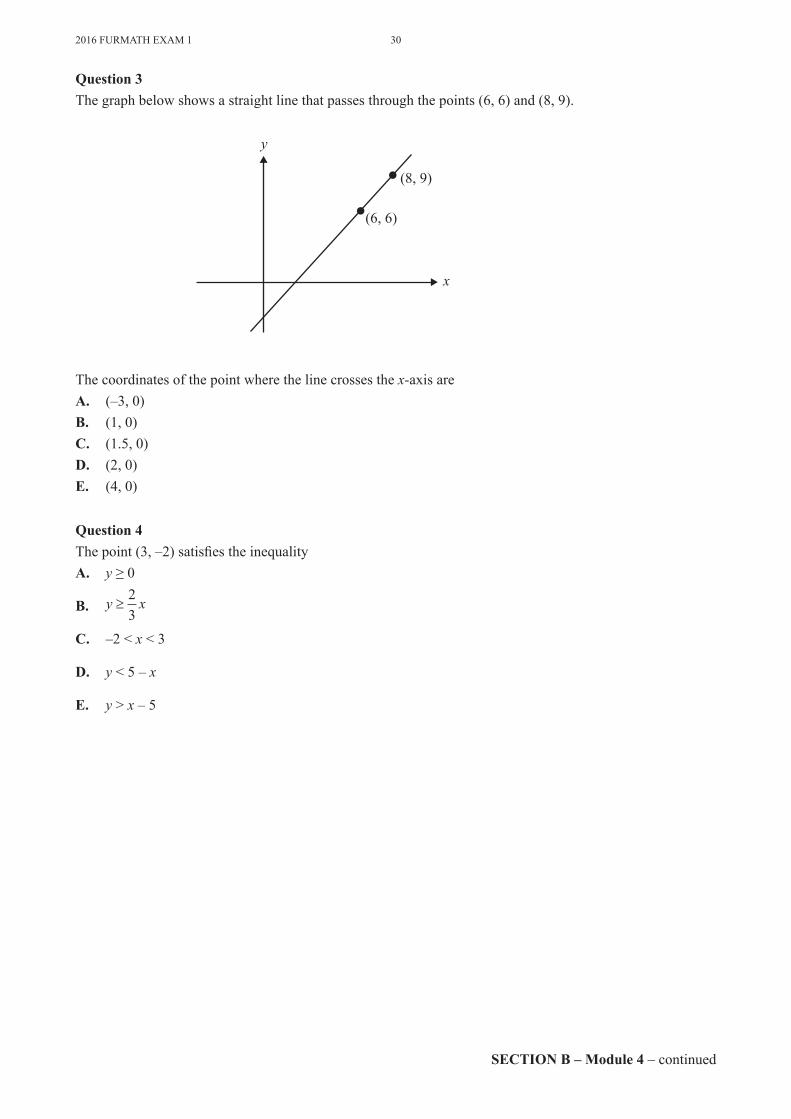
Question 1Thegraphbelowshowsthetemperature,indegreesCelsius,between6amand6pmonagivenday.
25
20
15
10
5
6 am 8 am 10 am 12 noon 2 pm 4 pm 6 pm
temperature (°C)
time
From2pmto6pm,thetemperaturedecreasedbyA. 4°CB. 11°CC. 12°CD. 15°CE. 23°C
Question 2Aphonecompanychargesafixed,monthlylinerentalfeeof$28and$0.25percall.Letnbethenumberofcallsthataremadeinamonth.LetCbethemonthlyphonebill,indollars.Theequationfortherelationshipbetweenthemonthlyphonebill,indollars,andthenumberofcallsisA. C=28+0.25nB. C=28n+0.25C. C=n+28.25D. C=28(n+0.25)E. C=0.25(n+28)
Module 4 – graphs and relations
Beforeansweringthesequestions,youmustshadethe‘Graphsandrelations’boxontheanswersheetformultiple-choicequestionsandwritethenameofthemoduleintheboxprovided.
2016FURMATHEXAM1 30
SECTION B – Module 4 – continued
Question 3Thegraphbelowshowsastraightlinethatpassesthroughthepoints(6,6)and(8,9).
(8, 9)
(6, 6)
y
x
Thecoordinatesofthepointwherethelinecrossesthex-axisareA. (–3,0)B. (1,0)C. (1.5,0)D. (2,0)E. (4,0)
Question 4Thepoint(3,–2)satisfiestheinequalityA. y≥0
B. y x≥23
C. –2 < x < 3
D. y<5–x
E. y > x–5
31 2016FURMATHEXAM1
SECTION B – Module 4 – continuedTURN OVER
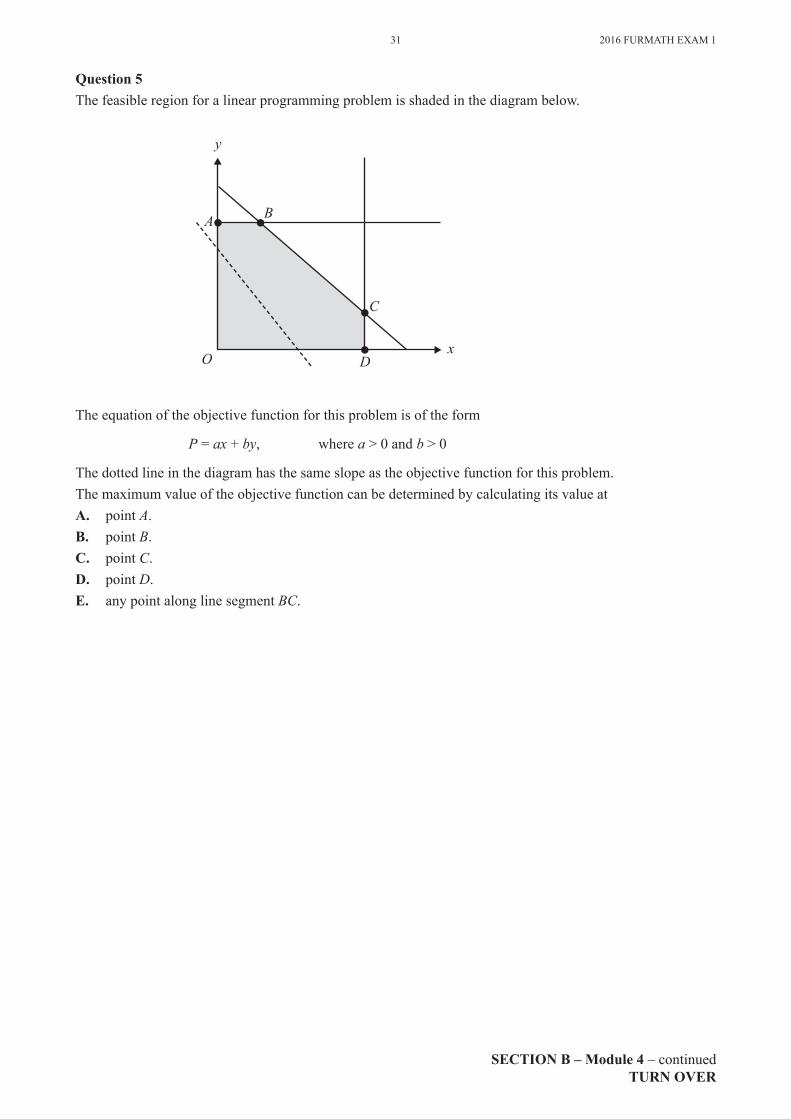
Question 5Thefeasibleregionforalinearprogrammingproblemisshadedinthediagrambelow.
y
x
A B
C
DO
Theequationoftheobjectivefunctionforthisproblemisoftheform
P=ax+by, wherea>0andb > 0
Thedottedlineinthediagramhasthesameslopeastheobjectivefunctionforthisproblem.ThemaximumvalueoftheobjectivefunctioncanbedeterminedbycalculatingitsvalueatA. pointA.B. pointB.C. pointC.D. pointD.E. anypointalonglinesegmentBC.

2016FURMATHEXAM1 32
SECTION B – Module 4 – continued
Question 6Thepoint(2,12)liesonthegraphof y=kxn,asshownbelow.
1412108642
O 0.5 1 1.5 2
(2, 12)
x
y
Anothergraphthatrepresentsthisrelationshipbetweenyandxcouldbe
1412108642
O 0.5 1 1.5 2x
y
1412108642
O 0.5 1 1.5 2x2
y
1412108642
O 0.5 1 1.5 2x2
y
1412108642
O 0.5 1 1.5 2x3
y
1412108642
O 0.5 1 1.5 2x3
y
(1, 6) (1, 6)
(1, 6)(2, 3)
(2, 3)
A. B.
C. D.
E.
33 2016FURMATHEXAM1
END OF MULTIPLE-CHOICE QUESTION BOOK
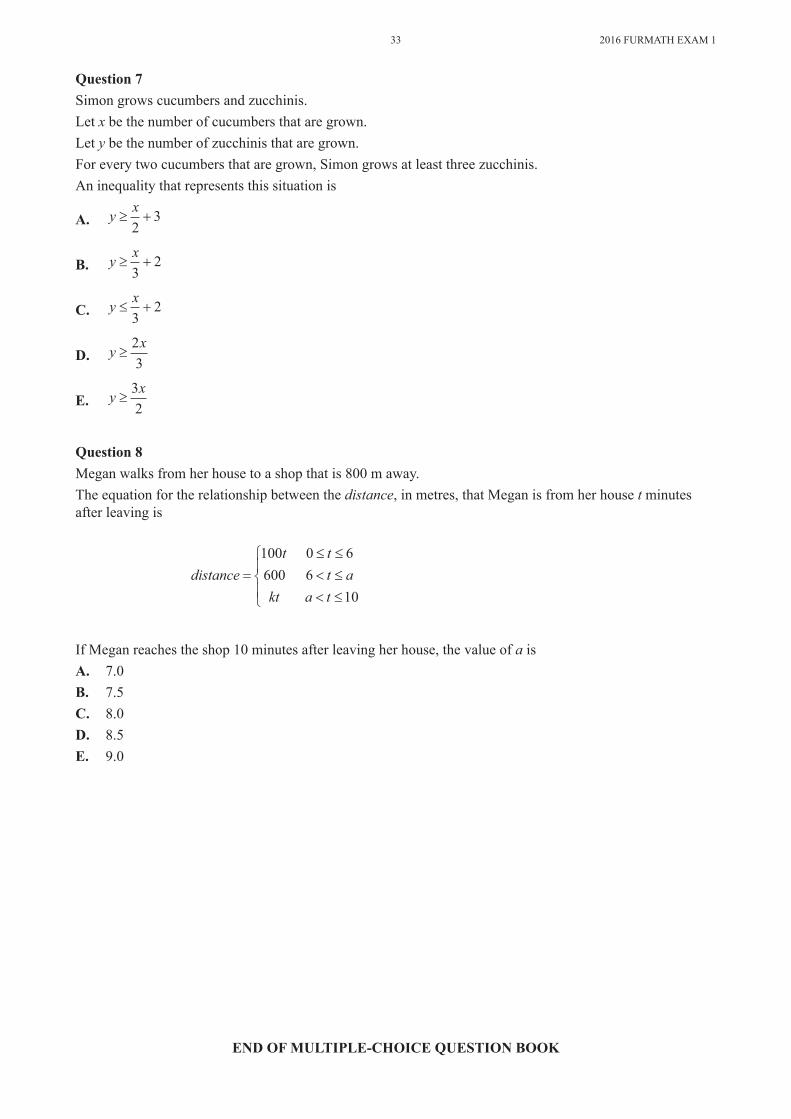
Question 7Simongrowscucumbersandzucchinis.Letxbethenumberofcucumbersthataregrown.Letybethenumberofzucchinisthataregrown.Foreverytwocucumbersthataregrown,Simongrowsatleastthreezucchinis.Aninequalitythatrepresentsthissituationis
A. y x≥ +
23
B. y x≥ +
32
C. y x≤ +
32
D. y x≥
23
E. y x≥
32
Question 8Meganwalksfromherhousetoashopthatis800maway.Theequationfortherelationshipbetweenthedistance,inmetres,thatMeganisfromherhousetminutesafterleavingis
distance =≤ ≤< ≤< ≤
100t tt a
kt a t
0 6600 6
10
IfMeganreachestheshop10minutesafterleavingherhouse,thevalueofaisA. 7.0B. 7.5C. 8.0D. 8.5E. 9.0

FURTHER MATHEMATICS
Written examination 1
FORMULA SHEET
Instructions
This formula sheet is provided for your reference.A multiple-choice question book is provided with this formula sheet.
Students are NOT permitted to bring mobile phones and/or any other unauthorised electronic devices into the examination room.
© VICTORIAN CURRICULUM AND ASSESSMENT AUTHORITY 2016
Victorian Certificate of Education 2016
FURMATH EXAM 2
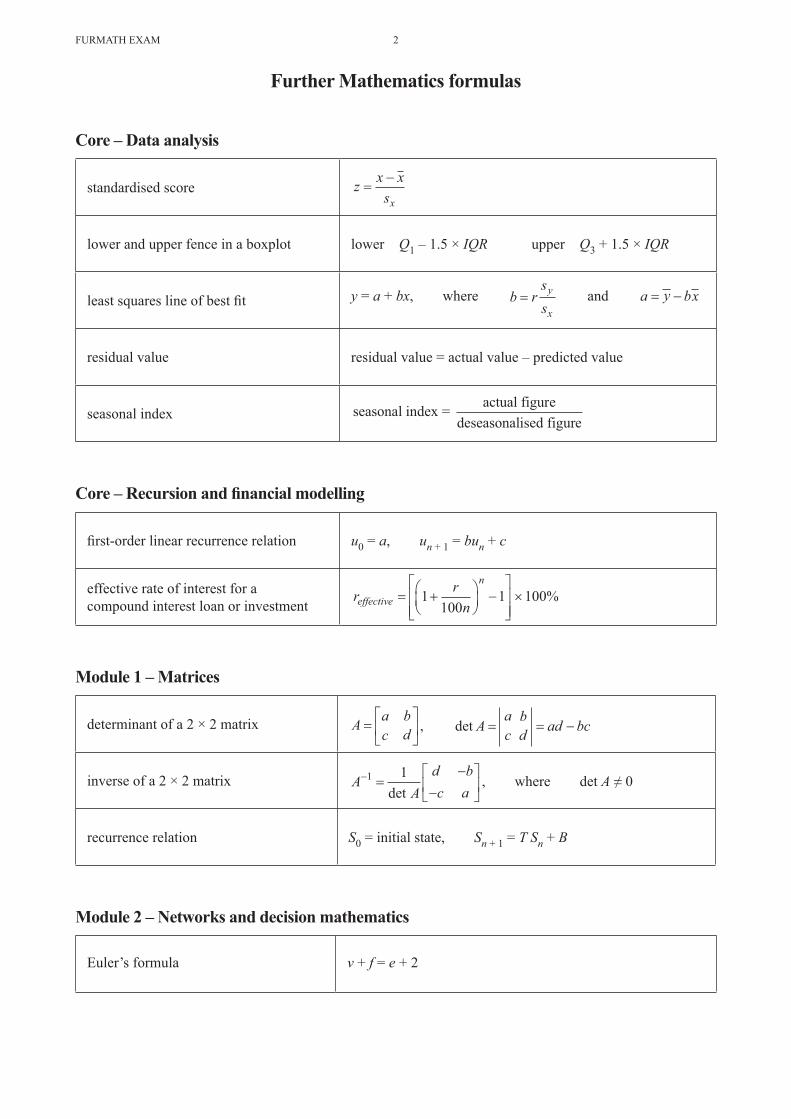
Further Mathematics formulas
Core – Data analysis
standardised score z x xsx
=−
lower and upper fence in a boxplot lower Q1 – 1.5 × IQR upper Q3 + 1.5 × IQR
least squares line of best fit y = a + bx, where b rssy
x= and a y bx= −
residual value residual value = actual value – predicted value
seasonal index seasonal index = actual figuredeseasonalised figure
Core – Recursion and financial modelling
first-order linear recurrence relation u0 = a, un + 1 = bun + c
effective rate of interest for a compound interest loan or investment
r rneffective
n= +
−
×1
1001 100%
Module 1 – Matrices
determinant of a 2 × 2 matrix A a bc d=
, det A
acbd ad bc= = −
inverse of a 2 × 2 matrix AAd bc a
− =−
−
1 1det
, where det A ≠ 0
recurrence relation S0 = initial state, Sn + 1 = T Sn + B
Module 2 – Networks and decision mathematics
Euler’s formula v + f = e + 2
3 FURMATH EXAM
END OF FORMULA SHEET
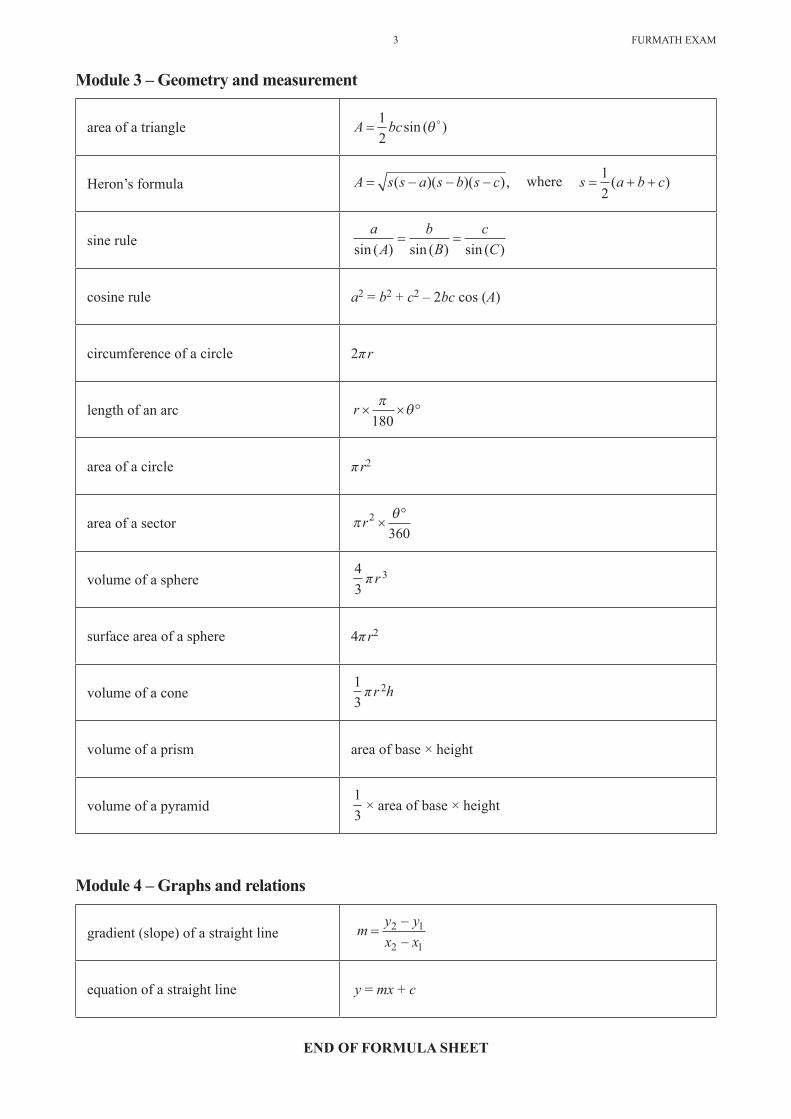
Module 3 – Geometry and measurement
area of a triangle A bc=12
sin ( )θ
Heron’s formula A s s a s b s c= − − −( )( )( ), where s a b c= + +12
( )
sine ruleaA
bB
cCsin ( ) sin ( ) sin ( )
= =
cosine rule a2 = b2 + c2 – 2bc cos (A)
circumference of a circle 2π r
length of an arc r × × °π
θ180
area of a circle π r2
area of a sector πθr2
360×
°
volume of a sphere43π r 3
surface area of a sphere 4π r2
volume of a cone13π r 2h
volume of a prism area of base × height
volume of a pyramid13
× area of base × height
Module 4 – Graphs and relations
gradient (slope) of a straight line m y y
x x=
−−
2 1
2 1
equation of a straight line y = mx + c